
Determining the Optimal Sample Size for Assessing Crown Damage on Color Infrared (CIR) Aerial Photographs


Abstract
1. Introduction
2. Materials and Methods
| Damage degree | Damage percentage |
| 0 | 0–10% |
| 1 | 11–25% |
| 2.1 (2A) | 26–40% |
| 2.2 (2B) | 41–60% |
| 3.1 (3A) | 61–80% |
| 3.2 (3B) | 81–100% |
| 4 | Snags |
- Block forming: digital aerial photographs were uploaded into the project; the direction of the block was determined and so was the position of aerial photographs in the block.
- Aerial triangulation: camera parameters were defined, and the internal orientation of aerial photographs was conducted.
- Block adjustment: external orientation of aerial photographs.
- Block processing: the last step in the project design in which a module was selected for further use in photointerpretation.
- Damage (D) is an indicator that is calculated according to the formula:
- 2.
- Mean Damage (MD) is calculated according to the formula:
- 3.
- Damage index (DI) provides the percentage share of trees in the sample, which is classified as damage degree 2.1 (2A) or higher, i.e., severely damaged trees.
- 4.
- Mean Damage1 (MD1) is the value of the mean degree of damage of trees classified into damage level 2.1 (2A) or more.
3. Results
4. Discussion
5. Conclusions
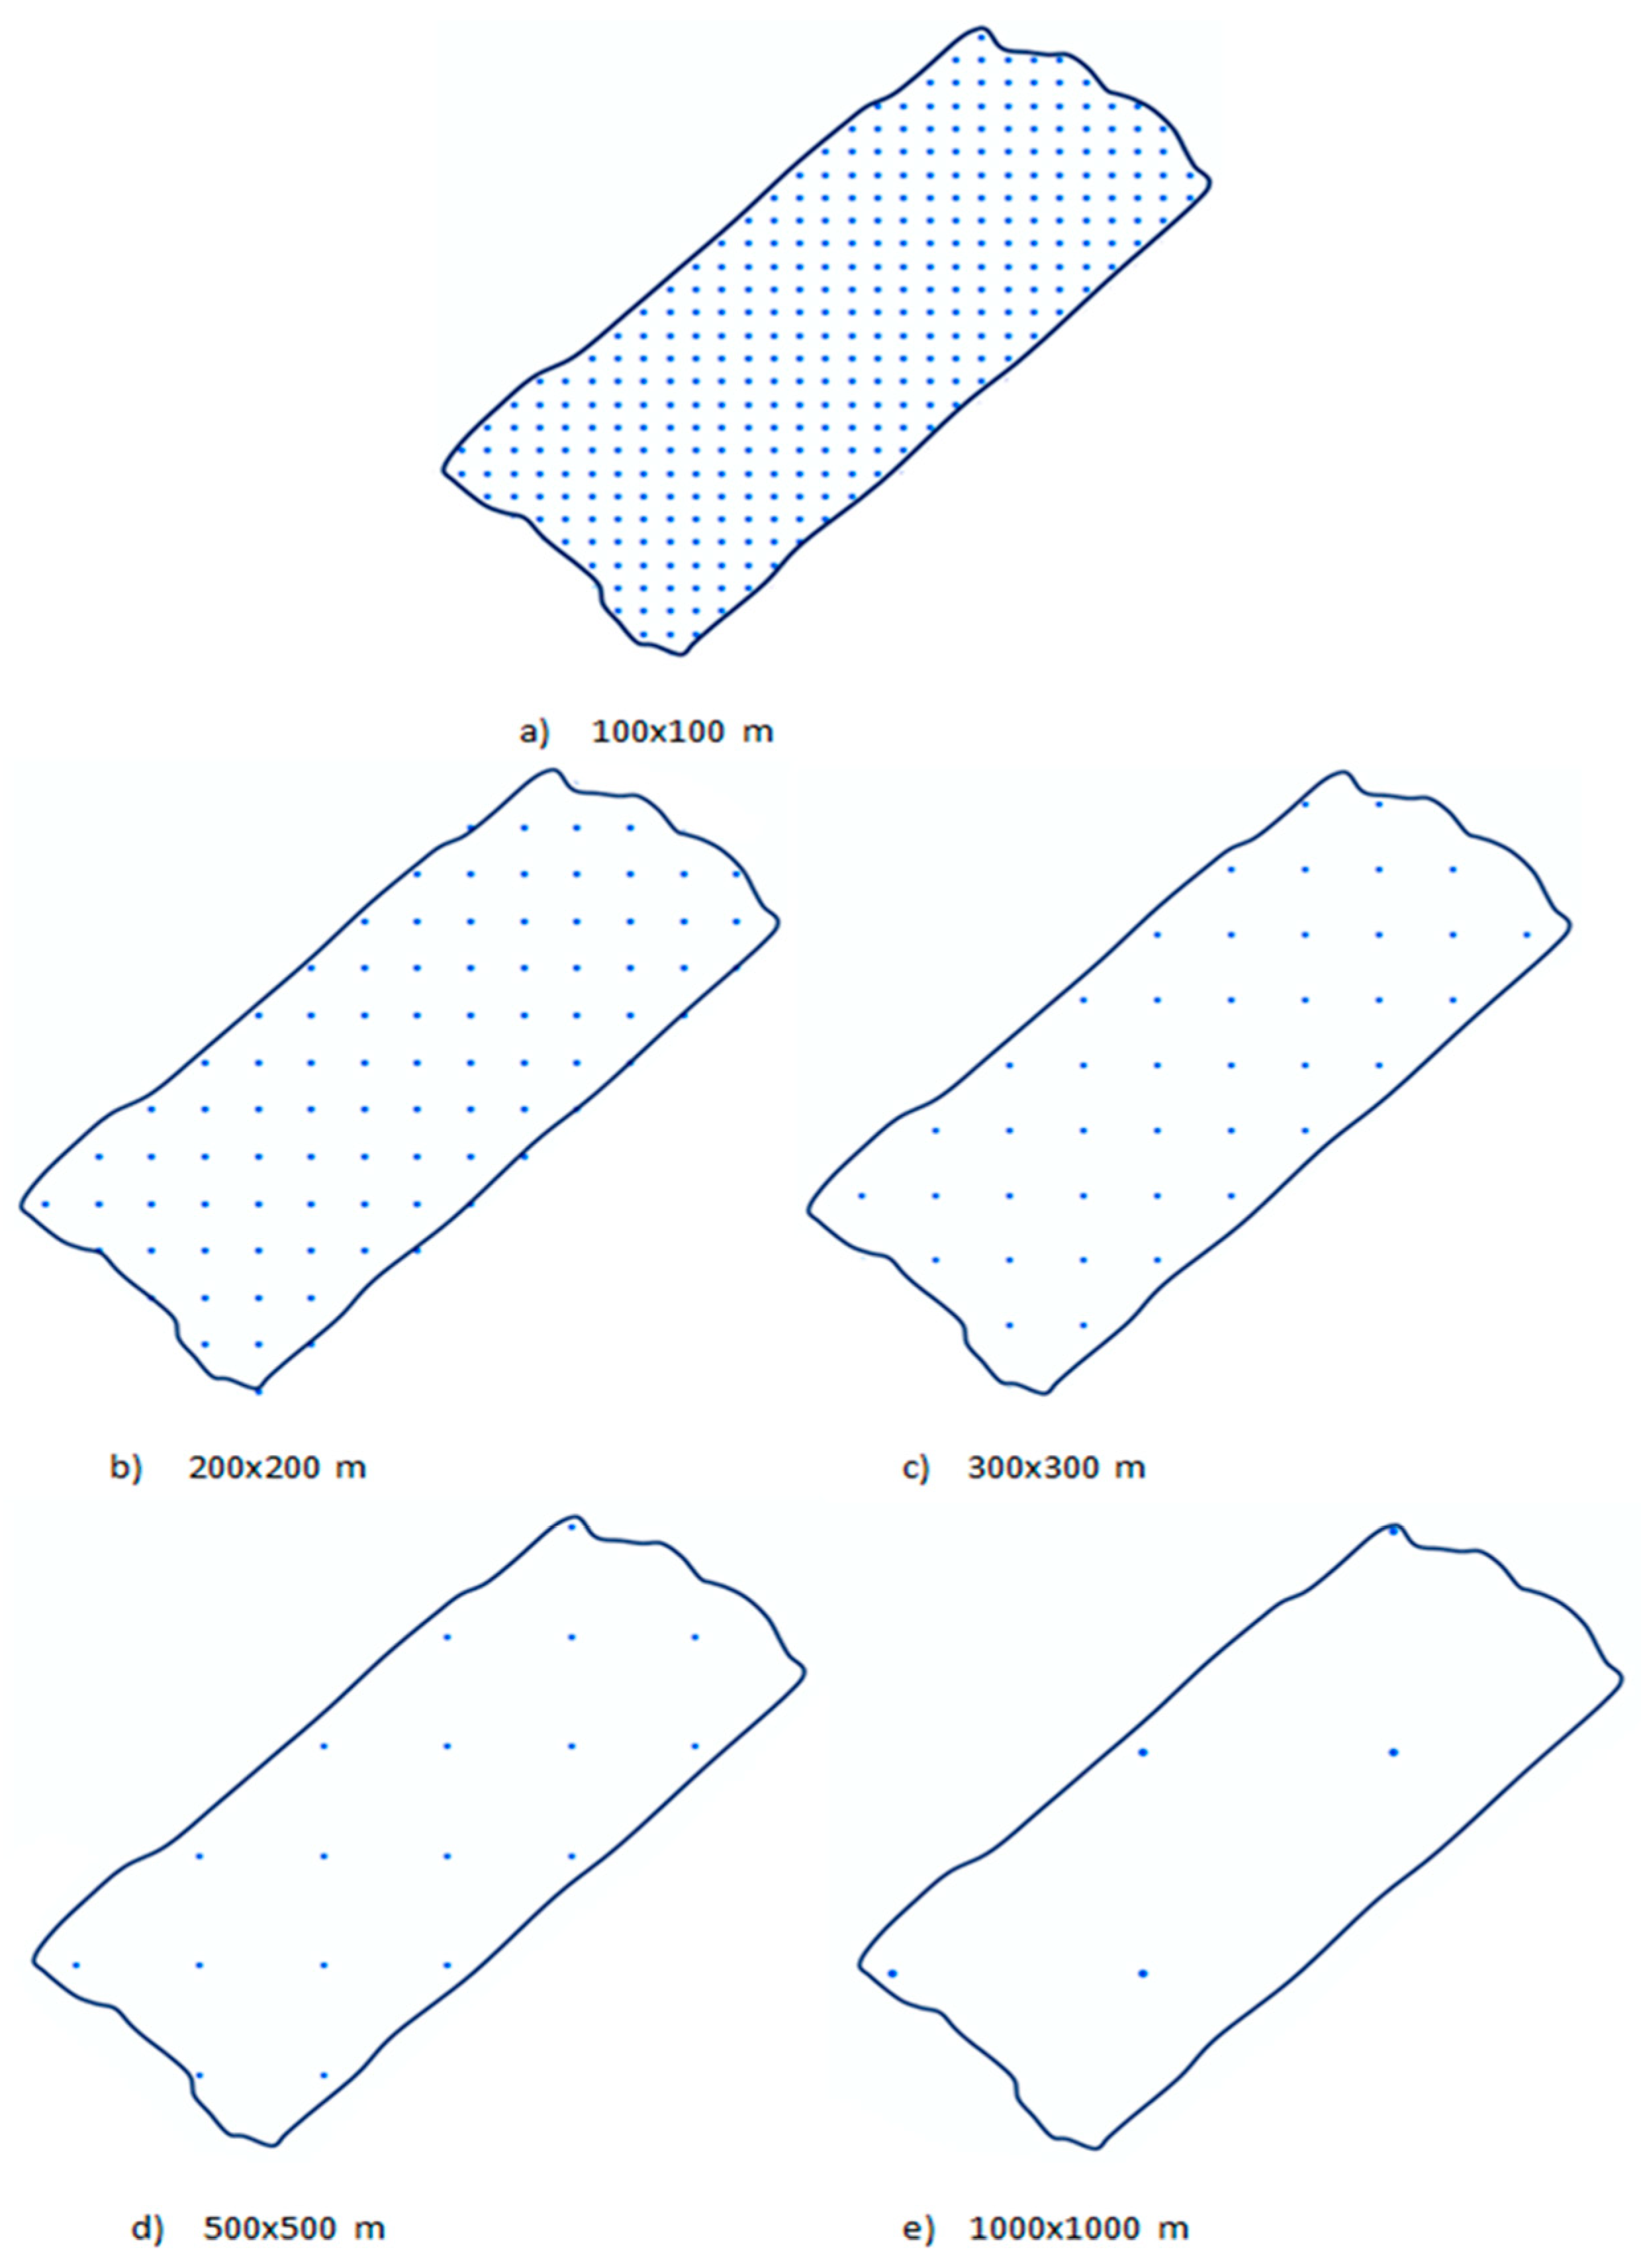
- Interpretation of different sample point densities and numbers of interpreted trees per sample showed that the optimal systematic sample size is 100 × 100 m with one interpreted tree per point, and samples with larger numbers of trees in smaller numbers of points should be avoided.
- The research contributes to the development and application of the most favorable interpretation method to be used in practice. This ensures statistically sufficient reliability of tree health status assessment on CIR aerial photographs, combined with optimal sample size and number of interpreted trees.
- The existing methods for health status assessment are thus improved and new possibilities for applying digital CIR aerial photographs to enable sustainable management of forests under conditions of climate change.
Author Contributions
Funding
Institutional Review Board Statement
Informed Consent Statement
Data Availability Statement
Conflicts of Interest
References
- Harapin, M.; Androić, M. Sušenje i zaštita šuma hrasta lužnjaka. In Hrast Lužnjak u Hrvatskoj; Klepac, D., Ed.; HAZU Centar za Znanstveni rad Vinkovci i Hrvatske šume: Zagreb, Croatia, 1996; pp. 227–256. ISBN 953-154-079-9. [Google Scholar]
- Prpić, B. Propadanje šuma hrasta lužnjaka. In Hrast Lužnjak u Hrvatskoj; Klepac, D., Ed.; HAZU Centar za Znanstveni rad Vinkovci i Hrvatske šume: Zagreb, Croatia, 1996; pp. 273–298. ISBN 953-154-079-9. [Google Scholar]
- Wargo, P.M. Consequences of environmental stress on oak: Predisposition to pathogens. Ann. For. Sci. 1996, 53, 359–368. [Google Scholar] [CrossRef]
- Donaubauer, E. Die Bedeutung von Krankheitserregern beim gegenwärtigen Eichensterben in Europa—Eine Literaturübersicht. Eur. J. For. Pathol. 1998, 28, 91–98. [Google Scholar] [CrossRef]
- Führer, E. Oak decline in Central Europe: A synopsis of hypotheses. USDA For. Serv. Gen. Tech. Rep. NE 1998, 247, 7–24. [Google Scholar]
- Thomas, F.M.; Blank, R.; Hartmann, G. Abiotic and biotic factors and their interactions as causes of oak decline in Central Europe. For. Path. 2002, 32, 277–307. [Google Scholar] [CrossRef]
- Guerra-Hernández, J.; Díaz-Varela, R.A.; Ávarez-González, J.G.; Rodríguez-González, P.M. Assessing a novel modelling approach with high resolution UAV imagery for monitoring health status in priority riparian forests. For. Ecosyst. 2021, 8, 61. [Google Scholar] [CrossRef]
- Auclair, A.N.D.; Worrest, R.C.; Lachance, D.; Martin, H.C. Climatic perturbation as a general mechanism of forest dieback. In Forest Decline Concepts; Manion, P.D., Lachance, D., Eds.; Amer Phytopathological Society: St. Paul, MN, USA, 1992; pp. 38–58. [Google Scholar]
- De Vries, W.; Klap, J.; Erisman, J.W. Effects of environmental stress on forest crown condition in Europe. Part I: Hypotheses and approach to the study. Water Air Soil Pollut. 2000, 119, 317–333. [Google Scholar] [CrossRef]
- Ozolinčius, R. Lithuanian Forest Condition and Its Influencing Factors; Lutute Publishing: Kaunas, Lithuania, 1999; p. 90. [Google Scholar]
- Dubravac, T.; Dekanić, S.; Roth, V. Dinamika oštećenosti i struktura krošanja stabala hrasta lužnjaka u šumskim zajednicama na gredi i u nizi—Rezultati motrenja na trajnim pokusnim plohama. Šumarski List 2011, 13, 74–89. [Google Scholar]
- Cardil, A.; Vepakomma, U.; Brotons, L. Assessing pine processionary moth defoliation using unmanned aerial systems. Forests 2017, 8, 402. [Google Scholar] [CrossRef]
- Cardil, A.; Otsu, K.; Pla, M.; Silva, C.A.; Brotons, L. Quantifying pine processionary moth defoliation in a pine-oak mixed forest using unmanned aerial systems and multispectral imagery. PLoS ONE 2019, 14, e0213027. [Google Scholar] [CrossRef]
- Navarro-Cerrillo, R.M.; Varo-Martínez, M.Á.; Acosta, C.; Rodriguez, G.P.; Sanchez-Cuesta, R.; Gomez, F.J.R. Integration of WorldView-2 and airborne laser scanning data to classify defoliation levels in Quercus ilex L. Dehesas affected by root rot mortality: Management implications. For. Ecol. Manag. 2019, 451, 117564. [Google Scholar] [CrossRef]
- Kalafadžić, Z.; Kušan, V. Definiranje stupnja oštećenosti šumskog drveća i sastojina. Šumarski List 1990, 114, 517–526. [Google Scholar]
- Pádua, L.; Hruška, J.; Bessa, J.; Adao, T.; Martins, L.M.; Goncalves, J.A.; Peres, E.; Sousa, A.M.R.; Castro, J.P.; Sousa, J.J. Multi-temporal analysis of forestry and coastal environments using UASs. Remote Sens. 2017, 10, 24. [Google Scholar] [CrossRef]
- Kalafadžić, Z.; Kušan, V. Opadanje prirasta jele (Abies alba L.) kao posljedica novonastalih oštećenja šuma u Gorskom kotaru. Šumarski List 1989, 113, 415–422. [Google Scholar]
- Pernar, R. Način i pouzdanost određivanja oštećenosti hrasta lužnjaka (Quercus robur L.) na infracrvenim kolornim (ICK) aerosnimkama. Glas. Za Šumske Pokuse 1994, 31, 1–34. [Google Scholar]
- Kalafadžić, Z. Današnje mogućnosti primjene fotointerpretacije u zaštiti šuma. Šumarski List 1973, 97, 149–165 str. [Google Scholar]
- Donassy, V.; Oluić, M.; Tomašegović, Z. Daljinska Istraživanja u Geoznanostma; JAZU: Zagreb, Croatia, 1983; pp. 281–329. [Google Scholar]
- Huss, J.; Akca, A.; Hildebrandt, G.; Kenneweg, H.; Peerenboom, H.G.; Rhody, B. Luftbildmessung und Fernerkundung in der Forstwirtschaft; Herbert Weichmann Verlag GmbH: Karlsruhe, Germany, 1984; p. 396. [Google Scholar]
- Harris, J.G. A new approach to surface reconstruction: The coupled depth/slope model. In Proceedings of the First International Conference on Computer Vision, London, UK, 8–11 June 1987; pp. 277–283. [Google Scholar]
- Hildebrandt, G.; Gross, K.P. Inventarizacija i opažanje sadašnjih oštećenosti šuma u SR Njemačkoj. Šumarski List 1989, 113, 279–298. [Google Scholar]
- Leckie, D.G.; Teillet, P.M.; Fedosejevs, G.; Ostaff, D.P. Reflectance characteristics of cumulative defoliation of balsam fir. Can. J. For. Res. 1988, 18, 1008–1016. [Google Scholar] [CrossRef]
- Atzberger, C.; Werner, W. Needle reflectance of healthy and diseased spruce stands. In 1st EARSeL Workshop on Imaging Spectroscopy; Schaepman, M., Schlapfer, D., Itten, K.I., Eds.; Remote Sensing Laboratories, University of Zurich (Switzerland), Impression Dumas: Saint-Etienne, France, 1998; pp. 271–283. [Google Scholar]
- Daniulis, J. Aerial Photography; Enciklopedija: Vilnius, Lithuania, 1998; p. 248. [Google Scholar]
- Entcheva Campbell, P.K.; Rock, B.N.; Martin, M.E.; Neefus, C.D.; Irons, J.R.; Middleton, E.M.; Albrechtova, J. Detection of initial damage in Norway spruce canopies using hyperspectral airborne data. Int. J. Remote Sens. 2004, 25, 5557–5583. [Google Scholar] [CrossRef]
- Barry, K.M.; Stone, C.; Mohammed, C.L. Crown-scale evaluation of spectral indices for defoliated and discoloured eucalypts. Int. J. Remote Sens. 2008, 29, 47–69. [Google Scholar] [CrossRef]
- Näsi, R.; Honkavaara, E.; Lyytikäinen-Saarenmaa, P.; Blomqvist, M.; Litkey, P.; Hakala, T.; Viljanen, N.; Kantola, T.; Tanhuanpaa, T.; Holopainen, M. Using UAV-based photogrammetry and hyperspectral imaging for mapping bark beetle damage at tree-level. Remote Sens. 2015, 7, 15467–15493. [Google Scholar] [CrossRef]
- Näsi, R.; Honkavaara, E.; Blomqvist, M.; Lyytikainen-Saarenmaa, P.; Hakala, T.; Viljanen, N.; Kantola, T.; Holopainen, M. Remote sensing of bark beetle damage in urban forests at individual tree level using a novel hyperspectral camera from UAV and aircraft. Urban For. Urban Green. 2018, 30, 72–83. [Google Scholar] [CrossRef]
- Díaz-Varela, R.A.; de la Rosa, R.; León, L.; Zarco-Tejada, P.J. High-resolution airborne UAV imagery to assess olive tree crown parameters using 3D photo reconstruction: Application in breeding trials. Remote Sens. 2015, 7, 4213–4232. [Google Scholar] [CrossRef]
- Guerra-Hernández, J.; González-Ferreiro, E.; Monleón, V.; Faias, S.P.; Tome, M.; Diaz-Varela, R.A. Use of multi-temporal UAV-derived imagery for estimating individual tree growth in Pinus pinea stands. Forests 2017, 8, 300. [Google Scholar] [CrossRef]
- Laliberte, A.S.; Herrick, J.E.; Rango, A.; Winters, C. Acquisition, orthorectification, and object-based classification of unmanned aerial vehicle (UAV) imagery for rangeland monitoring. Photogramm Eng. Remote Sens. 2010, 76, 661–672. [Google Scholar] [CrossRef]
- Ahmed, O.S.; Shemrock, A.; Chabot, D.; Dillon, C.; Williams, G.; Wasson, R.; Franklin, S.E. Hierarchical land cover and vegetation classification using multispectral data acquired from an unmanned aerial vehicle. Int. J. Remote Sens. 2017, 38, 2037–2052. [Google Scholar] [CrossRef]
- Kalafadžić, Z.; Kušan, V. Ustanovljavanje stanja šuma na velikim površinama primjenom ICK aerosnimki. Glas. Za Šumske Pokuse 1990, 26, 447–459. [Google Scholar]
- Kolić, J.; Pernar, R.; Seletković, A.; Ančić, M. The Importance of CIR Aerial Imagery in Inventory, Monitoring and Predicting Forest Condition. South-East Eur. For. 2015, 6, 191–200. [Google Scholar] [CrossRef][Green Version]
- Lehmann, J.R.K.; Nieberding, F.; Prinz, T.; Knoth, C. Analysis of unmanned aerial system-based CIR images in forestry–a new perspective to monitor pest infestation levels. Forests 2015, 6, 594–612. [Google Scholar] [CrossRef]
- Lisein, J.; Michez, A.; Claessens, H.; Lejeune, P. Discrimination of deciduous tree species from time series of unmanned aerial system imagery. PLoS ONE 2015, 10, e0141006. [Google Scholar] [CrossRef]
- Dash, J.P.; Watt, M.S.; Pearse, G.D.; Heaphy, M.; Dungey, H.S. Assessing very high resolution UAV imagery for monitoring forest health during a simulated disease outbreak. ISPRS J. Photogramm. Remote Sens. 2017, 131, 1–14. [Google Scholar] [CrossRef]
- Nevalainen, O.; Honkavaara, E.; Tuominen, S.; Viljanen, N.; Hakala, T.; Yu, X.W.; Hyyppa, J.; Saari, H.; Polonen, I.; Imai, N.N.; et al. Individual tree detection and classification with UAV-based photogrammetric point clouds and hyperspectral imaging. Remote Sens. 2017, 9, 185. [Google Scholar] [CrossRef]
- Senf, C.; Seidl, R.; Hostert, P. Remote sensing of forest insect disturbances: Current state and future directions. Int. J. Appl. Earth Obs. Geoinf. 2017, 60, 49–60. [Google Scholar] [CrossRef] [PubMed]
- Safonova, A.; Tabik, S.; Alcaraz-Segura, D.; Rubtsov, A.; Maglinets, Y.; Herrera, F. Detection of fir trees (Abies sibirica) damaged by the bark beetle in unmanned aerial vehicle images with deep learning. Remote Sens. 2019, 11, 643. [Google Scholar] [CrossRef]
- Kalafadžić, Z.; Kušan, V. Visoka tehnologija u inventuri šuma. Šumarski List 1991, 115, 509–520. [Google Scholar]
- Pernar, R.; Ančić, M.; Seletković, A.; Kolić, J. Važnost daljinskih istraživanja pri procjeni šteta na šumskim sastojinama uzrokovanih velikim prirodnim nepogodama. In Proceedings of the Gospodarenje Šumama u Uvjetima Klimatskih Promjena i Prirodnih Nepogoda, Zagreb, Croatia, 20 April 2018; Anić, Igor; HAZU: Zagreb, Croatia, 2020; pp. 143–160. [Google Scholar] [CrossRef]
- Fraser, B.T.; Congalton, R.G. Monitoring Fine-Scale Forest Health Using Unmanned Aerial Systems (UAS) Multispectral Models. Remote Sens. 2021, 13, 4873. [Google Scholar] [CrossRef]
- Kolić, J.; Pernar, R.; Seletković, A.; Samaržija, M.; Ančić, M. Comparison of crown damage assessment on analog and digital infrared color (CIR) aerial photographs. Šumarski List 2022, 5–6, 187–199. [Google Scholar] [CrossRef]
- Gregorie, T.G.; Valentine, H.T. Sampling Strategies for Natural Resorces and the Envioronment; Chapman and Hall/CRC: Boca Raton, FL, USA, 2008; p. 474. [Google Scholar]
- Spurr, S.H. Forest Inventory; Roland Press Co.: New York, NY, USA, 1952; p. 476. [Google Scholar]
- Vedriš, M. Utjecaj Različitih Metoda Uzorkovanja na Izmjeru i Procjenu Strukturnih Elemenata Bukovo-Jelovih Sastojina; Faculty of forestry, University of Zagreb: Zagreb, Croatia, 2010. [Google Scholar]
- Kalafadžić, Z.; Kušan, V.; Horvatić, Z.; Fintić, R.; Hrašovec, B. Određivanje Stupnja Oštećenosti Šuma Bukve i Jele Zajednice Općina Rijeka; Faculty of Forestry, Study: Zagreb, Croatia, 1989. [Google Scholar]
- Pernar, R.; Seletković, A.; Ančić, M.; Vedriš, M.; Teslak, K. Assessing the health status of beech-fir forests using remote sensing methods. Period. Biol. 2008, 110, 157–161. [Google Scholar]
- Pranjić, A.; Lukić, N. Izmjera Šuma, 1st ed.; Faculty of Forestry: Zagreb, Croatia, 1997; pp. 1–405. [Google Scholar]
- Pranjić, A. Šumarska Biometrika, 1st ed.; Faculty of Forestry: Zagreb, Croatia, 1986; pp. 1–205. [Google Scholar]


| Sample Density | Degree of Damage | Number of Trees | Sample Density | Degree of Damage | Number of Trees | ||||
|---|---|---|---|---|---|---|---|---|---|
| ABCD (4) | AD (2) | A (1) | ABCD (4) | AD (2) | A (1) | ||||
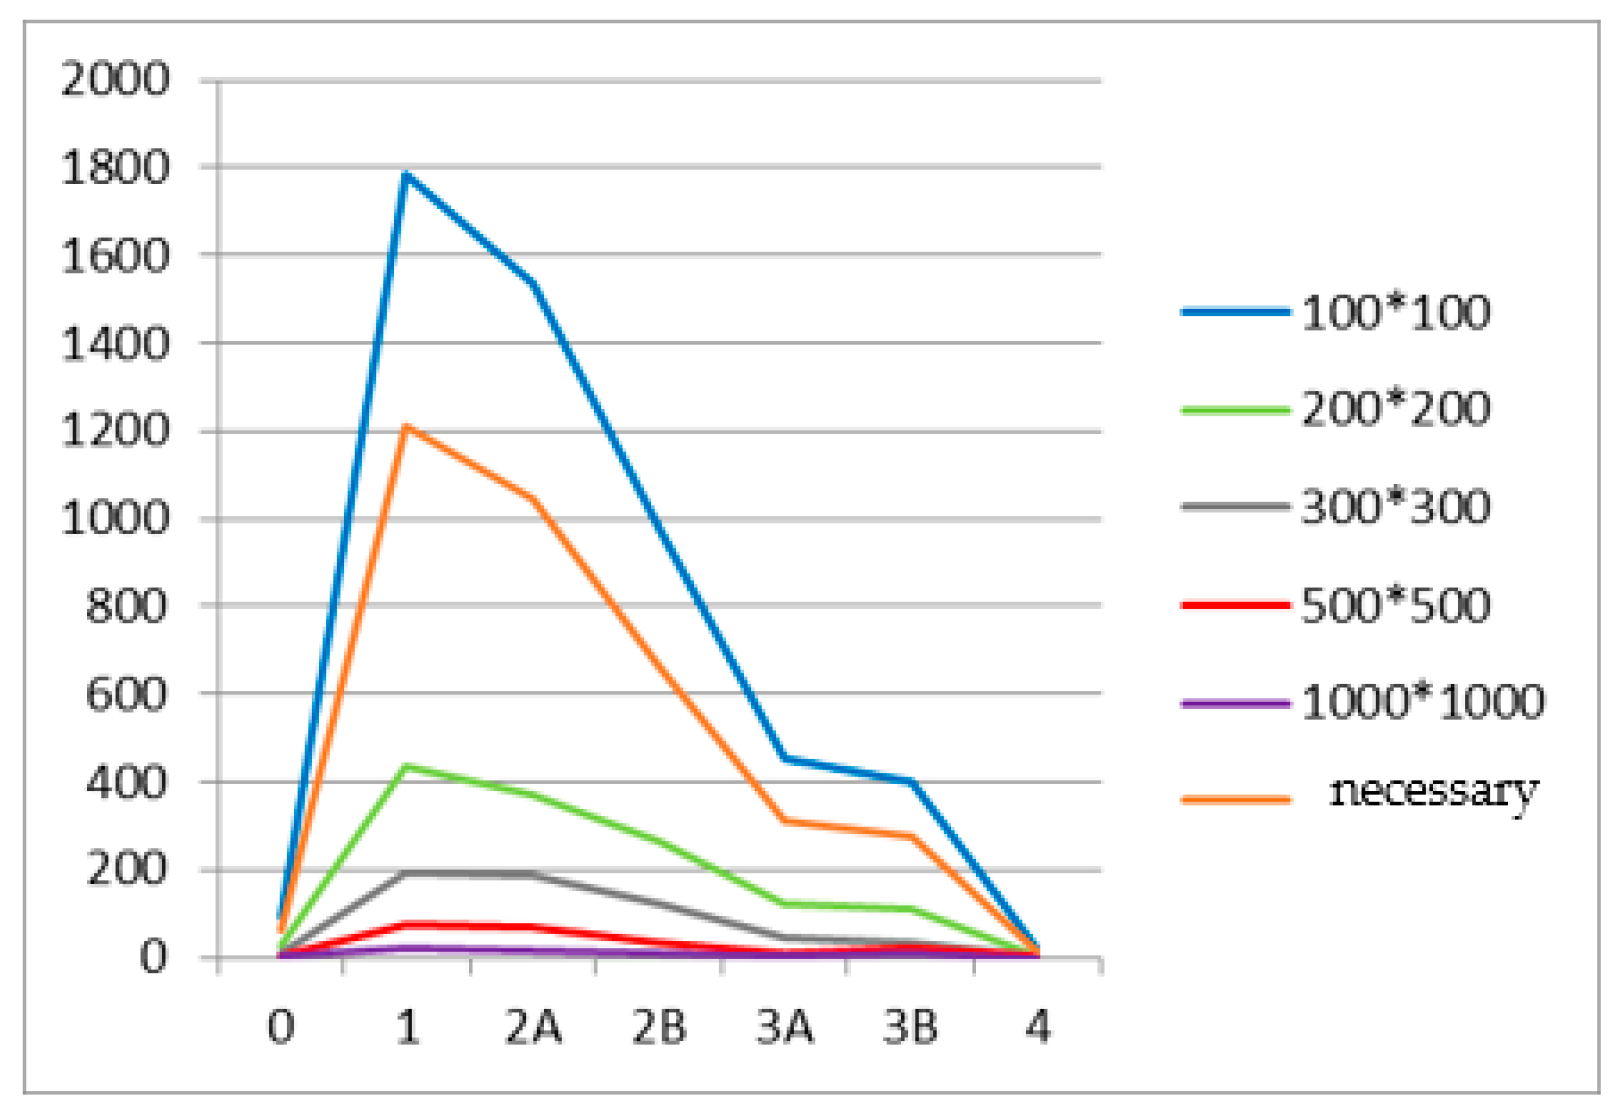
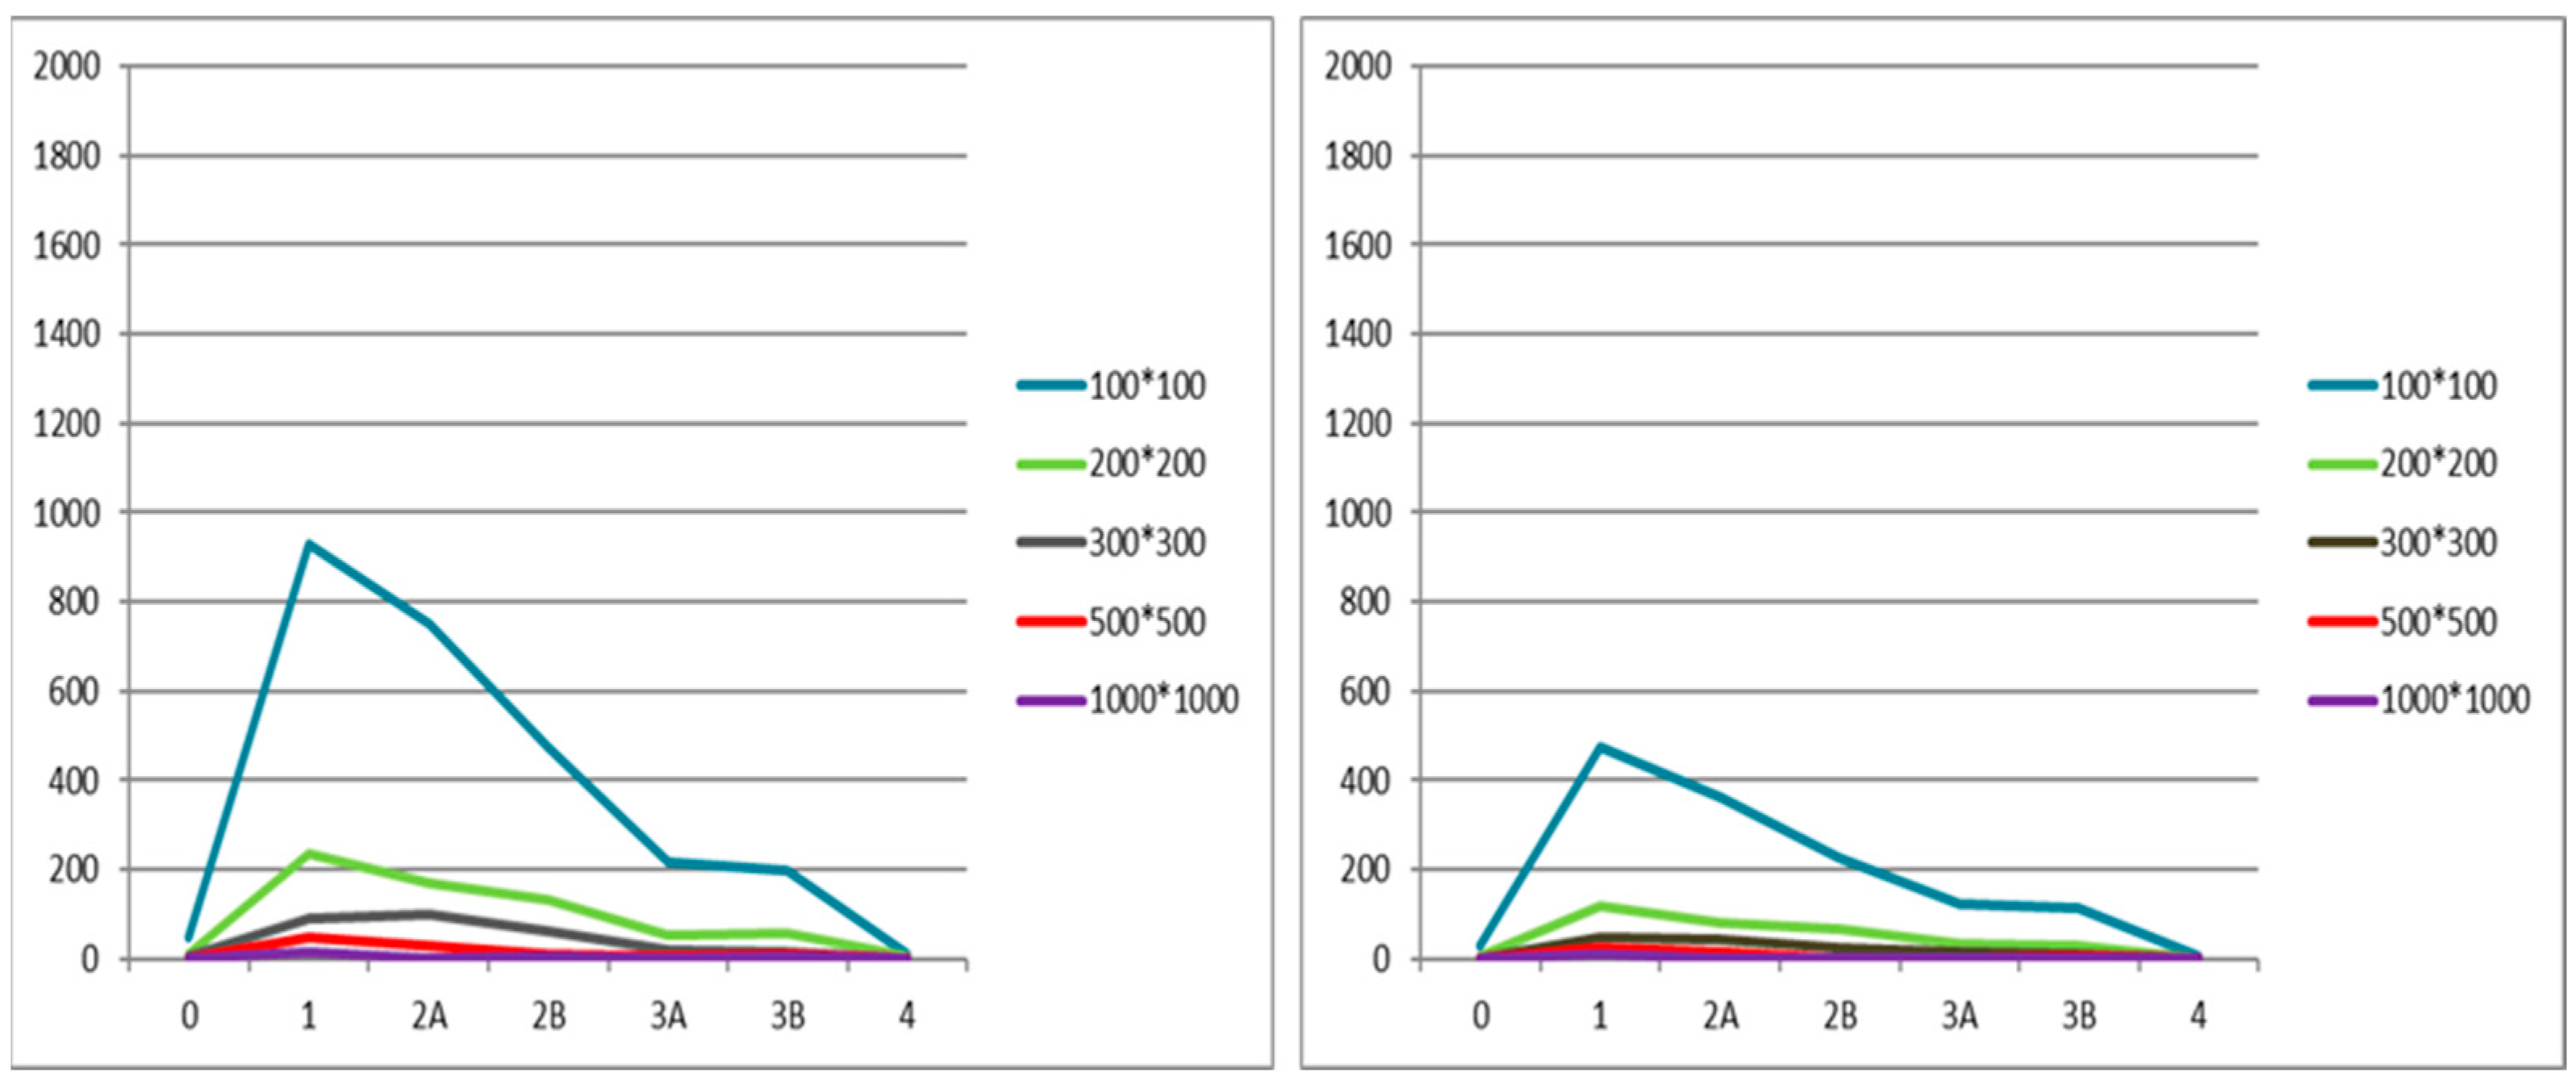
| 100 × 100 | 0 | 90 | 46 | 30 | 500 × 500 | 0 | 6 | 3 | 1 |
| 1 | 1782 | 931 | 473 | 1 | 75 | 48 | 24 | ||
| 2A | 1536 | 752 | 363 | 2A | 67 | 27 | 17 | ||
| 2B | 973 | 475 | 225 | 2B | 30 | 12 | 3 | ||
| 3A | 454 | 217 | 122 | 3A | 11 | 5 | 3 | ||
| 3B | 401 | 199 | 112 | 3B | 22 | 11 | 5 | ||
| 4 | 22 | 12 | 5 | 4 | 2 | 1 | 0 | ||
| ∑ | 5258 | 2632 | 1330 | ∑ | 213 | 107 | 53 | ||
| 200 × 200 | 0 | 25 | 12 | 7 | 1000 × 1000 | 0 | 2 | 1 | 0 |
| 1 | 435 | 235 | 118 | 1 | 23 | 14 | 8 | ||
| 2A | 368 | 171 | 79 | 2A | 13 | 3 | 1 | ||
| 2B | 261 | 130 | 65 | 2B | 12 | 5 | 2 | ||
| 3A | 122 | 54 | 34 | 3A | 3 | 2 | 1 | ||
| 3B | 108 | 57 | 31 | 3B | 7 | 5 | 3 | ||
| 4 | 5 | 4 | 2 | 4 | 0 | 0 | 0 | ||
| ∑ | 1324 | 663 | 336 | ∑ | 60 | 30 | 15 | ||
| 300 × 300 | 0 | 11 | 6 | 2 | |||||
| 1 | 194 | 92 | 47 | ||||||
| 2A | 185 | 99 | 45 | ||||||
| 2B | 119 | 60 | 26 | ||||||
| 3A | 43 | 21 | 15 | ||||||
| 3B | 35 | 16 | 11 | ||||||
| 4 | 3 | 2 | 2 | ||||||
| ∑ | 590 | 296 | 148 | ||||||
| Sample Sizes/Combinations of Numbers of Trees | Values for χ2 Test (Total) |
|---|---|
| 100 × 100 AD | 2.96 |
| 100 × 100 A | 8.49 |
| 200 × 200 ABCD | 3.67 |
| 200 × 200 AD | 5.15 |
| 200 × 200 A | 6.52 |
| 300 × 300 ABCD | 5.64 |
| 300 × 300 AD | 6.37 |
| 300 × 300 A | 3.93 |
| 500 × 500 ABCD | 10.63 |
| 500 × 500 AD | 11.81 |
| 500 × 500 A | 7.90 |
| 1000 × 1000 ABCD | 4.97 |
| 1000 × 1000 AD | 9.23 |
| 1000 × 1000 A | 7.90 |
| Survey Strip | Number of Trees | sx | s2 | sx × s2 |
|---|---|---|---|---|
| 8527 | 2144 | 0.40 | 267.98 | 107.05 |
| 8528 | 1524 | 0.27 | 225.67 | 61.23 |
| 8531 | 1590 | 0.33 | 464.09 | 152.80 |
| Total | 5258 | 1 | 321.07 |
| z | 1.96 | 1.96 | 1.96 | 1.96 |
| p | 0.3104 | 0.3104 | 0.3104 | 0.3104 |
| 1 − p | 0.6896 | 0.6896 | 0.6896 | 0.6896 |
| B | 0.01 | 0.012506 | 0.015162 | 0.049994 |
| N | 8223 | 5258 | 3577 | 329 |
| Sample | Damage Indicator (%) | Total | ||
|---|---|---|---|---|
| ABCD | AD | A | ||
| 100 × 100 m | D | 98.29 | 98.25 | 97.74 |
| DI | 64.40 | 62.58 | 61.59 | |
| MD | 38.09 | 37.62 | 38.04 | |
| MD1 | 49.81 | 49.84 | 50.99 | |
| 200 × 200 m | D | 98.11 | 98.19 | 97.92 |
| DI | 64.63 | 61.56 | 60.51 | |
| MD | 38.90 | 38.52 | 39.55 | |
| MD1 | 50.66 | 51.36 | 53.02 | |
| 300 × 300 m | D | 98.14 | 97.97 | 98.65 |
| DI | 63.86 | 64.10 | 61.59 | |
| MD | 37.07 | 37.05 | 39.43 | |
| MD1 | 47.85 | 47.11 | 50.53 | |
| 500 × 500 m | D | 97.18 | 97.20 | 98.11 |
| DI | 58.52 | 47.15 | 43.48 | |
| MD | 37.42 | 35.26 | 33.73 | |
| MD1 | 50.21 | 52.10 | 48.66 | |
| 1000 × 1000 m | D | 96.67 | 96.67 | 100.00 |
| DI | 48.68 | 36.96 | 29.03 | |
| MD | 37.92 | 39.58 | 40.83 | |
| MD1 | 53.21 | 55.00 | 67.50 | |
| Sample | 100 × 100 m | 200 × 200 m | 300 × 300 m | 500 × 500 m | 1000 × 1000 m | |||||
|---|---|---|---|---|---|---|---|---|---|---|
| N | B | N | B | N | B | N | B | N | B | |
| ABCD | 5258 | 1.25 | 1324 | 2.49 | 590 | 3.73 | 213 | 6.21 | 60 | 11.7 |
| AD | 2632 | 1.76 | 663 | 3.52 | 296 | 5.27 | 107 | 8.77 | 30 | 16.56 |
| A | 1330 | 2.49 | 336 | 4.95 | 148 | 7.45 | 53 | 12.46 | 15 | 23.41 |
Disclaimer/Publisher’s Note: The statements, opinions and data contained in all publications are solely those of the individual author(s) and contributor(s) and not of MDPI and/or the editor(s). MDPI and/or the editor(s) disclaim responsibility for any injury to people or property resulting from any ideas, methods, instructions or products referred to in the content. |
© 2023 by the authors. Licensee MDPI, Basel, Switzerland. This article is an open access article distributed under the terms and conditions of the Creative Commons Attribution (CC BY) license (https://creativecommons.org/licenses/by/4.0/).
Share and Cite
Kolić, J.; Pernar, R.; Seletković, A.; Jazbec, A.; Ančić, M. Determining the Optimal Sample Size for Assessing Crown Damage on Color Infrared (CIR) Aerial Photographs. Sustainability 2023, 15, 15918. https://doi.org/10.3390/su152215918
Kolić J, Pernar R, Seletković A, Jazbec A, Ančić M. Determining the Optimal Sample Size for Assessing Crown Damage on Color Infrared (CIR) Aerial Photographs. Sustainability. 2023; 15(22):15918. https://doi.org/10.3390/su152215918
Chicago/Turabian StyleKolić, Jelena, Renata Pernar, Ante Seletković, Anamarija Jazbec, and Mario Ančić. 2023. "Determining the Optimal Sample Size for Assessing Crown Damage on Color Infrared (CIR) Aerial Photographs" Sustainability 15, no. 22: 15918. https://doi.org/10.3390/su152215918
APA StyleKolić, J., Pernar, R., Seletković, A., Jazbec, A., & Ančić, M. (2023). Determining the Optimal Sample Size for Assessing Crown Damage on Color Infrared (CIR) Aerial Photographs. Sustainability, 15(22), 15918. https://doi.org/10.3390/su152215918