1. Introduction
Road traffic crashes (RTCs) exert a profound and far-reaching influence on global public health, leading to fatalities and grievous injuries [
1]. According to the World Health Organization (WHO), traffic accidents contribute to 1.35 million deaths annually, with traffic-related injuries emerging as the primary cause of death among the younger population [
2]. Accurately predicting the severity of RTCs is of the utmost importance for implementing effective measures to reduce crashes and ensure a timely medical response. In pursuit of this objective [
3], researchers have proposed diverse models that amalgamate environmental, vehicle, driver, and roadway data [
4].
This paper addresses the intricate task of precisely classifying freeway crashes occurring amid varying traffic conditions. Freeway crashes introduce heightened complexity compared to incidents on other road types, owing to elevated speeds, higher traffic volumes, and intricate multi-lane configurations. Achieving accurate classification of freeway crashes necessitates a holistic consideration of variables such as speed limits and prevailing weather conditions.
The primary driving force behind this research is the critical concern of freeway crashes, which represent a substantial menace to road safety, leading to both human casualties and property damage. This study seeks to enhance the precision of freeway crash classification, particularly in diverse traffic scenarios. The core motivation for this research lies in the creation of a dependable predictive model that integrates multiple traffic variables, including braking, weather conditions, and speed, with the overarching goal of improving road safety, minimizing crash severity, and reducing related expenses. Our research is propelled by the critical need for the meticulous and timely classification of freeway crashes, thereby elevating road safety and mitigating associated costs. The domain of traffic crashes remains a globally recognized public health concern, leading to significant loss of life, injuries, and property damage. Specifically, freeway crashes introduce further layers of complexity due to their high speeds, dense traffic flow, and intricate lane arrangements. Effectively categorizing freeway crashes stands as a pivotal endeavor, shedding light on underlying causes and laying the groundwork for impactful preventive measures.
The problem addressed in the study is the accurate classification of freeway crash severities under different traffic conditions. Freeway crashes pose a significant risk to road users, and identifying the severity of these crashes is crucial for implementing appropriate safety measures, emergency responses, and infrastructure improvements. However, the complexity and variability of traffic conditions make it challenging to achieve reliable and accurate crash severity classification. Traditional statistical models may have limitations in capturing the intricate relationships between various factors that affect crash severity. Traditional approaches for classifying freeway crashes rely on handcrafted features and decision rules that may not capture the complex relationships between different factors. Machine learning techniques have shown great potential in accurately classifying traffic crashes, including freeway crashes.
The proposed solution approach utilizes Boosting Ensemble Learning, which combines multiple weak learners to create a stronger and more accurate classification model. Ensemble learning methods, such as AdaBoost or Gradient Boosting, can effectively oversee complex relationships and interactions among atypical features in the dataset. Additionally, hyperparameter optimization techniques are employed to fine-tune the parameters of the ensemble learning model with an aim to optimize their performance. Boosting ensemble learning is a powerful machine learning technique that has been successfully applied to various classification tasks, including traffic crash classification. The proposed approach combines boosting ensemble learning with three feature sets: speed limit, speed, and weather conditions, to enhance the accuracy of freeway crash classification. The goal of this research is to develop an accurate and reliable classification approach that can aid in enhancing road safety and reducing associated costs. The goal of this approach is to enhance road safety by accurately classifying freeway crashes and reducing associated costs. The proposed approach is evaluated using a real-world dataset of freeway crashes and compared to several state-of-the-art classification methods to demonstrate its effectiveness.
The remainder of the paper is organized as follows:
Section 2 discusses the literature related to the prediction of traffic accident severity and its influencing factors;
Section 3 explains the research methodology used;
Section 4 discusses the experimental work and results; finally,
Section 5 provides a conclusion of the work.
2. Background and Related Work
Researchers have conducted numerous studies on the factors affecting RTCs, and several factors have been identified to have significant effects on the frequency and severity of these crashes.
2.1. Factors Affecting RTCs on Freeways
Freeway Road Traffic Crashes (RTCs) stand as a significant concern for public safety, emphasizing the critical importance of comprehending the contributing factors for effective road safety management and the mitigation of future crash severity. This study delves into a comprehensive exploration of the diverse elements that wield influence over freeway RTCs, encompassing weather conditions, road surface attributes, geometric design, driving speed, human errors, and even the presence of animals on the road. Weather conditions, including slush, snow, and rain, have emerged as substantial catalysts for freeway road traffic crashes, as shown in
Figure 1. Equally noteworthy are the adverse effects of poor road surfaces, particularly wet and icy pavement surfaces, which have been identified as key contributors to a significant portion of these crashes. The findings from the Federal Highway Administration (FHWA) indicate that 24% of vehicle collisions occur on slushy, snowy, or icy pavements, with an additional 15% transpiring during snowstorms. Astonishingly, adverse weather conditions alone account for about 24% of collisions, resulting in an estimated 7400 annual deaths in the United States. The imperative to consider weather conditions in road design and maintenance cannot be understated. Such considerations are pivotal in fostering safer travel conditions for all users of the road. By acknowledging these influential factors, we can collectively work towards safer and more secure road networks.
Road conditions and friction wield substantial influence over the occurrence of road traffic crashes. A study conducted by Khattak [
5] unearthed the correlation between wet and slippery road surfaces and heightened crash probability, underscoring the significance of maintaining well-kept pavements and effective drainage systems to mitigate standing water on roadways. Likewise, research by Akhtar [
6] highlighted the adverse impact of low pavement friction on crash likelihood, emphasizing the necessity for regular road surface maintenance to ensure optimal friction levels.
Geometric design forms another pivotal factor capable of shaping road safety. Factors such as road curvature and slope, particularly sharp bends and steep inclines, can elevate accident risks—especially if drivers are inadequately prepared for such conditions. Enhancing warning signs and establishing fitting speed limits for these road segments can curtail the potential for crashes. The role of speed in influencing the probability and gravity of road traffic crashes has also been addressed by Elvik [
7]. Elevated speeds heighten both the likelihood of crashes and the severity of resultant injuries. Thus, the reduction of speed limits on rural roads emerges as a potent strategy for significantly diminishing the occurrence of fatal crashes. Human error emerges as a pivotal contributing element in road traffic crashes. Distraction, fatigue, alcohol and drug usage, and speeding—as highlighted by Peden [
8] —all stand as catalysts for human errors that can culminate in accidents. The mitigation of human error necessitates a comprehensive approach involving improved driver education and awareness, the implementation of more stringent laws and regulations, and the utilization of technology to aid drivers in recognizing and averting potential hazards.
Hence, enhancing warning signs and ensuring fitting speed limits on these specific road segments can effectively curtail the likelihood of accidents. Speed emerges yet another pivotal element, impacting both the probability and gravity of road traffic crashes, as elucidated by Elvik [
7]. Escalated speeds heighten crash probabilities while also intensifying the extent of sustained injuries. Consequently, a reduction in speed limits for rural roads holds the potential to significantly reduce the occurrence of fatal crashes. Human error constitutes a substantial contributing factor in road traffic accidents. Distraction, fatigue, alcohol, and drug use, as well as speeding—as pointed out by Peden [
8]—collectively contribute to human errors that can culminate in accidents. The resolution of human error demands a holistic strategy that encompasses enhanced driver education, heightened awareness, the enactment of more stringent laws, and the utilization of technology to aid drivers in recognizing and averting potential hazards.
Furthermore, the presence of animals on the road can elevate the risk of road traffic crashes, especially in rural areas, as highlighted by Jägerbrand and Elvik [
9]. Introducing wildlife warning signs and bolstering road fencing in regions with substantial animal populations can effectively curtail crash numbers. Consequently, road traffic crashes on freeways are influenced by an array of factors, such as weather conditions, road quality, geometric design, speed, human error, and the presence of animals. Addressing these multifaceted aspects demands a comprehensive approach encompassing infrastructure enhancements, driver education and training, law enforcement, and advancements in vehicle technology. By mitigating the frequency and severity of crashes, we can undoubtedly enhance road safety for all users.
The authors established a vertical dynamic model to enhance passenger comfort in high-speed trains caused by vibrations in the overall structure [
10]. Low-frequency resonance was reduced by building a suspension system based on a damper. Significant improvements of 21.3%, 9.3%, and 6.6% were achieved in ride comfort compared to traditional suspension in its primary and secondary parts. A system has been built to control the vehicle’s path tracking in various traditional and complex conditions by focusing on the vehicle’s dynamics, including speed, trajectory, and curves [
11].
While significant progress has been made in understanding the factors behind road traffic crashes on freeways, certain research gaps persist. For instance, though the study underscores the importance of tackling human error, there remains a deeper exploration required into the specific types of distractions and driving behaviors that precipitate these crashes. Furthermore, additional research is warranted to evaluate the effectiveness of diverse road safety interventions, including measures like wildlife warning signs and enhancements to road geometry. Nevertheless, it is important to note that the cited study does contribute significantly to our grasp of the factors influencing road traffic crashes on freeways. By meticulously identifying and examining these factors, encompassing aspects such as weather conditions, and more, the study offers a comprehensive panorama of the hurdles demanding attention for the enhancement of road safety. Particularly commendable is the study’s emphasis on adopting an integrated approach that encompasses infrastructure enhancements, driver education and training, law enforcement, and advancements in vehicle technology. This contribution underscores the pressing need for multifaceted solutions that can effectively curtail both the frequency and severity of RTCs.
2.2. Machine Learing Approaches to Vehicle Crash Prediction
Statistical models serve as mathematical tools to establish the relationship between crash severity and explanatory variables. These models rely on assumptions about uncertain distributions and employ hypothetical tests to gauge how different variables impact accident severity. For example, Cerwick et al. applied latent class multinomial and mixed logit models to predict crash severity, identifying crucial features encompassing crash-specific, roadway, temporal, driver, and environmental factors [
12]. Similarly, Haghighi et al. utilized multilevel ordered logit and standard ordered logit models to examine the influence of roadway geometric features on crash severity [
13]. Regression models often come into play for analyzing correlations between risk factors and injury severity in vehicle-pedestrian crashes [
14]. However, statistical models face limitations when overseeing large, complex crash datasets containing numerous discrete variables or variables with multiple sub-categories. Furthermore, these models frequently rely on robust statistical assumptions, such as linearity, which can prove challenging to validate within real crash scenarios.
To address these challenges, non-parametric data mining techniques, such as machine learning (ML) and deep learning, have emerged as promising and viable alternatives. These techniques are purpose-built to reveal hidden patterns, unravel complex structures, and unveil intricate interactions within large datasets. One of their key strengths lies in their capacity to identify non-linear effects between variables [
15]. Additionally, ML techniques have the significant advantage of requiring minimal assumptions about data structures. They excel in managing even the most intricate datasets, and consistently deliver satisfactory modeling accuracies [
16]. In essence, these non-parametric techniques provide a significantly more flexible and effective approach for dissecting and comprehending the multifaceted relationships within extensive datasets, a requirement that is particularly pronounced in domains such as road safety analysis.
Numerous studies have juxtaposed the performance of ML techniques with statistical models in predicting crash severity, consistently demonstrating the superior predictive prowess of ML models. For instance, Chang et al. achieved remarkable accuracy in crash severity prediction using classification and regression tree models [
17]. Study harnessed a Multi-layer Perceptron (MLP), achieving commendable accuracy rates in predicting traffic accident severity [
18]. Delen et al. harnessed an artificial neural network (ANN) to estimate collision severity, leading to improved prediction accuracy [
19]. Additionally, Alkheder et al. juxtaposed ANN with the probit technique, confirming the preeminence of ANN in predicting accident severity [
20]. Notably, neural network methods have consistently exhibited superior performance in crash severity prediction.
Recent research has consistently displayed the heightened predictive capabilities of ML models over statistical counterparts in forecasting injury severity [
21,
22]. However, ML models often face criticism for their opaque operations and a dearth of interpretability in output. Consequently, the demand for interpretable ML models in crash severity prediction is on the rise [
23]. Traditional statistical models have historically played a significant role in data analysis and decision-making across a wide array of domains. Nevertheless, when confronted with extensive and intricate collision datasets, they encounter significant challenges that result in several noteworthy limitations. Among these challenges is the issue of scalability, wherein traditional models grapple with the efficient processing of vast data volumes. This can lead to protracted processing times and potential resource constraints. Furthermore, these models rely on specific data assumptions, such as linearity and normality, which can be violated within the complex context of collision datasets, potentially yielding inaccurate results. Additionally, collision datasets inherently encompass multifaceted interactions among numerous variables, often featuring non-linear relationships and higher-order effects that traditional models find challenging to capture. In response to these limitations, our innovative Boosting Ensemble Learning approach emerges as a compelling solution. Leveraging Boosting’s iterative nature, it excels in identifying and modeling complex interactions among variables, uncovering intricate patterns that traditional models might overlook. This inherent capability significantly enhances predictive accuracy, effectively addressing these critical challenges in collision data analysis.
The substantial contribution of this study lies in the utilization of interpretable machine learning models to enhance the classification of freeway crashes. This provides valuable insights into predicting crash severity and holds the potential to improve road safety measures. The findings suggest that ensemble learning models, including classification and regression trees and artificial neural networks, outperform statistical models in predicting crash severity. Previous efforts to develop predictive models for freeway crashes have faced limitations such as low accuracy and interpretability gaps. The approach adopted here, centered on interpretable machine learning models, effectively addresses these constraints and makes a valuable addition to the field of road safety. Ensemble learning models have gained widespread adoption in various applications due to their ability to enhance prediction accuracy by combining multiple base models. However, fine-tuning optimal hyperparameters for these models presents a challenge due to the multitude of parameter adjustment requirements. Our adoption of the Boosting Ensemble Learning approach, particularly through the utilization of tree-based models such as Gradient Boosting, Cat Boost, and XGBoost, displays a distinct advantage over conventional linear models when applied to the intricacies of collision data analysis. These ensemble models exhibit exceptional adaptability and competence in managing non-linear patterns, intricate interactions, and the innate complexities frequently observed in collision datasets. Nevertheless, it is of the utmost importance to acknowledge and address the challenges and intricacies inherent in validating conventional statistical assumptions [
24,
25,
26,
27,
28,
29,
30]. In this study, we delve into an assessment of the effectiveness of hyperparameter optimization on the performance of three ensemble learning models (CatBoost, XGBoost, and LightGBM) for classifying freeway crashes across varying traffic conditions. The application of interpretable machine learning models and the examination of hyperparameter optimization techniques in this study contribute to our improved understanding of predicting crash severity in freeway settings. These findings have tangible implications for refining road safety strategies and can significantly assist in developing effective approaches to reduce the frequency and severity of freeway crashes.
2.3. Case Study
The case study was thoughtfully executed within the boundaries of Flint Township, Michigan, tracing its path along the I-69 freeway. Flint, a city nestled in the heart of Michigan, stands sixty-six miles (106 km) from the bustling urban hub of Detroit, and finds its serene beauty graced by the gentle flow of the Flint River. The bedrock of our study lies in the meticulously curated data sourced from the archives of the Michigan Freeway Traffic Crashes (MFTC) records. These records weave a vivid tapestry of traffic incidents that unfolded along the expansive canvas of the I-69 freeway. To breathe life into these records and offer a glimpse into the essence of these impactful incidents, the driving simulator emerged as an invaluable ally, as detailed in reference [
24]. For a visual tour of the pivotal locations that bore witness to these noteworthy crashes along the selected freeway, please refer to the visual representation in
Figure 2.
3. Materials and Methods
The proposed explainable predictive model for crash prediction is a comprehensive and reliable approach that consists of six key phases. These phases aim to gather data on driver behavior and factors contributing to crashes, process and clean the collected data, develop ensemble learning models, fine-tune the models through hyperparameter tuning, explain the model’s workings and predictions, and provide a detailed analysis and discussion of the results.
The first phase, “Driving Simulator Scenario Analysis,” utilizes a driving simulator to recreate various driving scenarios and understand the impact of driver factors on crashes. In the “Data Collection and Pre-processing” phase, the collected data is cleaned, processed, and structured to ensure its quality and suitability for model building. The development of five ensemble learning models is conducted in the third phase. “Model Building and Hyperparameter Tuning,” the fourth phase, focuses on fine-tuning the ensemble learning models using a hyperparameter tuning process. The “Explanation of Results” phase is crucial for increasing transparency and accountability. It involves providing insights into how the model works and how the predictions were generated. Lastly, the results are comprehensively analyzed and discussed. The proposed model follows a systematic and rigorous approach, incorporating various phases to ensure reliability and explain the ability of the crash prediction process.
Figure 3 shows the proposed research approach.
3.1. Driving Simulator Scenario Analysis
In the phase of “Analyzing Driving Simulator Scenarios,” our aim is to delve into the intricate dynamics shaped by diverse driver factors like age, gender, and driving experience, among others. This exploration serves as a compass guiding us towards uncovering the crucial elements that influence crashes, offering valuable insights that fuel the evolution of our predictive model. The scenarios were meticulously simulated and thoughtfully crafted to mirror the intricate tapestry of real-world driving experiences. These scenarios encompass a spectrum of situations, including lane changes, intersections, merging, and overtaking maneuvers, all intricately interwoven to capture the essence of driving behavior in its full complexity. This deliberate design allowed us to bridge the gap between simulated and actual driving, empowering efforts to enhance the accuracy of our predictive model.
Table 1 provides an overview of the driving simulator scenarios employed in this study. Each scenario is uniquely identified by a designated number and encompasses vital details, including design considerations (eastbound or westbound), speed variables, directional aspects (exit 138–139), prevailing weather conditions, road surface characteristics, and a comprehensive metric quantifying the driving simulator scenarios, all elucidated in
Figure 4 The driving scenario was adeptly presented to the driver from their own perspective, a dynamic captured and depicted in
Figure 5. Various sensors and instruments were harnessed to meticulously gauge the driver’s actions, spanning aspects like speed, lane adherence, reaction time, and an array of driving-associated behaviors. This data was methodically collected and subjected to detailed analysis, as outlined in the following sections.
In the initial and third scenarios, denoted as S2 and S3, respectively, drivers enjoyed the flexibility to navigate the first and second lanes, interchanging between them within the established speed parameters. Within these scenarios, certain drivers encountered instances of collision involving vehicles merging into their lane (ML) and those already present on the highway (HO). In particular, 70% of participants in Scenario 1 reported that the prescribed speed limit positively influenced their capacity for reaction and controlled braking. However, a challenge emerged as they found it hard to maintain clear object visibility while driving. In the case of Scenario 3, the majority of 60% of drivers noted no significant impact from the speed limit on their control. Remarkably, 83% of them pointed out that vehicles entering from ramps (ML) did indeed impact their driving experience.
Shifting attention to scenarios S2 and S4, a lane restriction was placed on drivers, limiting their movement to the first and second lanes, while still allowing lane switches within the permissible speed range. These scenarios introduced wet and rainy weather conditions. Impressively, more than half of the participants in both scenarios adeptly managed to bring their vehicles to a halt through vigorous braking, effectively averting collisions with slowing vehicles (SD). Nevertheless, a collective total of ten crashes occurred in S2, and six crashes in S4. Notably, eleven crashes emerged because of lane changes, a phenomenon exhibited in both scenarios. Interestingly, a considerable proportion of drivers, comprising 77% in S2 and 60% in S4, acknowledged the weighty influence of the speed limit on their sense of safety during driving, particularly in situations involving lane changes or speed reduction by leading vehicles.
Shifting gears to scenarios carrying higher speed limits, intriguing patterns surfaced, with a positive correlation to crashes caused by vehicles slipping out of control. These tendencies were prominent in scenarios S5, S7, and S8, prompting a consensus among most participants for a reduction in the speed limit to mitigate such occurrences. Conversely, in S9, where speeds were more aligned with the prescribed limit, a majority reported favorable driving experiences, advocating for the maintenance of the current speed limit. Across the board, participants encountered difficulties in maintaining vehicle control, particularly on curved paths and during braking.
Taking a dive into scenarios characterized by snowy weather conditions and icy roads, the playing field shifted significantly. These conditions were observed in S6, S8, and S10, each scenario bearing distinct speed limits. Notably, a total of seventy-eight crashes occurred, primarily driven by a loss of control due to the slippery terrain. The speed ranges for these crashes spanned from 20 to 67 mph for S6, 45 to 65 mph for S8, and 18 to 55 mph for S10. Impressively, 96% of drivers in S6 recognized the icy roads, with 81% encountering control issues. In S8, 70% found the speed limit fitting, but 52% still wrestled with maintaining control. S10 saw 76% approving of the speed limit, but 24% advocated for a reduction to thirty mph. Notably, a fascinating aspect emerged with ten crashes attributed to collisions with deer.
3.2. Data Collection and Data Descriptive
The investigation into driving under snowy weather conditions adhered to rigorous ethical protocols and gained approval from the Lawrence Technological University Institutional Review Board. In total, 110 participants engaged in the study, encompassing ten individuals in a preliminary pilot study and one hundred participants forming the core of the main experiment. This diverse group was meticulously selected from Lawrence Tech University’s database, with stringent criteria applied. Prospective participants were required to possess a valid driver’s license, be aged eighteen or above, and have experience in navigating interstate highways under varying weather circumstances.
A comprehensive breakdown of the variables encompassed within the crash dataset is provided in
Table 2. These variables seamlessly capture pivotal insights spanning driver attributes, driving conduct, road conditions, and crash incidents. Each variable is meticulously labeled to denote its corresponding information type, encompassing aspects such as age, gender, brake response, speed limit, instances of speeding, prevailing weather conditions, frictional coefficient, and ultimate crash status. Examining further, the variable levels meticulously outline the array of conceivable values or categories for each variable. These range from numerical values to distinct categorical options. This data repository equips us with the requisite resources to undertake an exhaustive analysis of the multifaceted contributors to crashes. Furthermore, this repository plays a pivotal role in devising efficacious strategies aimed at elevating road safety standards. At the core of this intricate web of information lies the dependent variable, serving as a conduit for the intricate relationships within. Its recorded ordinal values, encompassing four distinct levels (0, 1, 2, and 3), offer a nuanced lens into the diverse categories of observed crashes.
3.3. Data Preprocessing
Data preprocessing is a vital step in preparing data for machine learning models. It involves various techniques to ensure the data is in an appropriate format for analysis and model training. Multiple preprocessing techniques were applied to transform our raw dataset into a suitable format for training machine learning models.
Data cleaning is the first stage. In this study, we inspected the data for missing values and anomalous outliers, common issues with real-world data. First, since real-world data often has issues, we checked for missing values and weird outliers. We filled in any missing continuous data by interpolation and categorical data by using the most common value.
Data scaling is the second stage. Normalized min-max scaling was applied to normalize the continuous variables within the dataset. By doing so, the continuous variables are brought to the same scale. This normalization is particularly beneficial for machine learning algorithms that are sensitive to the scale of features. To prevent wide-ranging features from dominating others, we normalized all continuous variables into the [0, 1] interval using min-max scaling such as ‘Frictional Coefficient’. This transformed them to comparable scales for fair evaluation during modeling.
Additionally, feature encoding was required for categorical features like ‘Brake Response’ and ‘Speed Limit’ to convert the text categories into numerical representations. We employed one-hot encoding to transform each unique category into a binary dummy variable. This expanded the feature space but enabled the algorithms to properly analyze the categorical inputs.
Finally, we mitigated the class imbalance in the original dataset, which could introduce prediction bias. The minority class had only around one hundred 100 samples out of 501 samples total. Using SMOTE oversampling, we generated new synthetic examples of the minority class to balance its representation [
25]. After SMOTE, both classes had equal samples at 608 each, for a total dataset size of 1216. This balancing ensured our models would robustly learn from both classes.
3.4. Boosting-Based Ensemble Learning Classification Models for Crash
In this study, several machine learning (ML) techniques were employed independently to classify crashes, and their predictions were combined to enhance accuracy. The efficacy of the proposed ML algorithm was evaluated through both training and testing processes. The training phase utilized 70% of the dataset to train the model, while the testing phase assessed the model’s performance using the remaining 30% of the dataset. To ensure the reliability and effectiveness of ML-based forecasting models, 5-fold cross-validation was applied. To overcome the limitations of traditional gradient boosting algorithms [
26], novel algorithms such as Natural Gradient Boosting (XGBoost), Categorical Boosting (CatBoost), and Light Gradient Boosting were implemented in this study. These algorithms have been specifically designed to handle categorical data, missing data, and large datasets. They have shown promising results in various applications, including car crash prediction and analysis. In this study, we provide a brief explanation of the four boosting techniques.
3.4.1. Gradient Boosting (GBoost)
GBoost is a powerful tree-based algorithm that can be applied to various loss functions. It follows an incremental approach, like other boosting algorithms, to construct a predictive model. However, what sets Gradient Boosting apart is its unique methodology of generating decision trees. In each iteration, instead of fitting weak learners to sample output values, Gradient Boosting fits decision trees by incorporating the negative gradients, also known as residual errors [
27]. These negative gradients represent the discrepancies between the predicted output values and the actual output values. By leveraging the negative gradients, Gradient Boosting aims to iteratively minimize the loss function and refine the model’s predictions. The algorithm constructs new decision trees in each iteration to address the residual errors of the previous models, gradually improving the overall model performance. This iterative approach allows Gradient Boosting to capture complex relationships and make accurate predictions. Gradient Boosting is a versatile algorithm that can be customized to different loss functions, making it suitable for a wide range of machine learning tasks. It is particularly effective when applied to regression and classification problems. The algorithm’s ability to handle diverse loss functions and its iterative nature make it a popular choice in the machine learning community.
Figure 6 shows the typical architecture of a gradient boosting (GBoost) model.
For binary classification, the equation for XGBoost can be expressed in Equation (1). Suppose
is the predicted probability that sample
belongs to class 1, and
is the prediction of the m-th weak learner for sample
where
is the weight assigned to the m-the weak learner (tree) in the ensemble, and
M is the number of weak learners (decision trees) used in the ensemble.
is the feature vector of the
i-th sample. Also,
is defined as the corresponding true label of the
i-th sample, where
∈ {0, 1}.
3.4.2. XGBoost Model
XGBoost represents an advanced iteration of Gradient Boost, incorporating several sophisticated techniques to combat overfitting, enhance split detection, and manage missing values during training. The core of XGBoost’s objective function comprises a loss function and a regularization term, working in tandem to skillfully govern model complexity and counter overfitting. A noteworthy enhancement in XGBoost lies in its approach to split findings within each tree node. This method involves sorting instances by a specific feature and then conducting a linear search to pinpoint the optimal split. XGBoost assesses the best split across all features, ensuring precision and efficiency in tree construction. The treatment of missing values in XGBoost is equally innovative. After constructing the tree, the algorithm designates the direction with the highest score within each node as the default path for classifying instances with missing values. This strategy enables predictions for missing values based on available information, thus amplifying model robustness and predictive prowess. Collectively, these techniques set XGBoost apart, enabling superior performance compared to conventional gradient-boosting algorithms. It masterfully navigates overfitting concerns, streamlines split detection, and adroitly manages missing values. These advancements position XGBoost as a potent tool across diverse machine-learning tasks, encompassing classification, regression, and ranking, as illustrated in
Figure 7, the XGBoost model [
28,
29,
30].
Given a dataset {
D,
y} and
p CARTs
f(
x) as weak learners, the ensemble
first includes a weak learner
that learns from the original dataset. Then, the ensemble sequentially adds weak learners that learn from the residual of the previous ensemble. If k > 0, k ∈
N is the k-th boosting round, then the ensemble
at the k-th boosting round is shown in the following formula:
where
learns from the residuals of
, and is the learner that greedily minimizes an objective function
, which is indicated in the following formula:
where
l is a differentiable complex loss function between the
i-th outcome
yi and the (
t − 1)-th ensemble’s predicted
i-th outcome
, and
is a function that penalizes tree complexity, with
T,
w as the amount of leaves and sum of all leaf weights, respectively, and
γ,
λ are the regularization and minimum loss hyperparameters of XGBoost, respectively.
3.4.3. LightGB Model
LightGBM is an advanced gradient-boosting decision tree-based machine learning technique known for its memory efficiency and accurate predictions. It is widely used for solving both regression and classification problems. One of the primary advantages of LightGBM is its ability to handle large datasets and high-dimensional feature spaces more efficiently compared to traditional gradient-boosting algorithms. LightGBM addresses the scalability and efficiency issues by employing two innovative techniques: Gradient-based One-Side Sampling (GOSS) and Exclusive Feature Bundling (EFB). The GOSS technique selectively considers samples with large gradients during the split point selection process. By focusing on samples that have a significant impact on information gain computation, GOSS reduces the computational burden without compromising the model’s accuracy. This approach is particularly beneficial when dealing with extensive datasets, as it significantly speeds up the training process. The EFB strategy is utilized to mitigate the challenges associated with high-dimensional feature spaces. It bundles mutually exclusive features together, reducing the number of distinct features considered during the split point selection. This not only simplifies the computation, but also helps in addressing potential overfitting issues and improves the model’s generalization performance.
Figure 8 shows the LightGBM Model.
So, such parameters can be measured using the method of fitting
in Equation (5), and the loss function can be evaluated by Equation (6).
where
is the current iteration of model achievement, and c means the current iteration. Also,
can be defined as the loss function of the current iteration.
3.4.4. Stochastic Gradient Boosting (SGB)
SGB, introduced in 2002, is an advanced methodology that combines the principles of gradient boosting with the power of stochastic optimization. By introducing controlled randomness through the selective use of subsets from the training data in each iteration, SGB enhances its generalization capabilities while mitigating the risk of overfitting. This integration of random sampling enables SGB to adapt more effectively and extract meaningful insights from the data, resulting in improved predictive accuracy and model robustness. The key advantage of SGB lies in its ability to leverage the benefits of stochastic optimization. By randomly sampling subsets of the training data, SGB introduces diversity into the boosting process, which helps the model to generalize well to unseen data. This controlled randomness regularizes, preventing the model from becoming too complex and overfitting to the training set. Through the strategic integration of random sampling, SGB excels in its ability to adapt and extrapolate insights from the data. This enhances its predictive accuracy, as the model can capture complex relationships and patterns more effectively. Additionally, SGB exhibits improved model robustness, as it is less sensitive to noise and outliers in the data.
3.4.5. Categorical Boosting (CatBoost)
CatBoost is a gradient-boosting algorithm specifically designed to handle categorical data. Unlike traditional gradient boosting algorithms, CatBoost eliminates the need for feature encoding when dealing with categorical variables, resulting in improved model accuracy and stability. It has been successfully applied in various applications, including car crash prediction, where it has demonstrated superior performance compared to traditional gradient boosting algorithms in terms of accuracy and stability. One of the key advantages of CatBoost is its natural handling of missing data. It incorporates mechanisms to handle missing values in a seamless manner, eliminating the need for additional preprocessing steps. Additionally, CatBoost utilizes symmetric trees with identical splits at each node level, which contributes to its computational efficiency, making it faster than other gradient-boosting frameworks such as XGBoost. Algorithm 1 shows the Pseudo code for ML Model for Crash Recognition.
The aim is to train a function
:
→
that minimises the expected loss given in Equation (7):
where L is a smooth loss function and (x, y) is a sample of test data.
| Algorithm 1: Pseudo code for ML Model for Crash Recognition |
| 1. | IMPORT important libraries including Scikit Learn |
| 2. | IMPORT the dataset PRE-PROCESSING to Min-Max Scaling and SMOTE |
| 3. | STORE various Machine Learning Models in a variable ‘models SET scoring equal to ecuracy |
| 4. | | GBoost |
| 5. | | | Equation (1) |
| 6. | | XGBoost |
| 7. | | | Equation (2) |
| 8. | | | Equation (3) |
| 9. | | | Equation (4) |
| 10. | | LightGBM |
| 11. | | | Equation (5) |
| 12. | | | Equation (6) |
| 13. | | CatBoost |
| 14. | | | Equation (7) |
| 15. | Evaluate model selection using two splits by imputing 85%Train and 15% Testing data |
| 16. | Append results in list of existing results |
| 17. | END |
3.5. Hyperparameter Optimization for Each Model
The optimization of hyperparameters stands as a pivotal task in the training of various machine learning models, including CatBoost and Light Gradient Boosting (LGB), as emphasized in Reference [
31]. Hyperparameters encompass model-specific settings that exert a considerable influence on the model’s learning and prediction capabilities. By judiciously fine-tuning these settings, we can enhance the accuracy and stability of the models. It is imperative to recognize that different models necessitate distinct hyperparameter adjustments to achieve peak performance.
The optimal hyperparameter configurations for each model are succinctly summarized in
Table 3, encapsulating the refined settings attained through rigorous tuning. For AdaBoost, critical hyperparameters included the number of weak learner estimators, dictating the amalgamation of weak classifiers into the final model; and the learning rate, governing the influence of each weak classifier. This meticulous calibration enabled precise control over model complexity and an enhancement in prediction accuracy.
In the case of Gradient Boosting, we further extended the tuning process. Key hyperparameters encompassed the number of estimators, the learning rate, and an additional factor; namely, the maximum depth of the decision trees serving as base learners. Tuning these hyperparameters facilitated tailored control over model performance, accommodating the intricacies of the dataset. Transitioning to XGBoost and LightGBM, we undertook a comprehensive optimization effort. For XGBoost, pivotal hyperparameters included the number of estimators, maximum depth, learning rate, subsample ratio, and column subsampling ratio. By optimizing these hyperparameters, we achieved a substantial improvement in predictive performance, harnessing the full potential of the model. LightGBM, sharing similarities with XGBoost as a gradient boosting framework, also necessitated fine-tuning of the estimator count, learning rate, and max depth. Additionally, LightGBM introduced specialized hyperparameters like “min_child_samples” and “num_leaves”, affording precise control over tree growth, and consequently, enhancing prediction accuracy. SGD, as a fundamental machine learning algorithm, called for the optimization of the regularization strength and the type of regularization penalty applied. This optimization significantly bolstered the model’s generalization capability, aligning it more closely with the complexities of the collision dataset.
The use of randomized search facilitated a comprehensive exploration of the expansive hyperparameter space, leading to the discovery of finely tuned configurations tailored to each model’s requirements. In conclusion, meticulous tuning of algorithm-specific hyperparameters proved indispensable in maximizing predictive accuracy throughout our machine learning pipeline.
3.6. Model Evaluation
To appraise the efficacy of the crash classification models, a confusion matrix comes into play, furnishing insights into both the actual and predicted labels. In this investigation, a diverse set of evaluation metrics was harnessed to gauge the effectiveness of the suggested model. Among these metrics, accuracy took prominence, and its definition was elucidated in References [
32,
33,
34,
35]. The precise formulations for computing these metrics are delineated in
Table 4.
Table 4 succinctly exhibits the confusion matrix for the multi-class crash classifier. The confusion matrix provides a summary of the classifier’s performance by comparing the predicted classes with the actual classes. In the table, “TP” represents true positives, which are the instances where the actual class is “Two crash” or “One crash”, and the classifier correctly predicts the same class. “FN” denotes false negatives, which occur when the actual class is “Two crashes” or “One crash”, but the classifier incorrectly predicts “No crash”. “FP” signifies false positives, where the actual class is “No crash”, but the classifier predicts “Two crashes” or “One crash” incorrectly. Finally, “TN” stands for true negatives, which represent instances where the actual class is “No crash”, and the classifier correctly predicts the same class. In our research, accrued measures of performance are used to evaluate the models for classification, which measure the proportion of correct predictions for a given class out of the total predictions made. The accuracy is computed using the following equation.
Accuracy: This metric gauge the ratio of accurate predictions generated by the model. The accuracy formula is as follows [
36]:
4. Results
4.1. Descriptive Statistics of Pre-Experiment Questionnaire
One hundred ten drivers participated in Experiments 1 and 4, with ten participants involved in the pilot study and one hundred participants in the main experiment. Analysis of the questionnaire results reveals that the majority of drivers fall within the age range of 25 to 40. Specifically, 26% of drivers belong to the 25–30 age group, while 28% fall into the 31–40 age group. These findings suggest that a huge portion of the sample consists of young drivers who have a considerable number of years ahead of them driving. However, the sample exhibits a lower representation of older drivers, with only 5% falling within the 51–60 age group. This implies that older drivers are underrepresented in the sample, as shown in
Figure 9.
The questionnaire results provide valuable insights into several factors related to driving behavior. Firstly, it is found that 81% of the drivers in the sample are male, while only 19% are female. This gender distribution could potentially influence overall driving behavior, as previous research has shown that gender can play a role in driving behavior.
One hundred ten drivers participated in Experiments 1 and 4, with ten participants involved in the pilot study and one hundred participants in the main experiment. Analysis of the questionnaire results reveals that the majority of drivers fall within the age range of 25 to 40. Specifically, 26% of drivers belong to the 25–30 age group, while 28% fall into the 31–40 age group.
4.2. Statistical Analysis of Simulation Driver Model
Table 5 and
Figure 10 provides a comprehensive overview of the descriptive statistics for various driver characteristics in the simulation driver model. These statistics offer valuable insights into the central tendency, variability, and distribution shape of the data, contributing to a deeper understanding of driver behavior in different driving scenarios. The first driver characteristic, BB. HO represents a specific driver behavior. The mean value of 7700 indicates the average occurrence of this behavior. The small standard deviation (0.26672) and variance (0.07114) suggest low variability, indicating a consistent pattern of this behavior. The positive skew (3.18) indicates a right-skewed distribution, meaning that this behavior occurs more frequently than average. The high kurtosis value (8.12) suggests a highly peaked distribution, indicating a concentrated occurrence of this behavior.
Driver speed refers to the simulated driver’s speed. The mean value of 57.009 represents the average speed observed. The standard deviation (12.686) and variance (160.940) suggest a high variability in driver speeds. The slight negative skew (−0.03) indicates a slightly left-skewed distribution, implying a slightly higher frequency of higher speeds. The negative kurtosis value (−0.87) suggests a distribution that is less peaked compared to a normal distribution. The road speed characteristic reflects the speed limits on the road. With a mean value of 62.000, it represents the average speed limit observed. The standard deviation (14.704) and variance (216.216) indicate moderate variability in speed limits.
The negative skew (−0.35) suggests a slightly left-skewed distribution, indicating a slightly higher frequency of higher speed limits. The negative kurtosis value (−1.42) suggests a distribution that is less peaked compared to a normal distribution. Condition and M. tire represent the road and tire conditions, respectively. The mean values of 2.7000 and 2.3000 indicate the average levels of these conditions. The standard deviations (1.1006) and variances (1.2112) suggest moderate variability in both conditions. The skewness values (−0.29 for “Condition” and 0.29 for “M. tire”) indicate slightly left and right-skewed distributions, respectively, suggesting a slightly higher frequency of certain condition levels. The negative kurtosis values (−1.24 for both characteristics) suggest distributions that are less peaked compared to a normal distribution.
4.3. Feature Selection
Correlation Analysis: We first conducted a Pearson correlation analysis to identify and exclude features exhibiting multicollinearity. Correlation analysis is used to study the relationship between two or more variables and measure the extent to which they are associated with each other [
36]. Correlation coefficients range from −1 to +1, with −1 indicating a perfect negative correlation, zero indicating no correlation, and +1 indicating a perfect positive correlation. The correlation can be either positive or negative, depending on the direction of the relationship between the variables. A positive correlation means that the variables move in the same direction, while a negative correlation means they move in opposite directions [
37]. In our case, there are positive relationships between road speed and driving speed; as road speed increases, driving speed also increases, which can lead to accidents, as shown in
Figure 11.
Feature Importance from Models: Tree-based algorithms like XGBoost provide an inherent feature importance metric. We have chosen to use this metric to further refine our feature set.
Figure 12 presents these features in descending order of importance. Feature importance refers to the contribution of each feature to enhancing the model’s prediction performance. It can reflect the relevance of features and identify which characteristics significantly impact the final model. However, determining the relationship between the feature and the final forecast can be challenging.
According to
Figure 12, the conditions “icy”, “break_ml_zero”, and “order amount” are the three most significant factors. In contrast, the conditions “snow” or “speed_7” are the least relevant parameters for predicting crashes. The figure does not reveal whether these features have positive or negative correlations with crashes or whether they have other complex associations.
4.4. ML Models of Crash Prediction Result
This study focuses on developing a hyperparameter optimization approach for boosting ensemble learning models in the domain of freeway crash classification under varying traffic conditions. The goal is to compare the performance of several state-of-the-art machine learning algorithms, namely AdaBoost, Gradient Boosting, XGBoost, LightGBM, and SGD, in predicting crashes. To assess and compare the predictive capabilities of the developed machine learning models, various evaluation metrics such as accuracy and confusion matrices are employed. These metrics provide insights into the performance of the models and enable comprehensive analysis. The performance results of the machine learning models for crash prediction are summarized in
Table 6. This table presents the testing accuracy and training accuracy for each model across three different K-folds.
From the bar chart, it is apparent that all models exhibit high testing accuracy, although there are notable variations between them. Gradient Boost and XGBoost achieve the highest accuracies, with values around 0.96 and 0.958, respectively. LightGBM follows closely with an accuracy of 0.941. CatBoost attains an accuracy of 0.910, while SGD performs poorly with an accuracy of 0.594. Regarding model performance, the results as shown in
Figure 13 indicate that all three models (XGBoost, LightGBM, and CatBoost) achieve high accuracy and stability when classifying freeway crashes under diverse traffic conditions.
XGBoost and LightGBM slightly outperform CatBoost, but the differences are not significant. These models demonstrate the capability to accurately predict crashes in various traffic scenarios, highlighting their potential usefulness in real-world applications. Based on the provided performance metrics, Gradient Boost and XGBoost emerge as the best-performing models among the compared models. Both models exhibit high testing accuracy and training accuracy, indicating their competence in both training and testing data. With testing accuracies around 0.96, they can accurately predict the target variable for new data. Additionally, their high training accuracy suggests that they have effectively learned the patterns within the training data and can generalize well to unseen data. LightGBM also achieves a high testing accuracy of 0.94, though its training accuracy is lower than that of Gradient Boost and XGBoost. This indicates that LightGBM may not perform as effectively on new data as the other two models. Nonetheless, LightGBM still performs well and can be considered as a viable alternative.
In contrast, CatBoost exhibits lower testing and training accuracy compared to the other models, implying that it may not be the optimal choice for this specific task. Similarly, SGD demonstrates the lowest testing and training accuracy among all the compared models, indicating its ineffectiveness for this problem.
Figure 14 shows the comparison of metrics in ML models.
Table 7 presents the performance metrics of different models evaluated in terms of testing accuracy and training accuracy. These performance metrics provide insights into the accuracy levels of the models, indicating their overall effectiveness in predicting the target variable. The mean values represent the average accuracy achieved by each model, while the standard deviations give an indication of the variability or consistency of the model’s performance across different evaluations. These results provide an overview of the average accuracy and variability for each model and metric. It appears that the Gradient Boost and XGBoost models have a higher mean accuracy compared to CatBoost, LightGBM, and SGD. The standard deviation values indicate the spread or variability of the accuracy scores around the mean. Models with smaller standard deviations have more consistent performance. It is important to note that these results are based on the provided data. Further analysis and comparison, such as hypothesis testing or cross-validation, may be required to make robust conclusions about the model performances.
The performance metrics, as presented in
Table 7, provide valuable insights into the evaluation of various models for crash prediction. Notably, Gradient Boost consistently emerges as the leading performer in terms of testing accuracy, boasting a mean accuracy of 0.871 with a standard deviation of 0.140. This suggests that Gradient Boost excels in achieving a high level of accuracy when predicting crash outcomes. Its training accuracy is also commendable, standing at 0.900 with a standard deviation of 0.150, signifying its ability to effectively generalize from the training data to the testing data. In close pursuit, XGBoost demonstrates robust performance, featuring a mean testing accuracy of 0.868 and a standard deviation of 0.143. While it falls slightly short of Gradient Boost’s mean testing accuracy, it remains a competitive contender. With a training accuracy mean of 0.897 and a standard deviation of 0.155, XGBoost reaffirms its aptitude for effective generalization from the training data.
CatBoost and LightGBM present mean testing accuracies of 0.855 and 0.870, respectively, alongside standard deviations of 0.141 and 0.147, respectively. While these models exhibit a slightly lower mean testing accuracy compared to Gradient Boost and XGBoost, their standard deviations suggest that they deliver relatively consistent performances. On the contrary, the SGD model lags in terms of testing accuracy, recording a mean of 0.586 and a notably high standard deviation of 0.154. This indicates that the performance of the SGD model varies considerably across different evaluations. The low mean testing accuracy implies that it is less accurate in predicting crash outcomes compared to the other models. Similarly, its training accuracy, with a mean of 0.596 and a standard deviation of 0.157, suggests that the model struggles to generalize effectively from the training data to the testing data. Among the evaluated models, Gradient Boost consistently demonstrated the highest testing accuracy across all k-fold evaluations. This suggests that Gradient Boost is a dependable model for crash prediction in the context of freeway classification. XGBoost also showed competitive performance, closely following Gradient Boost in terms of testing accuracy. These findings indicate that ensemble learning models, such as Gradient Boost and XGBoost, exhibit strong predictive capabilities for crash prediction tasks.
Overall, these results underscore that Gradient Boost—with a standard deviation of 0.140—is a robust candidate for crash prediction tasks due to its high mean testing accuracies and relatively low standard deviations, reflecting consistent performance. To solidify the superiority of these models in practical applications, further evaluations, and comparisons, including hypothesis testing and cross-validation, would be instrumental.
In the presented confusion matrix
Figure 15, each cell corresponds to the count or proportion of cases associated with a particular actual class that are predicted to belong to a specific class. To illustrate, XGBoost emerges as the superior model for crash prevention. Specifically, TN (True Negatives) signifies the count of instances originally belonging to class 3, which are correctly classified as class 3. Conversely, FP (False Positives) denotes the instances initially categorized as class 0 but incorrectly predicted as class 0.
An interesting observation arises from a detailed analysis of the results. When comparing the number of misclassifications between categories 0 and 3, it is evident that category 0 exhibits a higher number of incorrect predictions, totaling 11. In contrast, category 3 only accounts for six incorrect predictions in relation to category 0. Considering these outcomes, it becomes evident that the XGBoost model excels in terms of accurate classification and operational efficiency.
5. Discussion
In terms of model efficacy, the results underscored impressive accuracy and stability across all three models when classifying freeway crashes under diverse traffic scenarios. While NG Boost and LGB displayed marginally superior performance compared to CatBoost, the disparities were not statistically significant. Notably, the models exhibited a commendable ability to predict crashes accurately under varying traffic conditions, displaying their potential utility in real-world applications.
In our investigation of Boosting Ensemble Learning for freeway crash classification under varying traffic conditions, we conducted a comparative analysis against previous studies within the same domain. Specifically, we pitted our ensemble learning techniques, XGBoost and CatBoost, against conventional machine learning algorithms like logistic regression and decision trees, which had been employed in prior research. Our findings underscore the marked superiority of ensemble learning techniques, particularly in terms of accuracy, suggesting a promising avenue for enhancing the precision of crash classification models. Our evaluation results accentuate the remarkable effectiveness of our approach, with Gradient Boosting algorithms achieving an impressive 96% accuracy in crash classification. These outcomes establish Gradient Boosting, known for its high mean testing accuracies and relatively low standard deviations of 0.140, as a robust choice for crash prediction tasks, indicative of consistent performance. To further validate the practical superiority of these models, additional assessments, and comparisons, including hypothesis testing and cross-validation, are paramount.
Furthermore, a comparison of our hyperparameter optimization strategy with previous approaches was undertaken. Employing optimization to attain optimal hyperparameters—proven to be more efficient than alternatives like grid search or random search—yielded compelling results. This substantiated the effectiveness of our optimization approach in heightening model performance, thereby emphasizing its value as a robust technique for hyperparameter fine-tuning. Also, we compared our dataset to those used in previous studies [
14,
15,
16,
17,
18,
19,
20,
21]. Our dataset was unique in that it included data from varying traffic conditions, which is a key factor in predicting crash outcomes. We also included a comprehensive set of features, including weather, road, and traffic information, which enabled us to capture a broad range of factors that influence crash outcomes.
Our study made valuable contributions to the field of crash classification by demonstrating the effectiveness of ensemble learning techniques and optimization for improving model accuracy. We also highlighted the importance of including data from varying traffic conditions and a comprehensive set of features in crash classification models. Future studies can build upon our work by exploring other ensemble learning techniques and hyperparameter optimization methods, and by examining the effectiveness of crash classification models in real-world scenarios. This study demonstrated the importance of hyperparameter optimization in boosting ensemble learning models for freeway crash classification.
The results suggest that optimizing the hyperparameters can significantly improve the accuracy and stability of the models, which is crucial for real-world applications where reliable predictions are essential. Future research could investigate other hyperparameter optimization methods and compare their performance with the randomized search method used in this study. The significance of each feature in improving the prediction performance of the crash model, developed with eight features to predict LDs, is analyzed in this section based on feature importance analysis.
In the domain of machine learning applied to transportation safety and crash prediction, it is imperative to evaluate the effectiveness of our proposed model designed for “Freeway Crash Classification under Varying Traffic Conditions” in comparison to prior research endeavors. Our model’s accomplishments are noteworthy and distinguish it prominently in this landscape. Primarily, our model has achieved a remarkable accuracy rate of 99%, surpassing the outcomes of most previous studies. For instance, in contrast to the commendable F-1 score of 94% reported by [
16], our model attains an even higher accuracy level. Similarly, when juxtaposed with the 91.7% accuracy achieved in the classification of traffic injury severity, as demonstrated by [
17] in
Table 8, our model exhibits superior performance, emphasizing its prowess in the field of crash classification. Furthermore, our model’s specialty lies in its purpose-built design for freeway crash classification within the dynamic context of varying traffic conditions. This singular focus enables our model to excel, resulting in higher accuracy rates compared to models designed for more generic transportation applications, such as predicting injury severity.
Distinguishing itself from prior research that often relied on single-model approaches, our model employs a powerful ensemble of advanced techniques. This ensemble includes Gradient Boosting, Cat Boost, XGBoost, LightGBM, and SGD. This strategic amalgamation harnesses the collective strengths of these models, elevating its predictive capabilities to new heights. A key attribute of our model is its capacity to leverage a diverse array of machine learning algorithms, each finely tuned to address specific conditions and data patterns. This diversity confers a robust framework for effectively overseeing the complex and ever-changing landscape of varying traffic conditions, resulting in superior performance. Beyond the statistics and algorithms, our model’s most profound impact lies in its potential to enhance road safety. The precision with which it predicts crash scenarios empowers authorities and systems to proactively implement preventive measures, thereby reducing accidents, and most importantly, saving lives. By demonstrating the effectiveness of ensemble learning techniques in the specialized context of freeway crash classification, our proposed model makes a valuable contribution to the field. This accomplishment has the potential to inspire and drive further research into the application of ensemble methods in the broader domain of transportation safety.
In general, the proposed analytical model stands out as an epitome of specialization, precision, and innovation in the field of transportation safety. With an astounding training accuracy rate of 99% and a testing accuracy of 96.1%, it sets a novel standard for the accurate prediction of freeway crashes. While prior research undeniably made substantial contributions to this domain, the exceptional performance of our model elevates it to a revolutionary force in the ongoing mission to improve road safety. This achievement holds the potential to save lives and mitigate accidents on highways.
6. Conclusions
This study introduced a boosting ensemble learning approach for classifying freeway crashes under varying traffic conditions. By optimizing the hyperparameters of the machine learning models, the study achieved a remarkable accuracy of 99% in predicting the severity of freeway crashes. Among the evaluated models, XGBoost and LightGBM demonstrated superior performance in terms of accuracy and efficiency. The feature importance analysis revealed that conditions such as icy roads and the absence or presence of brakes were the most influential factors in predicting crash severity. The optimized hyperparameters significantly improved the accuracy and stability of the models, which is crucial for real-world applications that require reliable predictions. The findings of this study provide valuable insights into the performance of ensemble learning models specifically tailored to the task of predicting crash severity. Researchers and practitioners in the field can benefit from these insights when developing road safety measures and strategies. Future work could involve the development of a real-time prediction system capable of providing timely alerts to drivers and authorities. Additionally, incorporating additional data sources such as weather and traffic information could further enhance the accuracy of the model. The proposed approach could also be extended to other transportation-related tasks, including traffic congestion prediction and accident prevention.
Author Contributions
The study was designed and conceptualized by A.A. (Abdulla Almahdi) and R.E.A.M., who also contributed to the methodology and data analysis. The experiments were performed, and the data were analyzed by A.N., R.E.A.M. and H.G., R.E.A.M., A.A. (Abdulla Almahdi), N.B. and A.J. wrote the algorithm, while the original draft of the manuscript was written by R.E.A.M., A.N., A.A. (Abdulla Almahdi), A.S.A., A.A. (Abeer Aljohani) with contributions from A.N. and H.G., who developed and implemented the software tools used in the study and contributedto data analysis and interpretation. A.N., A.J., R.E.A.M. and F.A., A.A. (Abdulla Almahdi), A.A. (Abeer Aljohani) and R.E.A.M. assisted with data curation, provided resources, and contributed to the study’s conceptualization. R.E.A.M., N.B., A.N. and H.G. wrote the medical review and created the visualizations. A.A. (Abdulla Almahdi) and R.E.A.M. supervised the study. All authors have read and agreed to the published version of the manuscript.
Funding
This research was funded by the Deanship of Scientific Research, King Khalid University, Kingdom of Saudi Arabia, under grant number RGP.2/342/44.
Institutional Review Board Statement
Not applicable.
Informed Consent Statement
Not applicable.
Data Availability Statement
Data sharing does not apply to this article, as no datasets were generated during the current study.
Conflicts of Interest
The authors declare no conflict of interest.
References
- Mohammed, A.A.; Ambak, K.; Mosa, A.M.; Syamsunur, D. A review of traffic accidents and related practices worldwide. Open Transp. J. 2019, 13, 65–83. [Google Scholar] [CrossRef]
- World Health Organization. Global Status Report on Road Safety; World Health Organization: Geneva, Switzerland, 2018.
- Andersson, R.; Menckel, E. On the prevention of accidents and injuries: A comparative analysis of conceptual frameworks. Accid. Anal. Prev. 1995, 27, 757–768. [Google Scholar] [CrossRef] [PubMed]
- Assi, K. Traffic Crash Severity Prediction—A Synergy by Hybrid Principal Component Analysis and Machine Learning Models. Int. J. Environ. Res. Public Health 2020, 17, 7598. [Google Scholar] [CrossRef] [PubMed]
- Khattak, A.J.; Council, F.M.; Zegeer, C.V. Analysis of factors influencing motor vehicle crash frequencies and severities. Transp. Res. Rec. 2003, 1828, 9–15. [Google Scholar]
- Akhtar, S.; Ahmed, A.; Ali, S.; Ahmed, M. Assessment of factors contributing to the occurrence of road traffic accidents: A case study of Lahore, Pakistan. J. Traffic Transp. Eng. 2020, 7, 477–487. [Google Scholar]
- Elvik, R. Speed and road accidents: An evaluation of the Power Model. Transp. Res. Part F Traffic Psychol. Behav. 2013, 20, 111–118. [Google Scholar]
- Peden, M.; Scurfield, R.; Sleet, D.; Mohan, D.; Hyder, A.A.; Jarawan, E.; Mathers, C. (Eds.) World Report on Road Traffic Injury Prevention; World Health Organization: Geneva, Switzerland, 2004.
- Jägerbrand, A.K.; Elvik, R. The effects of fences and wildlife warning reflectors on the number of wildlife-vehicle collisions: A meta-analysis. J. Environ. Manag. 2016, 183, 711–718. [Google Scholar]
- Zha, Y.; Deng, J.; Qiu, Y.; Zhang, K.; Wang, Y. A Survey of Intelligent Driving Vehicle Trajectory Tracking Based on Vehicle Dynamics. SAE Int. J. Veh. Dyn. Stability NVH 2023, 7, 221–248. [Google Scholar] [CrossRef]
- He, X.; Chen, J.; Tang, D.Y.; Peng, S.; Tang, B. Using an Inerter-Based Suspension to Reduce Carbody Flexible Vibration and Improve Riding-Comfort. SAE Int. J. Veh. Dyn. Stability NVH 2023, 7, 137–151. [Google Scholar] [CrossRef]
- Cerwick, D.M.; Gkritza, K.; Shaheed, M.S.; Hans, Z. A comparison of the mixed logit and latent class methods for crash severity analysis. Anal. Methods Accid. Res. 2014, 3–4, 11–27. [Google Scholar] [CrossRef]
- Haghighi, N.; Liu, X.C.; Zhang, G.; Porter, R.J. Impact of roadway geometric features on crash severity on rural two-lane highways. Accid. Anal. Prev. 2018, 111, 34–42. [Google Scholar] [CrossRef] [PubMed]
- Aziz, H.A.; Ukkusuri, S.V.; Hasan, S. Exploring the determinants of pedestrian–vehicle crash severity in New York City. Accid. Anal. Prev. 2013, 50, 1298–1309. [Google Scholar] [CrossRef] [PubMed]
- Nabi, M.N.; Ray, B.; Rashid, F.; Al Hussam, W.; Muyeen, S.M. Parametric analysis and prediction of energy consumption of electric vehicles using machine learning. J. Energy Storage 2023, 72, 108226. [Google Scholar] [CrossRef]
- Tao, W.; Aghaabbasi, M.; Ali, M.; Almaliki, A.H.; Zainol, R.; Almaliki, A.A.; Hussein, E.E. An Advanced Machine Learning Approach to Predicting Pedestrian Fatality Caused by Road Crashes: A Step toward Sustainable Pedestrian Safety. Sustainability 2022, 14, 2436. [Google Scholar] [CrossRef]
- Chang, L.-Y.; Wang, H.-W. Analysis of traffic injury severity: An application of non-parametric classification tree techniques. Accid. Anal. Prev. 2006, 38, 1019–1027. [Google Scholar] [CrossRef] [PubMed]
- Abdel-Aty, M.A.; Abdelwahab, H.T. Predicting Injury Severity Levels in Traffic Crashes: A Modeling Comparison. J. Transp. Eng. 2004, 130, 204–210. [Google Scholar] [CrossRef]
- Delen, D.; Sharda, R.; Bessonov, M. Identifying significant predictors of injury severity in traffic accidents using a series of artificial neural networks. Accid. Anal. Prev. 2006, 38, 434–444. [Google Scholar] [CrossRef]
- Alkheder, S.; Taamneh, M.; Taamneh, S. Severity Prediction of Traffic Accident Using an Artificial Neural Network. J. Forecast. 2017, 36, 100–108. [Google Scholar] [CrossRef]
- Zhang, J.; Li, Z.; Pu, Z.; Xu, C. Comparing Prediction Performance for Crash Injury Severity Among Various Machine Learning and Statistical Methods. IEEE Access 2018, 6, 60079–60087. [Google Scholar] [CrossRef]
- Iranitalab, A.; Khattak, A. Comparison of four statistical and machine learning methods for crash severity prediction. Accid. Anal. Prev. 2017, 108, 27–36. [Google Scholar] [CrossRef]
- Ullah, I.; Liu, K.; Yamamoto, T.; Shafiullahm, M.; Jamal, A. Grey wolf optimizer-based machine learning algorithm to predict electric vehicle charging duration time. Transp. Lett. 2022, 15, 889–906. [Google Scholar] [CrossRef]
- Elyassami, S.; Hamid, Y.; Habuza, T. Road crashes analysis and prediction using gradient boosted and random forest trees. In Proceedings of the 2020 6th IEEE Congress on Information Science and Technology (CiSt), Agadir-Essaouira, Morocco, 5–12 June 2021; pp. 520–525. [Google Scholar]
- Almadi, A.I.M.; Al Mamlook, R.E.; Ullah, I.; Alshboul, O.; Bandara, N.; Shehadeh, A. Vehicle collisions analysis on highways based on multi-user driving simulator and multinomial logistic regression model on US highways in Michigan. Int. J. Crashworthiness 2022, 1–16. [Google Scholar] [CrossRef]
- Mousa, S.R.; Bakhit, P.R.; Ishak, S. An extreme gradient boosting method for identifying the factors contributing to crash/near-crash events: A naturalistic driving study. Can. J. Civ. Eng. 2019, 46, 712–721. [Google Scholar] [CrossRef]
- Li, K.; Xu, H.; Liu, X. Analysis and visualization of accidents severity based on LightGBM-TPE. Chaos Solitons Fractals 2022, 157, 111987. [Google Scholar] [CrossRef]
- Guo, M.; Yuan, Z.; Janson, B.; Peng, Y.; Yang, Y.; Wang, W. Older Pedestrian Traffic Crashes Severity Analysis Based on an Emerging Machine Learning XGBoost. Sustainability 2021, 13, 926. [Google Scholar] [CrossRef]
- Parsa, A.B.; Movahedi, A.; Taghipour, H.; Derrible, S.; Mohammadian, A.K. Toward safer highways, application of XGBoost and SHAP for real-time accident detection and feature analysis. Accid. Anal. Prev. 2020, 136, 105405. [Google Scholar] [CrossRef]
- Ma, J.; Ding, Y.; Cheng, J.C.P.; Tan, Y.; Gan, V.J.L.; Zhang, J. Analyzing the Leading Causes of Traffic Fatalities Using XGBoost and Grid-Based Analysis: A City Management Perspective. IEEE Access 2019, 7, 148059–148072. [Google Scholar] [CrossRef]
- Samy, M.; Almamlook, R.E.; Elkhouly, H.I.; Barakat, S. Decision-making and optimal design of green energy system based on statistical methods and artificial neural network approaches. Sustain. Cities Soc. 2022, 84, 104015. [Google Scholar] [CrossRef]
- Almadi, A.I.M.; Al Mamlook, R.E.; Almarhabi, Y.; Ullah, I.; Jamal, A.; Bandara, N. A Fuzzy-Logic Approach Based on Driver Decision-Making Behavior Modeling and Simulation. Sustainability 2022, 14, 8874. [Google Scholar] [CrossRef]
- AlMamlook, R.E.; Kwayu, K.M.; Alkasisbeh, M.R.; Frefer, A.A. Comparison of machine learning algorithms for predicting traffic accident severity. In Proceedings of the 2019 IEEE Jordan International Joint Conference on Electrical Engineering and Information Technology (JEEIT), Amman, Jordan, 9–11 April 2019; pp. 272–276. [Google Scholar]
- Al Mamlook, R.E.; Abdulhameed, T.Z.; Hasan, R.; Al-Shaikhli, H.I.; Mohammed, I.; Tabatabai, S. Utilizing machine learning models to predict the car crash injury severity among elderly drivers. In Proceedings of the 2020 IEEE International Conference on Electro Information Technology (EIT), Chicago, IL, USA, 31 July–1 August 2020; pp. 105–111. [Google Scholar]
- Al Mamlook, R.E.; Ali, A.; Hasan, R.A.; Kazim, H.A.M. Machine learning to predict the freeway traffic accidents-based driving simulation. In Proceedings of the 2019 IEEE National Aerospace and Electronics Conference (NAECON), Dayton, OH, USA, 15–19 July 2019. [Google Scholar]
- Zou, M.; Jiang, W.-G.; Qin, Q.-H.; Liu, Y.-C.; Li, M.-L. Optimized XGBoost Model with Small Dataset for Predicting Relative Density of Ti-6Al-4V Parts Manufactured by Selective Laser Melting. Materials 2022, 15, 5298. [Google Scholar] [CrossRef]
- Li, B.; Chen, G.; Si, Y.; Zhou, X.; Li, P.; Li, P.; Fadiji, T. GNSS/INS Integration Based on Machine Learning LightGBM Model for Vehicle Navigation. Appl. Sci. 2022, 12, 5565. [Google Scholar] [CrossRef]
Figure 1.
Drive in dry, wet, snowy, and icy road conditions.
Figure 1.
Drive in dry, wet, snowy, and icy road conditions.
Figure 2.
Field of study on Michigan I-69 in Flint.
Figure 2.
Field of study on Michigan I-69 in Flint.
Figure 3.
A flow chart of the proposed approach.
Figure 3.
A flow chart of the proposed approach.
Figure 4.
Driving simulator software.
Figure 4.
Driving simulator software.
Figure 5.
Location of crashes in I-94.
Figure 5.
Location of crashes in I-94.
Figure 6.
Gradient Boosting (GBoost).
Figure 6.
Gradient Boosting (GBoost).
Figure 9.
Age group of drivers.
Figure 9.
Age group of drivers.
Figure 10.
Descriptive statistics of pre-experiment questionnaire.
Figure 10.
Descriptive statistics of pre-experiment questionnaire.
Figure 11.
Correlation matrix.
Figure 11.
Correlation matrix.
Figure 12.
Feather importance.
Figure 12.
Feather importance.
Figure 13.
Comparison of machine learning models.
Figure 13.
Comparison of machine learning models.
Figure 14.
Comparison of metrics of ML models.
Figure 14.
Comparison of metrics of ML models.
Figure 15.
Confusion matrix (a–e).
Figure 15.
Confusion matrix (a–e).
Table 1.
Features of driving simulator scenarios for the study.
Table 1.
Features of driving simulator scenarios for the study.
| Scenario | Design
Speed | Direction (Exit 138–139) | Weather | Road Surface | Driving Simulator Scenarios |
|---|
| Condition | μ Tire |
|---|
Scenario1
Scenario3 | 80
70 | eastbound | clear | dry | 0.95 | Vehicle lane merge (LM) and hit object (HO) |
Scenario2
Scenario4 | 80
70 | westbound | cloudy, rain | wet | 0.55 | Vehicle slowed down (SD) and change lane (CL) |
| Scenario5 | 70 | eastbound | snow | snow | 0.20 | Drive in snow weather
and snow road condition |
| Scenario6 | 70 | eastbound | clear | icy | 0.10 | Drive in clear weather and icy condition |
| Scenario7 | 50 | eastbound | snow | snow | 0.20 | Drive in snow weather snow condition |
| Scenario8 | 50 | westbound | clear | icy | 0.10 | Drive in clear weather and icy condition |
| Scenario9 | 40 | eastbound | snow | snow | 0.20 | Drive in snow weather snow condition |
| Scenario10 | 40 | westbound | clear | icy | 0.10 | Drive in clear weather and icy condition |
Table 2.
Description of Variables in the Crash Dataset.
Table 2.
Description of Variables in the Crash Dataset.
| ID | Variable | Type of Variable | Variable Levels | Description |
|---|
| 1 | Age | Numerical | - | 18–55 |
| 2 | Sex | Categorical | Female; Male | Gender |
| 3 | Brake Response | Categorical | No brake = 0; one Brakes = 1; Two Brakes = 2 | The value could be 0 if drivers did not press the brake, 1 if driver breaked once, and 2 if driver breaked twice. |
| 4 | Speed Limit | Categorical | | Speed limit depended on weather |
| 5 | Speeding | Categorical | 40, 50, and 70 | The average subject speed. It is measured in miles/hour |
| 6 | Weather Condition | Categorical | Clear = 1; Icy = 4
Wet = 2; Snow = 3 | Road surface |
| 7 | Frictional Coefficient | Numerical | 0.1; 0.3, 0.55, 0.95 | The friction coefficient for the tire |
| 8 | Crash | Categorical | No; crash 1, crash 2, crash 3 | Drivers did not crash or crashed once, twice, or three times |
Table 3.
Optimized hyperparameters for ML classifier models.
Table 3.
Optimized hyperparameters for ML classifier models.
| ML Model | Parameters | Range | Best Values |
|---|
| Gradient Boost | n_estimators | [50, 100, 200] | 300 |
| Learning rate | [0.1, 0.5, 1] | 0.1 |
| Max depth | [3, 5, 7] | 3 |
| XGBoost | n_estimators | [100, 200, 300] | 300 |
| learning_rate | [0.1, 0.01, 0.001 | 0.1 |
| max_depth | [3, 5, 7] | 7 |
| subsample | [0.8, 1.0] | 0.8 |
| colsample_bytree | [0.8, 1.0] | 0.8 |
| gamma | [0, 1, 5] | 0 |
| CatBoost | iterations | [100, 200, 300] | 300 |
| learning_rate | [0.1, 0.01, 0.001] | 0.1 |
| depth | [3, 5, 7] | 7 |
| LightGBM | n_estimators | [100, 200, 300] | 200 |
| learning_rate | [0.1, 0.01, 0.001] | 0.1 |
| max_depth | [3, 5, 7] | 7 |
| min_child_samples | [10, 20, 30] | 10 |
| num_leaves | [31, 63, 127] | 127 |
| SGD | alpha | [0.0001, 0.001, 0.01] | 0.01 |
| l1_ratio | [0.15, 0.5, 0.85] | 0.15 |
Table 4.
Confusion matrix of the multiple crash classes.
Table 4.
Confusion matrix of the multiple crash classes.
| | Predicted Class |
|---|
| Actual Class | Classifier
Model | Positive
Three Crashes | Positive
Two Crashes | Positive
One Crash | Negative
No Crash |
Positive
Three Crashes | True Positive (TP) | True Positive (TP) | True Positive (TP) | False Negative
(FN) |
Positive
Two Crashes | True Positive (TP) | True Positive (TP) | True Positive (TP) | False Negative
(FN) |
Positive
One Crash | True Positive (TP) | True Positive (TP) | True Positive (TP) | False Negative
(FN) |
Negative
No Crash | False Positive (FP) | False Positive (FP) | False Positive (FP) | True Negative
(TN) |
Table 5.
Descriptive statistics of simulation driver model.
Table 5.
Descriptive statistics of simulation driver model.
| Driver Characteristics | Mean | StDev | Variance | Skewness | Kurtosis |
|---|
| BB. HO | 7700 | 0.26672 | 0.07114 | 3.18 | 8.12 |
| Crash | 7480 | 1.1983 | 1.4359 | 1.16 | −0.45 |
| Drivr.speed | 57.009 | 12.686 | 160.940 | −0.03 | −0.87 |
| Road.speed | 62.000 | 14.704 | 216.216 | −0.35 | −1.42 |
| Condition | 2.7000 | 1.1006 | 1.2112 | −0.29 | −1.24 |
| M.tire | 2.3000 | 1.1006 | 1.2112 | 0.29 | −1.24 |
Table 6.
The performance results of the machine learning model for crash prediction with K-Folds.
Table 6.
The performance results of the machine learning model for crash prediction with K-Folds.
| K-Fold | Evalution Metrics | Gradient Boost | XGBoost | CatBoost | LightGBM | SGD |
|---|
| K = 5 | Testing Accuracy | 0.961 | 0.950 | 0.910 | 0.942 | 0.594 |
| Training Accuracy | 0.991 | 0.993 | 0.931 | 0.980 | 0.604 |
| K = 7 | Testing Accuracy | 0.953 | 0.956 | 0.905 | 0.947 | 0.584 |
| Training Accuracy | 0.986 | 0.993 | 0.930 | 0.978 | 0.591 |
| K = 10 | Testing Accuracy | 0.951 | 0.947 | 0.900 | 0.942 | 0.575 |
| Training Accuracy | 0.984 | 0.979 | 0.926 | 0.974 | 0.588 |
Table 7.
Mean and standard deviation models.
Table 7.
Mean and standard deviation models.
| Model | Metric | Mean | Standard Deviation |
|---|
| Gradient Boost | Testing Accuracy | 0.871 | 0.140 |
| Training Accuracy | 0.900 | 0.150 |
| XG Boosst | Testing Accuracy | 0.868 | 0.143 |
| Training Accuracy | 0.897 | 0.155 |
| CatBoosst | Testing Accuracy | 0.855 | 0.141 |
| Training Accuracy | 0.870 | 0.142 |
| LightGBM | Testing Accuracy | 0.870 | 0.147 |
| Training Accuracy | 0.899 | 0.155 |
| SGD | Testing Accuracy | 0.586 | 0.154 |
| Training Accuracy | 0.596 | 0.157 |
Table 8.
Comparison with other studies.
Table 8.
Comparison with other studies.
| Ref. | Methodology | Application | Result |
|---|
| [15] | (DT), (RF), (KNN) and ensemble stacked generalization (ESG) | Electric vehicle energy consumption prediction | MAE of 0.010
MSE of 0.0002
RMSE of 0.016
MAPE of 6.45
|
| [16] | Bayesian neural network | Predicting pedestrian fatality caused by road crashes | F-1 of 94%
AUC of 84% |
| [17] | Classification and regression tree (CART) | Traffic injury severity | Accuracy of 91.7% |
| [18] | Multilayer perceptron (MLP) and fuzzy adaptive resonance theory (ART) | Predicting injury severity levels in traffic crashes | Accuracy of 73.5% |
| [19] | ANN | Predictors of injury severity in traffic accidents | Overall mean of 89.34 |
| [20] | ANN | Prediction of traffic accident | Accuracy of 74.6% |
| [21] | K-Nearest Neighbor, Decision Tree, Random Forest (RF), and Support Vector Machine. | Prediction performance for crash injury severity | Overall mean of 53.9% |
| [23] | Grey wolf optimizer-based machine learning algorithm | Predicting electric vehicle charging duration time | |
| Proposed | GradientBoosting, CatBoost, XGBoost, LightGBM, and SGD | Freeway crash classification under varying traffic conditions | Accuracy of 99% |
| Disclaimer/Publisher’s Note: The statements, opinions and data contained in all publications are solely those of the individual author(s) and contributor(s) and not of MDPI and/or the editor(s). MDPI and/or the editor(s) disclaim responsibility for any injury to people or property resulting from any ideas, methods, instructions or products referred to in the content. |
© 2023 by the authors. Licensee MDPI, Basel, Switzerland. This article is an open access article distributed under the terms and conditions of the Creative Commons Attribution (CC BY) license (https://creativecommons.org/licenses/by/4.0/).


 ,
, 
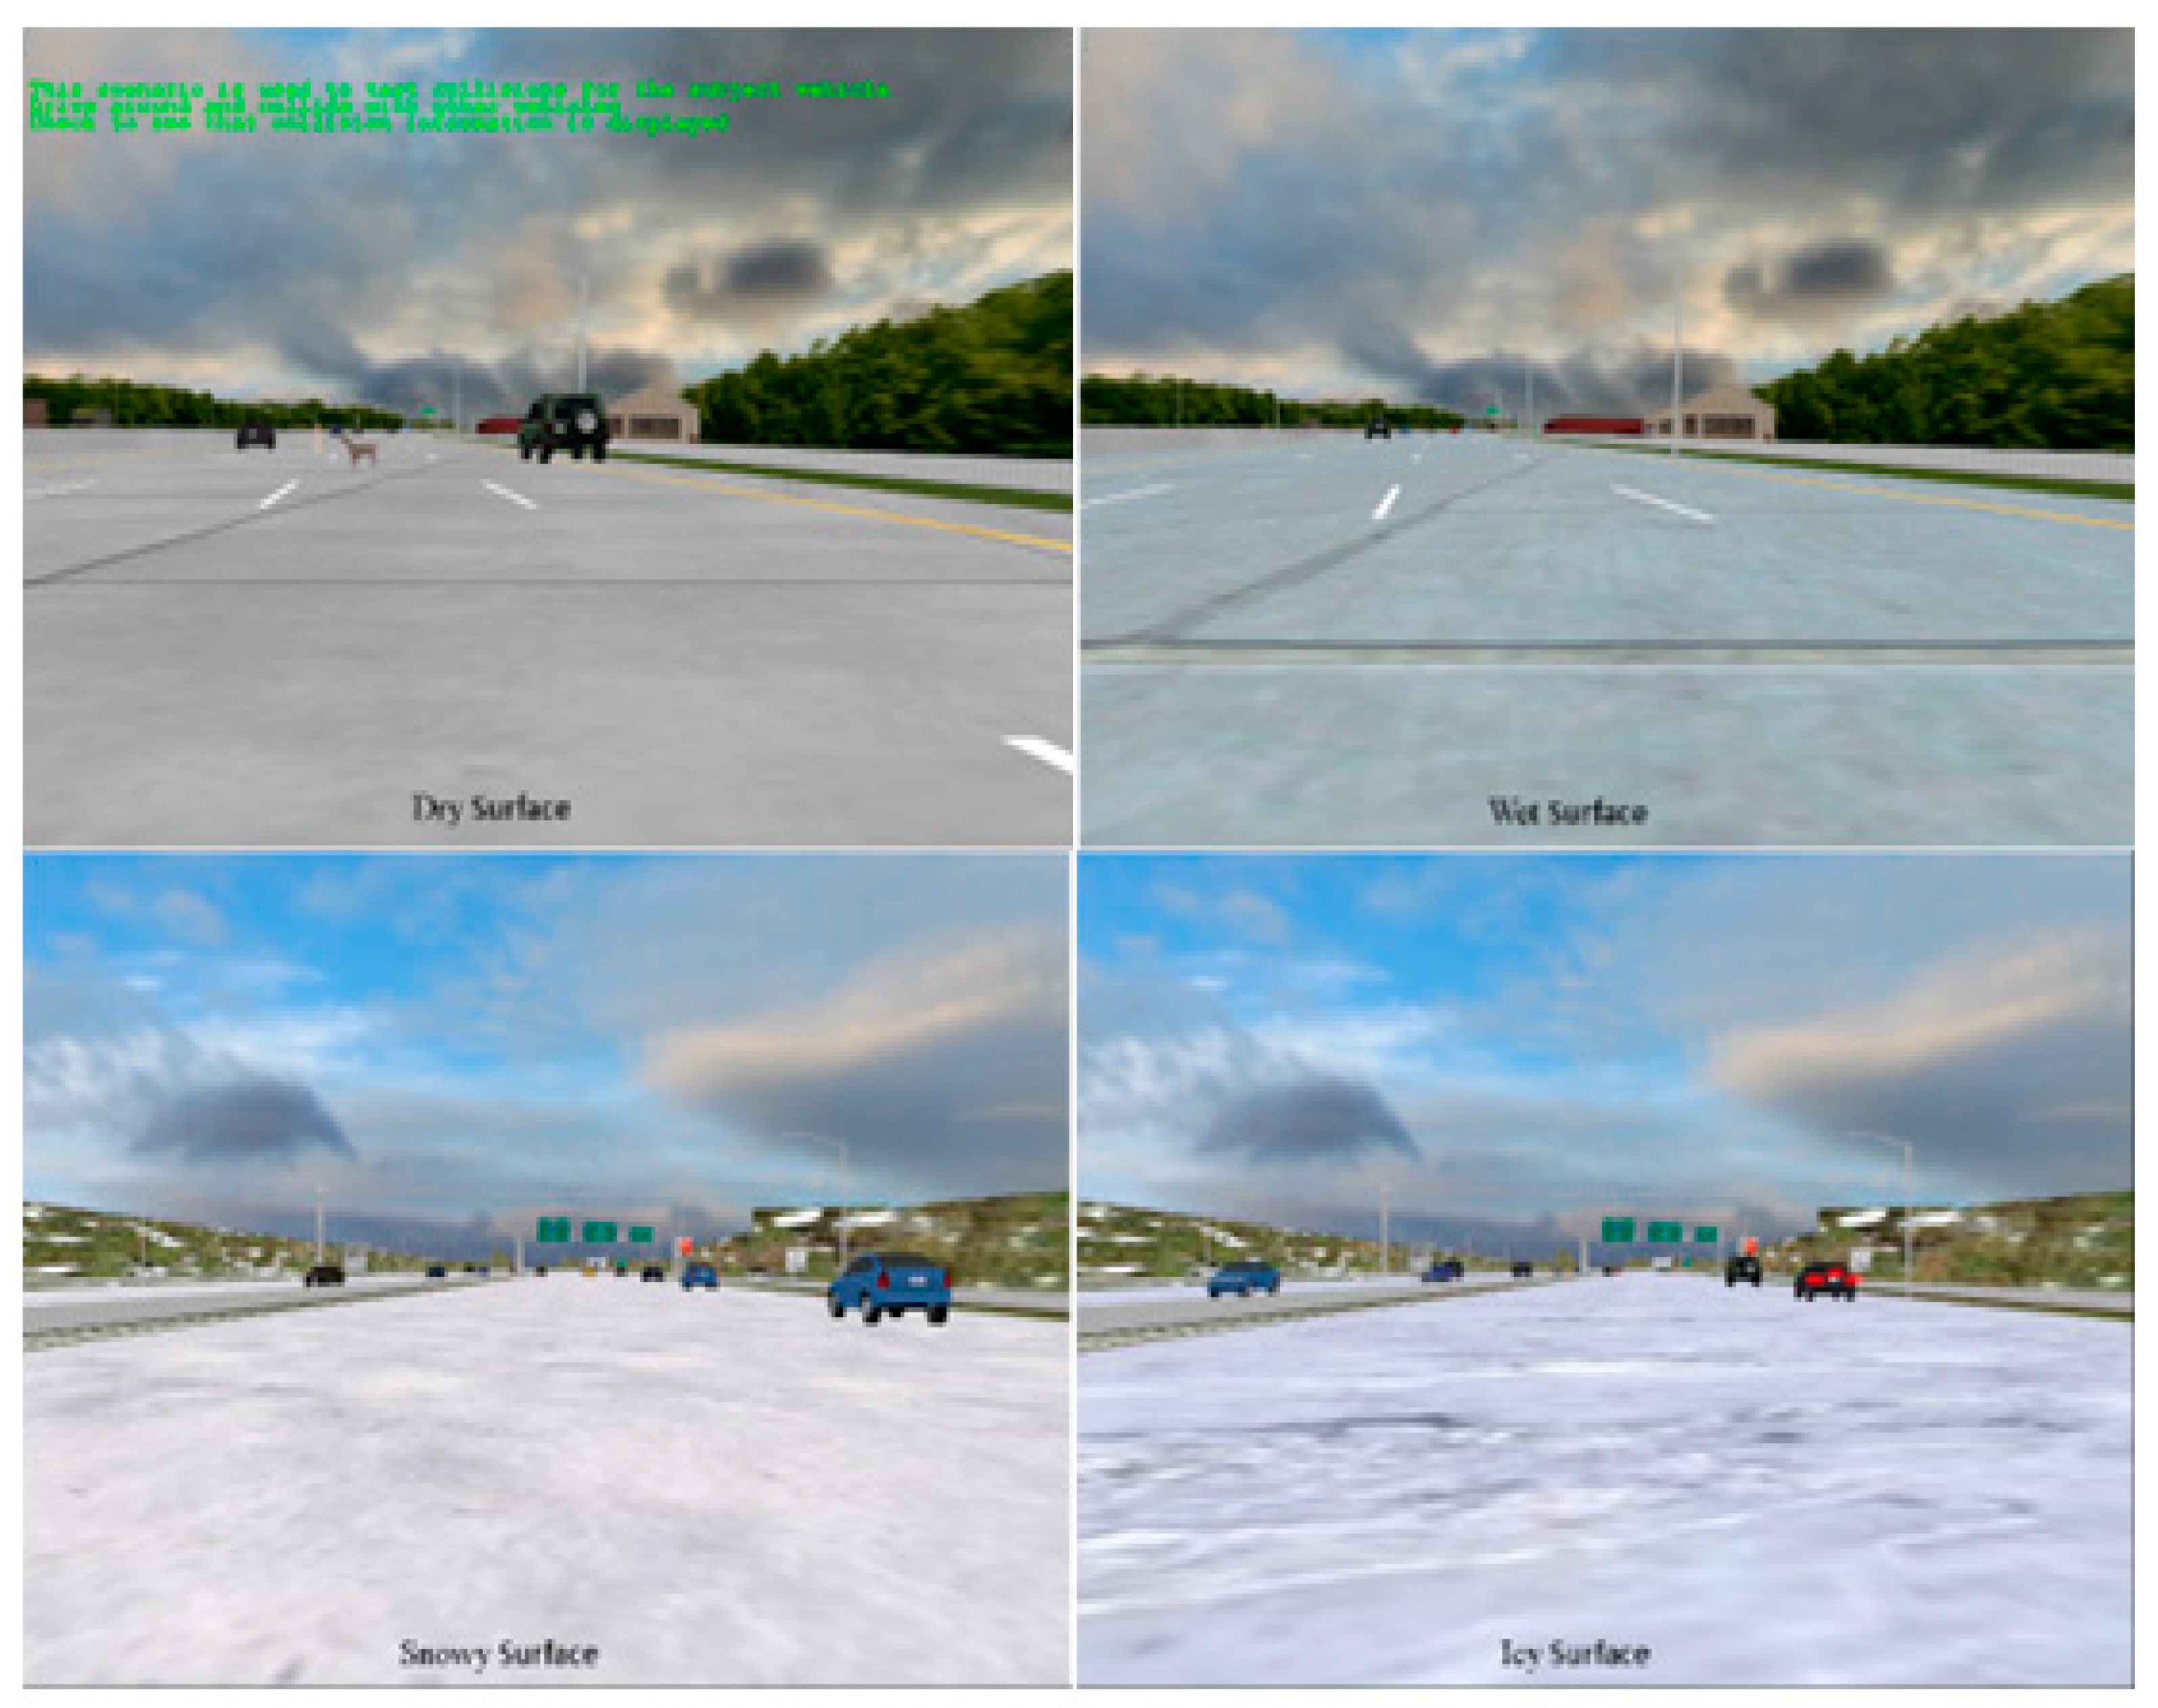
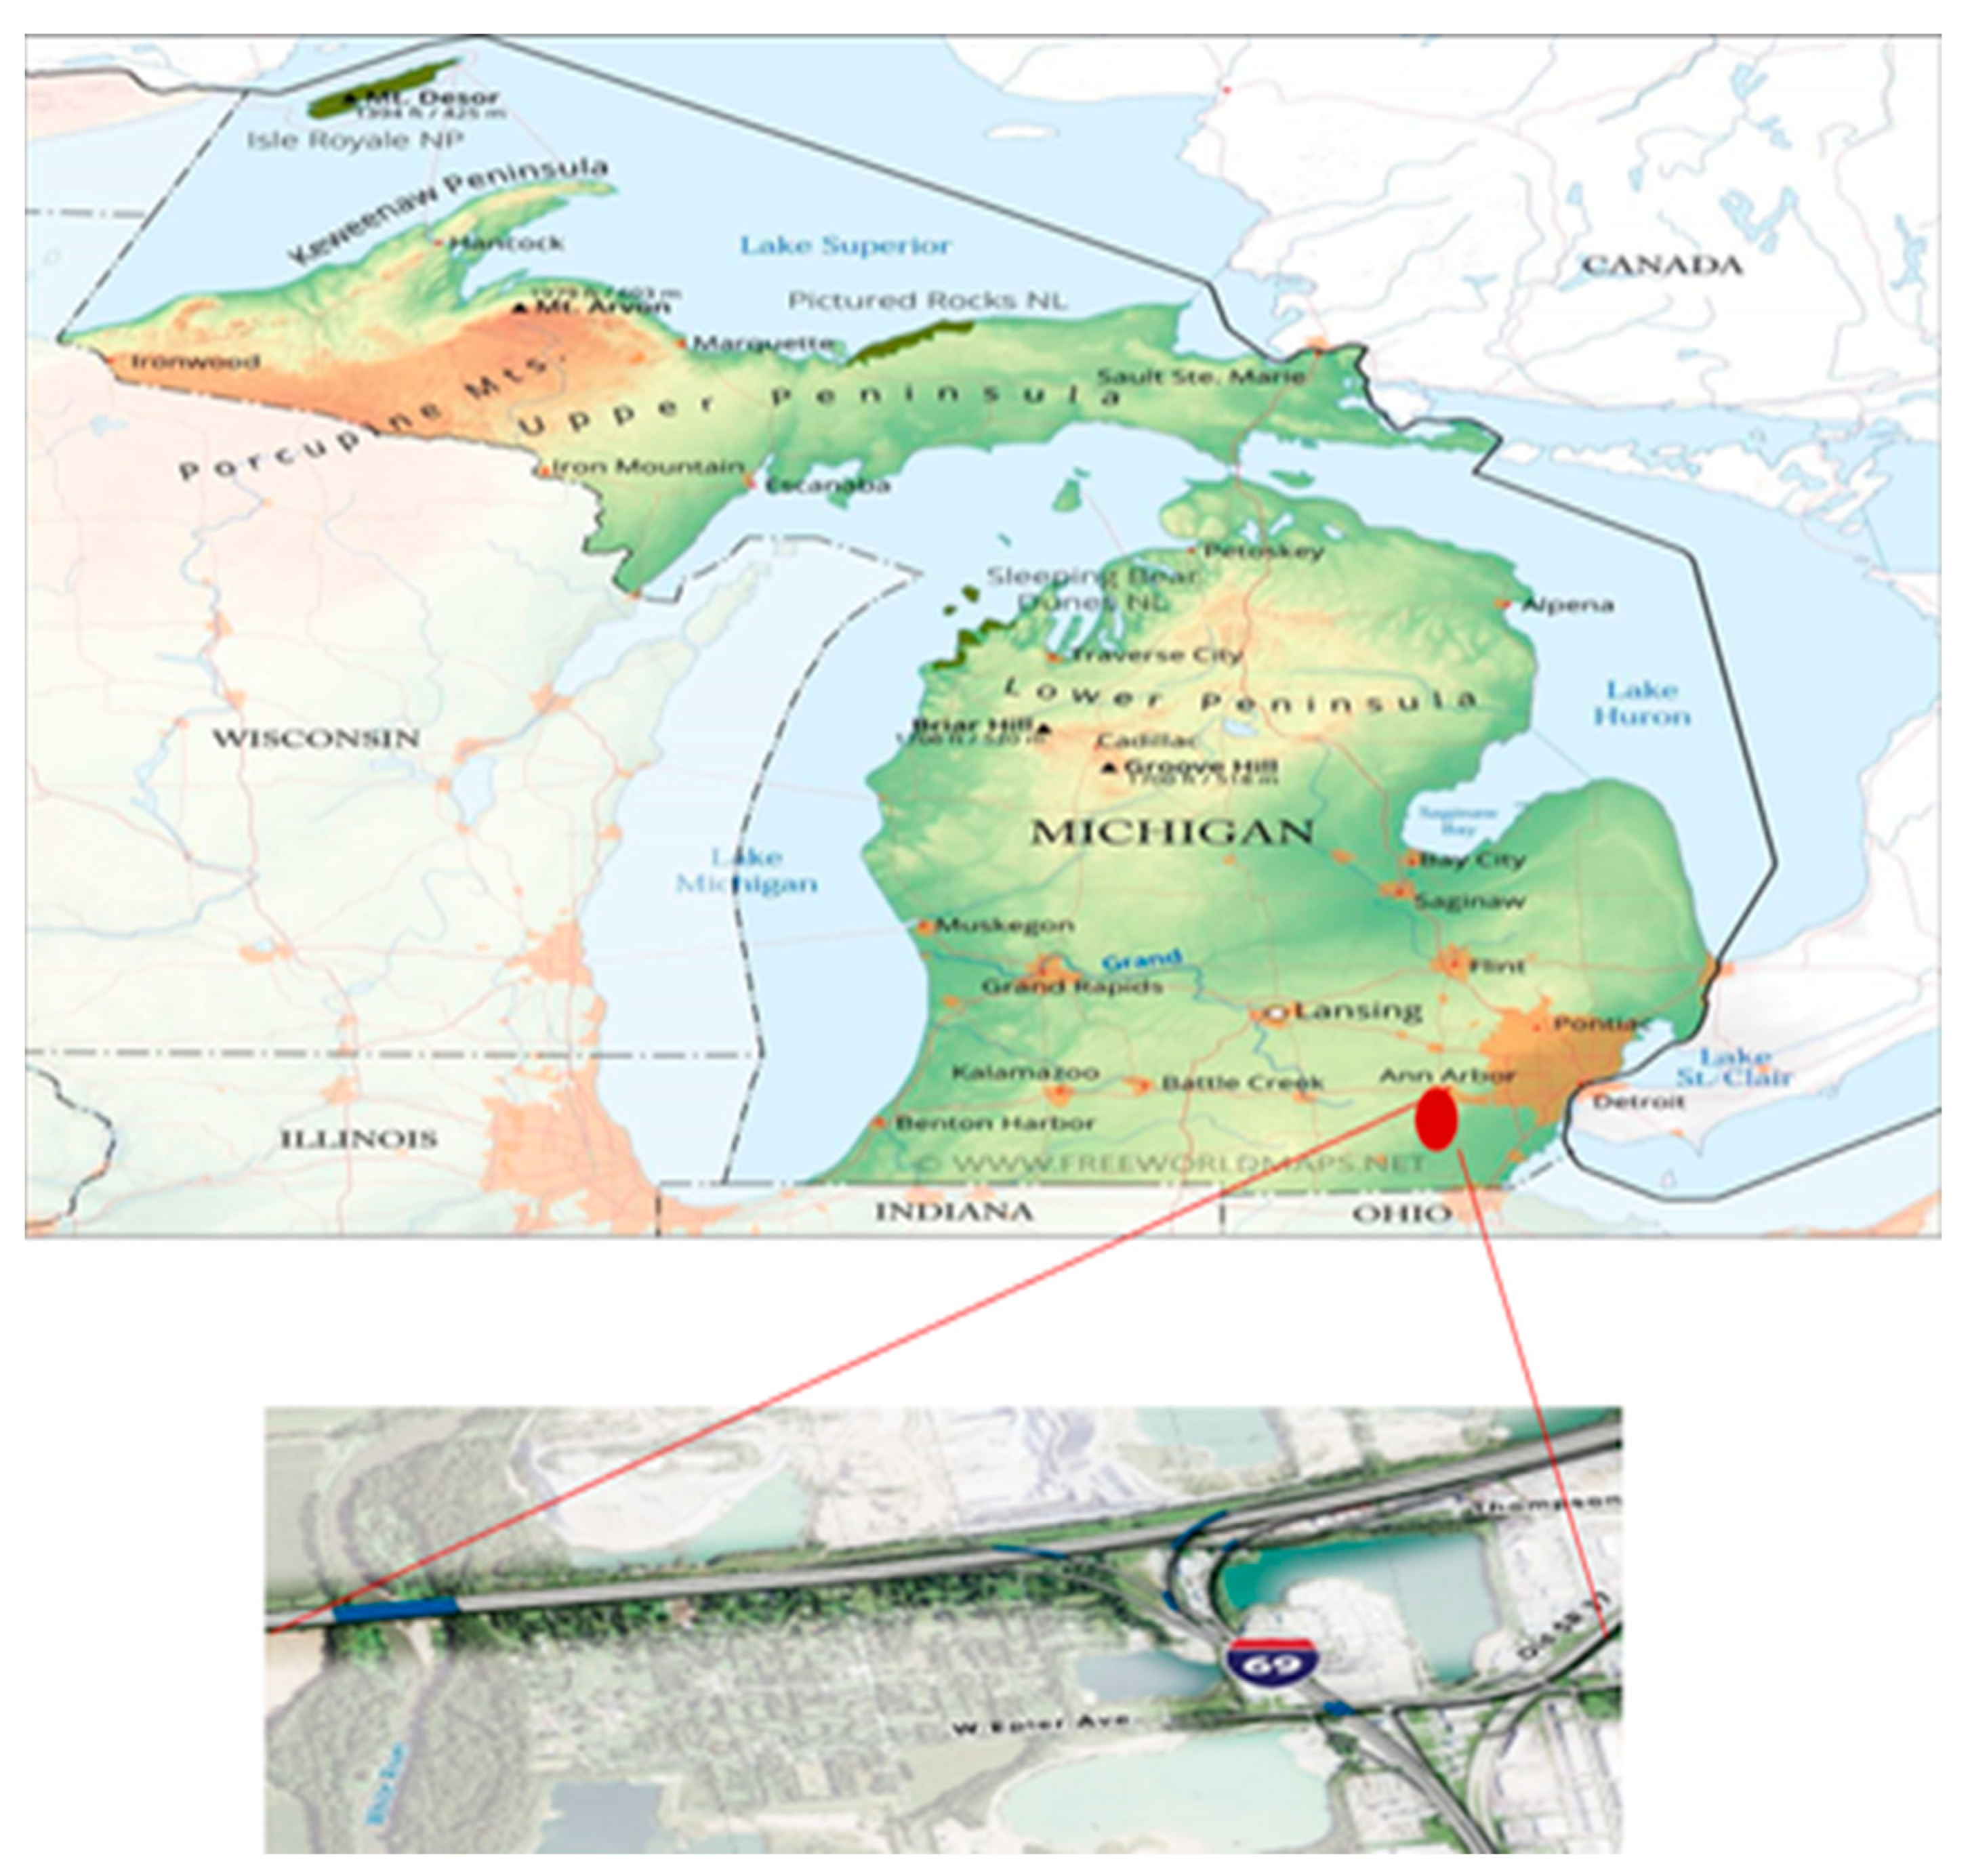

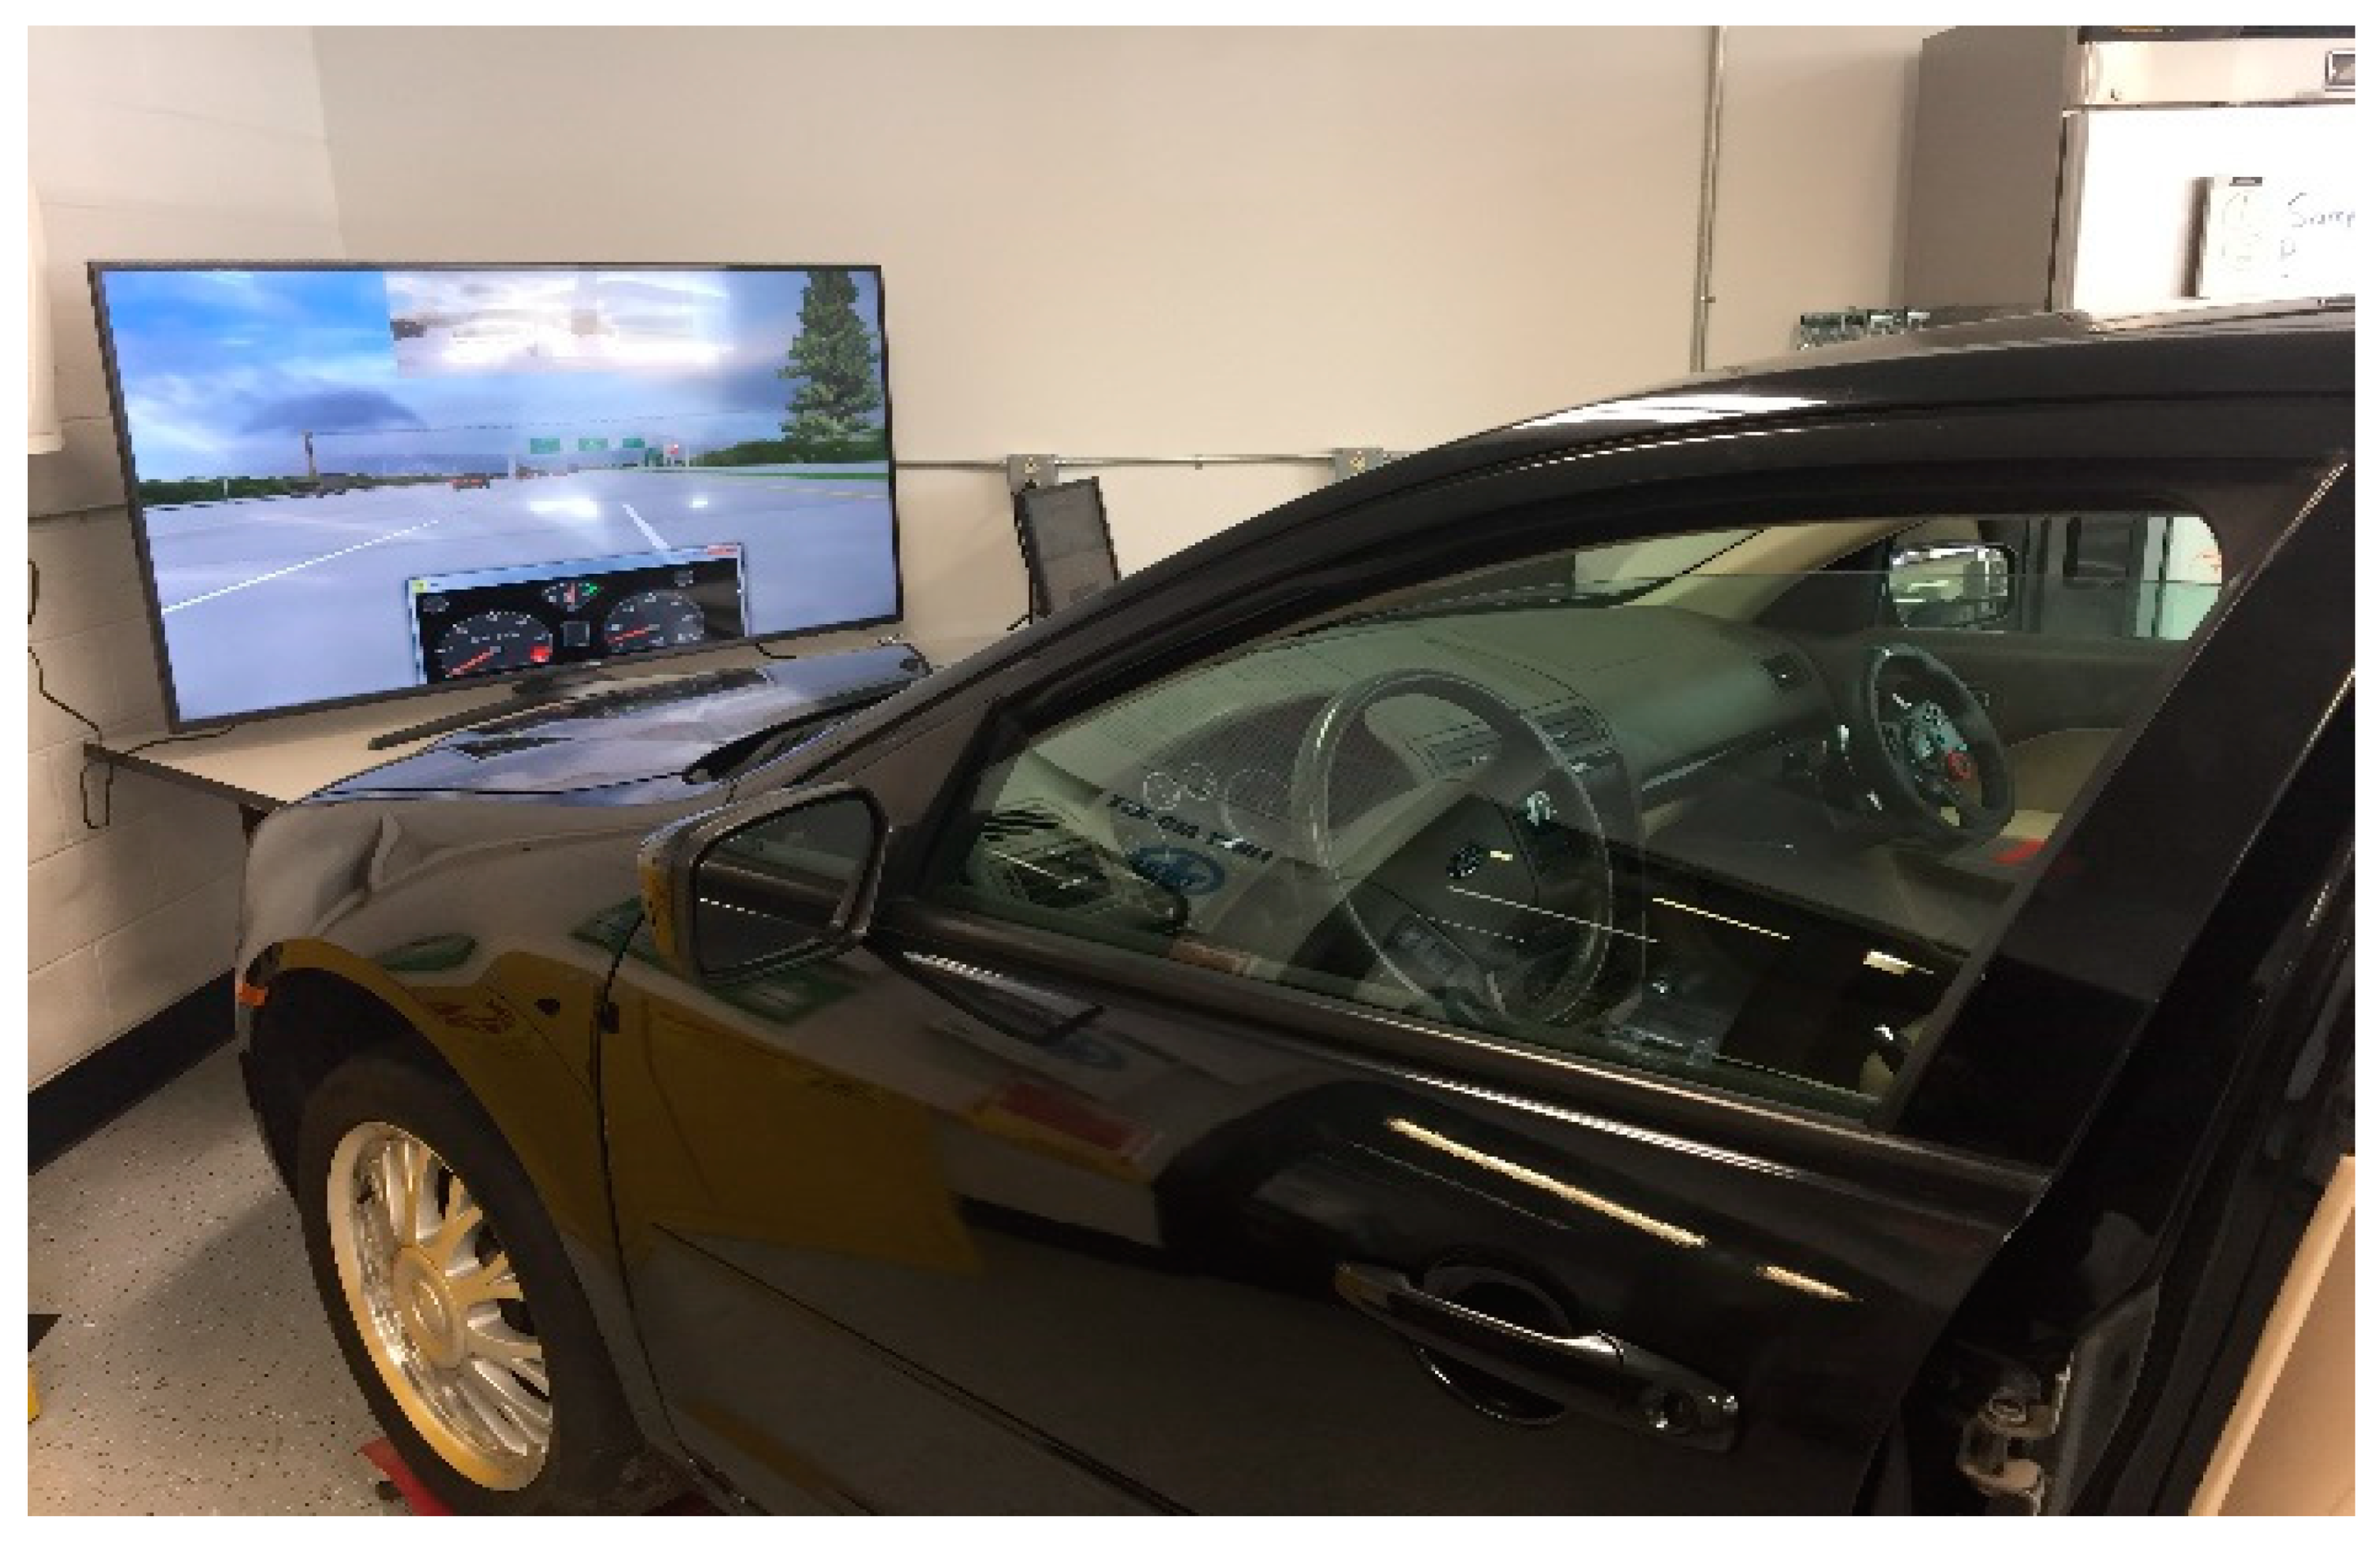
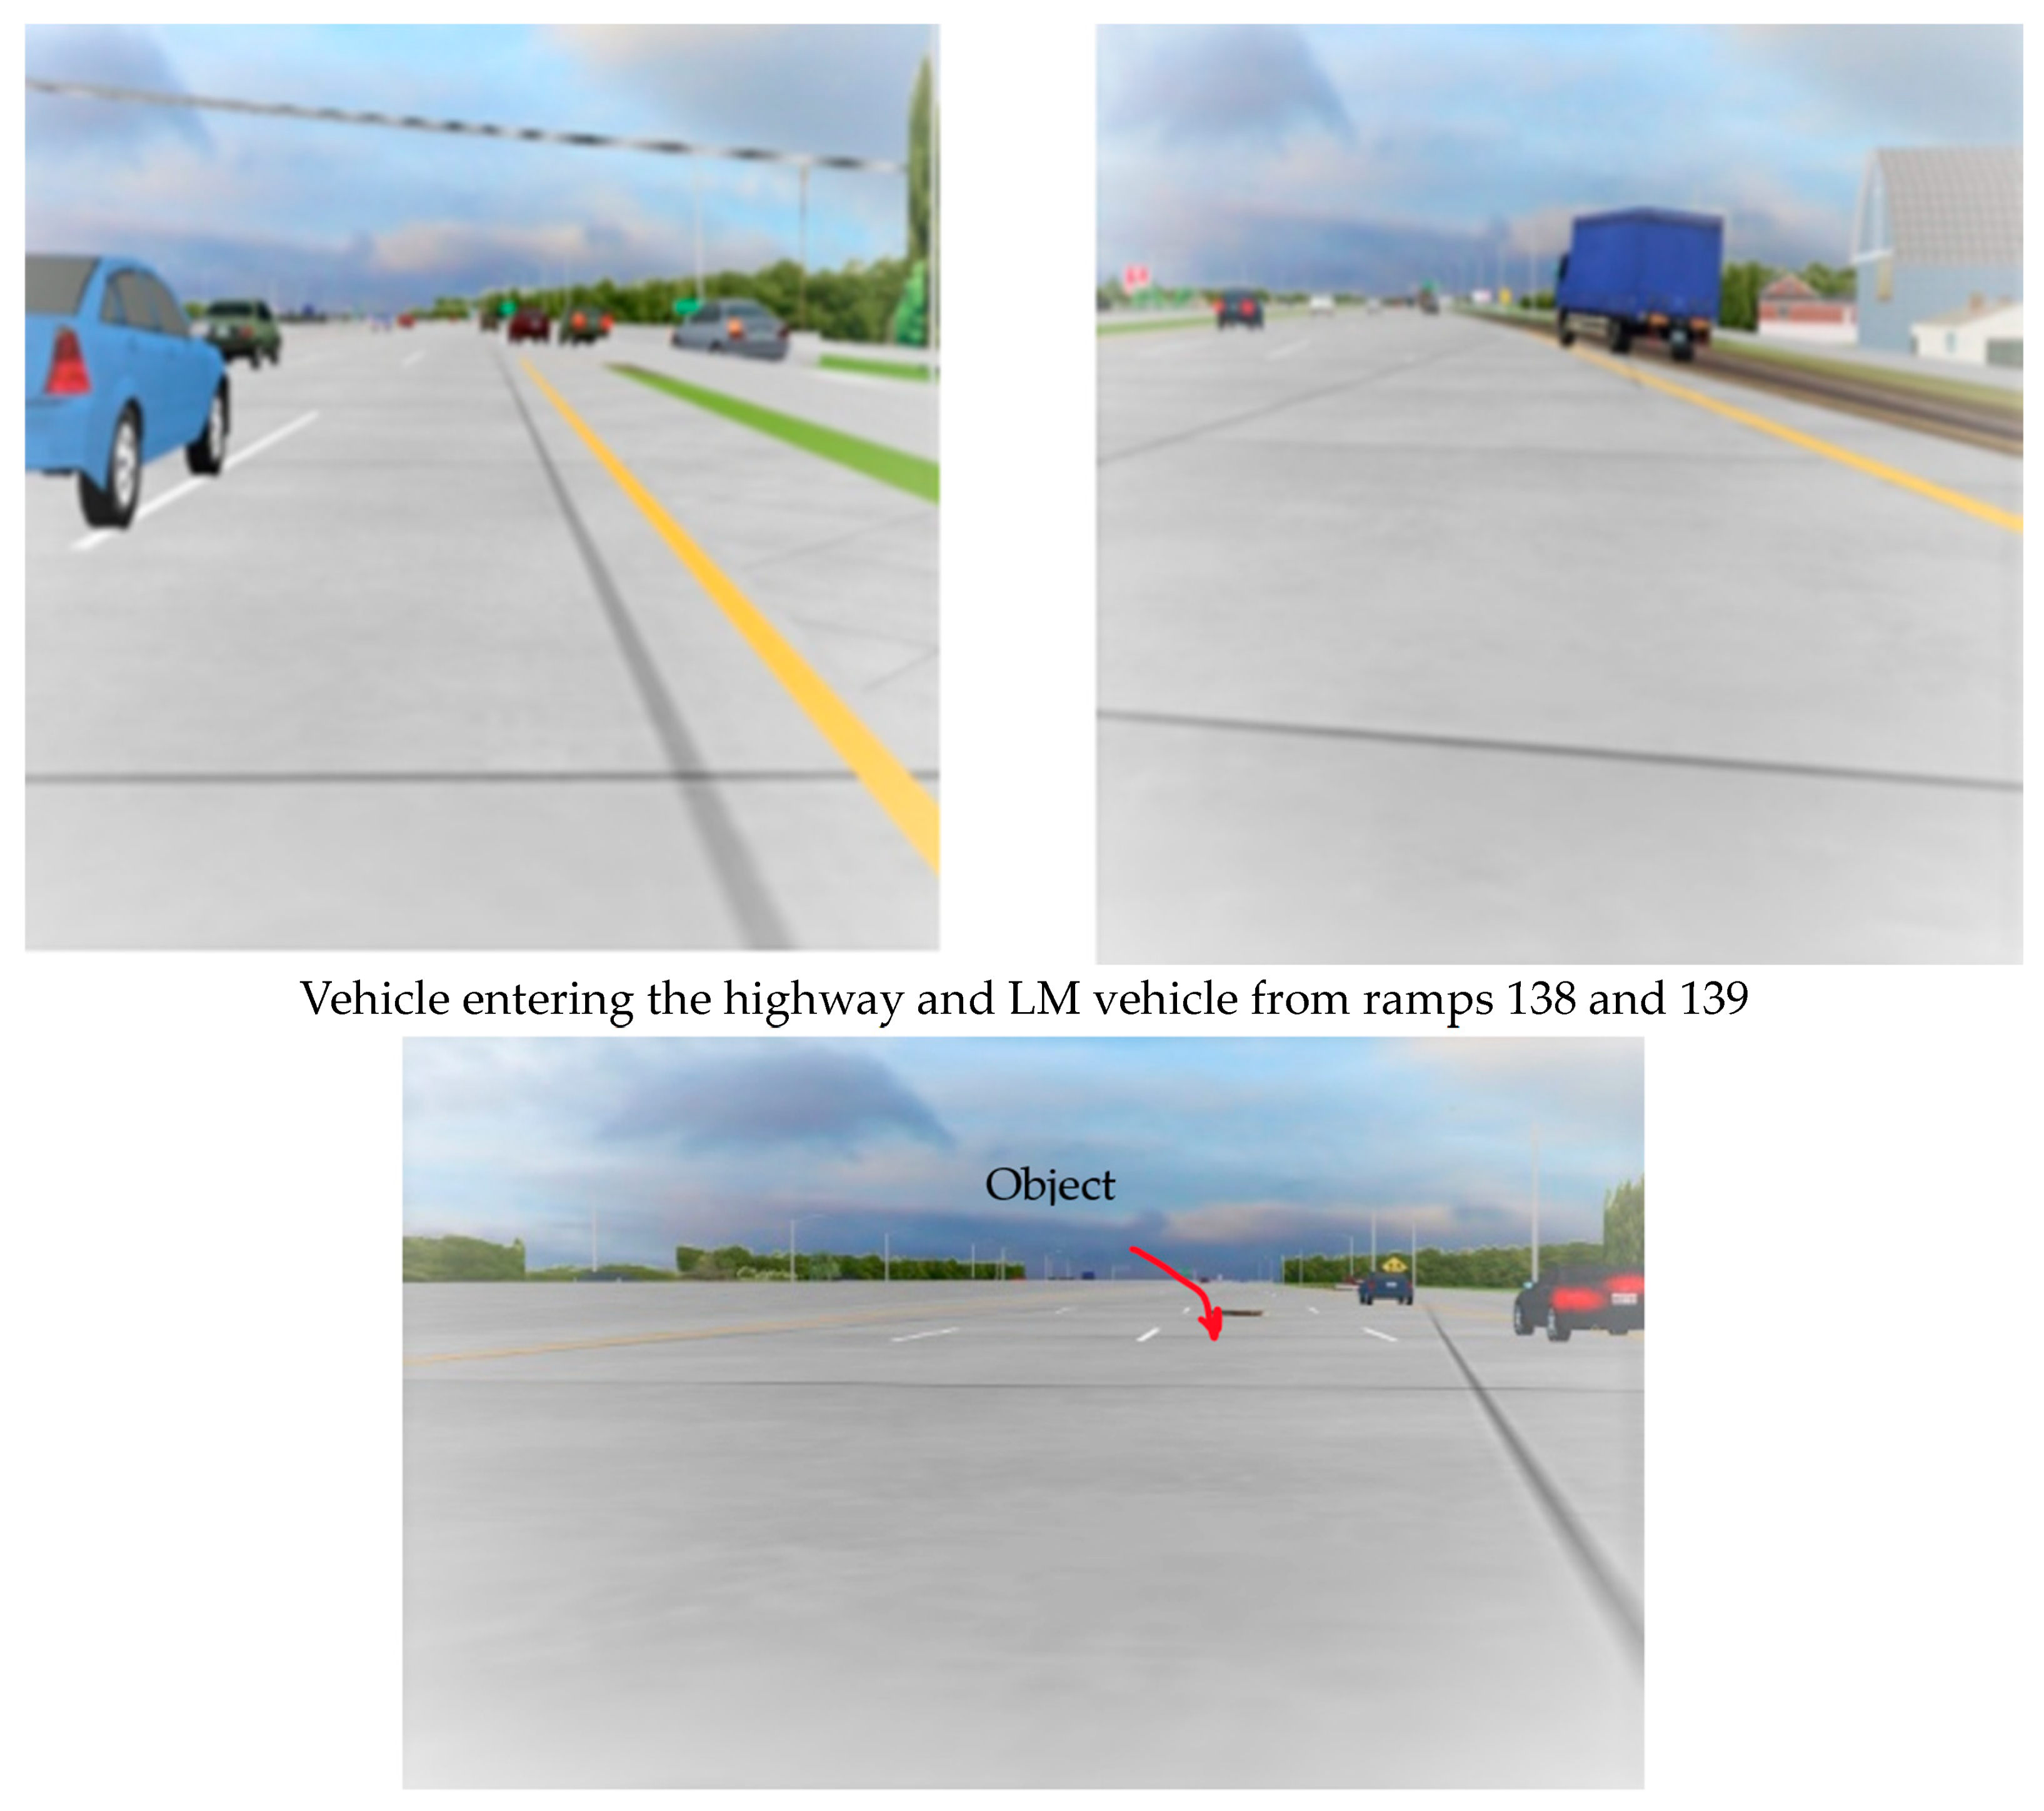
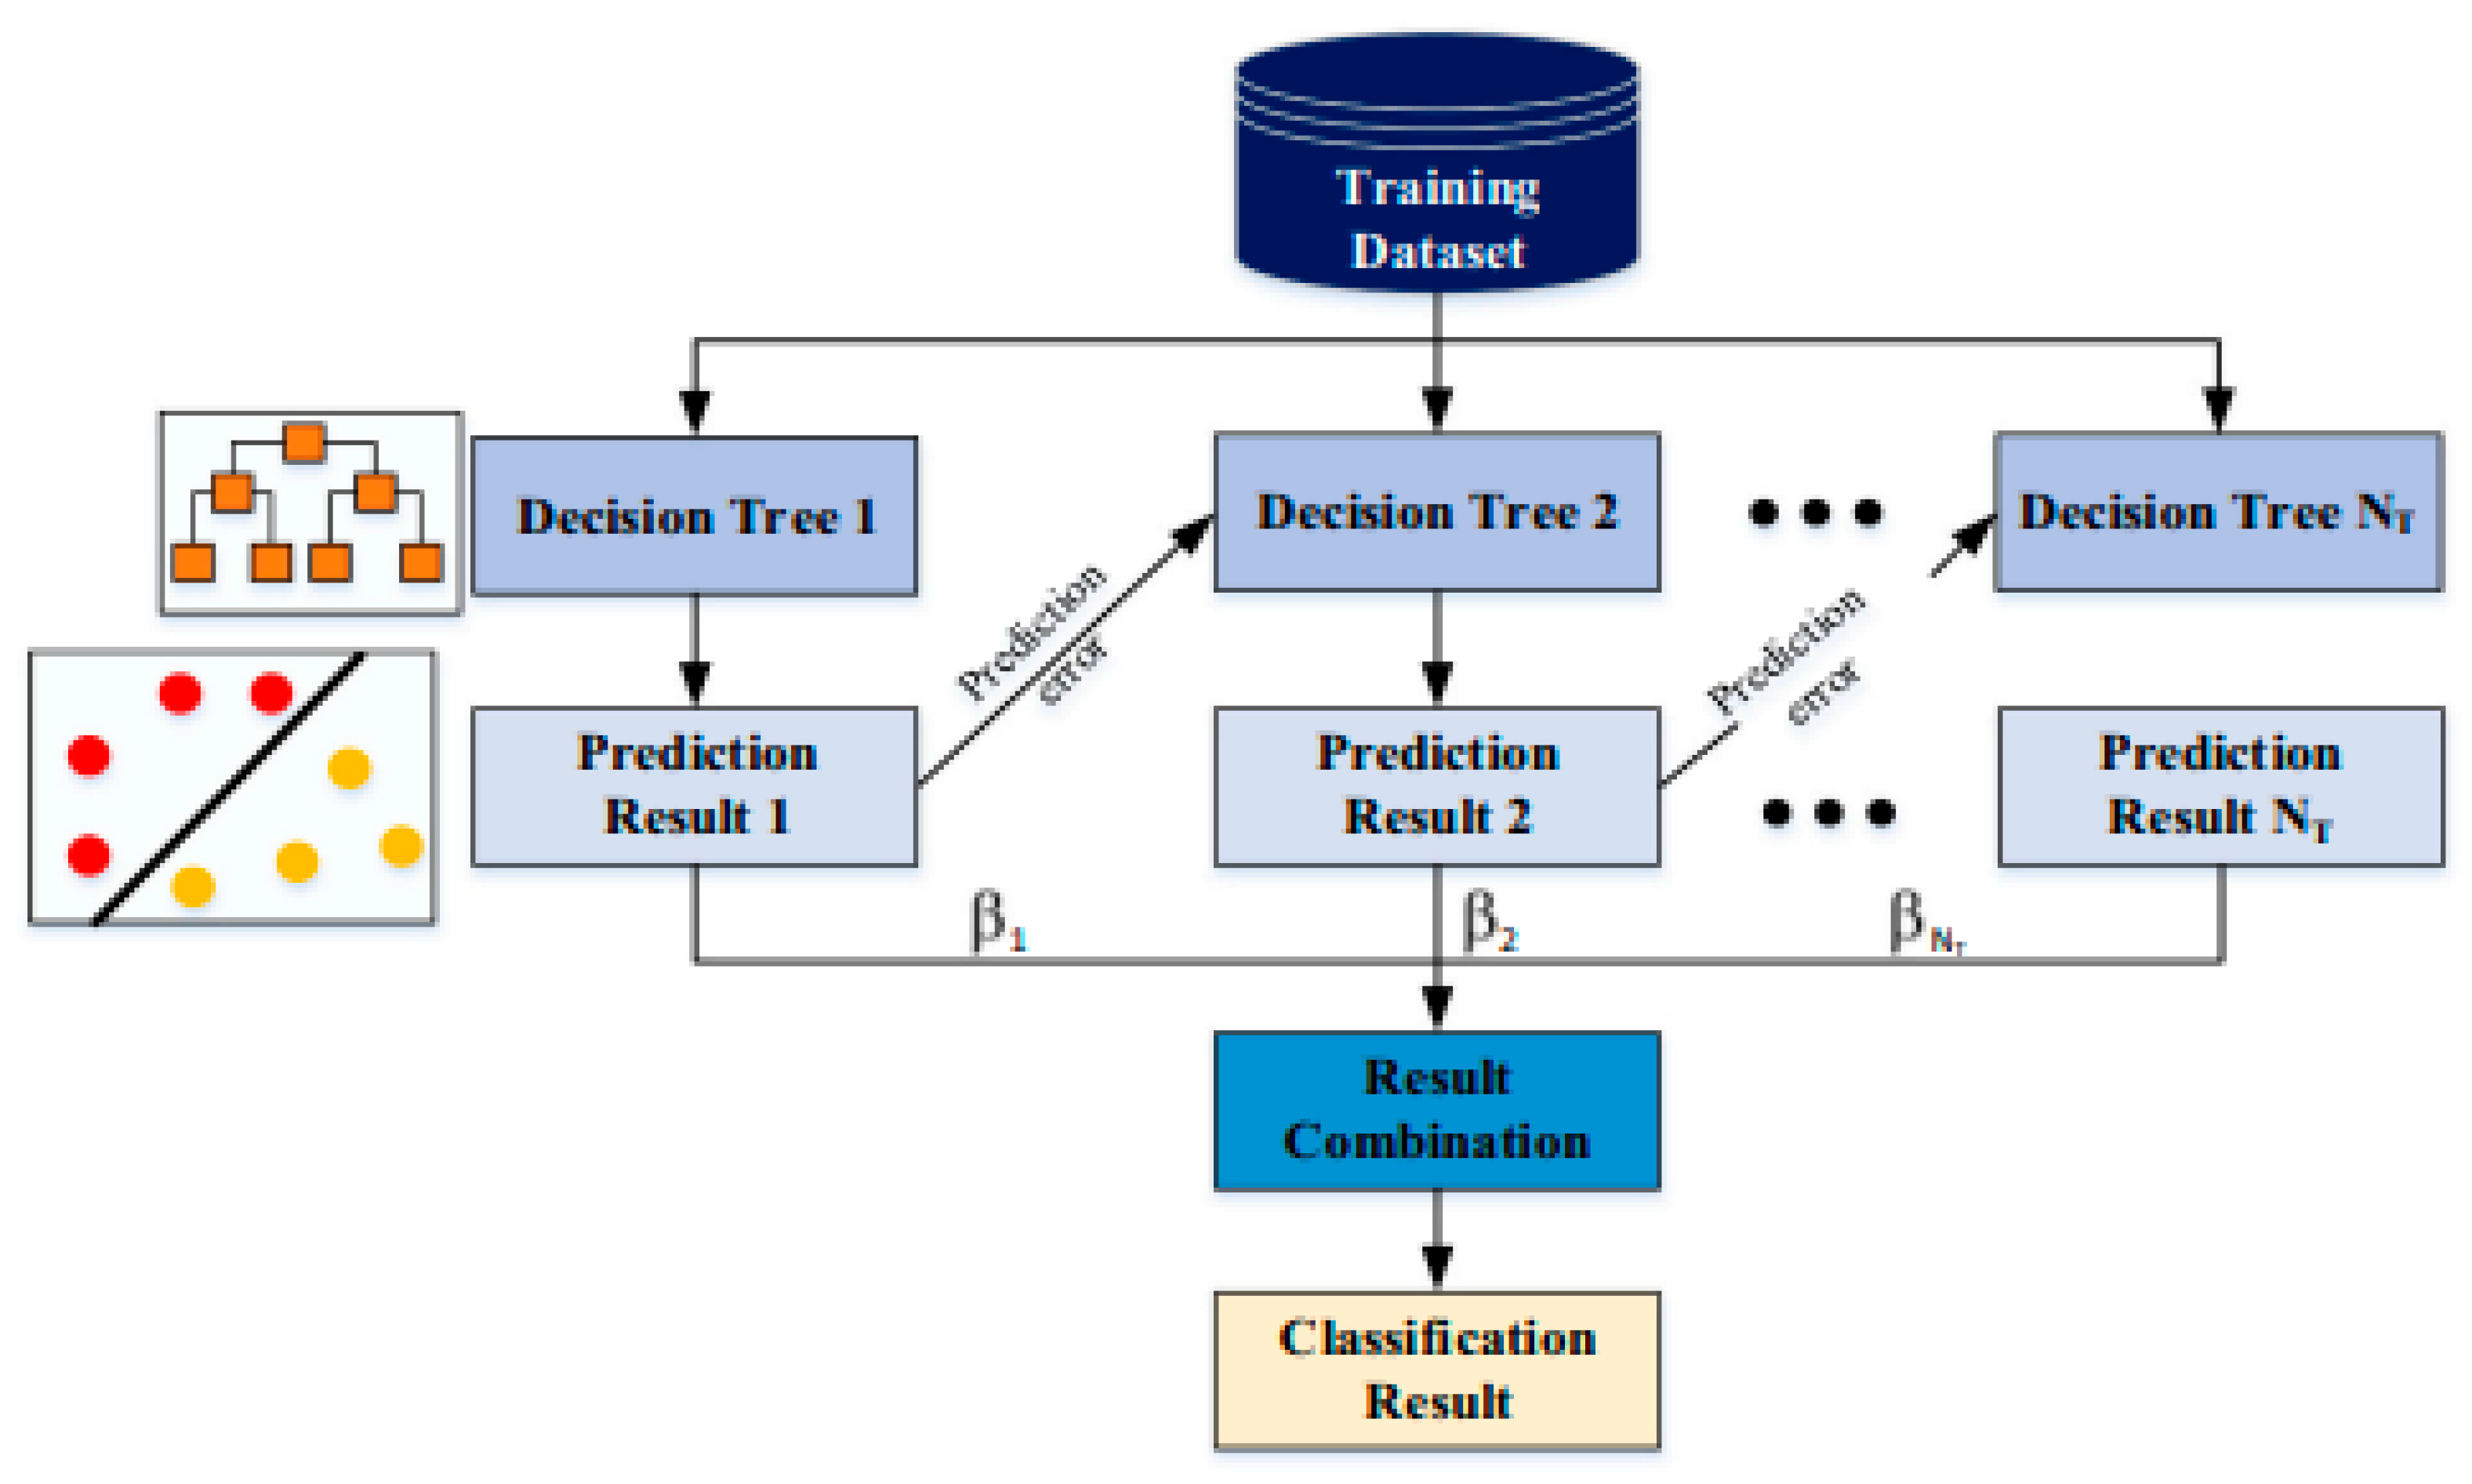


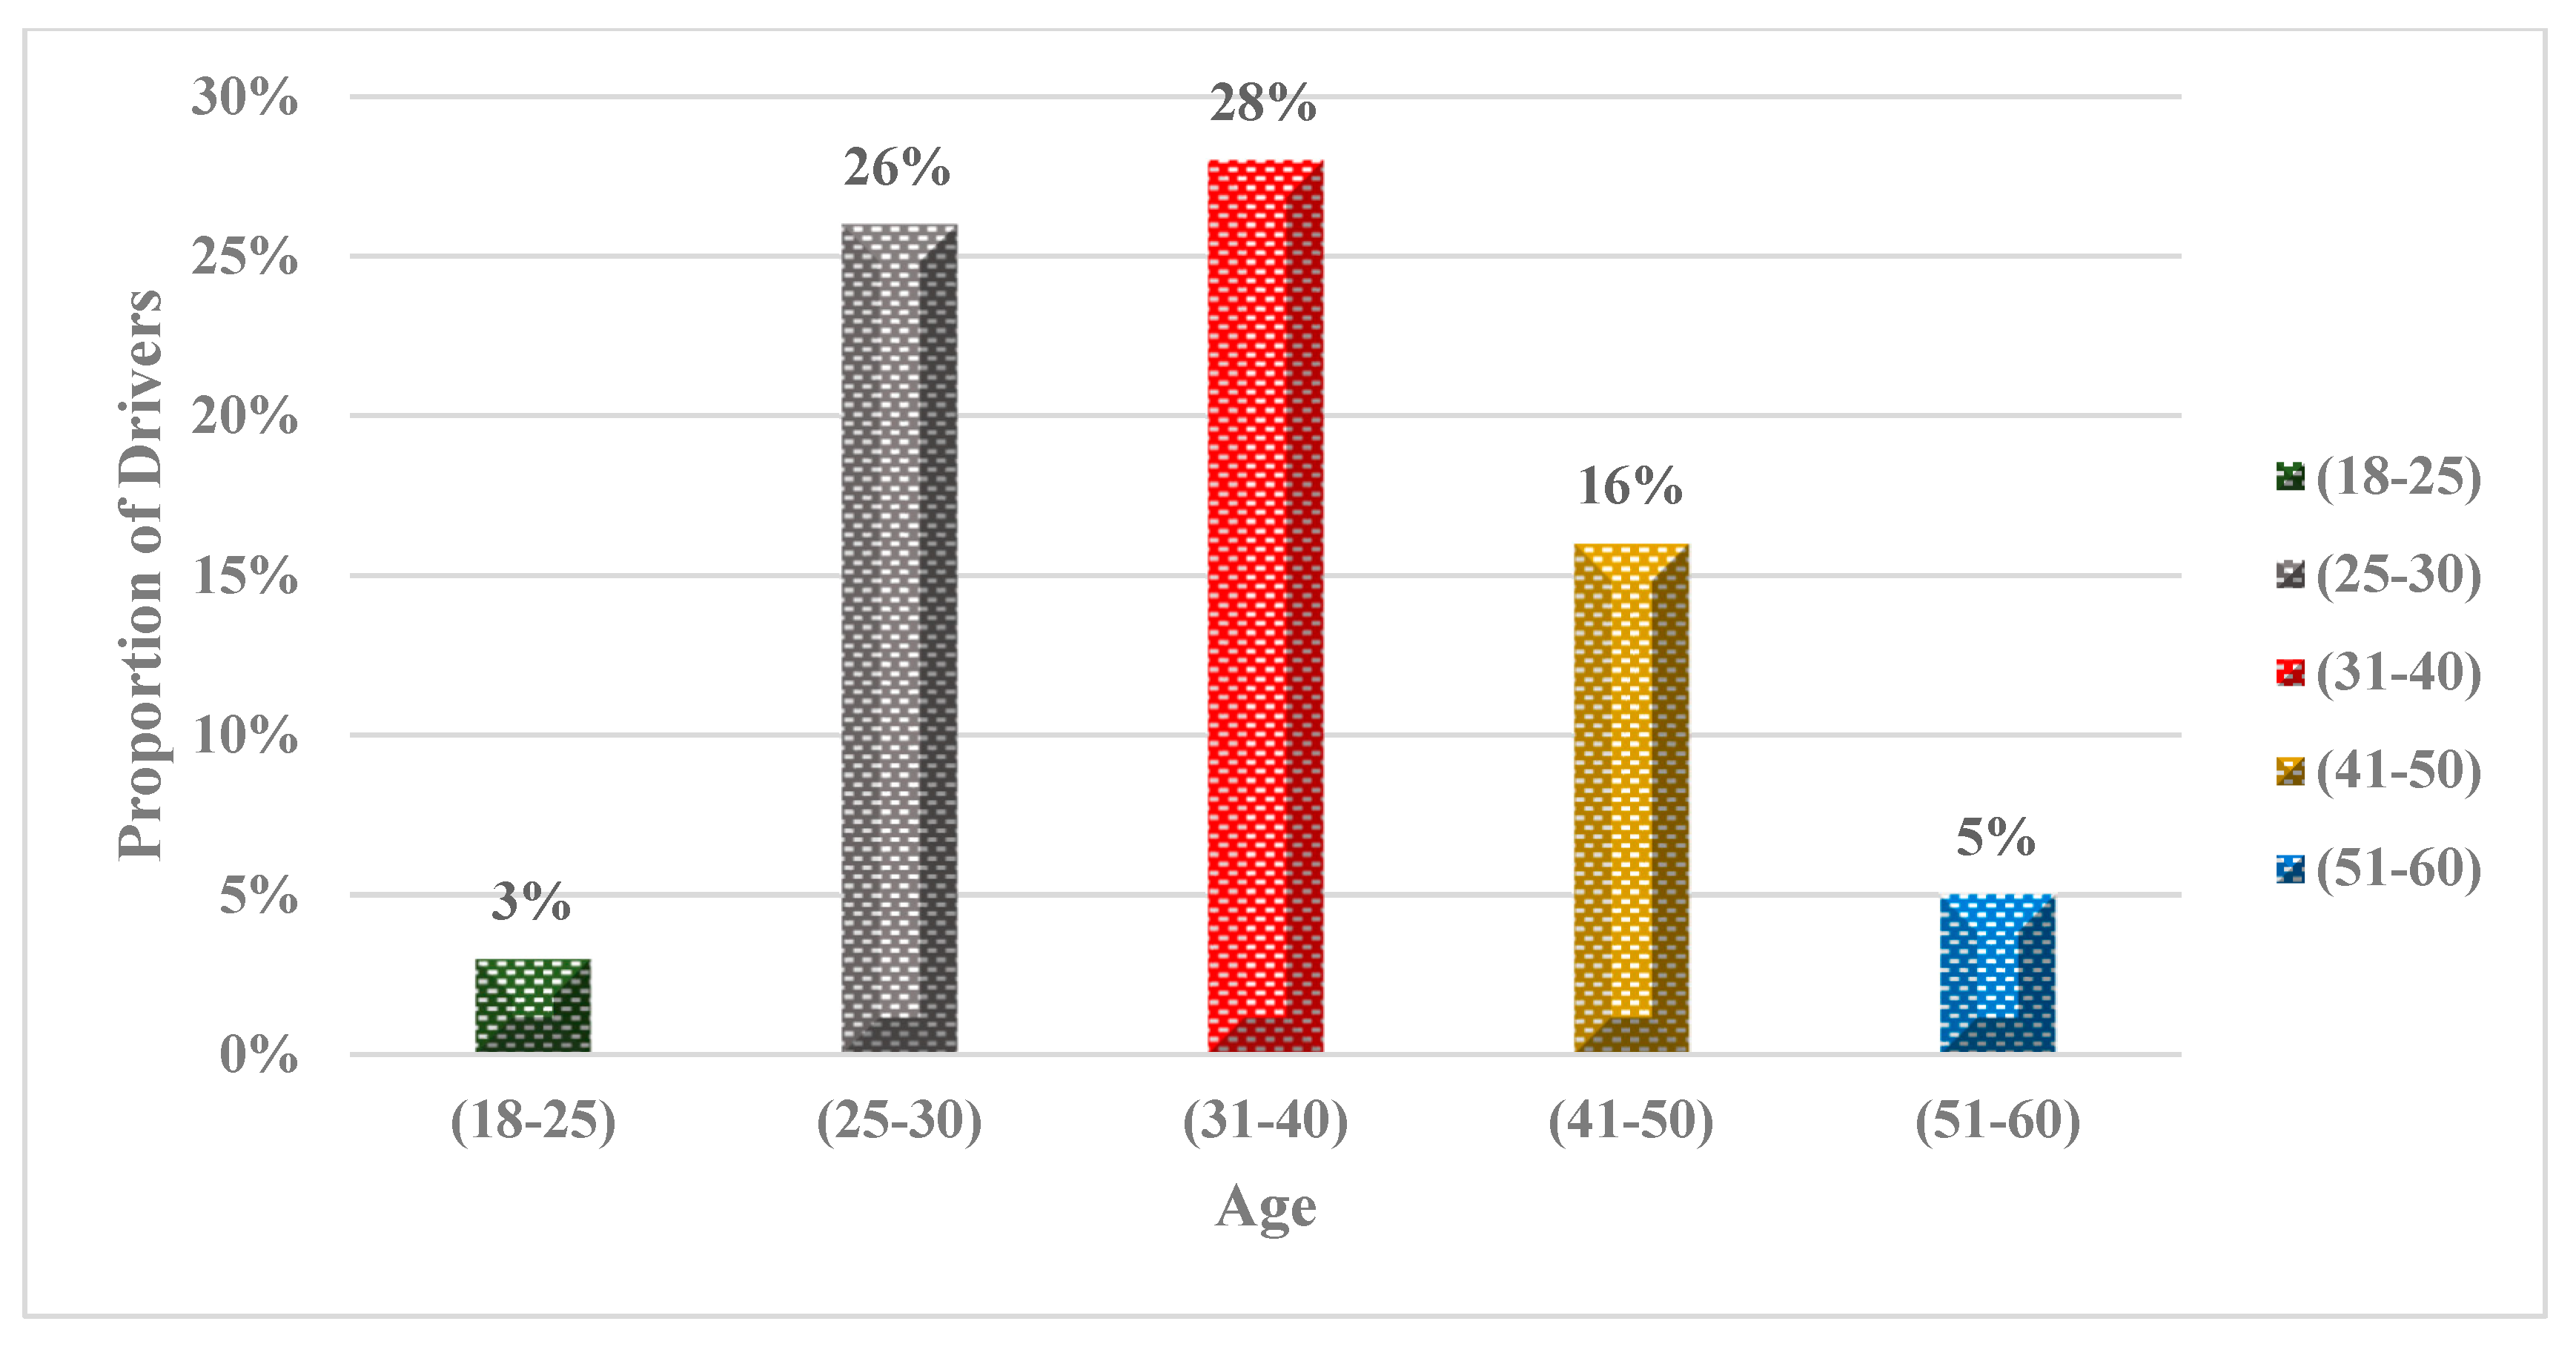


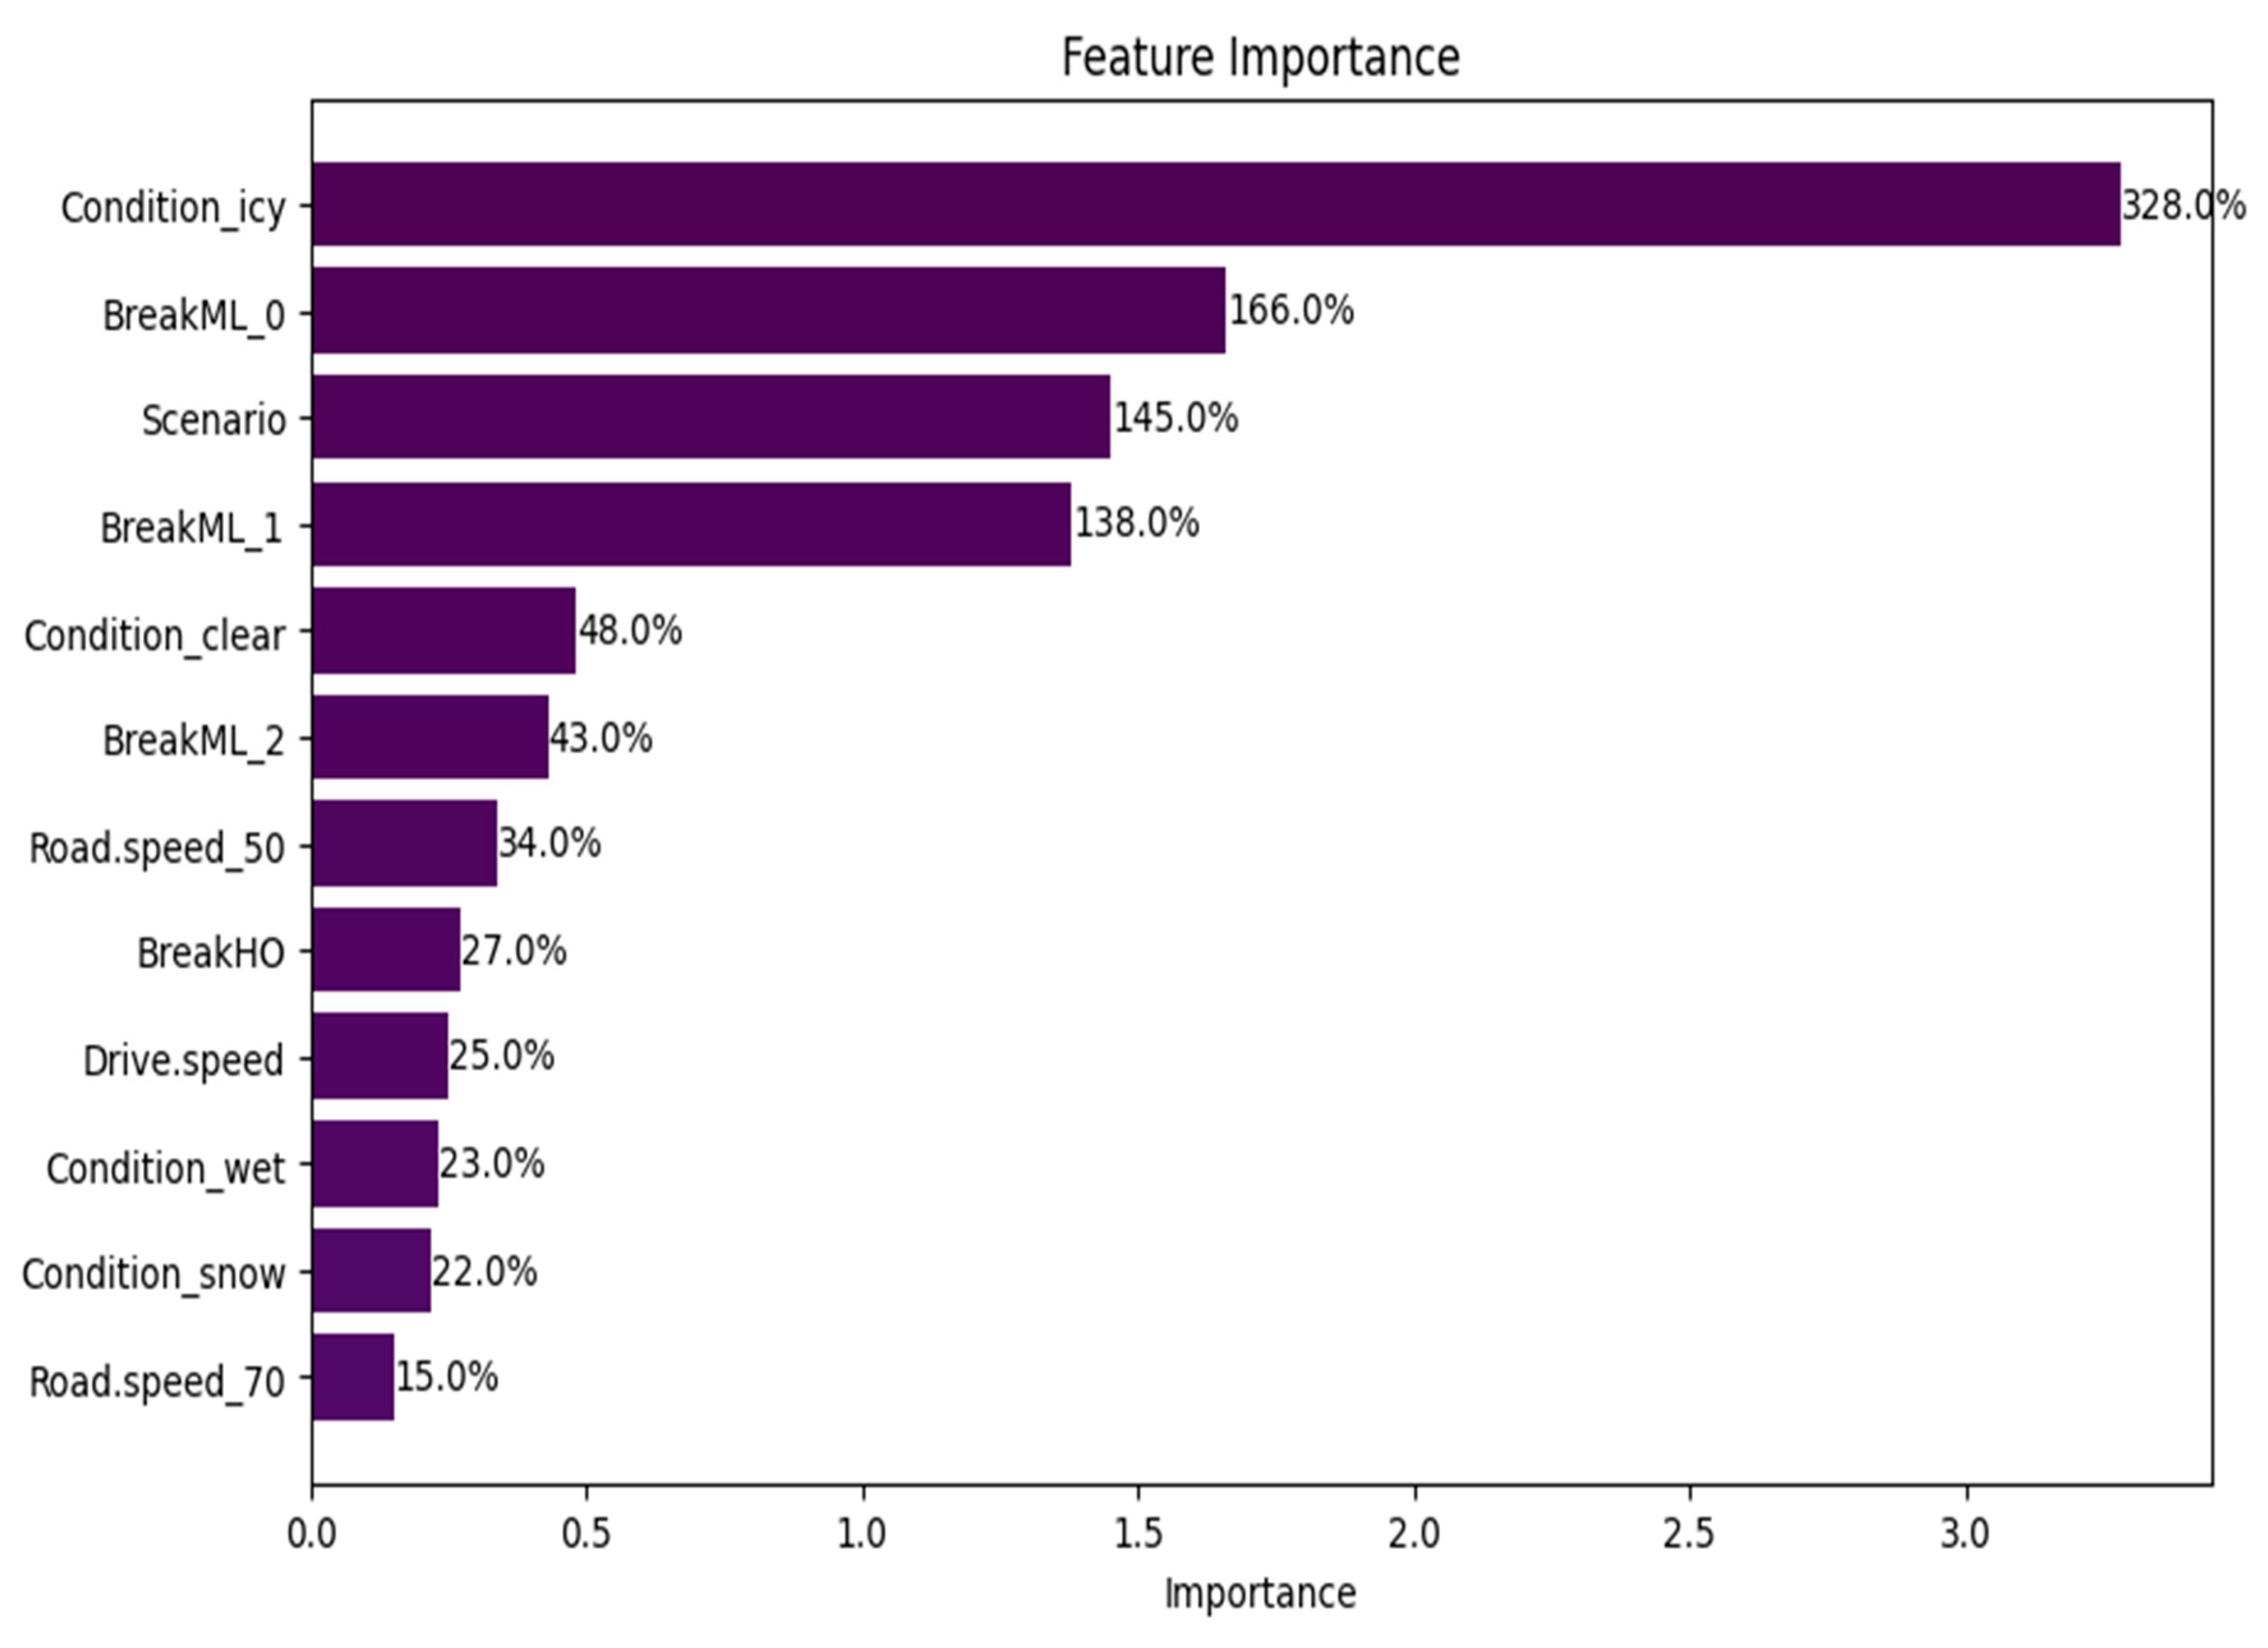


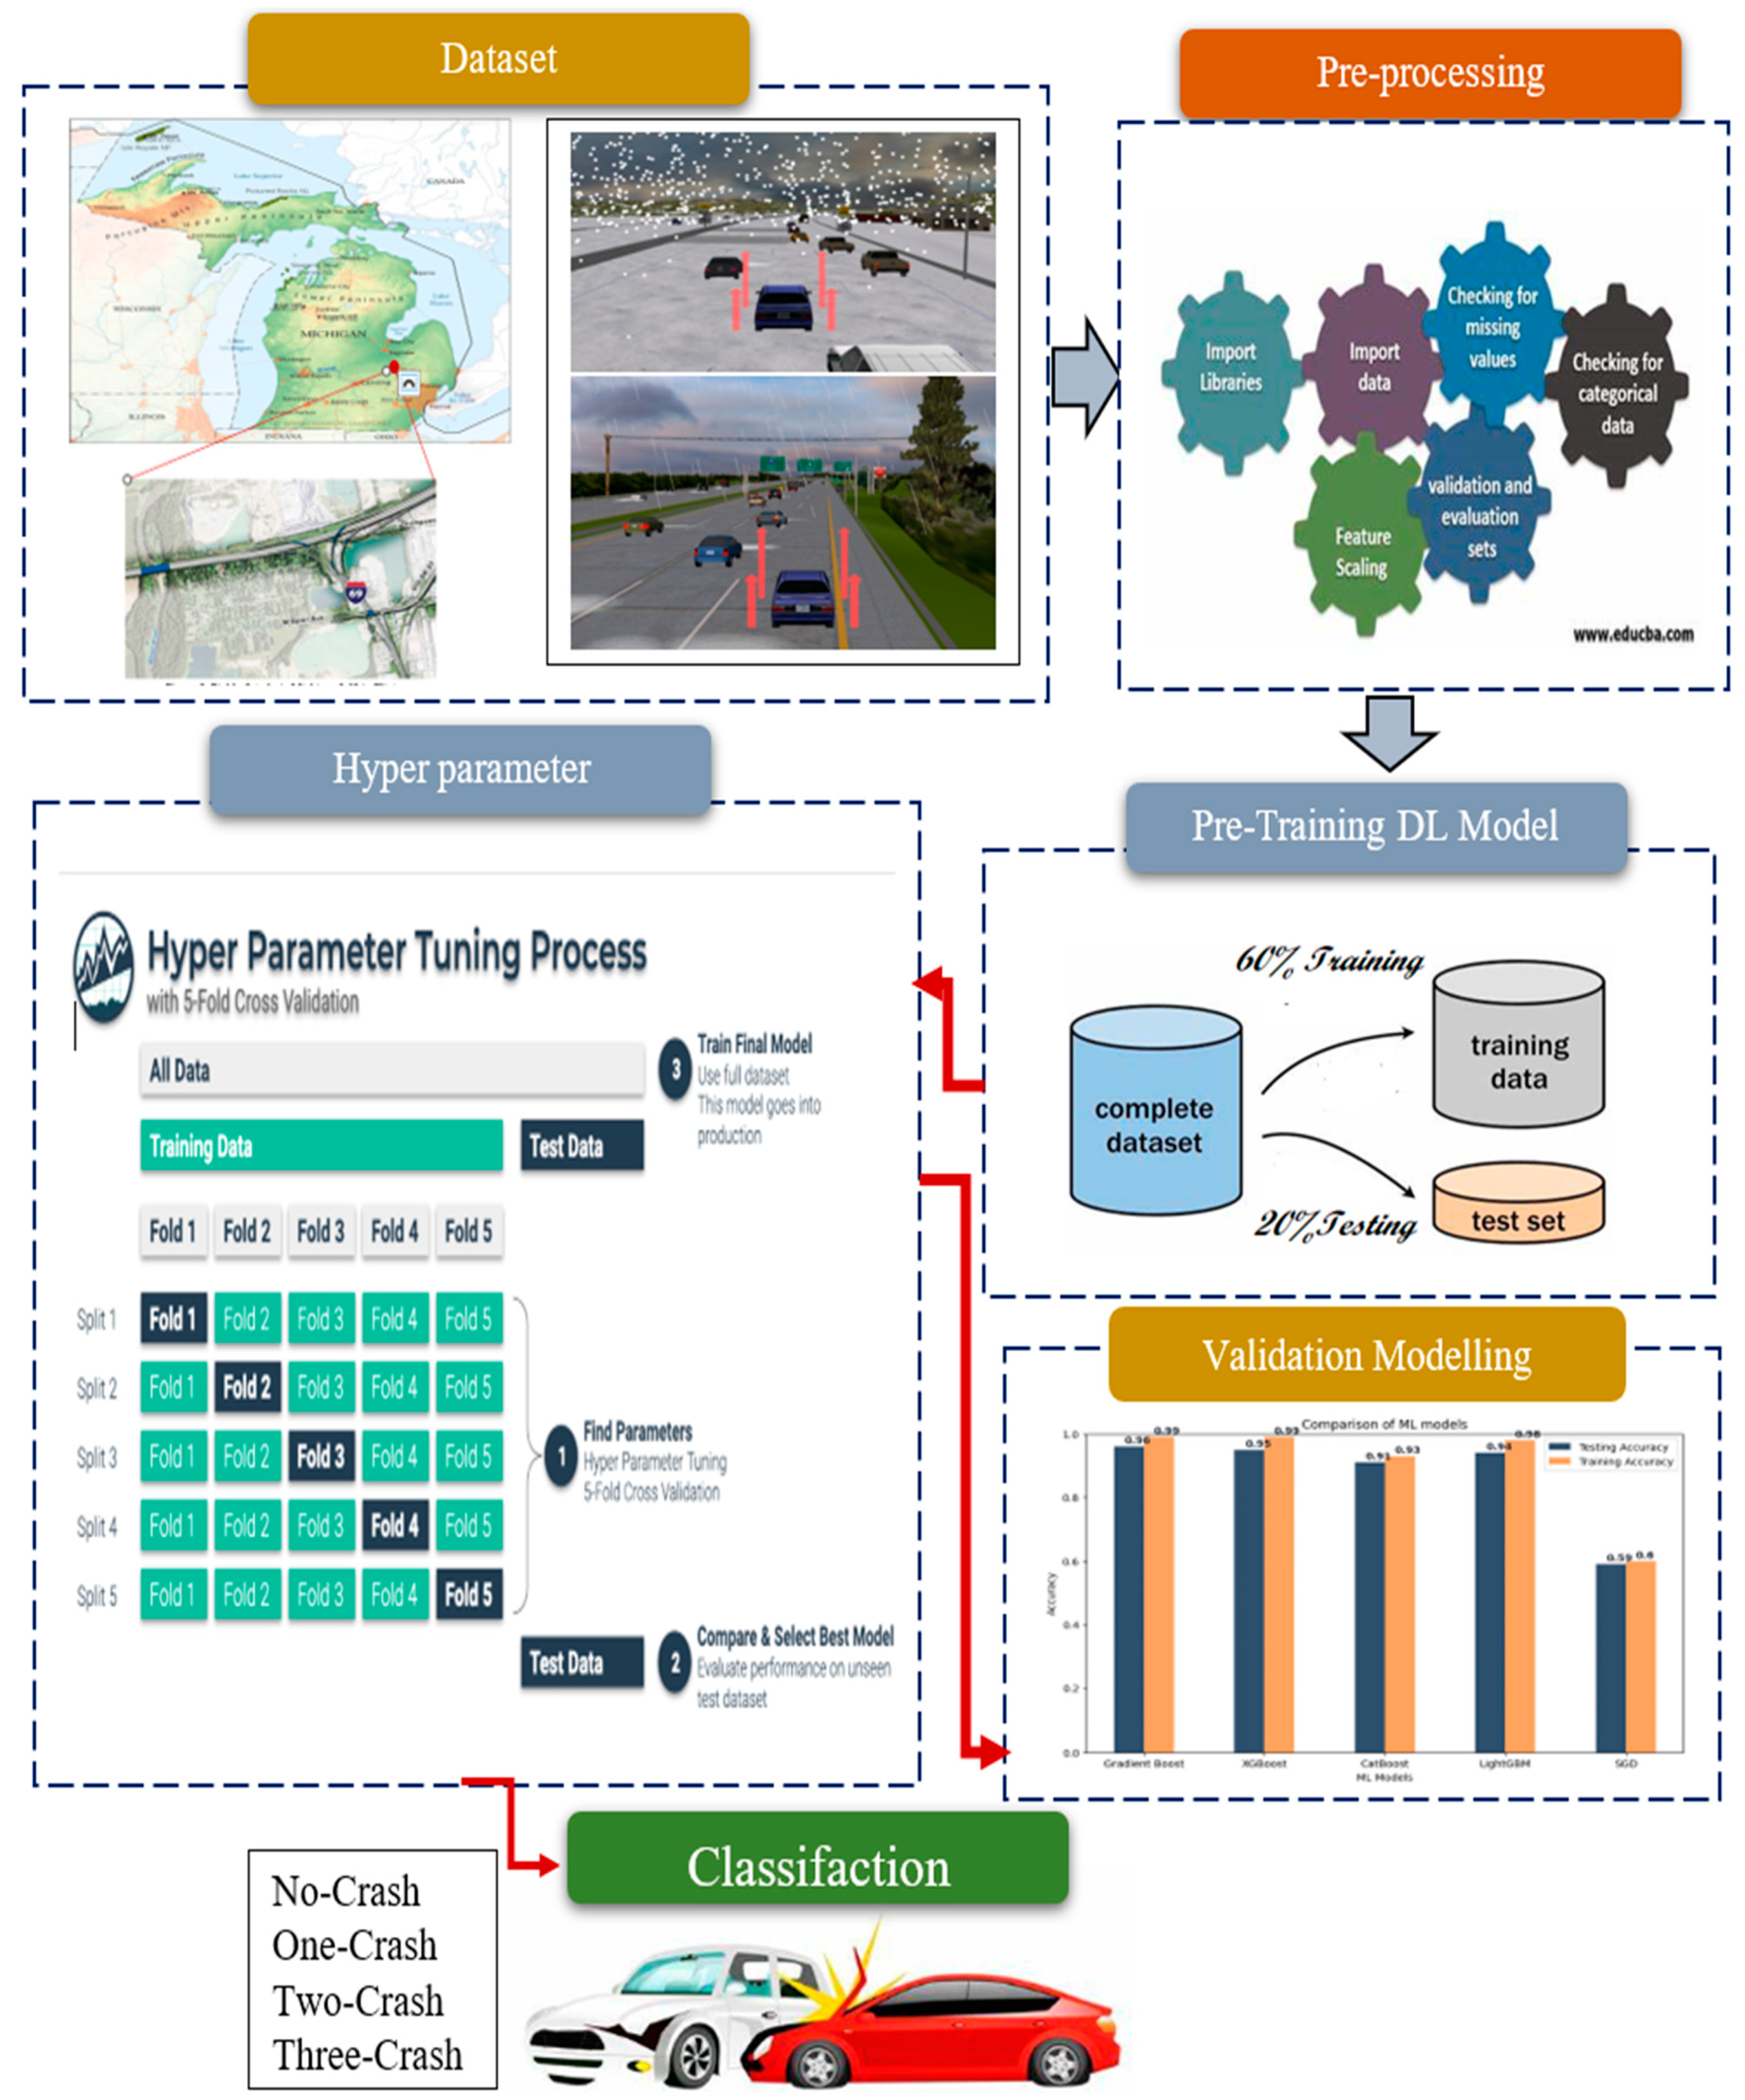
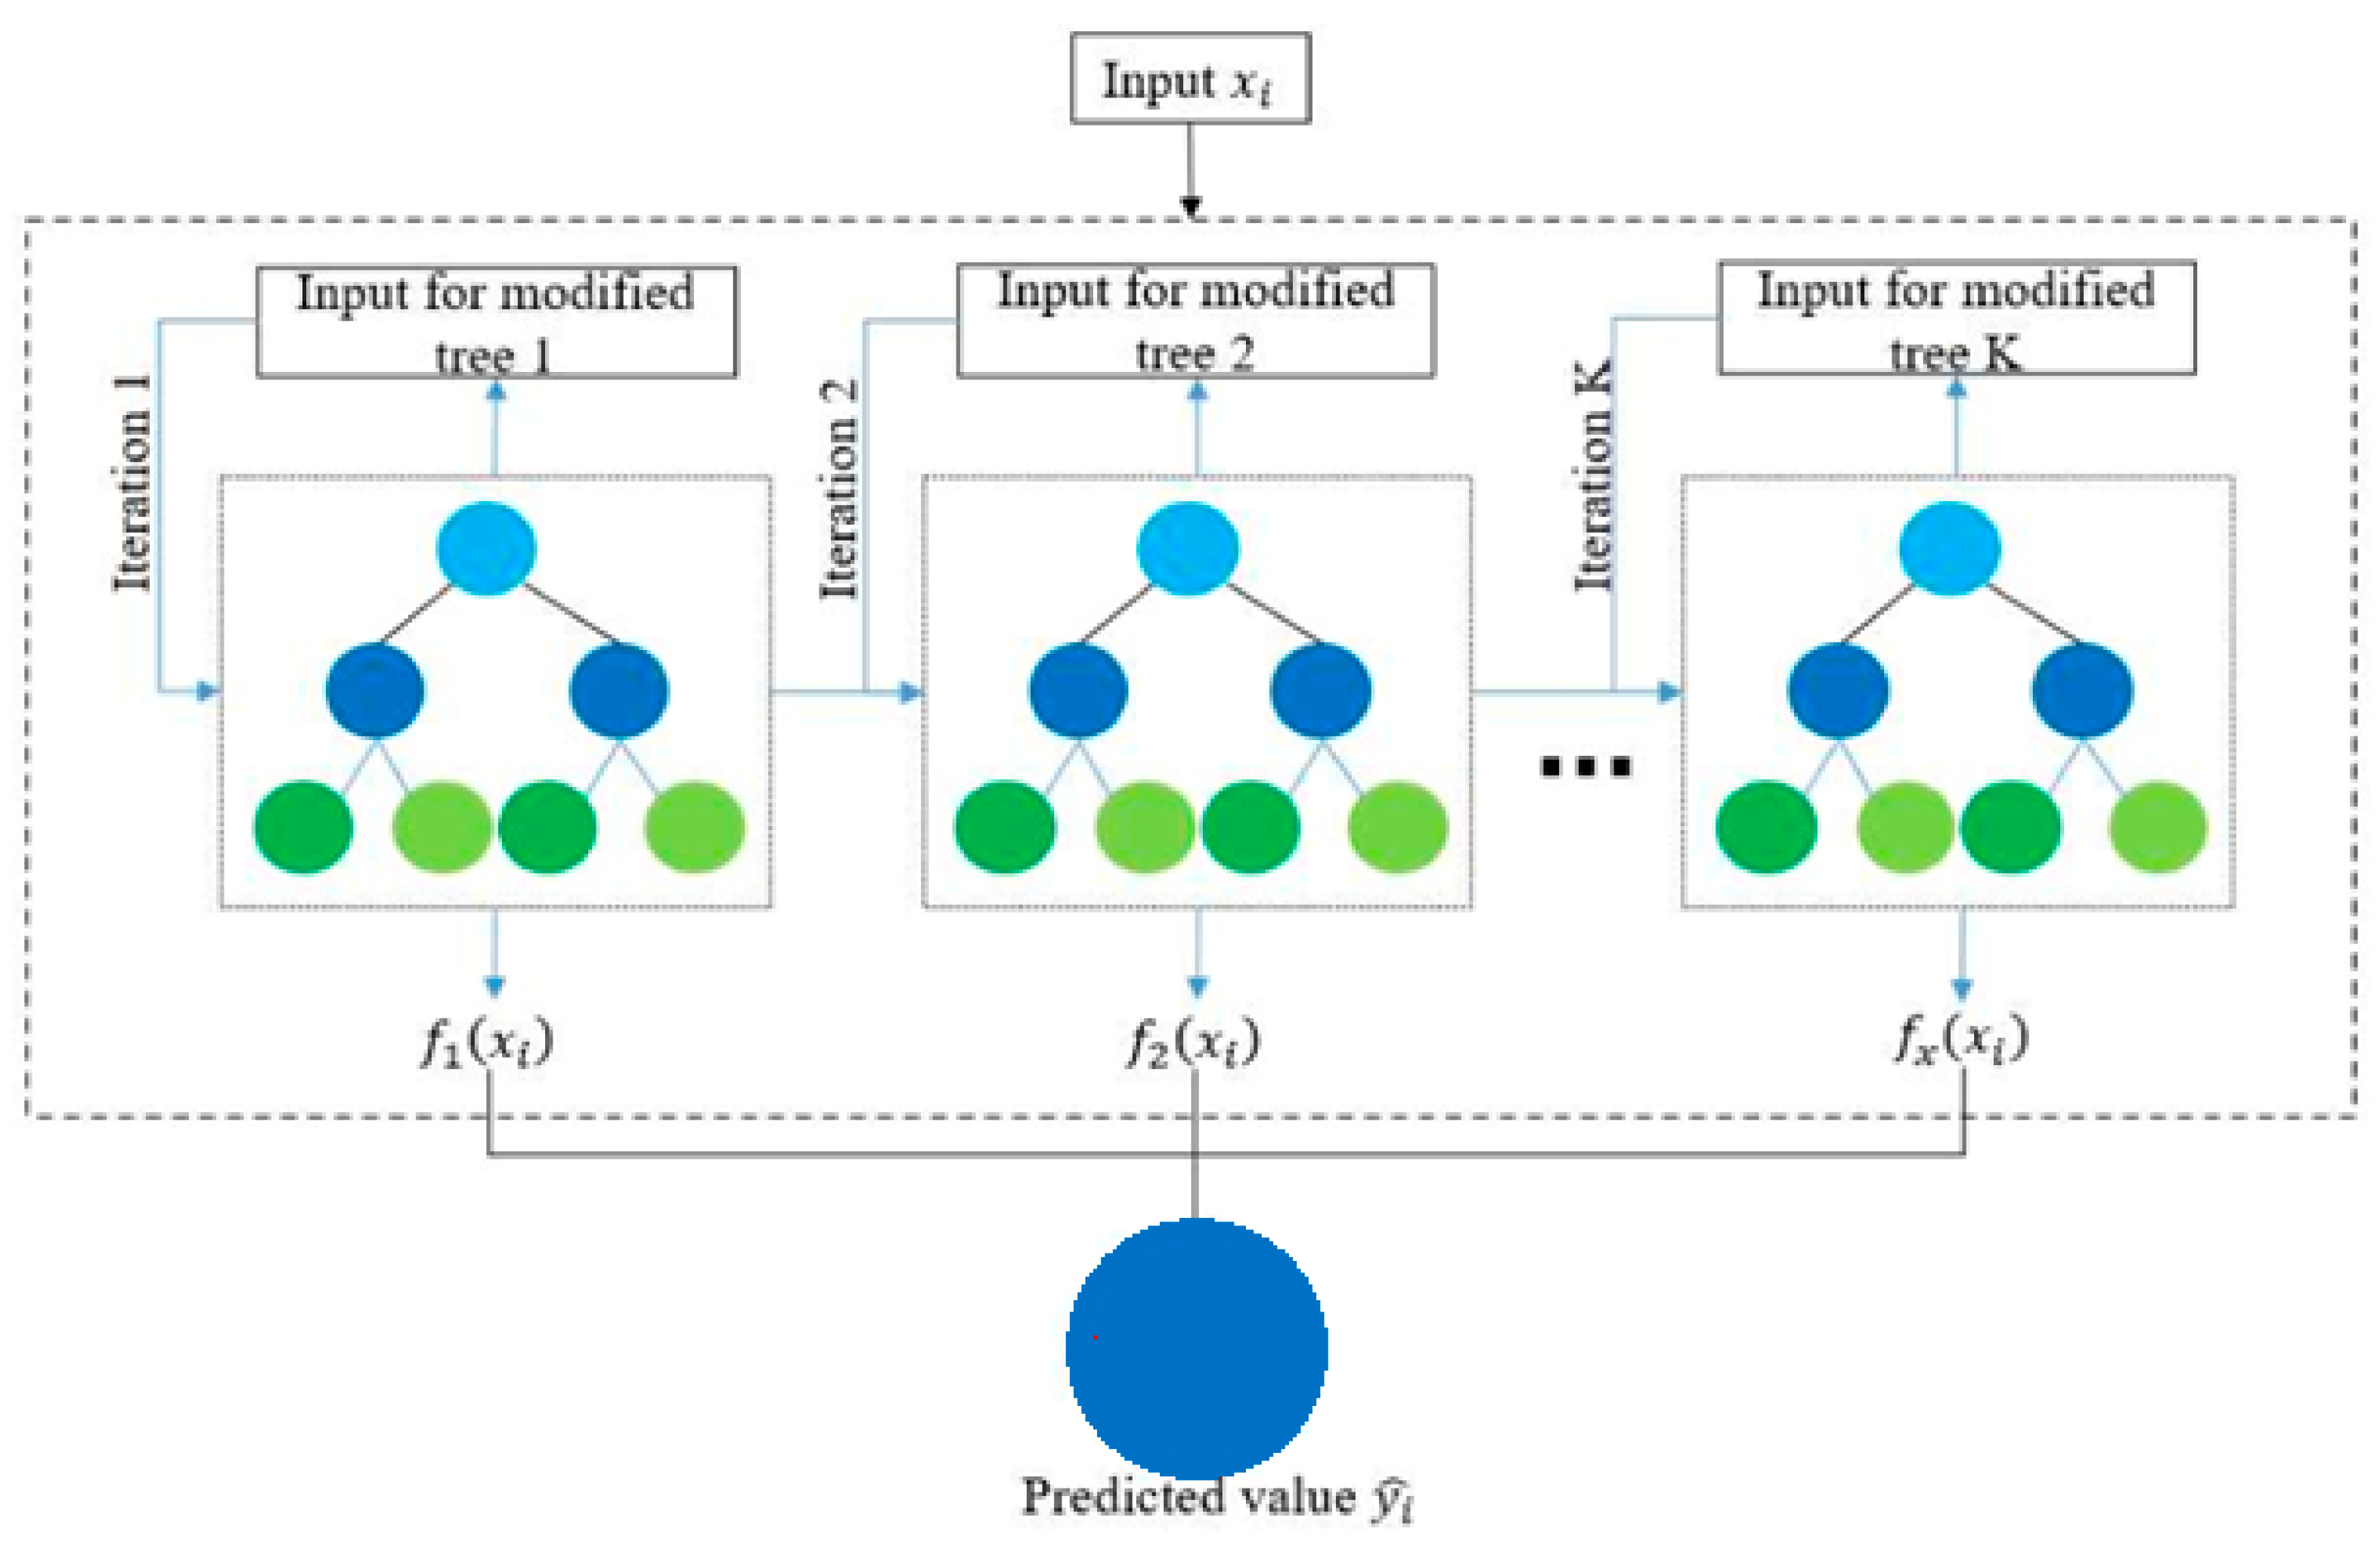
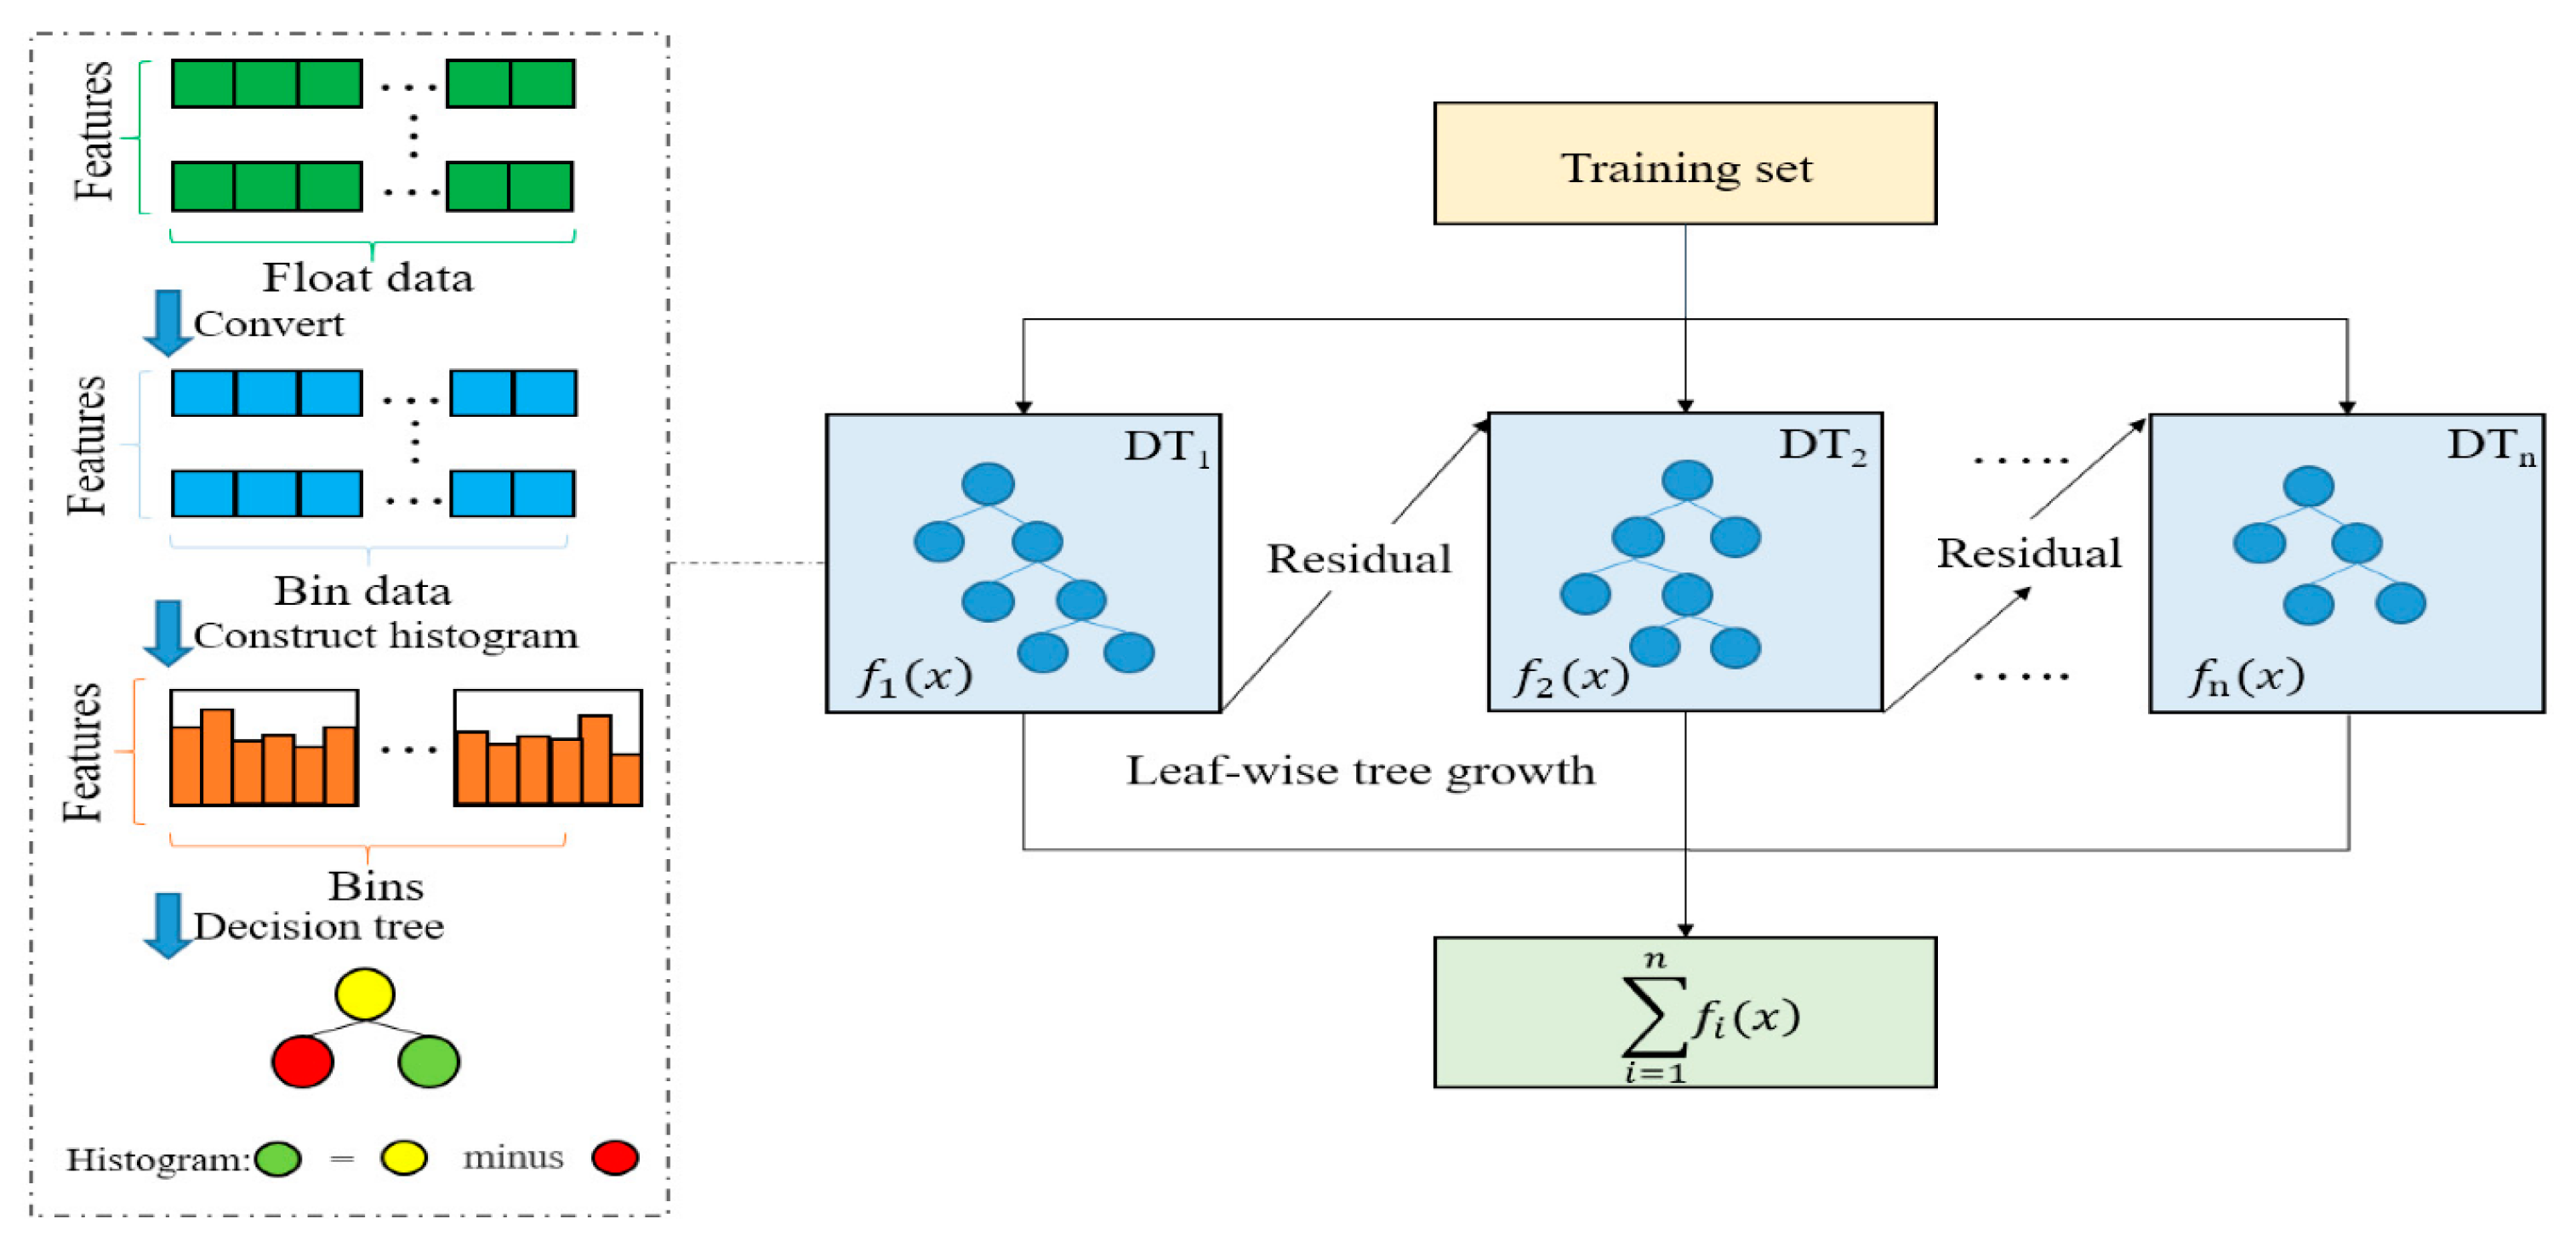
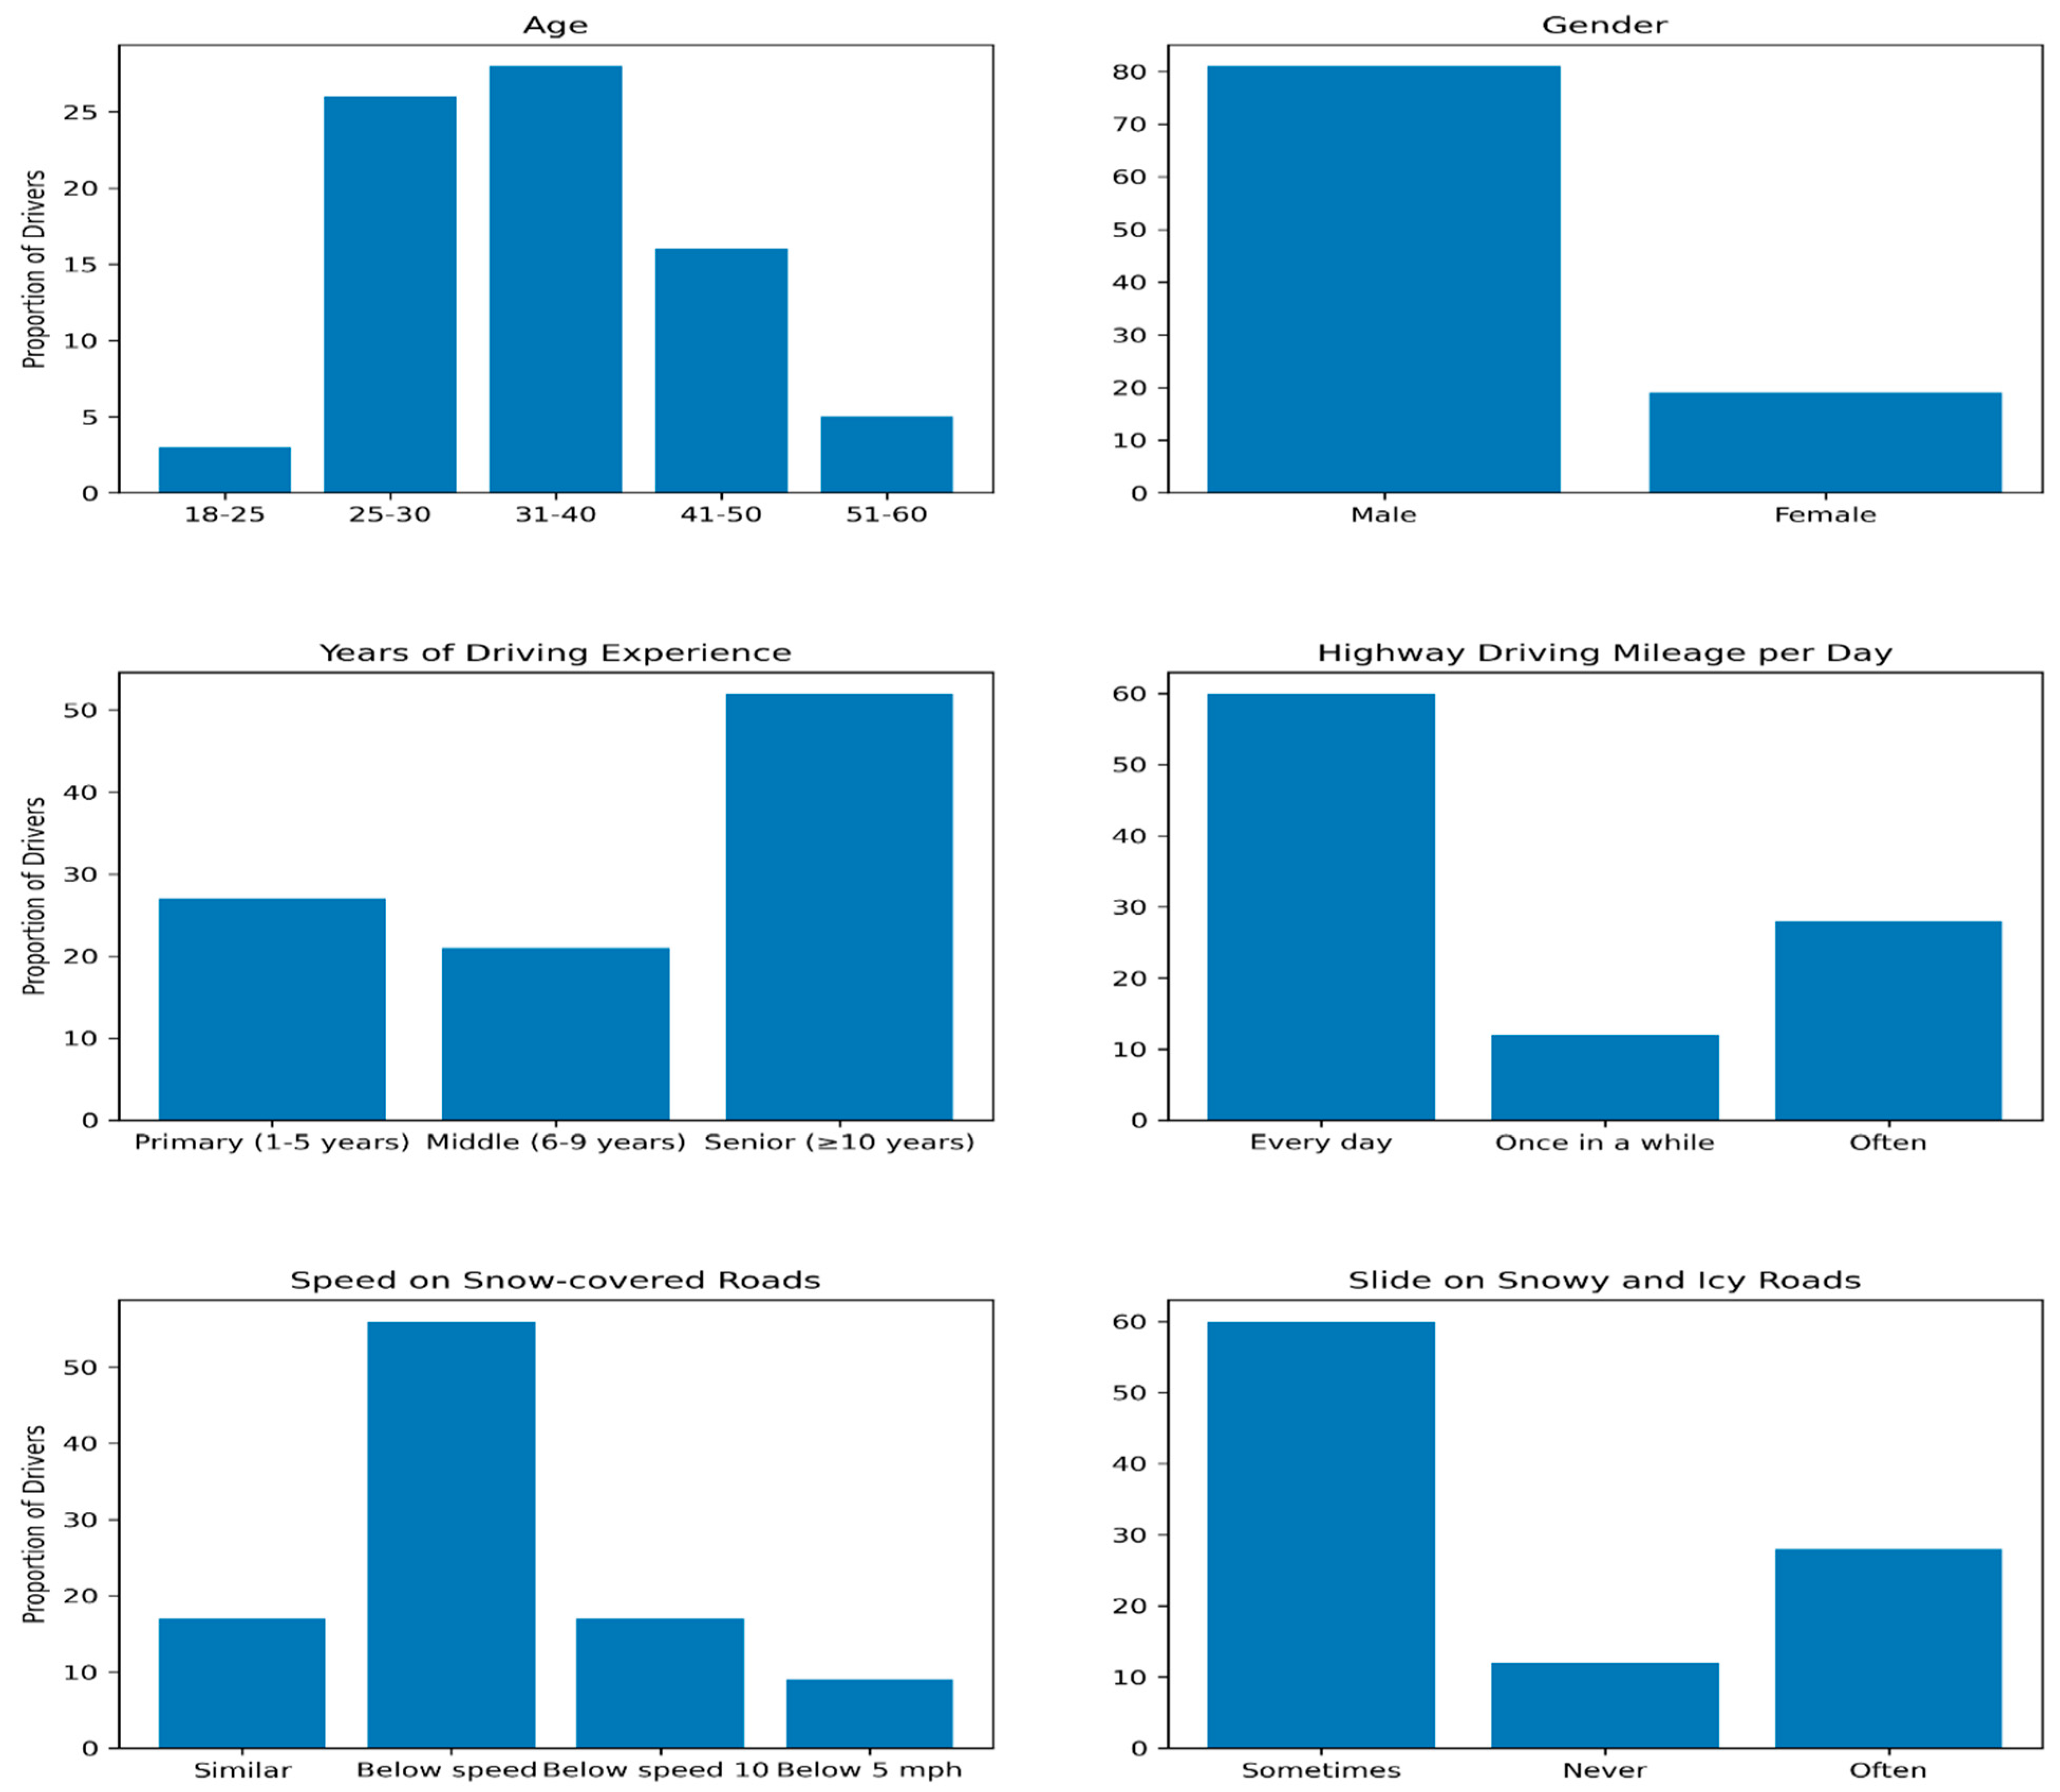
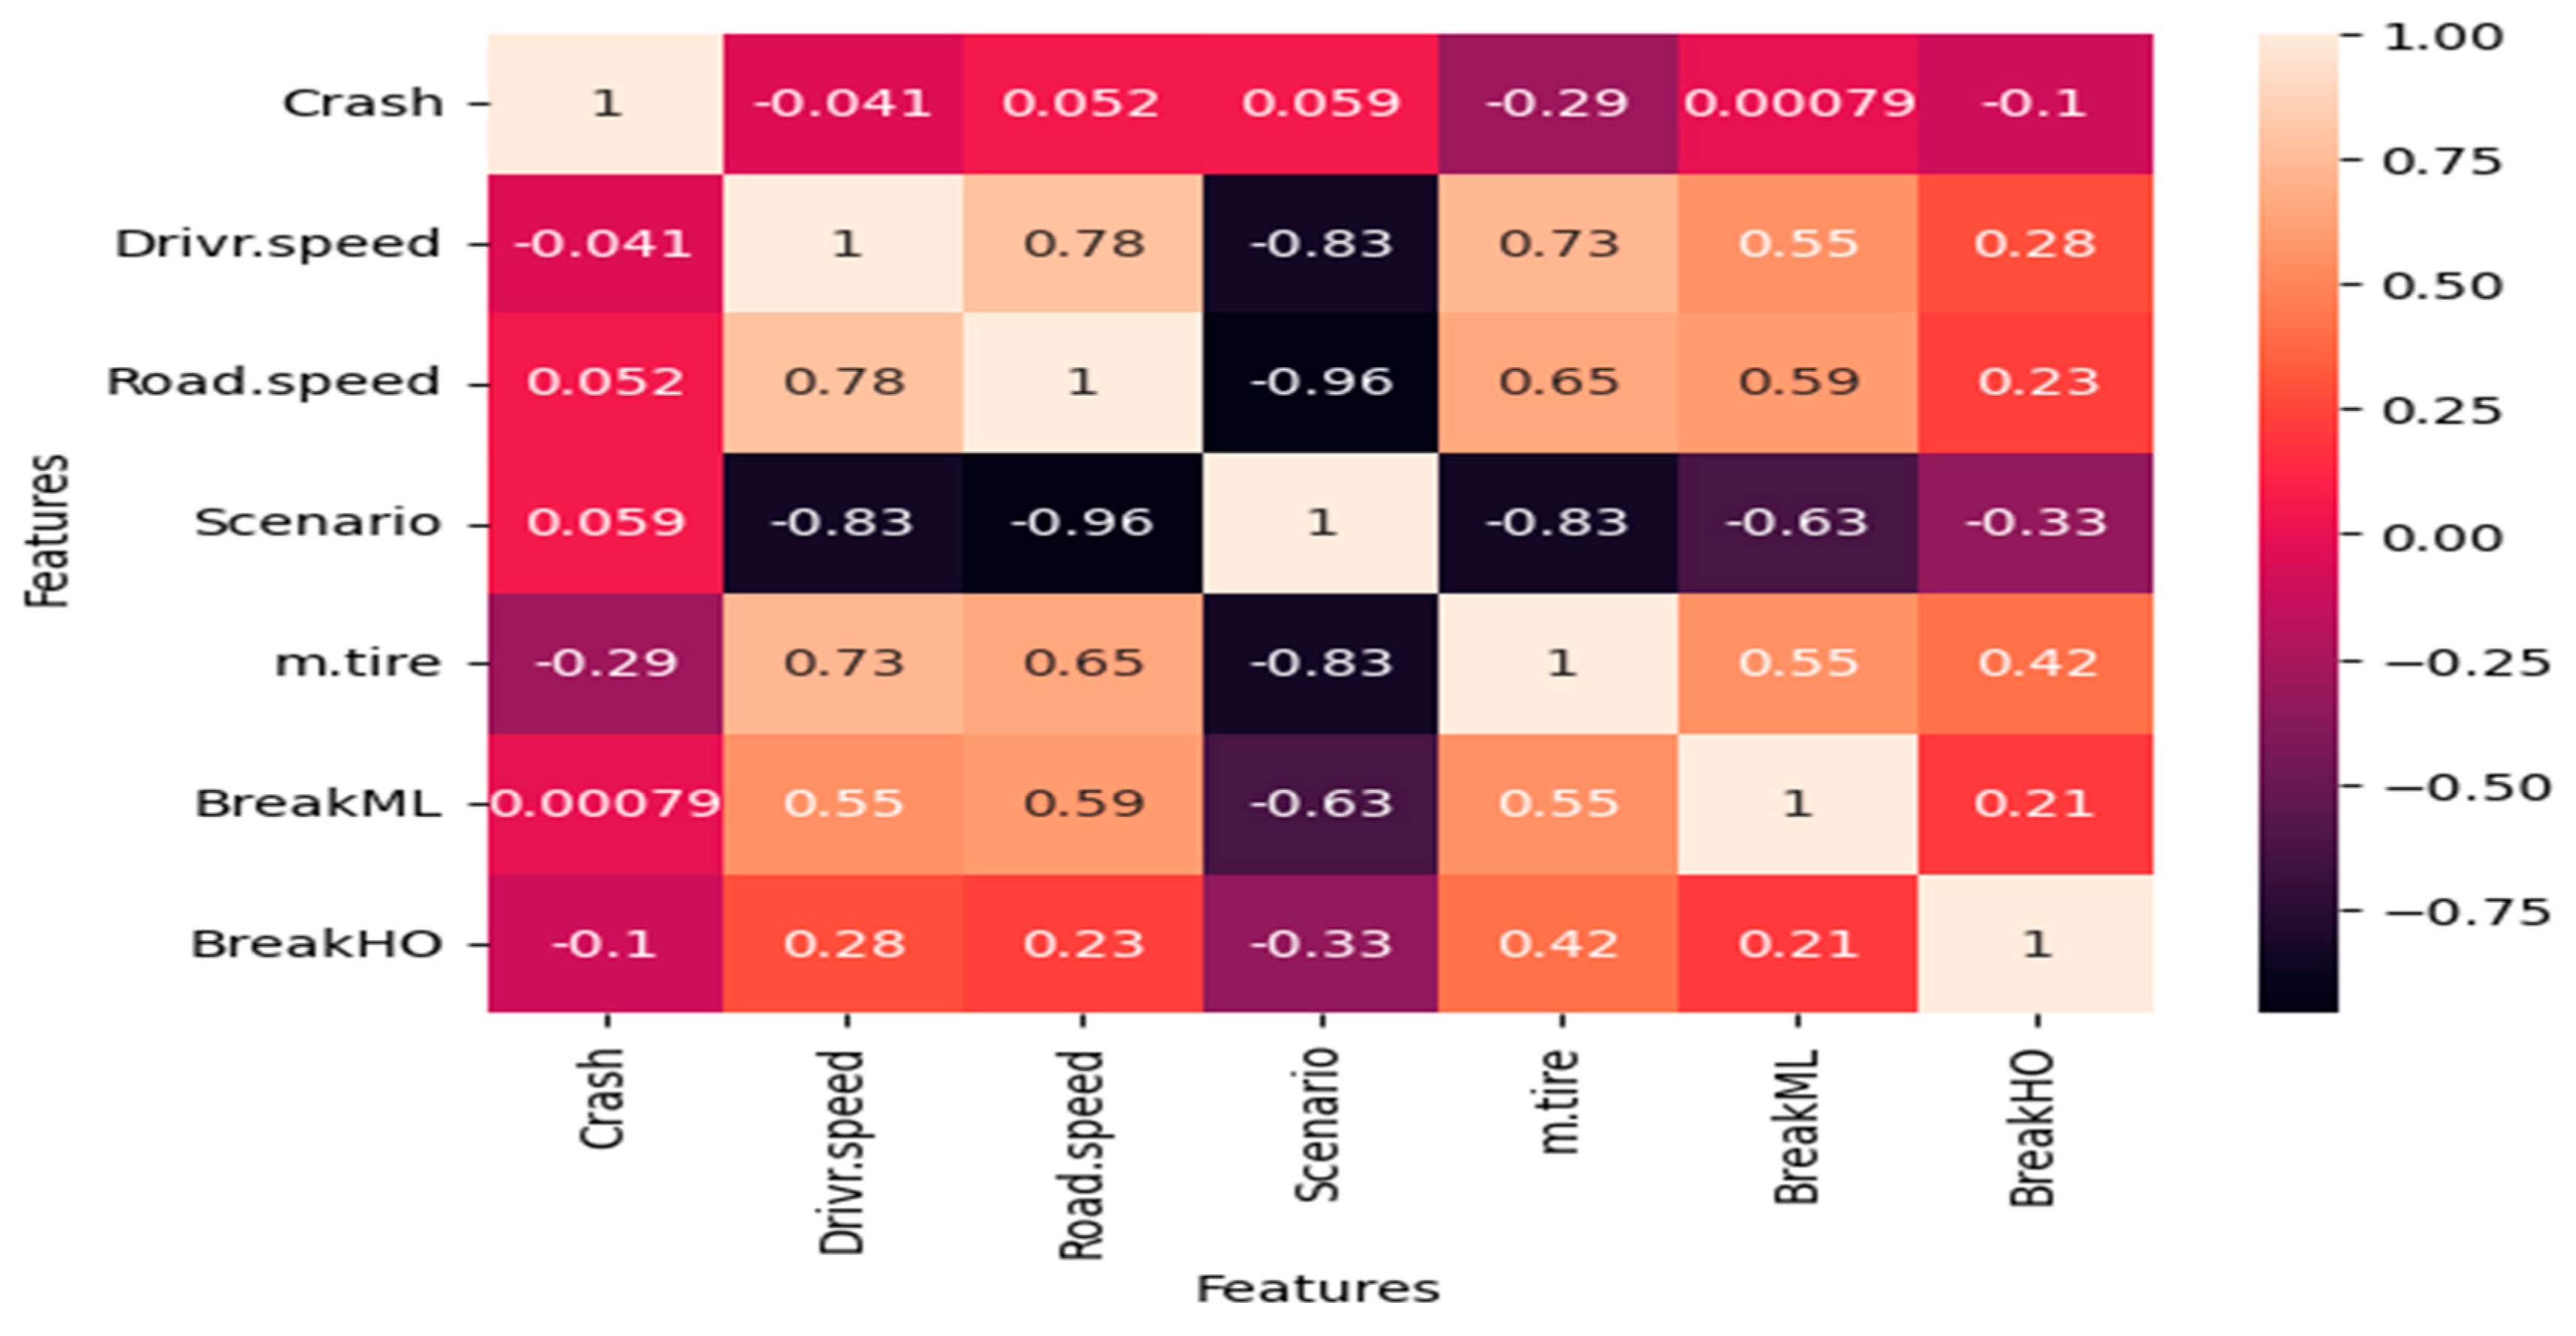
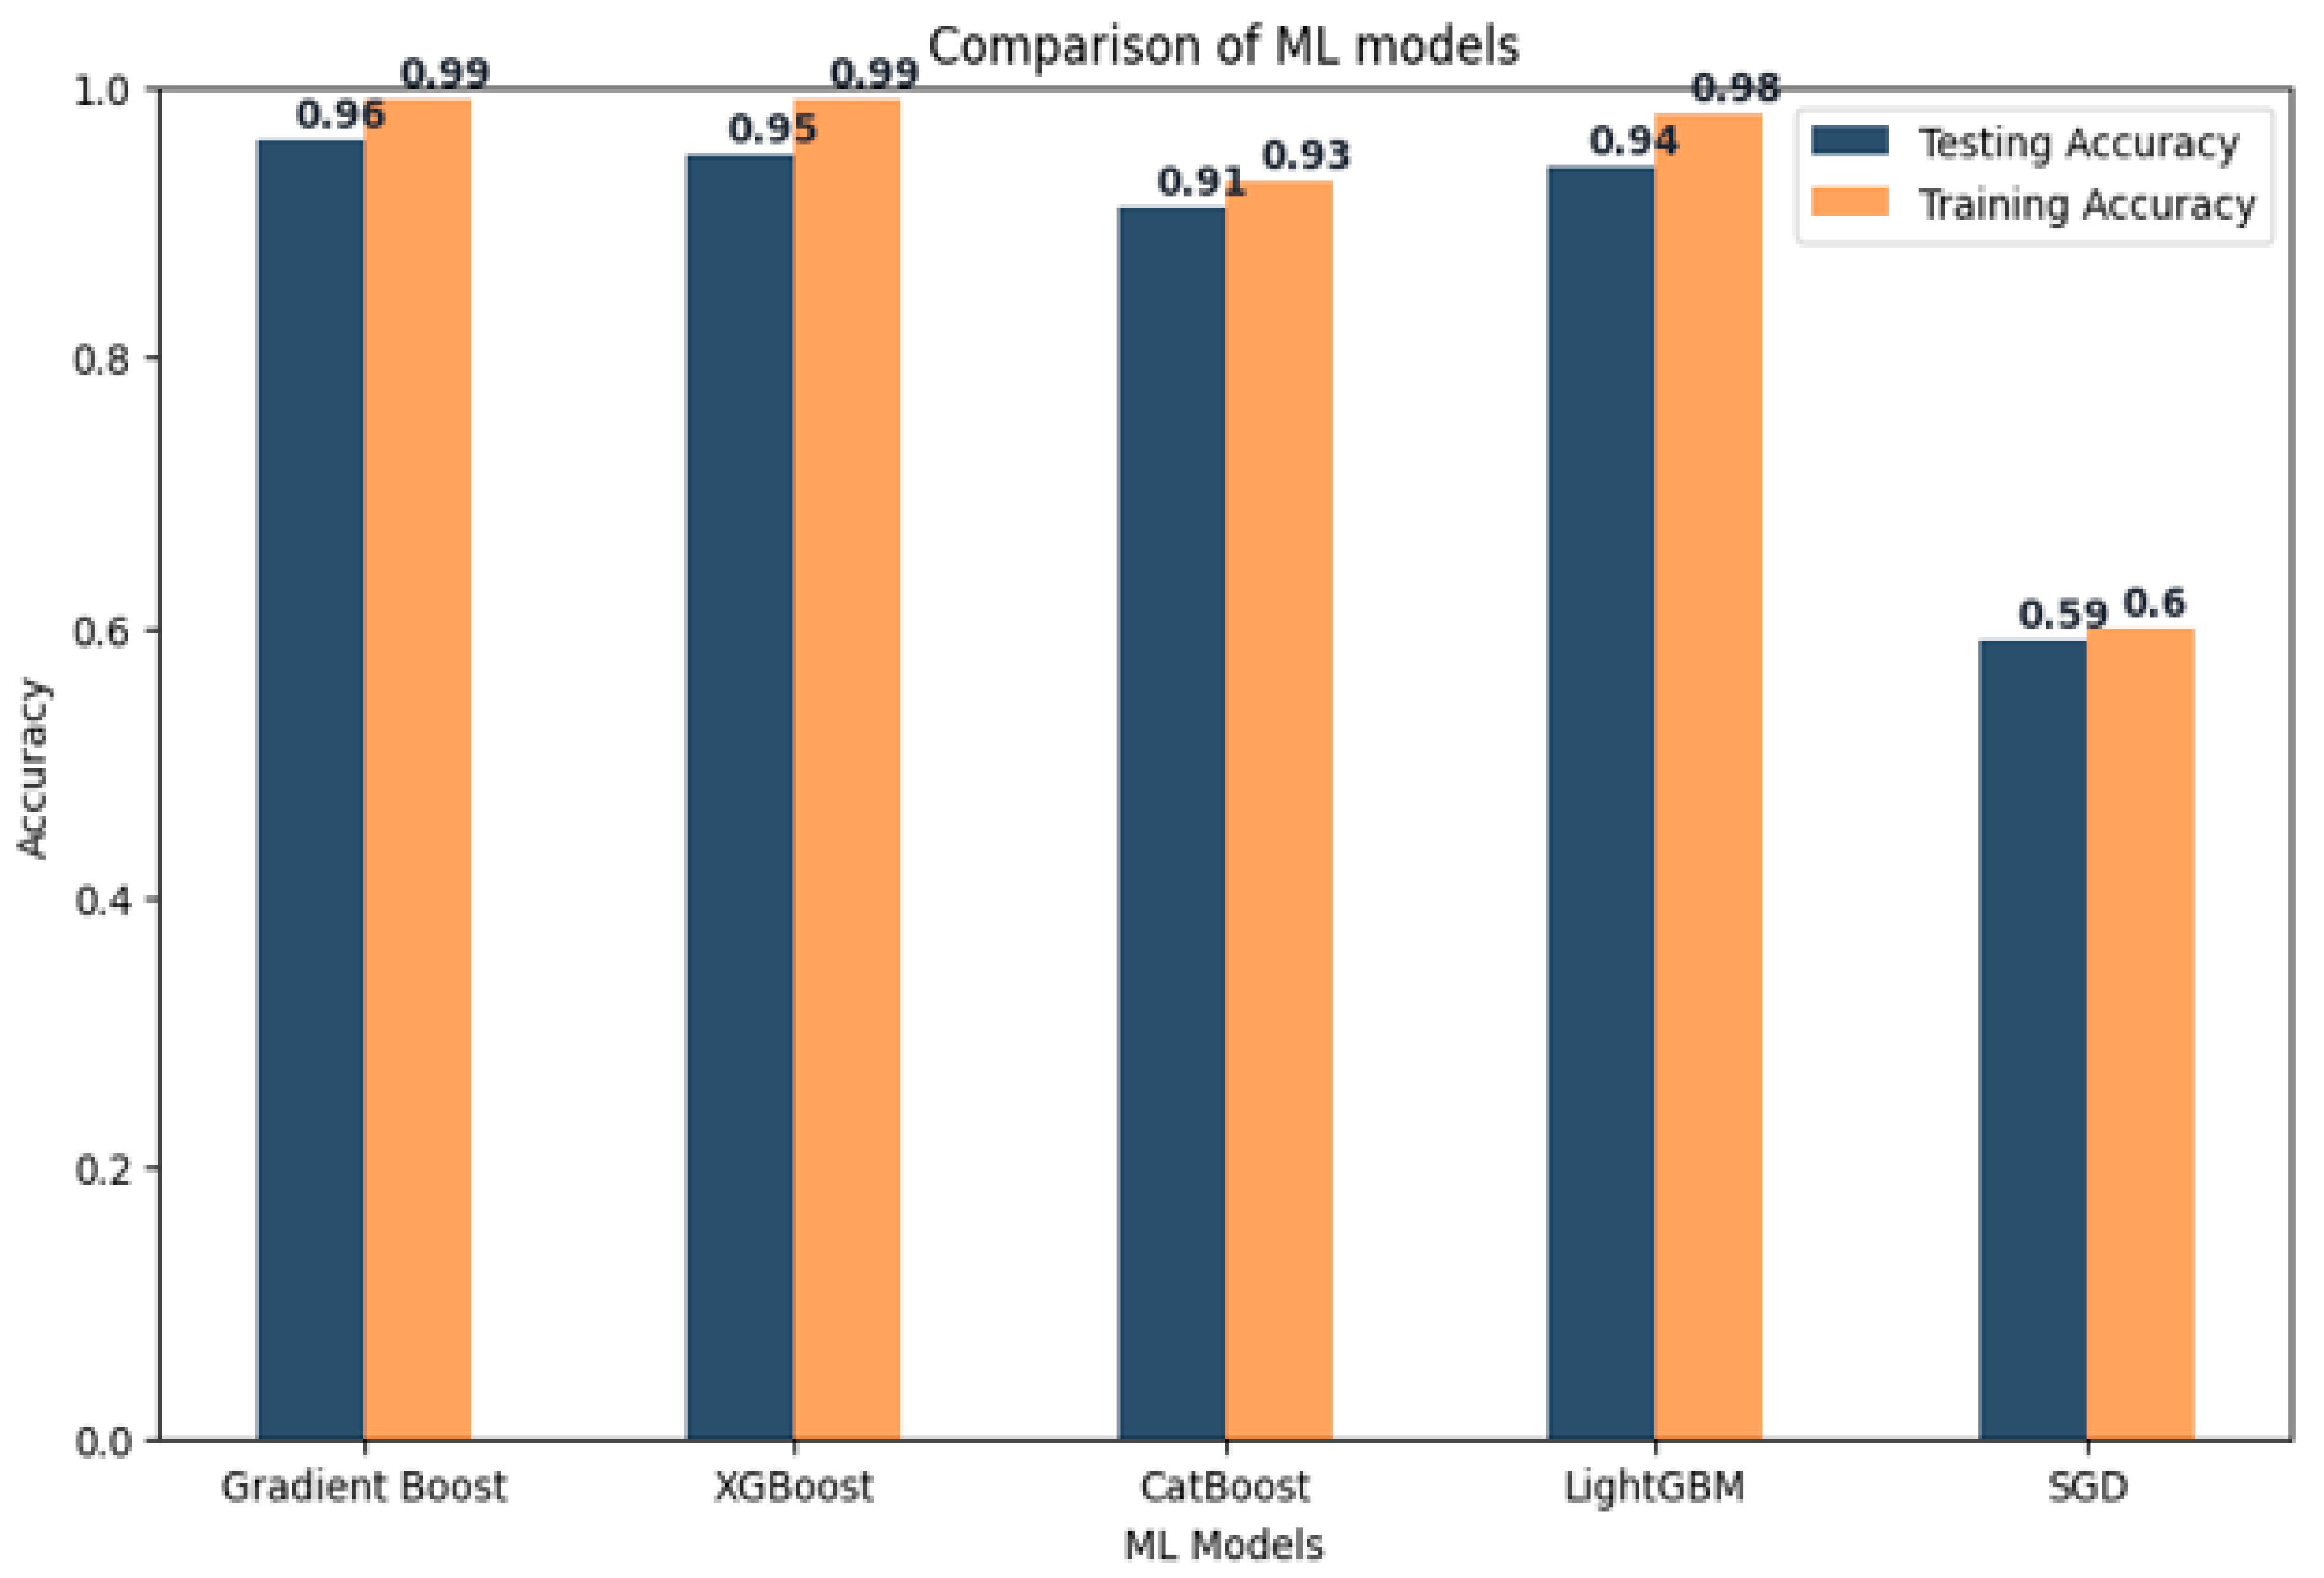
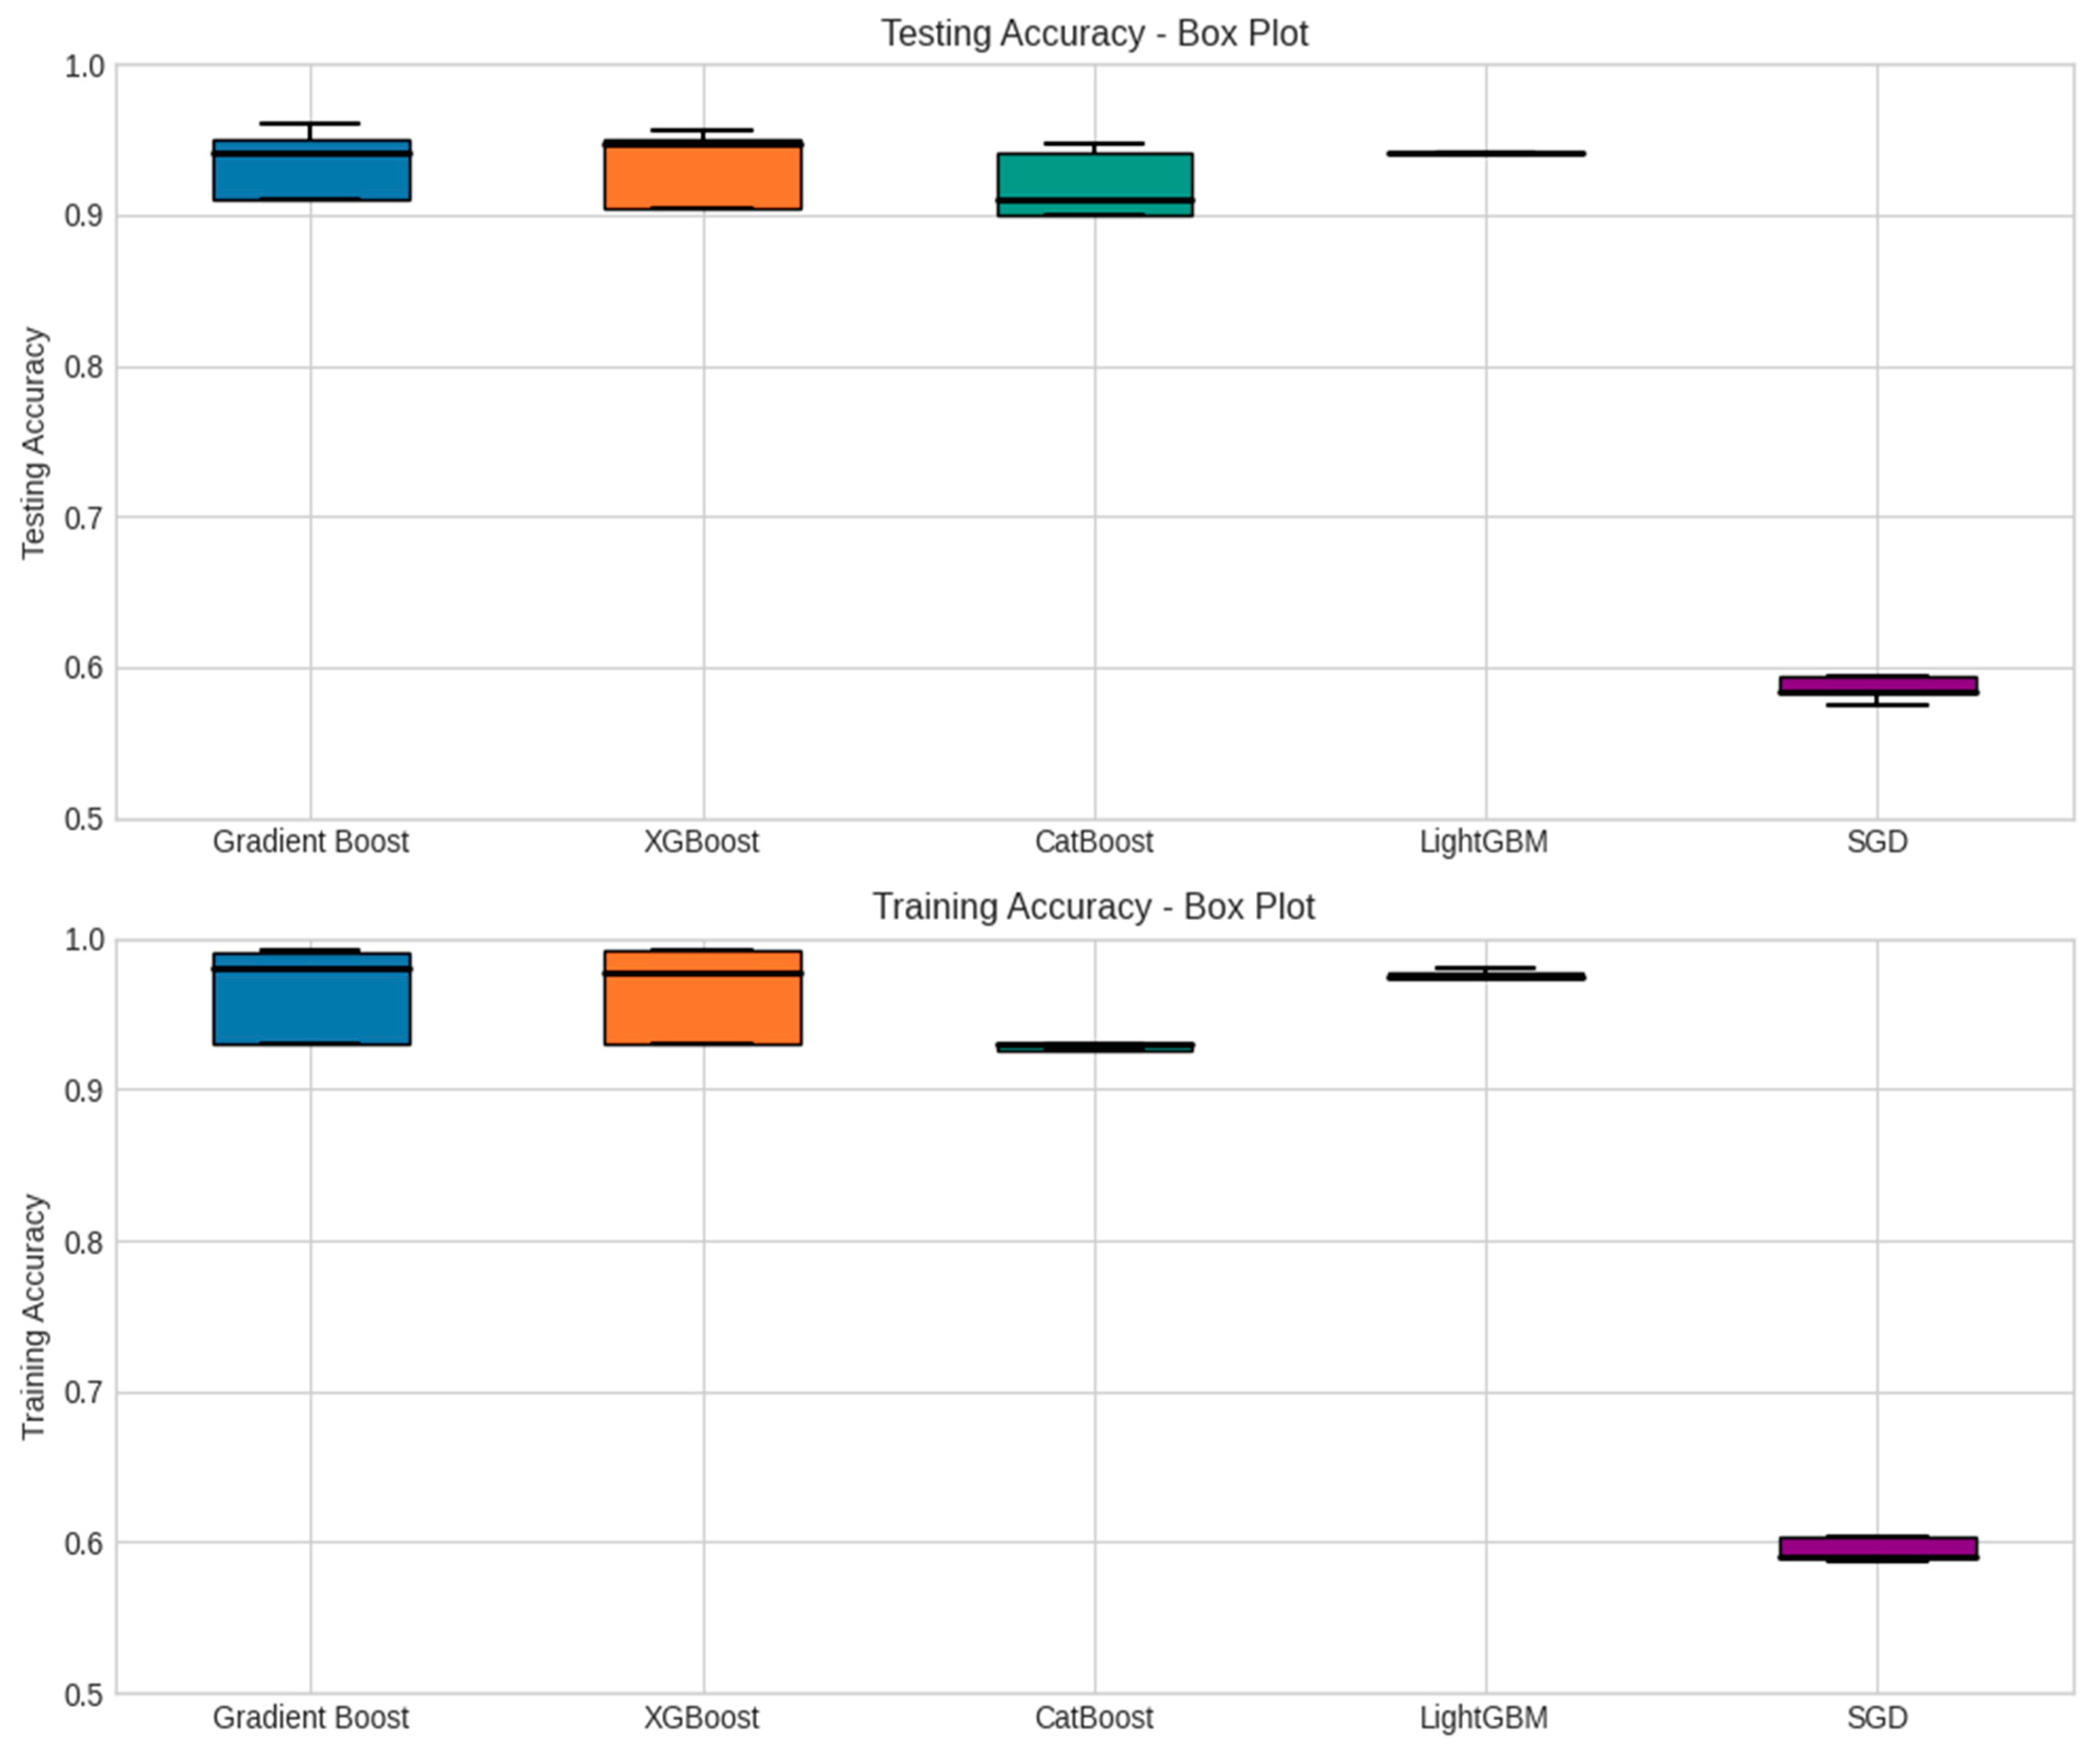
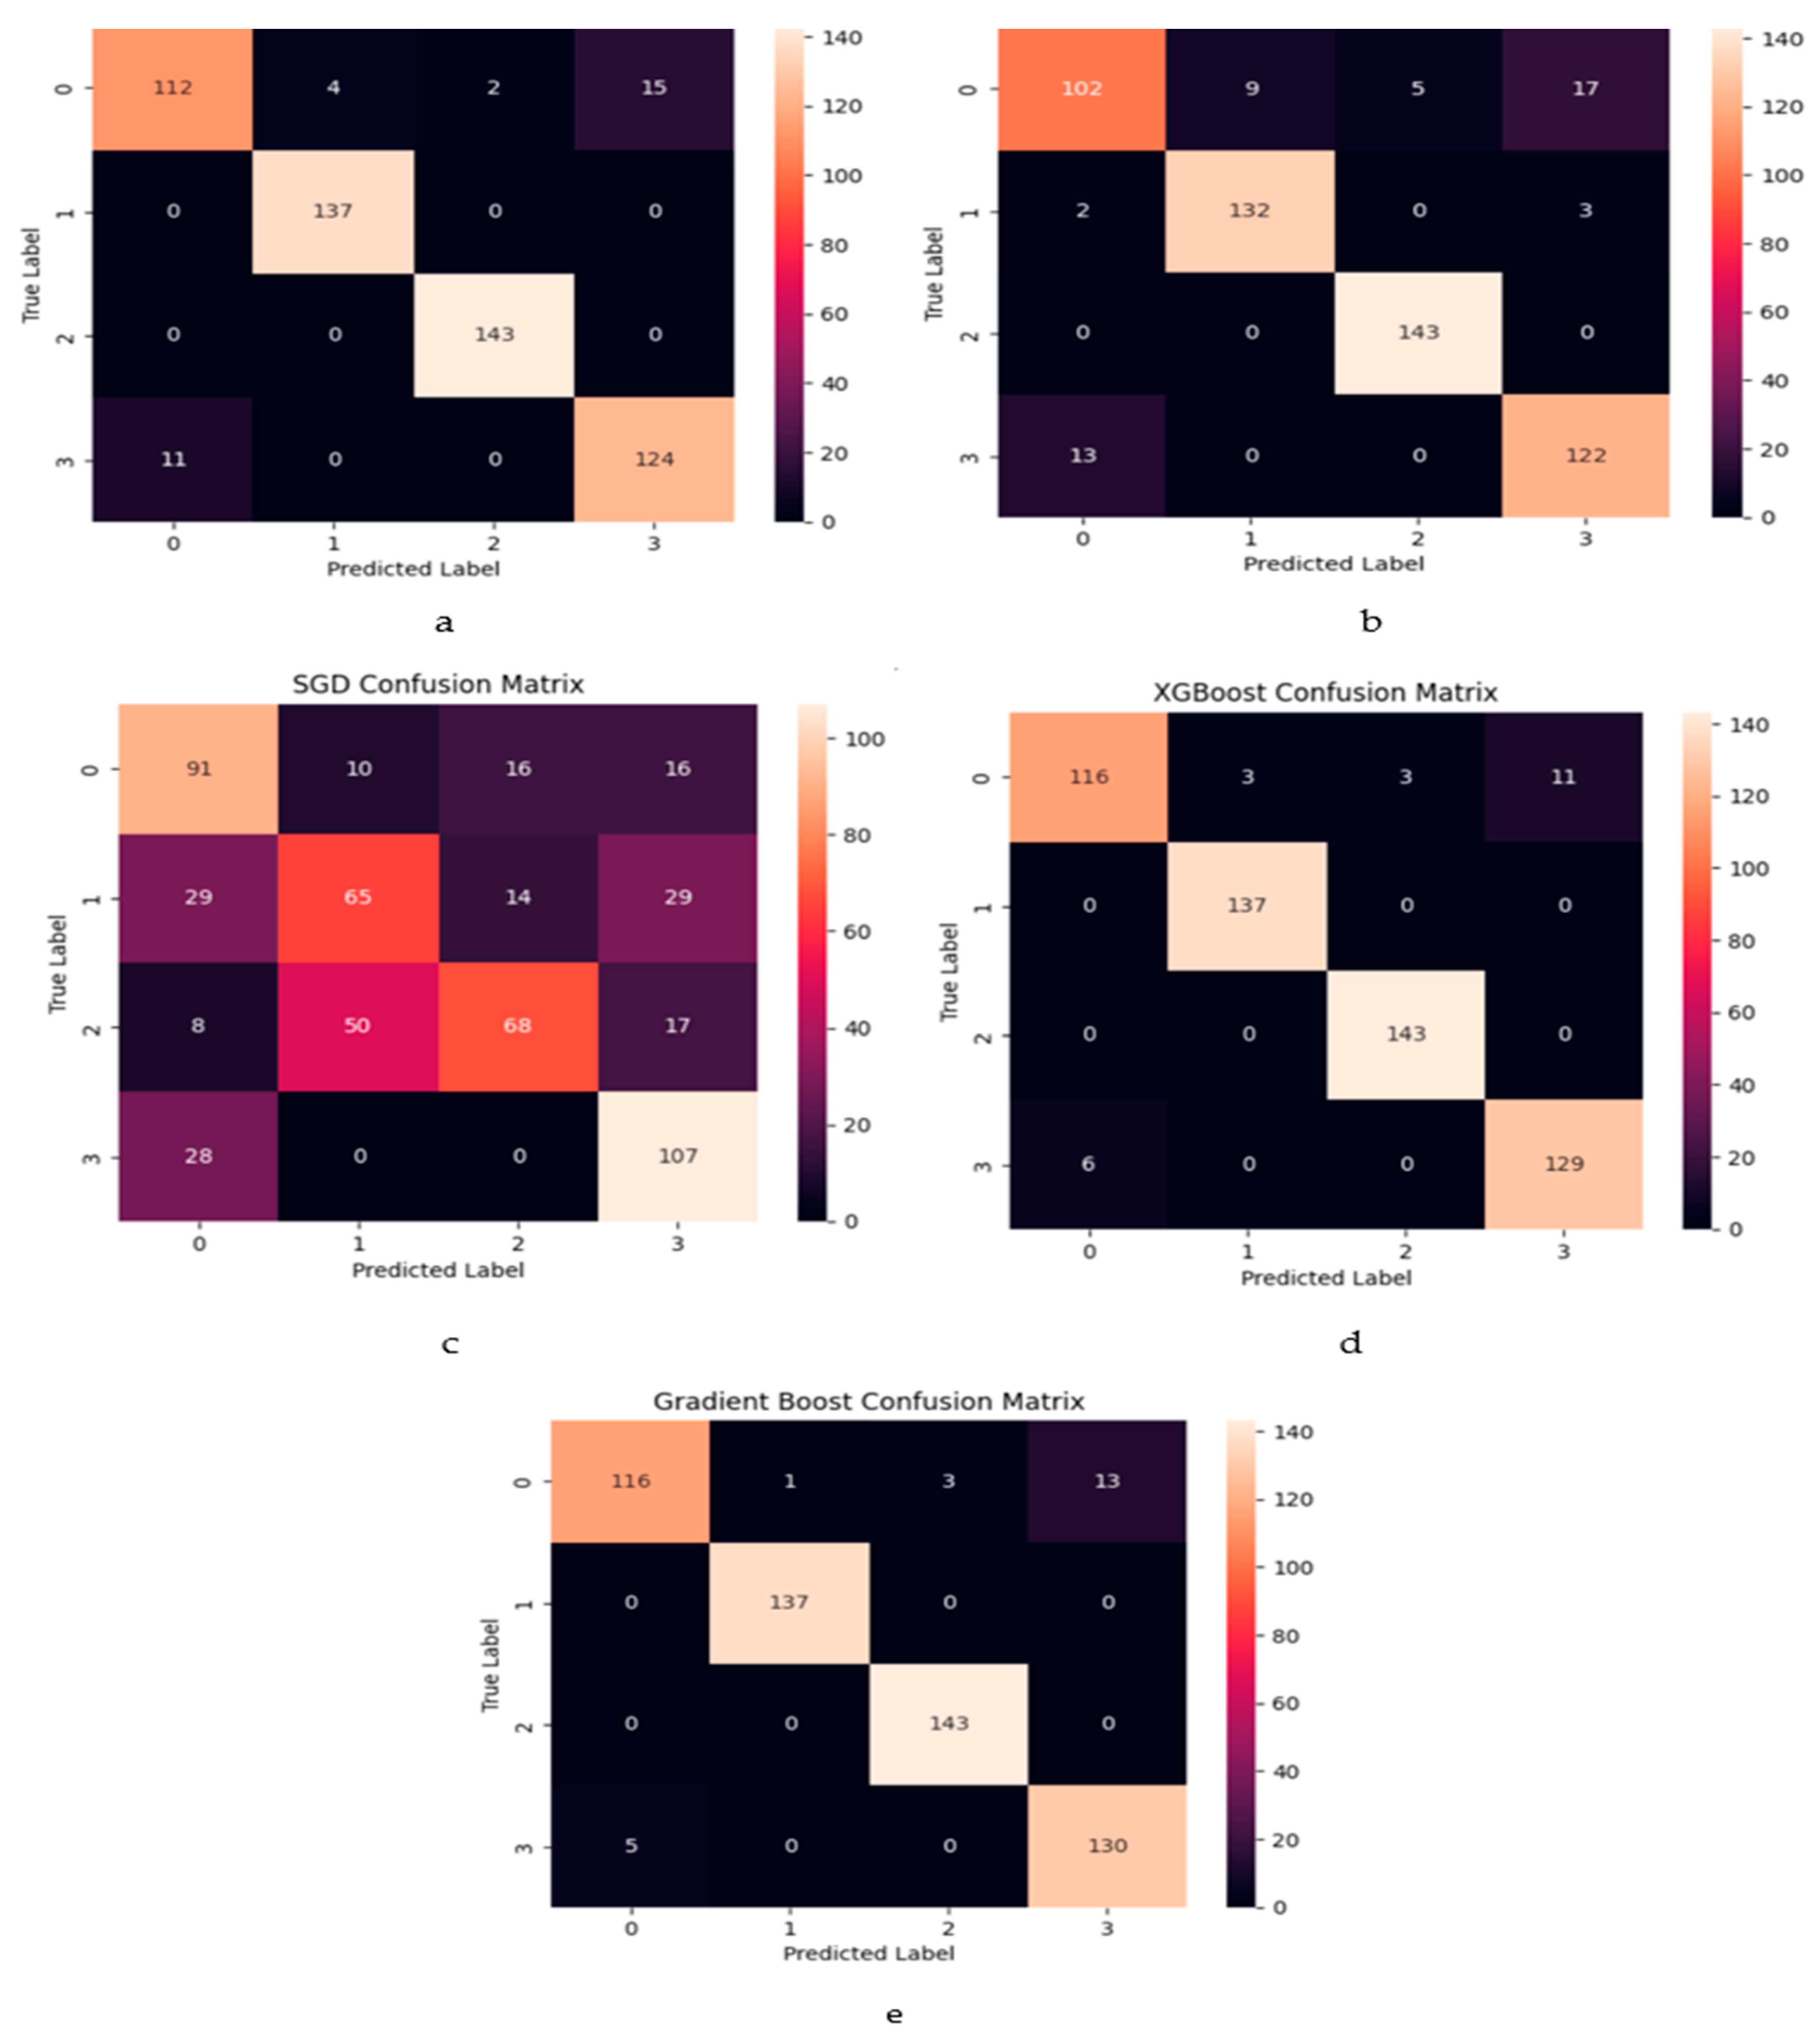