Article

Evaluation of Selected Empirical Models for Asphalt Pavement Temperature Prediction in a Tropical Climate: The Case of Ghana

1
Regional Transport Research and Education Centre Kumasi (TRECK), Department of Civil Engineering, Kwame Nkrumah University of Science and Technology, Kumasi AK-448-4924, Ghana
2
CSIR—Building and Road Research Institute, Kumasi AE-0608-9501, Ghana
3
Alabama Transportation Institute, University of Alabama, Tuscaloosa, AL 35487, USA
*
Author to whom correspondence should be addressed.
Sustainability 2023, 15(22), 15846; https://doi.org/10.3390/su152215846
Submission received: 26 July 2023 / Revised: 18 September 2023 / Accepted: 19 September 2023 / Published: 11 November 2023
(This article belongs to the Special Issue Pavement Materials and Sustainability)

Abstract

:
Asphalt pavement temperature has several applications, including pavement structural design and evaluation, asphalt mixture design, asphalt binder grade determination and material aging characterization. However, available asphalt pavement temperature prediction models were mostly developed for temperate climatic conditions. Before such models are adopted for use in a tropical climate to facilitate advanced pavement engineering, their applicability must be verified. This study evaluated five empirical asphalt pavement temperature prediction models: the Lukanen (BELLS 3), Park, Diefenderfer, and Taamneh models, all developed in the United States, and the Asefzadeh model, formulated in Canada, to ascertain their prediction accuracy in a tropical climate, using the West African country Ghana as a case study. The results of such a model evaluation study will justify the adoption of existing models for local application or the development of new ones suitable for tropical climates. In this study, in situ asphalt pavement temperature data were measured at two sites for eight months: Kumasi and Tamale in the Forest and Savannah climatic zones, respectively. The measured pavement temperature data were compared with predicted pavement temperatures using the two independent-samples t-test, the coefficient of determination, the line of equality, and three error statistics (mean bias error, mean percentage error and root mean square error). It was found that the Park model provided a more accurate pavement temperature prediction in both climatic zones. The other models either over-predicted or under-predicted asphalt pavement temperature with significant error margins. However, there is a need to improve the prediction accuracy of the Park model as considerable over-prediction occurred at a temperature of at least 47 °C or a local model developed.

1. Introduction

Asphalt pavement temperature is useful for pavement analysis and design, asphalt mixture design, aging characterization and asphalt binder grade selection. For instance, in using a falling weight deflectometer (FWD) for structural evaluation of asphalt pavements, in situ pavement temperature data are useful for adjusting the back-calculated asphalt layer modulus to a reference temperature [1], since asphalt layer deflection is significantly influenced by pavement temperature [2]. The long-term aging of asphalt material affects the durability and performance of asphalt pavements [3]. The aging process is a function of ambient temperature; hence, the determination of asphalt pavement temperature is useful in characterizing the aging process to improve pavement structural analysis and design. Additionally, in situ pavement temperature data are necessary for selecting appropriate binder grades, such as the Superior Performing Asphalt Pavements (Superpave) binder grade [4].
Over the years, in situ asphalt pavement temperature has been determined by direct, manual measurements. While in situ temperature measurement may provide accurate data, the process is slow and may pose safety risks [2]. Additionally, the temperature data apply to single-drilled holes [1,2]. Comparatively, asphalt pavement temperature prediction models provide quicker, safer and efficient means of obtaining temperature data over a broader range of conditions [1,2,5]. Hence, several asphalt pavement temperature prediction models have been developed for pavement engineering applications. For instance, Walia et al. [6] developed an asphalt pavement temperature prediction model based on air temperature, time, and pavement depth. Viljoen [7] also developed asphalt pavement temperature prediction models that required input of air temperature, cloud cover, asphalt layer depth, and zenith angle. As may be expected, the prediction capability of such models may be limited to the geographical location of the model development. Extrapolation will require an assessment to ascertain the prediction accuracy of the models.
Ghana, a Sub-Saharan African country, similar to many others, does not have an asphalt pavement temperature prediction model. There is a trend toward Superpave binder grade utilization in Ghana, but the binder grade determination appears to be ad hoc, owing to the non-existence of a locally developed pavement temperature prediction model. A survey conducted in Ghana by the authors of this paper has shown that pavement engineering practitioners desire validated asphalt pavement temperature prediction models for various uses. Koranteng-Yorke [8], as part of a broader scope of developing a pavement design framework for Ghana, formulated relationships between ambient temperature and asphalt layer temperature using data from two roads. The relationships were not validated and no goodness-of-fit parameters were reported.
The challenge with using asphalt pavement temperature prediction models developed elsewhere is that their accuracy is generally constrained within the scope of the original model development data and their prediction accuracy will require evaluation before their application in significantly different environments [1].
This study evaluated the prediction accuracy of the Lukanen (BELLS 3) [9], Park [10], Diefenderfer [11], Taamneh [12], and Asefzadeh [13] models for asphalt pavement temperature prediction under the climatic conditions of Ghana, a West African country situated between latitudes 4° and 12° N and longitudes 1°12′ E and 3°15′ W. It is bordered by the Atlantic Ocean and the Gulf of Guinea on its southern side. The maximum elevation is 885 m above sea level, in the southeast. The climate is tropical with two seasons: dry and wet. Based on climate records spanning 90 years (1931–2020), the annual mean rainfall is 1200 mm, with a coefficient of variation (COV) of 5% [14,15]. The data also indicated the lowest monthly average air temperature between 20 °C and 25 °C (COV of 6%) and the highest monthly mean air temperature between 29 °C and 36 °C (COV of 7%). Asphalt pavement temperature data were collected for eight months from two major cities to examine the prediction accuracy of the selected models in a tropical environment. Climate data were sourced from Ghana Meteorological Agency (GMet) weather stations located near the study roads. R-studio and SPSS statistics, were used for the statistical analysis.

2. Asphalt Pavement Temperature Prediction

Asphalt pavement temperature prediction models may be empirical, numerical, or analytical, based on their theoretical underpinnings and method of analysis [16,17,18]. Numerical and analytical models, jointly referred to as theoretical models, are based on heat flow theories and require solving partial differential equations for defined boundary conditions. On the other hand, empirical models are regression-based equations that show a relationship between pavement temperature and prediction factors such as climate variables, geolocation information, and pavement surface temperature [17,18].
Theoretical models are generally perceived to be cumbersome for practical purposes due to the complexities associated with boundary conditions definition, as well as the numerous input data requirements [5,16,17]. Such models are developed using both climatic data (e.g., air temperature, solar radiation) and pavement properties (e.g., surface albedo, emissivity, surface heat capacity, thermal conductivity); the last set of data is difficult to obtain. Chen et al. [18] noted that most of these pavement properties are sourced from literature, which makes them prone to approximation errors. In contrast, regression-based empirical models are developed from climatic, geographic, and pavement surface temperature data which are easier to obtain, and the models are easily applicable. For example, climatic data are available either from meteorological databases or weather stations located near project sites. Difficult-to-measure climatic parameters such as solar radiation can be easily estimated. Notwithstanding, neural-based empirical models (e.g., Refs. [16,19,20]), by their nature, do not provide explicit mathematical equations for estimating pavement temperature, making their application very difficult.

2.1. Models Selected for Evaluation

Several asphalt pavement temperature prediction models were considered for evaluation based on ease of model application and availability of input data. By these criteria, theoretical and neural-based empirical models were excluded from evaluation. The selected models are briefly described below.

2.1.1. The BELLS 3 Model

Lukanen et al. [9] developed the original version of the BELLS asphalt pavement temperature prediction model using data from the Long-Term Pavement Performance (LTPP) program. Data collected between 1994 and 1996 from 41 sites, in the U.S. were used to develop and validate the model. The asphalt layer thicknesses of the study pavements ranged from 46 mm to 305 mm. The BELLS 3 [9] model, the second version of the original BELLS model, accounts for shading on the pavement surface to allow for a wider range of applications of the model [9]. The BELLS 3 [9] model predicts asphalt pavement temperature at a specified depth using inputs of infrared-measured pavement surface temperature, time of day, previous day’s mean air temperature, and depth below the pavement surface, as illustrated in Equation (1). The adjusted coefficient of determination (R2) and the standard error (S.E) of the BELLS 3 [9] model were reported as 0.975 and 1.9 °C, respectively.
T d = 0.95 + 0.892 I R + log d 1.25 1.83 sin h r 18 15.5 0.448 I R + 0.621 T a v g                                                   + 0.042 I R sin h r 18 13.5
where
  • T d = Pavement temperature at desired depth (°C),
  • IR = Infrared-measured pavement surface temperature (°C),
  • d = Depth at which pavement temperature is required (mm),
  • T a v g = Mean of maximum and minimum air temperature on the day before FWD testing (°C),
  • sin = Sine function on an 18 h clock system (one 18 h cycle equals 2π radians), and
  • h r 18 = Time of day in 24 h (converted to 18 h asphalt concrete rise and fall cycle).

2.1.2. The Diefenderfer Model

The Diefenderfer [11] models predict daily maximum and minimum pavement temperatures. The models were developed with data collected from the Virginia Smart Road test facility, while data from the LTPP sites were used for their validation [11]. Pavement temperatures were measured at depths ranging from 38 mm to 188 mm using thermocouples. The daily maximum pavement temperature prediction model had an adjusted R2 of 0.78 and a root mean square error (RMSE) of 5.8 °C. The model for predicting the daily minimum pavement temperature was not considered in this study. The daily maximum pavement temperature prediction model, as provided by [11], is shown in Equation (2).
T p m a x = 2.78752 + 0.686 T a m a x + 5.6736 × 10 4 R s 27.8739 P d
where
  • T p m a x = Predicted maximum pavement temperature (°C),
  • T a m a x = Daily maximum air temperature (°C),
  • R s = Daily solar radiation (kJ/m2 day), and
  • P d = Depth from pavement surface (m).

2.1.3. The Taamneh Model

Taamneh [12] developed models for predicting daily maximum and minimum asphalt pavement temperatures using data collected on Interstate 90 in the U.S. state of Ohio. The daily maximum pavement temperature model had an adjusted R2 of 0.83 and RMSE of 5.1 °C and is shown in Equation (3).
T p m a x = 9.720 + 0.947 T a m a x 24.179 P d 1.231 W S + 4.01 × 10 4 R s
where
  • T p m a x   = Predicted maximum pavement temperature (°C),
  • T a m a x = Daily maximum air temperature (°C),
  • P d = Depth below pavement surface (m),
  • WS = Daily wind speed (m/s), and
  • R s = Daily solar radiation (kJ/m2 day).

2.1.4. The Park Model

The Park [10] model predicts asphalt pavement temperature based on pavement surface temperature, depth below the asphalt layer surface, and the time at surface temperature measurement. The model does not require the use of climatic variables and was developed from three test roads in the U.S. state of Michigan. As shown in Equation (4), the Park [10] model had an adjusted R2 of 0.90.
T d = I R + ( 0.3451 d 0.0432 d 2 + 0.00196 d 3 ) sin ( 6.3252 t + 5.0967 )
where
  • T d = Asphalt pavement temperature at depth, z (°C),
  • I R = Asphalt pavement surface temperature (°C),
  • d = Depth where pavement temperature is required (cm), and
  • t = Time at surface temperature measurement (days).

2.1.5. The Asefzadeh Model

The set of Asefzadeh [13] models predicts the daily average asphalt pavement temperature for warm season, daily average pavement temperature for cold season, daily minimum pavement temperature, and daily maximum asphalt pavement temperature. The model for daily maximum pavement temperature prediction, evaluated in this study, is provided in Equation (5) [13]. Two years’ worth of data collected from an instrumented road test section at the Integrated Road Research Facility in Edmonton, Canada, were used to develop the model, while another two-month volume of data from the same facility was used for the model validation. The temperature data were collected at these depths ranging from 20 mm to 250 mm. The Asefzadeh [13] daily maximum pavement temperature model was reported to have an adjusted R2 of 0.913.
T p m a x = 2.0237 + 0.8709 T a m a x + 7.6 × 10 4 R s 16.1886 P d
where
  • T p m a x = Predicted daily maximum pavement temperature (°C),
  • T a m a x = Daily maximum air temperature (°C),
  • R s = Daily solar radiation (kJ/m2 day), and
  • P d = Depth from pavement surface (m).

3. Materials and Methods

3.1. Study Area

This study was conducted in the two Ghanaian cities of Kumasi and Tamale, respectively representing the Forest and Savannah zones, two of the three climatic zones of Ghana [21]. The Savannah zone stretches between latitudes 7°46′48″ N and 11°0′0″ N and has the hottest and driest conditions, with a uni-modal rainfall pattern [21]. The Forest zone spans from approximately 30 km north of the Gulf of Guinea to latitude 7°46′48″ N [21] and is characterized by bi-modal rainfall patterns and is relatively cool and wet. The Savannah and Forest zones record average annual rainfall of 900–1200 mm and 1300–1800 mm, respectively [22]. The average monthly relative humidity ranges from 20% to 70% for the Savannah zone and from 30% to 80% for the Forest zone [8,21]. The Savannah and Forest climatic zones constitute the largest portion of the country, as seen in Figure 1.

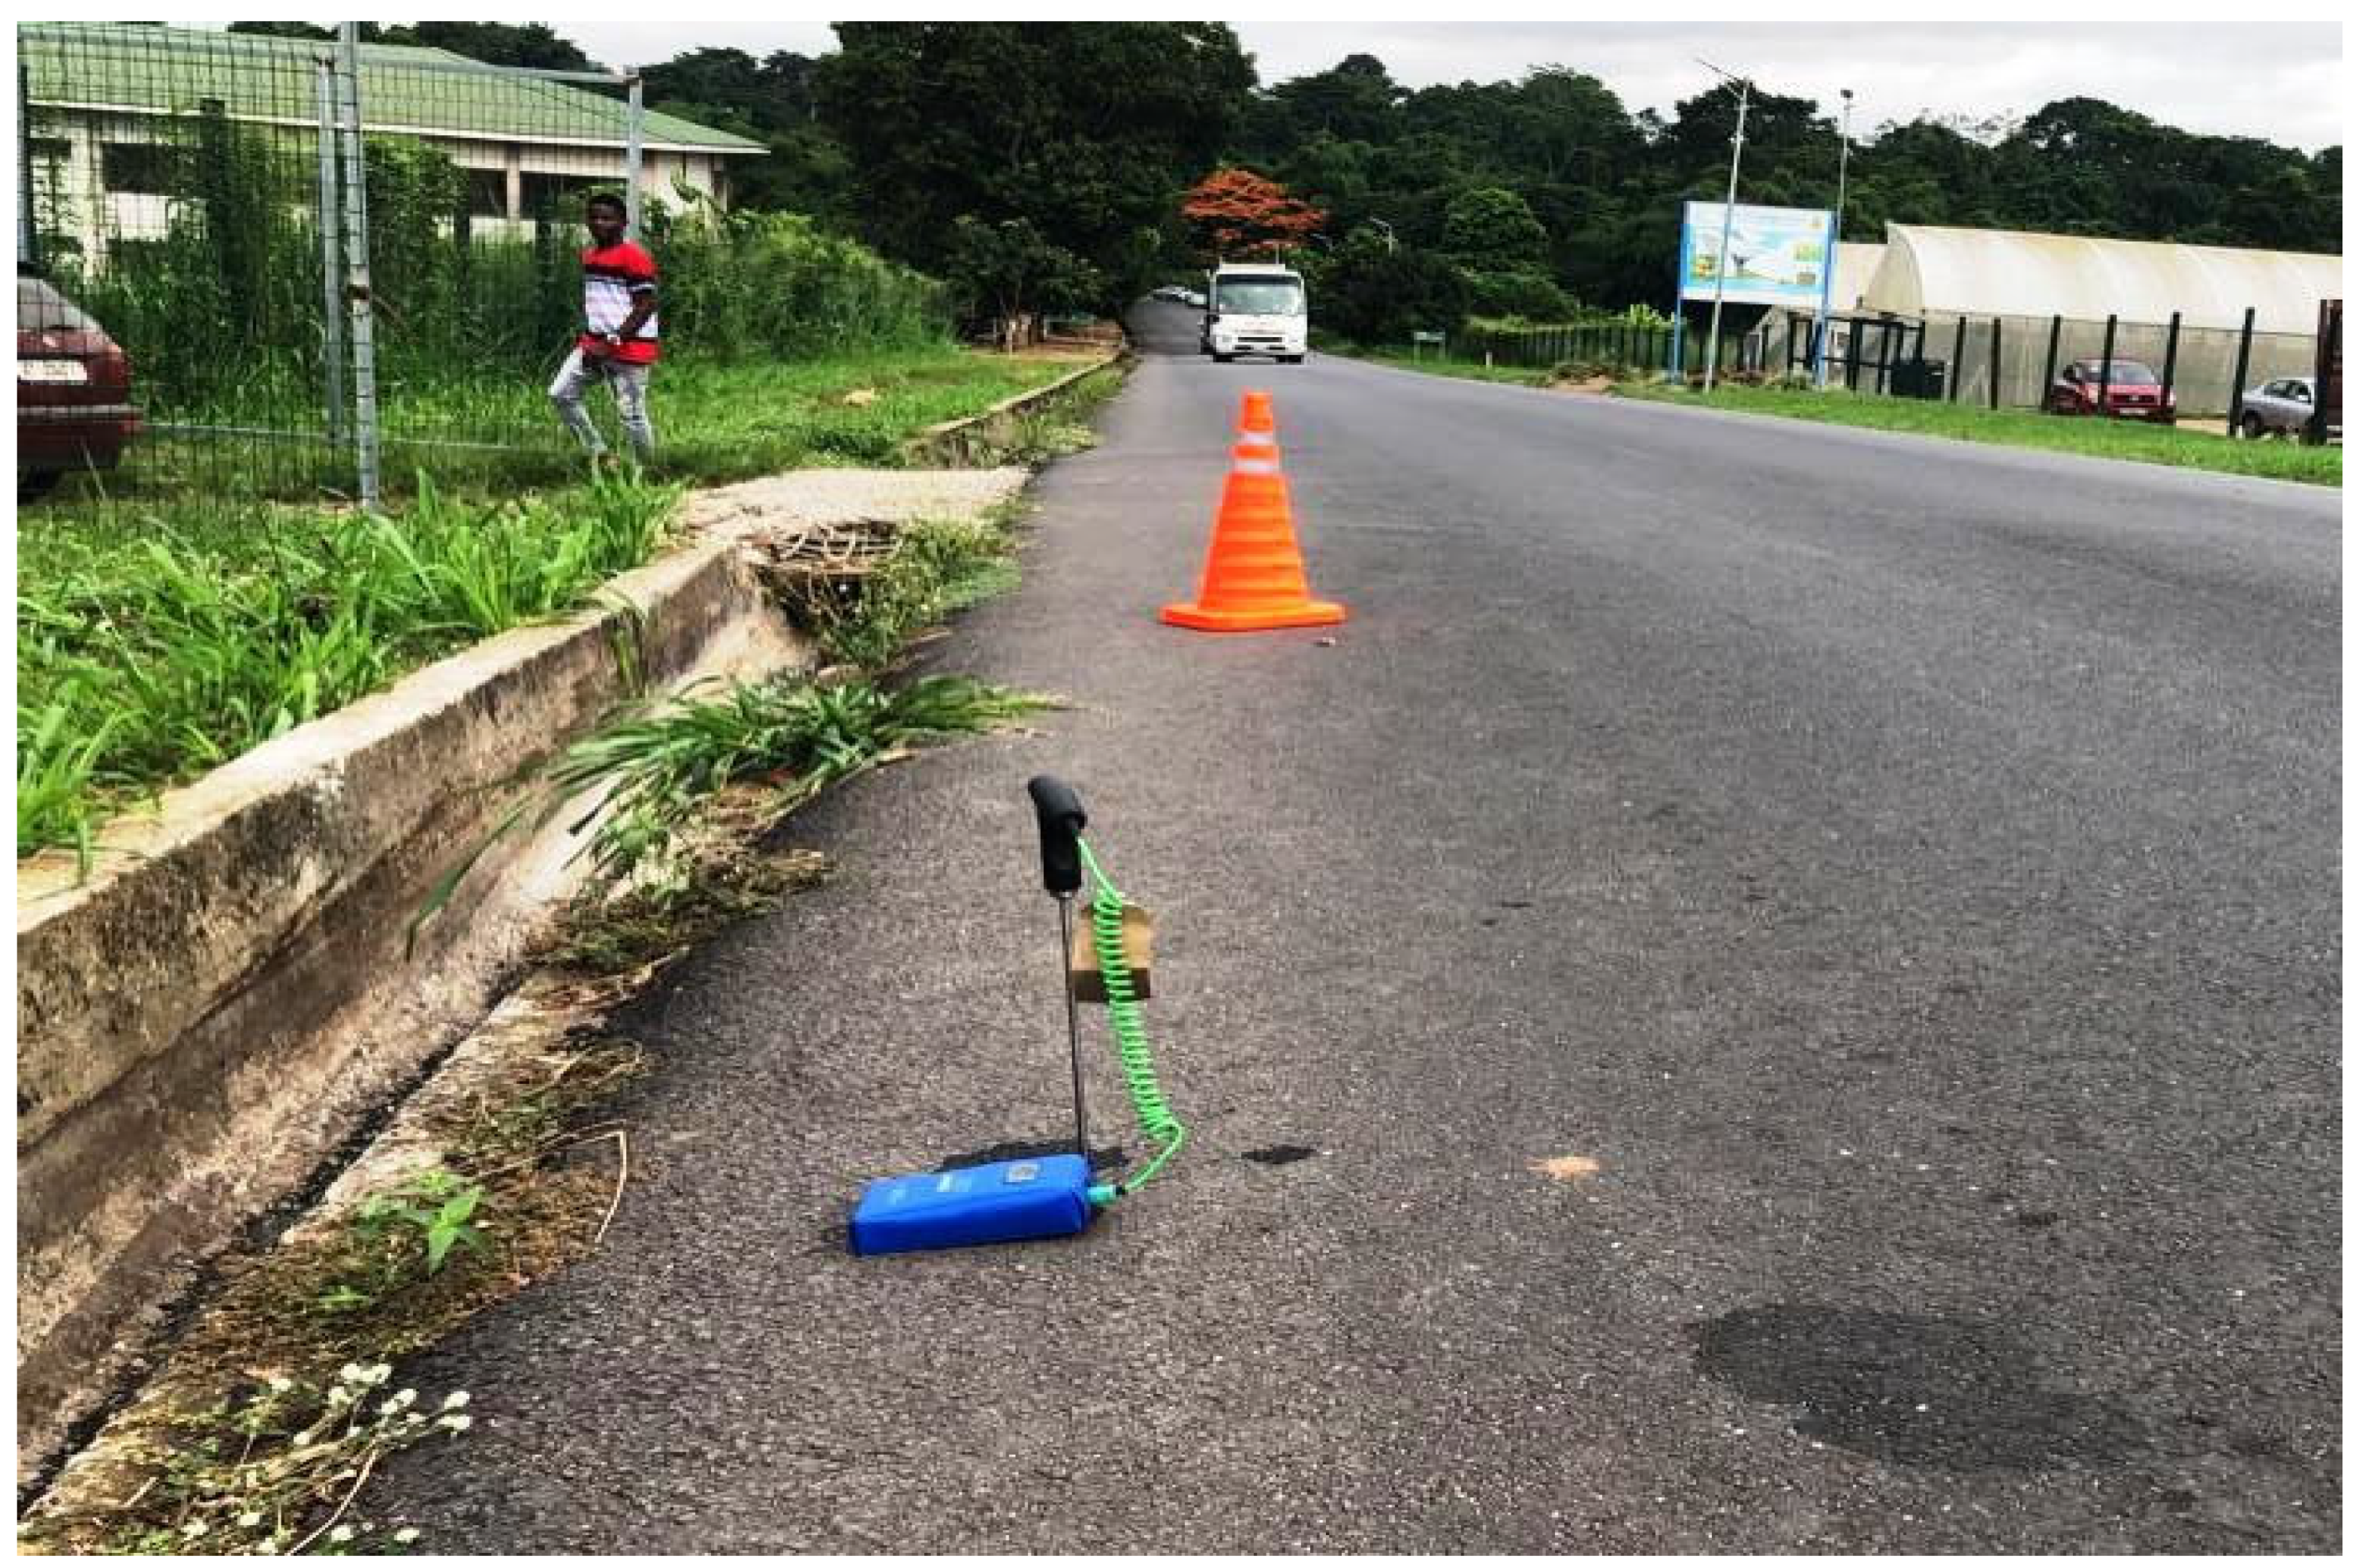
3.2. Data Collection

A study road was selected in the Kumasi (Forest zone) and Tamale (Savannah zone) for asphalt pavement temperature and climatic data collection. The roads were within 3 km of a Ghana Meteorological Agency (GMet) synoptic weather station and had received AC overlay in 2021. The data collection points had no tree cover and were on a generally flat terrain for safety reasons. Table 1 provides additional details of the study roads.
In situ pavement temperatures were measured using Impact Model LH44T digital thermometer manufactured by Impact Test Equipment Limited. (Stevenston, UK). The pavement surface temperatures were measured using the RayTemp38 infrared thermometer manufactured by Electronic Temperature Instruments Limited (ETI), Worthing, UK. A digital thermometer was installed in drilled holes at a depth of 38 mm and 35 mm, representing the asphalt concrete (AC) layer mid-depth of the study roads in Kumasi and Tamale, respectively. Figure 2 shows a digital thermometer installed in a drilled hole for mid-depth pavement temperature measurement. The drilled holes were 8 mm in diameter and were located near the pavement edge. Glycerin was used to fill the bottom 12 mm of the holes to prevent heat loss.
The installation of the digital thermometers was done 20 min before taking the first reading at 6:00 GMT, and the thermometer was left in place until after the last reading of the day at 18:00 GMT. Thus, pavement surface and AC mid-depth temperatures were recorded concurrently at half-hourly intervals for 12 h, producing 25 temperature readings per day (6:00 GMT to 18:00 GMT). The time for both temperature readings was recorded in a 24 h clock system. This data collection scheme was repeated for seven consecutive days per month, from May to December 2022. The data collection scheme produced a total of 1400 in-depth and 1400 pavement surface temperature data points on each study road.
The data collection week was selected based on stratified random sampling. Each calendar month (May to December) was subdivided into four weeks of sampling units. A simple random sampling technique was then used to select a specific week number per stratum (calendar month) for data collection. The week numbers in Table 2 were obtained and used for data collection in the respective months.
Climatic data, such as daily minimum air temperature, daily maximum air temperature, and daily wind speed, were obtained from the GMet weather stations during the data collection period. Daily solar radiation was computed using an approach utilized by Diefenderfer [11], which required input of the latitude of the weather station and the day of the year. A total of 56 each of the climatic data per study zone was sourced from the Ghana Meteorological Agency database or computed for the 56-day data collection period.
Several data quality control measures were implemented, including checking that recorded minimum air temperatures did not exceed maximum air temperatures. Additionally, hourly variation in pavement temperature was graphically examined to ensure consistency in the trends observed in previous days’ recorded data.

3.3. Data Analysis

Based on literature review findings, four criteria—statistical significance, the coefficient of determination (R2), the line of equality (LOE), and error statistics—were used for the evaluation of the models. Researchers, including Singh et al. [23], Khalil and Shaffie [24], Quansah et al. [25] have used the R2, LOE and error statistics in evaluating the applicability of models. The statistical significance test (t-tests) has also been used by Khalil and Shaffie [24], Gedafa et al. [5] and Walia et al. [6] to assess empirical models performances. The error statistics included root mean square error (RMSE), mean percentage error (MPE), and mean bias error (MBE), which are given in Equations (6)–(8), respectively.
R M S E = 1 n i = 1 n ( T c a l T m e a ) 2
M P E = 1 n i = 1 n T m e a T c a l T m e a × 100
M B E = 1 n i = 1 n T c a l T m e a
where T c a l and T m e a are the predicted and measured pavement temperatures (°C), respectively, for n number of observations. RMSE, MPE and MBE are as defined above.
RMSE measures the level of dispersion of the model predictions in absolute values, while MPE indicates the percentage deviation of the model predictions from measured values. MBE, on the other hand, quantifies the variation in the measured pavement temperature from the predicted. The closer RMSE, MPE, and MBE are to zero, the better the accuracy of the model predictions. Negative MPE and MBE values indicate over-prediction and under-prediction, respectively.
In testing the statistical significance of the difference between the means of the predicted and measured asphalt pavement temperatures, the two independent-samples t-test was conducted at 5% level of significance. For the purposes of this study, a probability value (p-value) above 5% (0.05) indicated that a particular model prediction was satisfactory.
R2 measures the goodness-of-fit of a model. It denotes the proportion of variation in the dependent variable explained by the linear combination of the independent variables. The higher the R2 value, the better the model prediction. The LOE is a 45-degree line drawn on a scatter plot of predicted versus measured values. A well-fitted model has predicted and measured values balanced along the LOE [23,26]. Microsoft Excel (version 2016) was used to compute the error statistics (RMSE, MPE, and MBE); SPSS statistics (version 23) was employed to produce the charts, while R-studio (version 1.4.1106) was used for the statistical analysis.

4. Results and Discussion

4.1. Model Evaluation Based on Statistical Significance Testing

From the statistical significance test results in Table 3, the following inferences are made:
i.
For Kumasi, the means of the predicted asphalt pavement temperature by the Park [10] and the Diefenderfer [11] models were statistically equal to the mean of the measured asphalt pavement temperatures (p > 0.05).
ii.
For Tamale, the asphalt pavement temperatures predicted by the Park [10] model had an equal mean to the measured asphalt pavement temperature (p > 0.05).
iii.
The rest of the model-predicted asphalt pavement temperatures had means that were statistically different from the means of their corresponding measured asphalt pavement temperatures (p < 0.05).
Table 3. T-Test Results of Predicted versus Measured Asphalt Pavement Temperatures.
LocationModeldftp-Value
KumasiBELLS 3 [9]2780.9−8.704<0.0001
Park [10]2676.11.6020.1092
Diefenderfer [11]59.6−1.6350.1074
Taamneh [12]67.18.596<0.0001
Asefzadeh [13]62.617.326<0.0001
TamaleBELLS 3 [9]2766.9−9.762<0.0001
Park [10]2660.90.0140.989
Diefenderfer [11]63.9−3.7990.0003
Taamneh [12]83.39.359<0.0001
Asefzadeh [13]67.66819.775<0.0001
The statistical testing has shown that only the Park [10] model has the potential to predict asphalt pavement temperature in the Savannah zone with acceptable accuracy, while the Park [10] and Diefenderfer [11] models exhibited similar potential for the Forest zone.

4.2. Model Evaluation Based on Error Statistics

Table 4 shows the error statistics for the model predictions. Both the MPE and MBE suggested that the BELLS 3 [9] and Diefenderfer [11] models under-predicted asphalt pavement temperatures for both Kumasi and Tamale. The MPE and MBE also indicated that the Taamneh [12] and the Asefzadeh [13] models over-predicted temperatures for both locations. In the case of the Park [10] model, there was over-prediction for Kumasi based on the MPE and MBE, while the MPE for Tamale indicated under-prediction.
In the Savannah zone, the Park [10] model recorded the lowest RMSE, MPE, and MBE, making it a plausible model for asphalt pavement temperature prediction. The Park [10] model also produced the smallest MPE and MBE in the Forest zone, but its RMSE of 3.6 °C was only second lowest to BELLS 3 [9]. Hence, it could be said that the Park [10] model performance in both climatic zones was better than the other models due to its lowest error statistics. Based on the error statistics, it was considered that the other models could yield inaccurate predictions of asphalt pavement temperature in both climatic zones.
The magnitude of MPE and MBE produced by the Diefenderfer [11] model for both zones were second lowest to the Park [10] model. These results corroborate earlier findings from the statistical significance testing that these two models have the potential to predict asphalt pavement temperature for the Forest zone. Table 4 also revealed that the BELLS 3 [9] and the Diefenderfer [11] models yielded lower prediction errors for the Forest zone than for the Savannah zone. The Park [10], Taamneh [12], and Asefzadeh [13] models rather exhibited lower prediction errors for the Savannah zone. The error analysis results have complemented the statistical significance testing results in determining the best-performing models for the study zones.

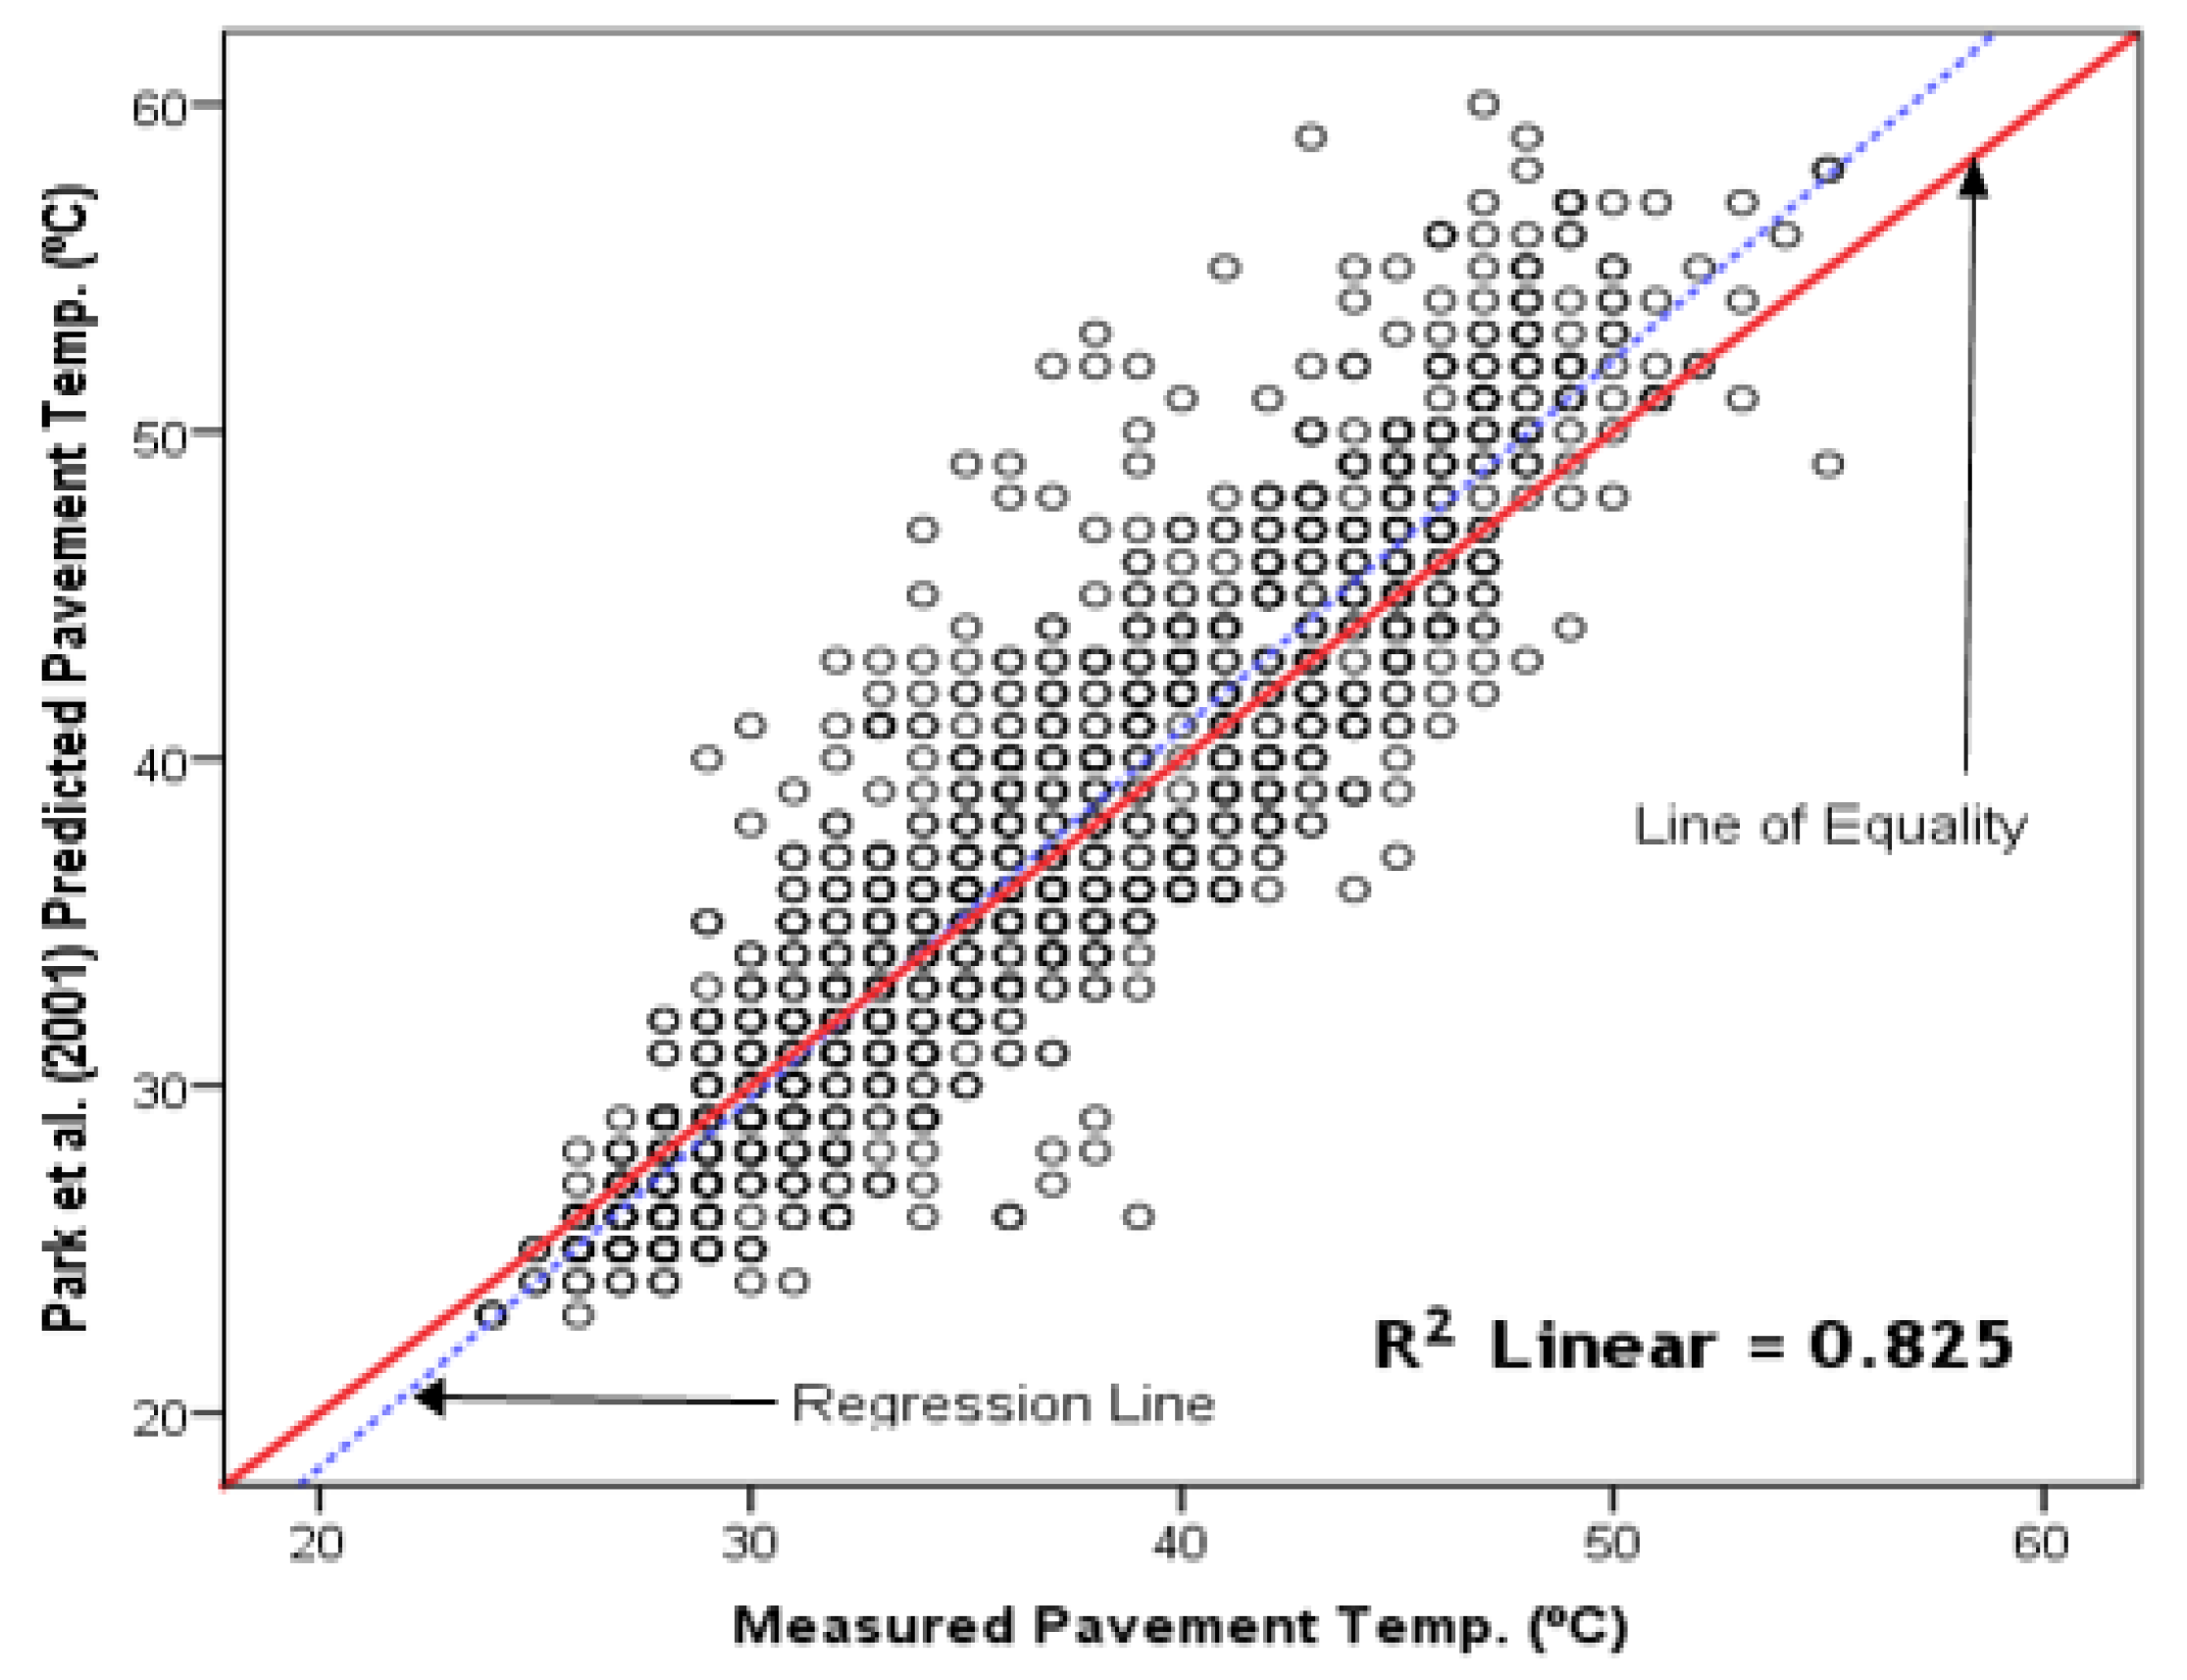
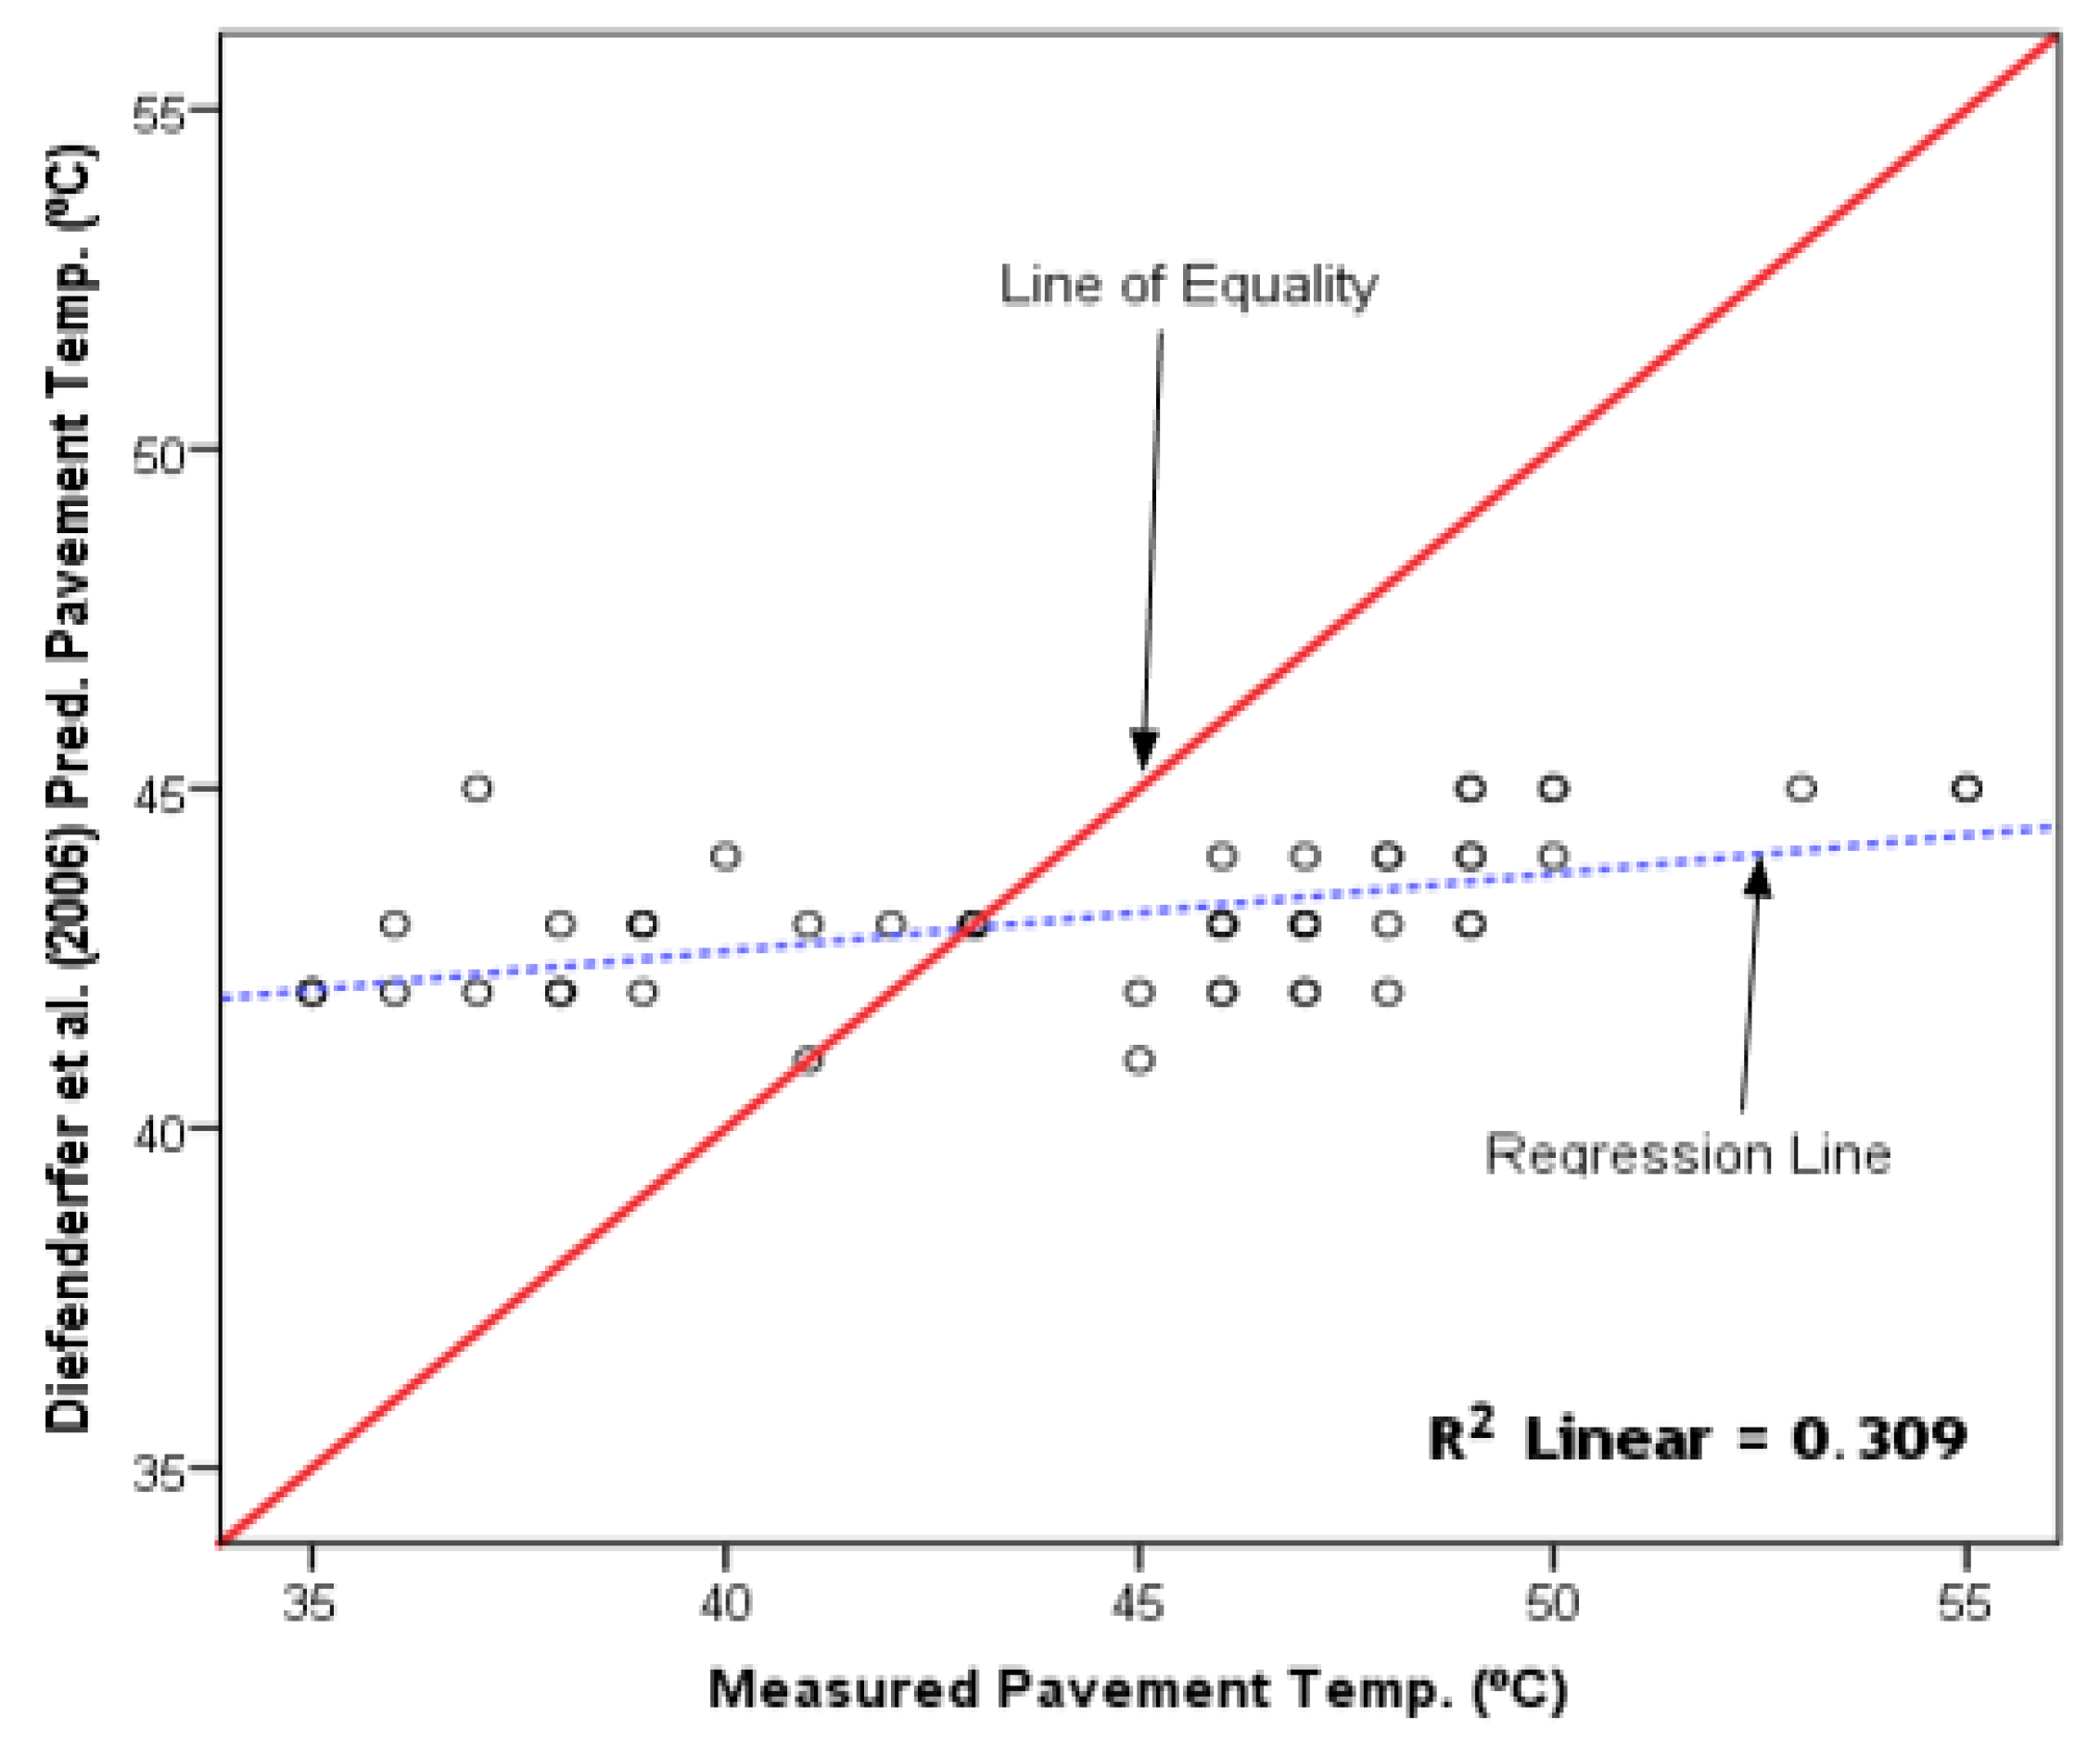
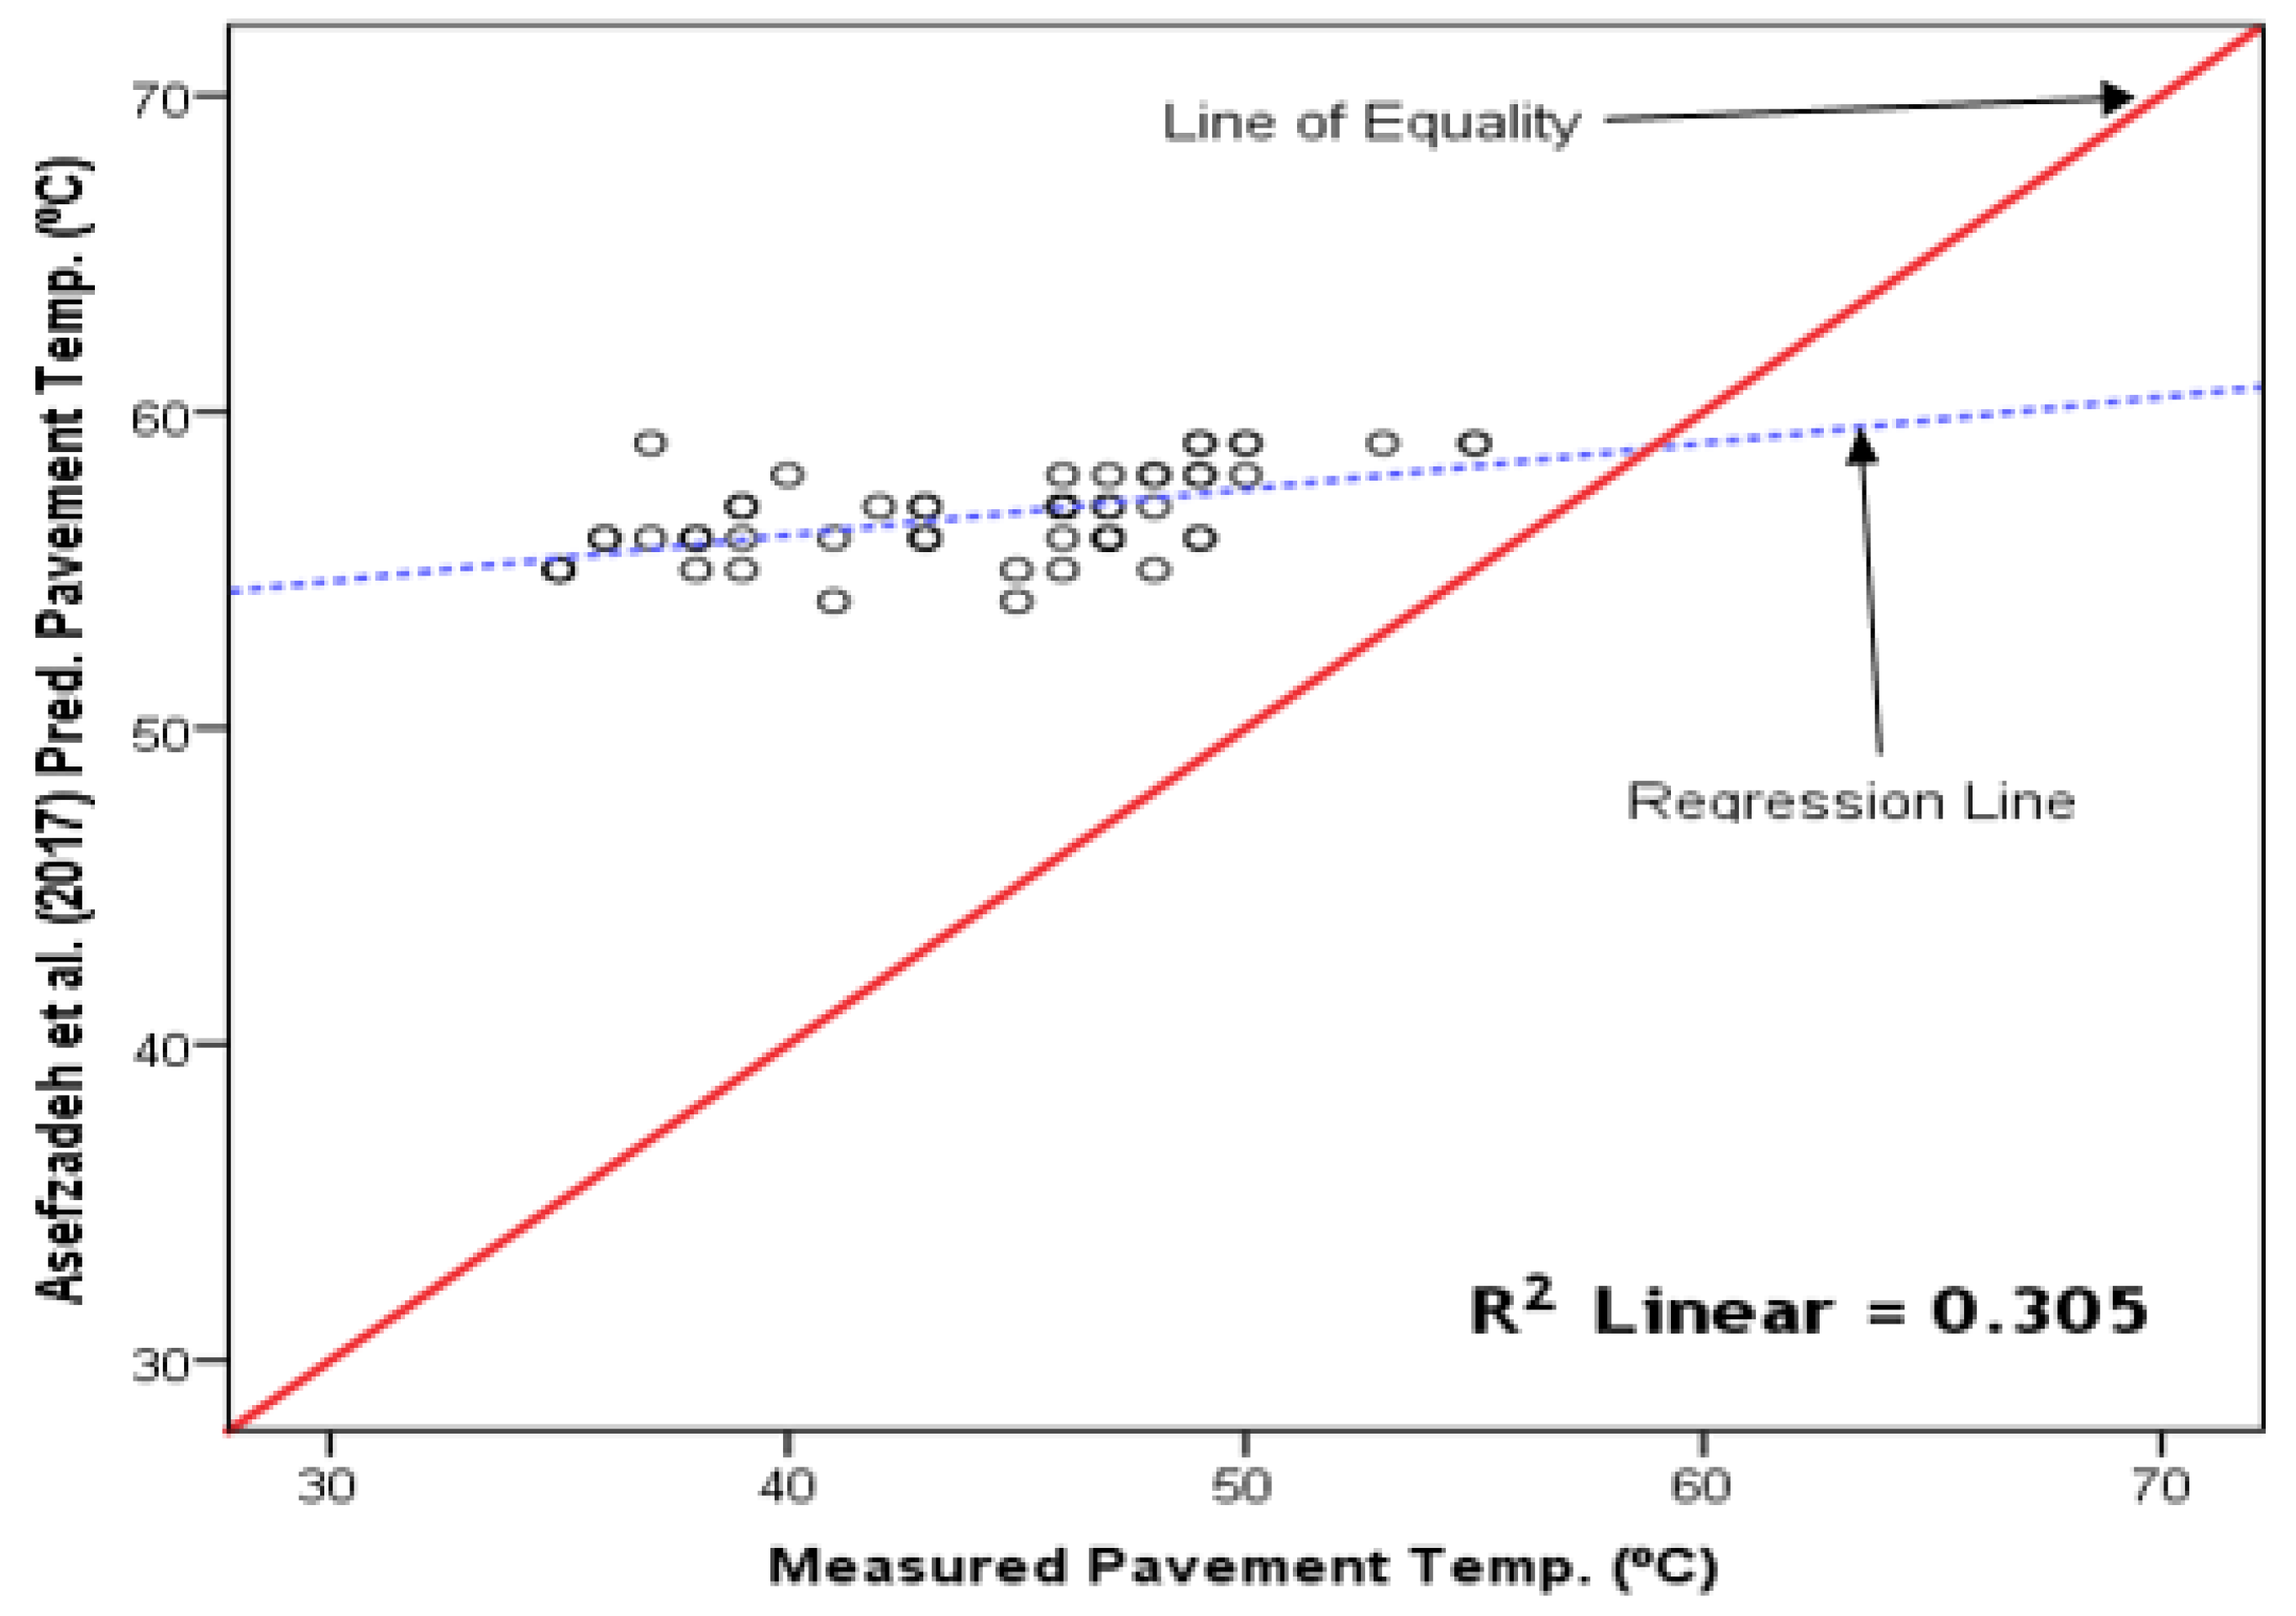
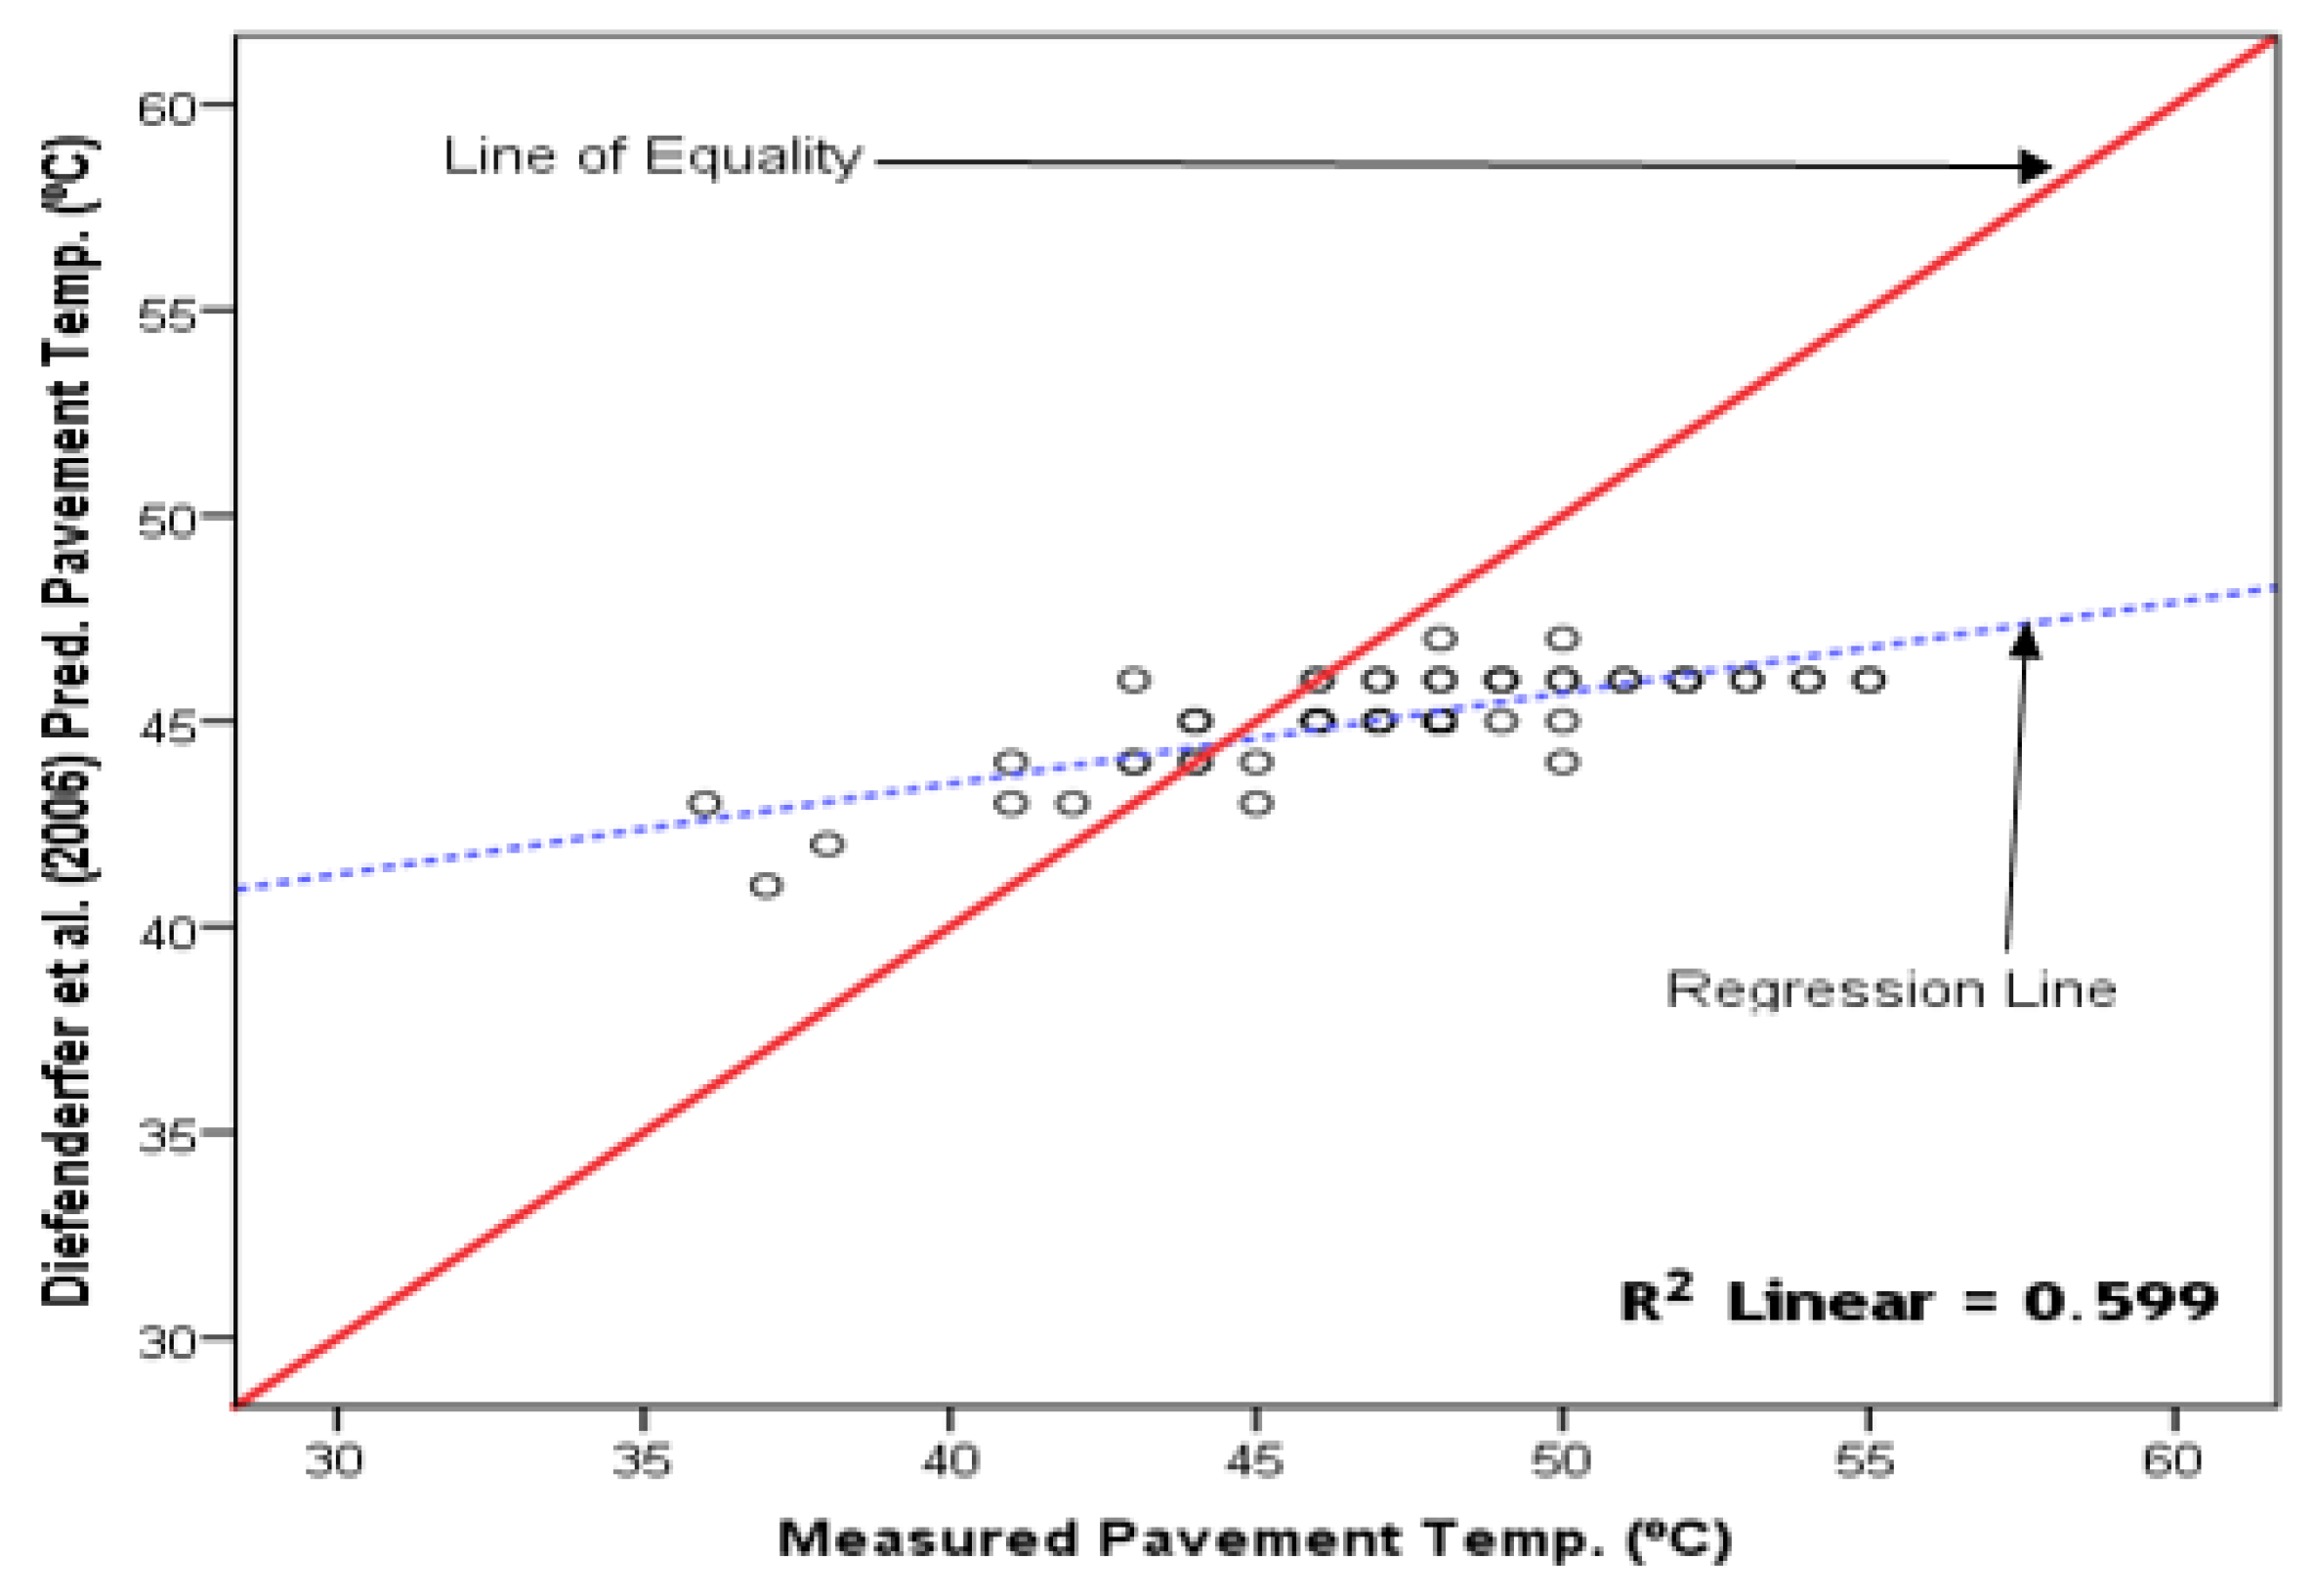
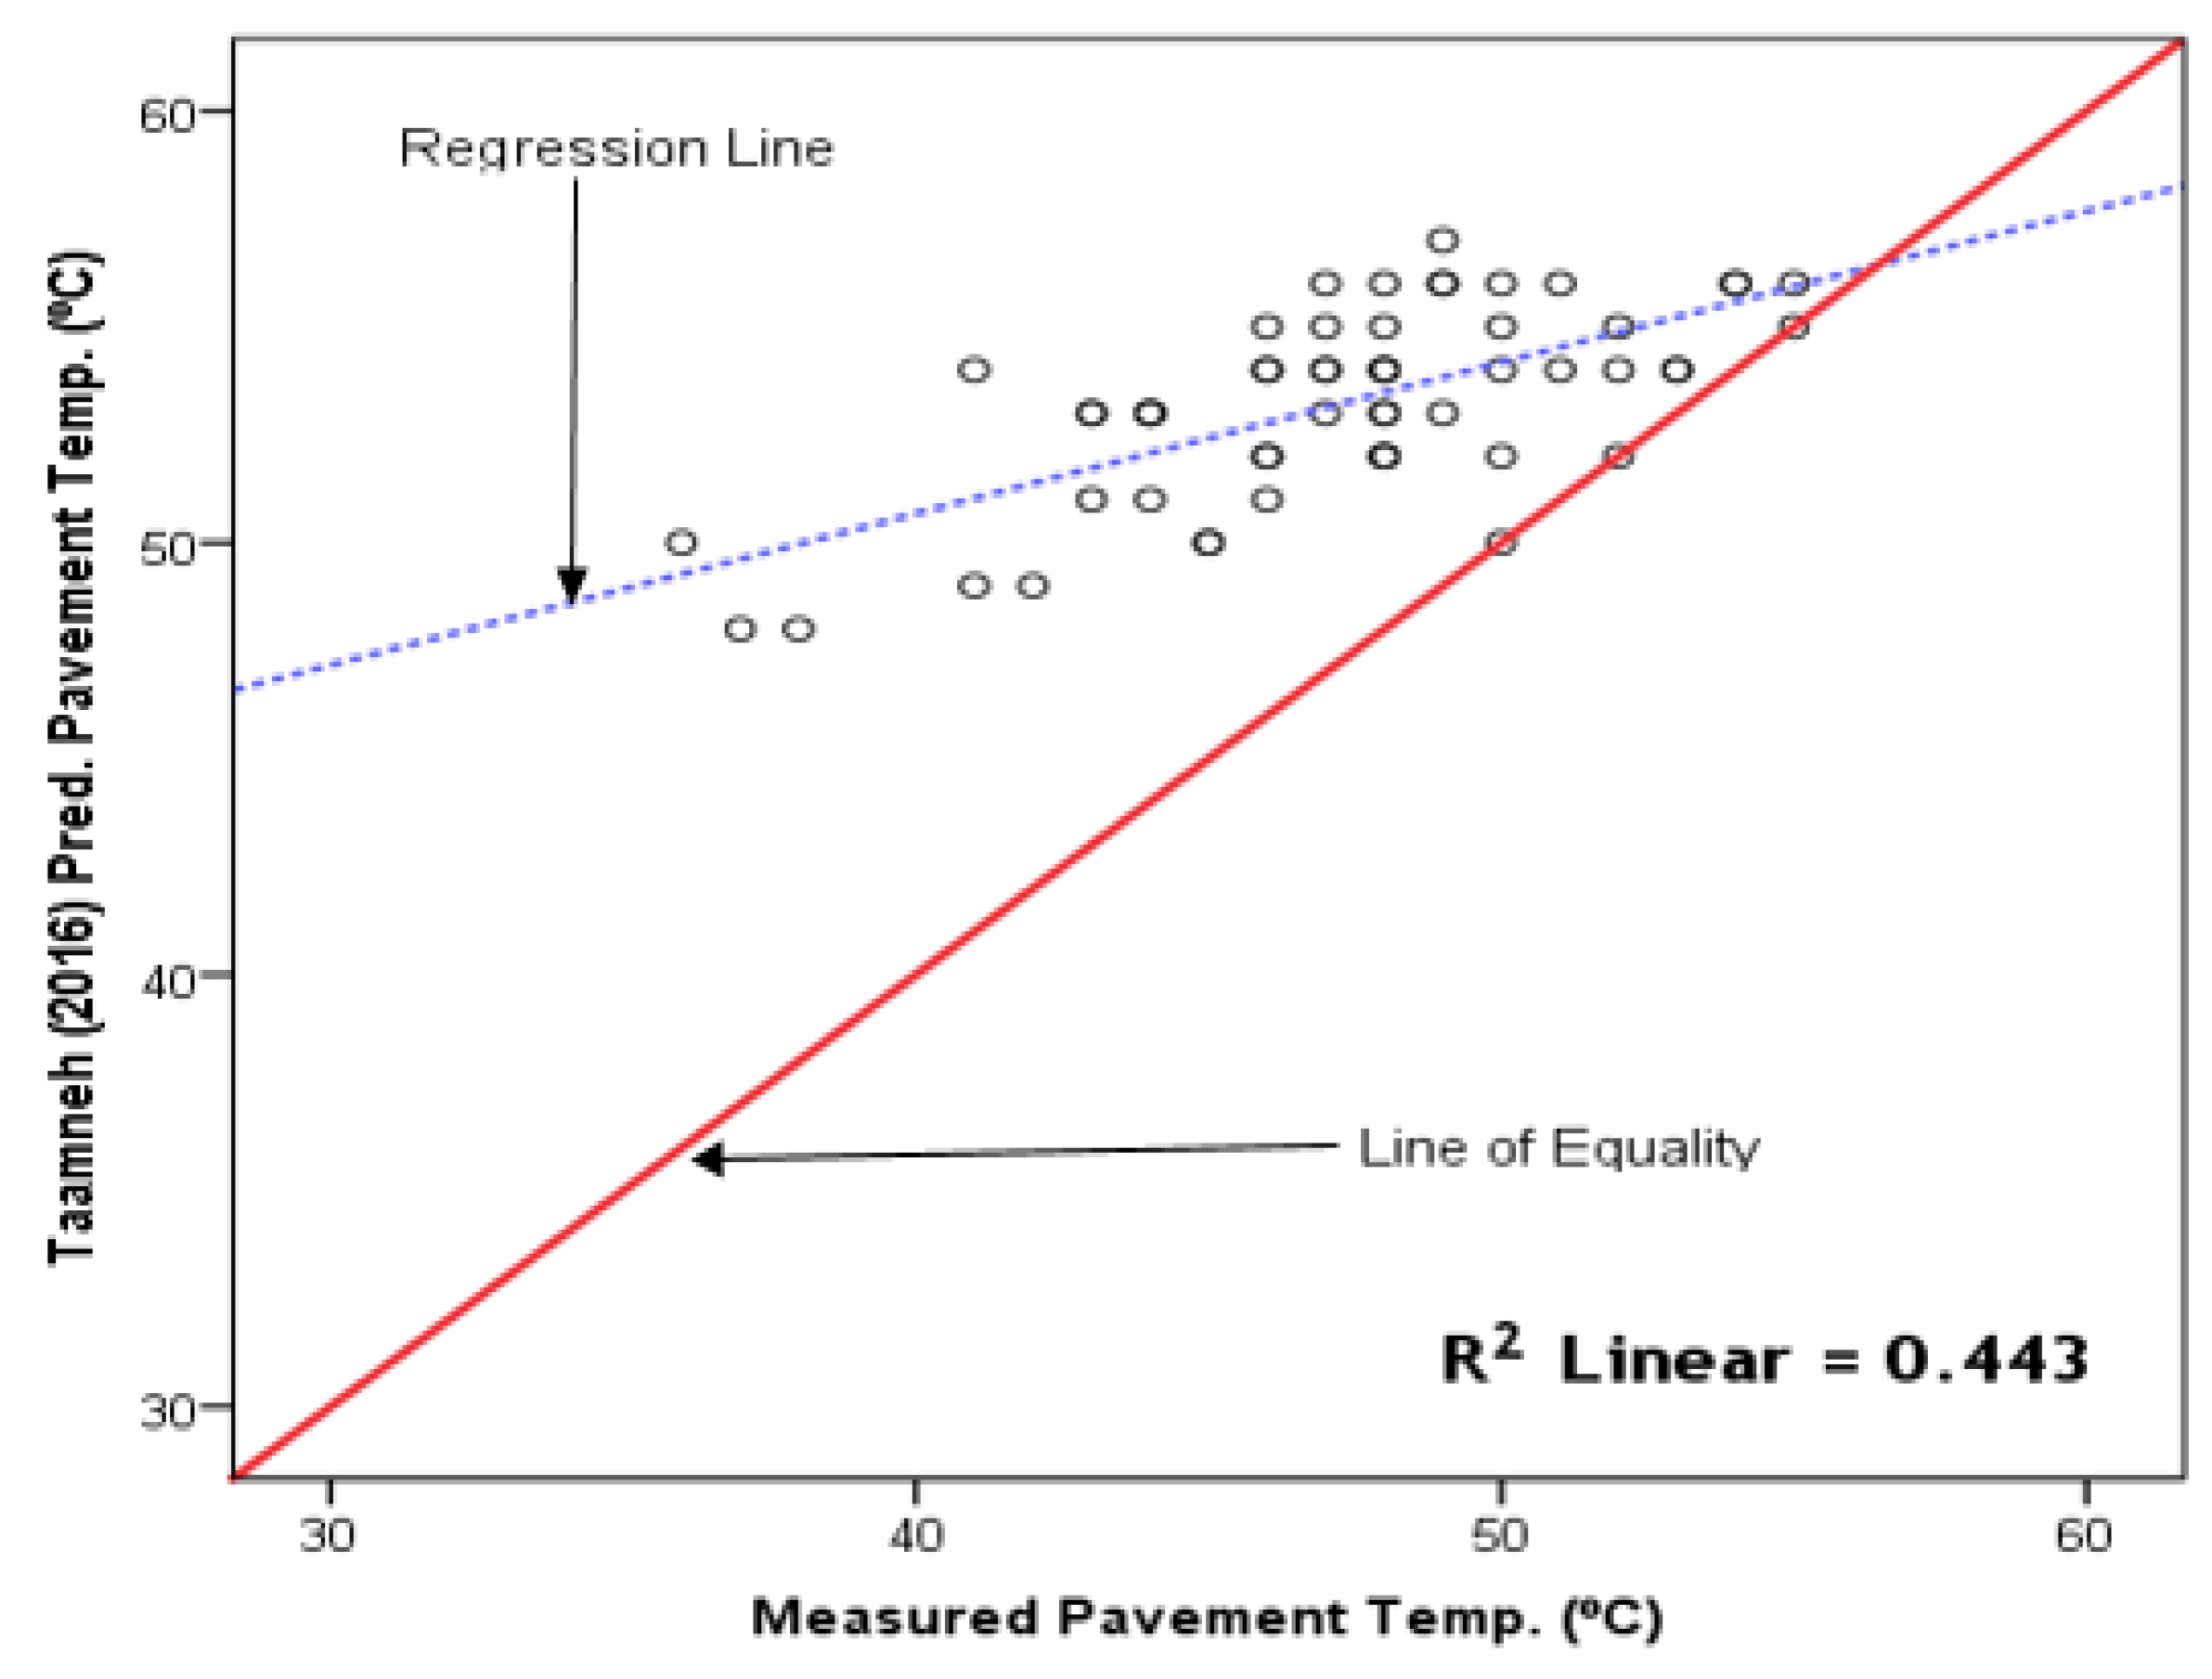
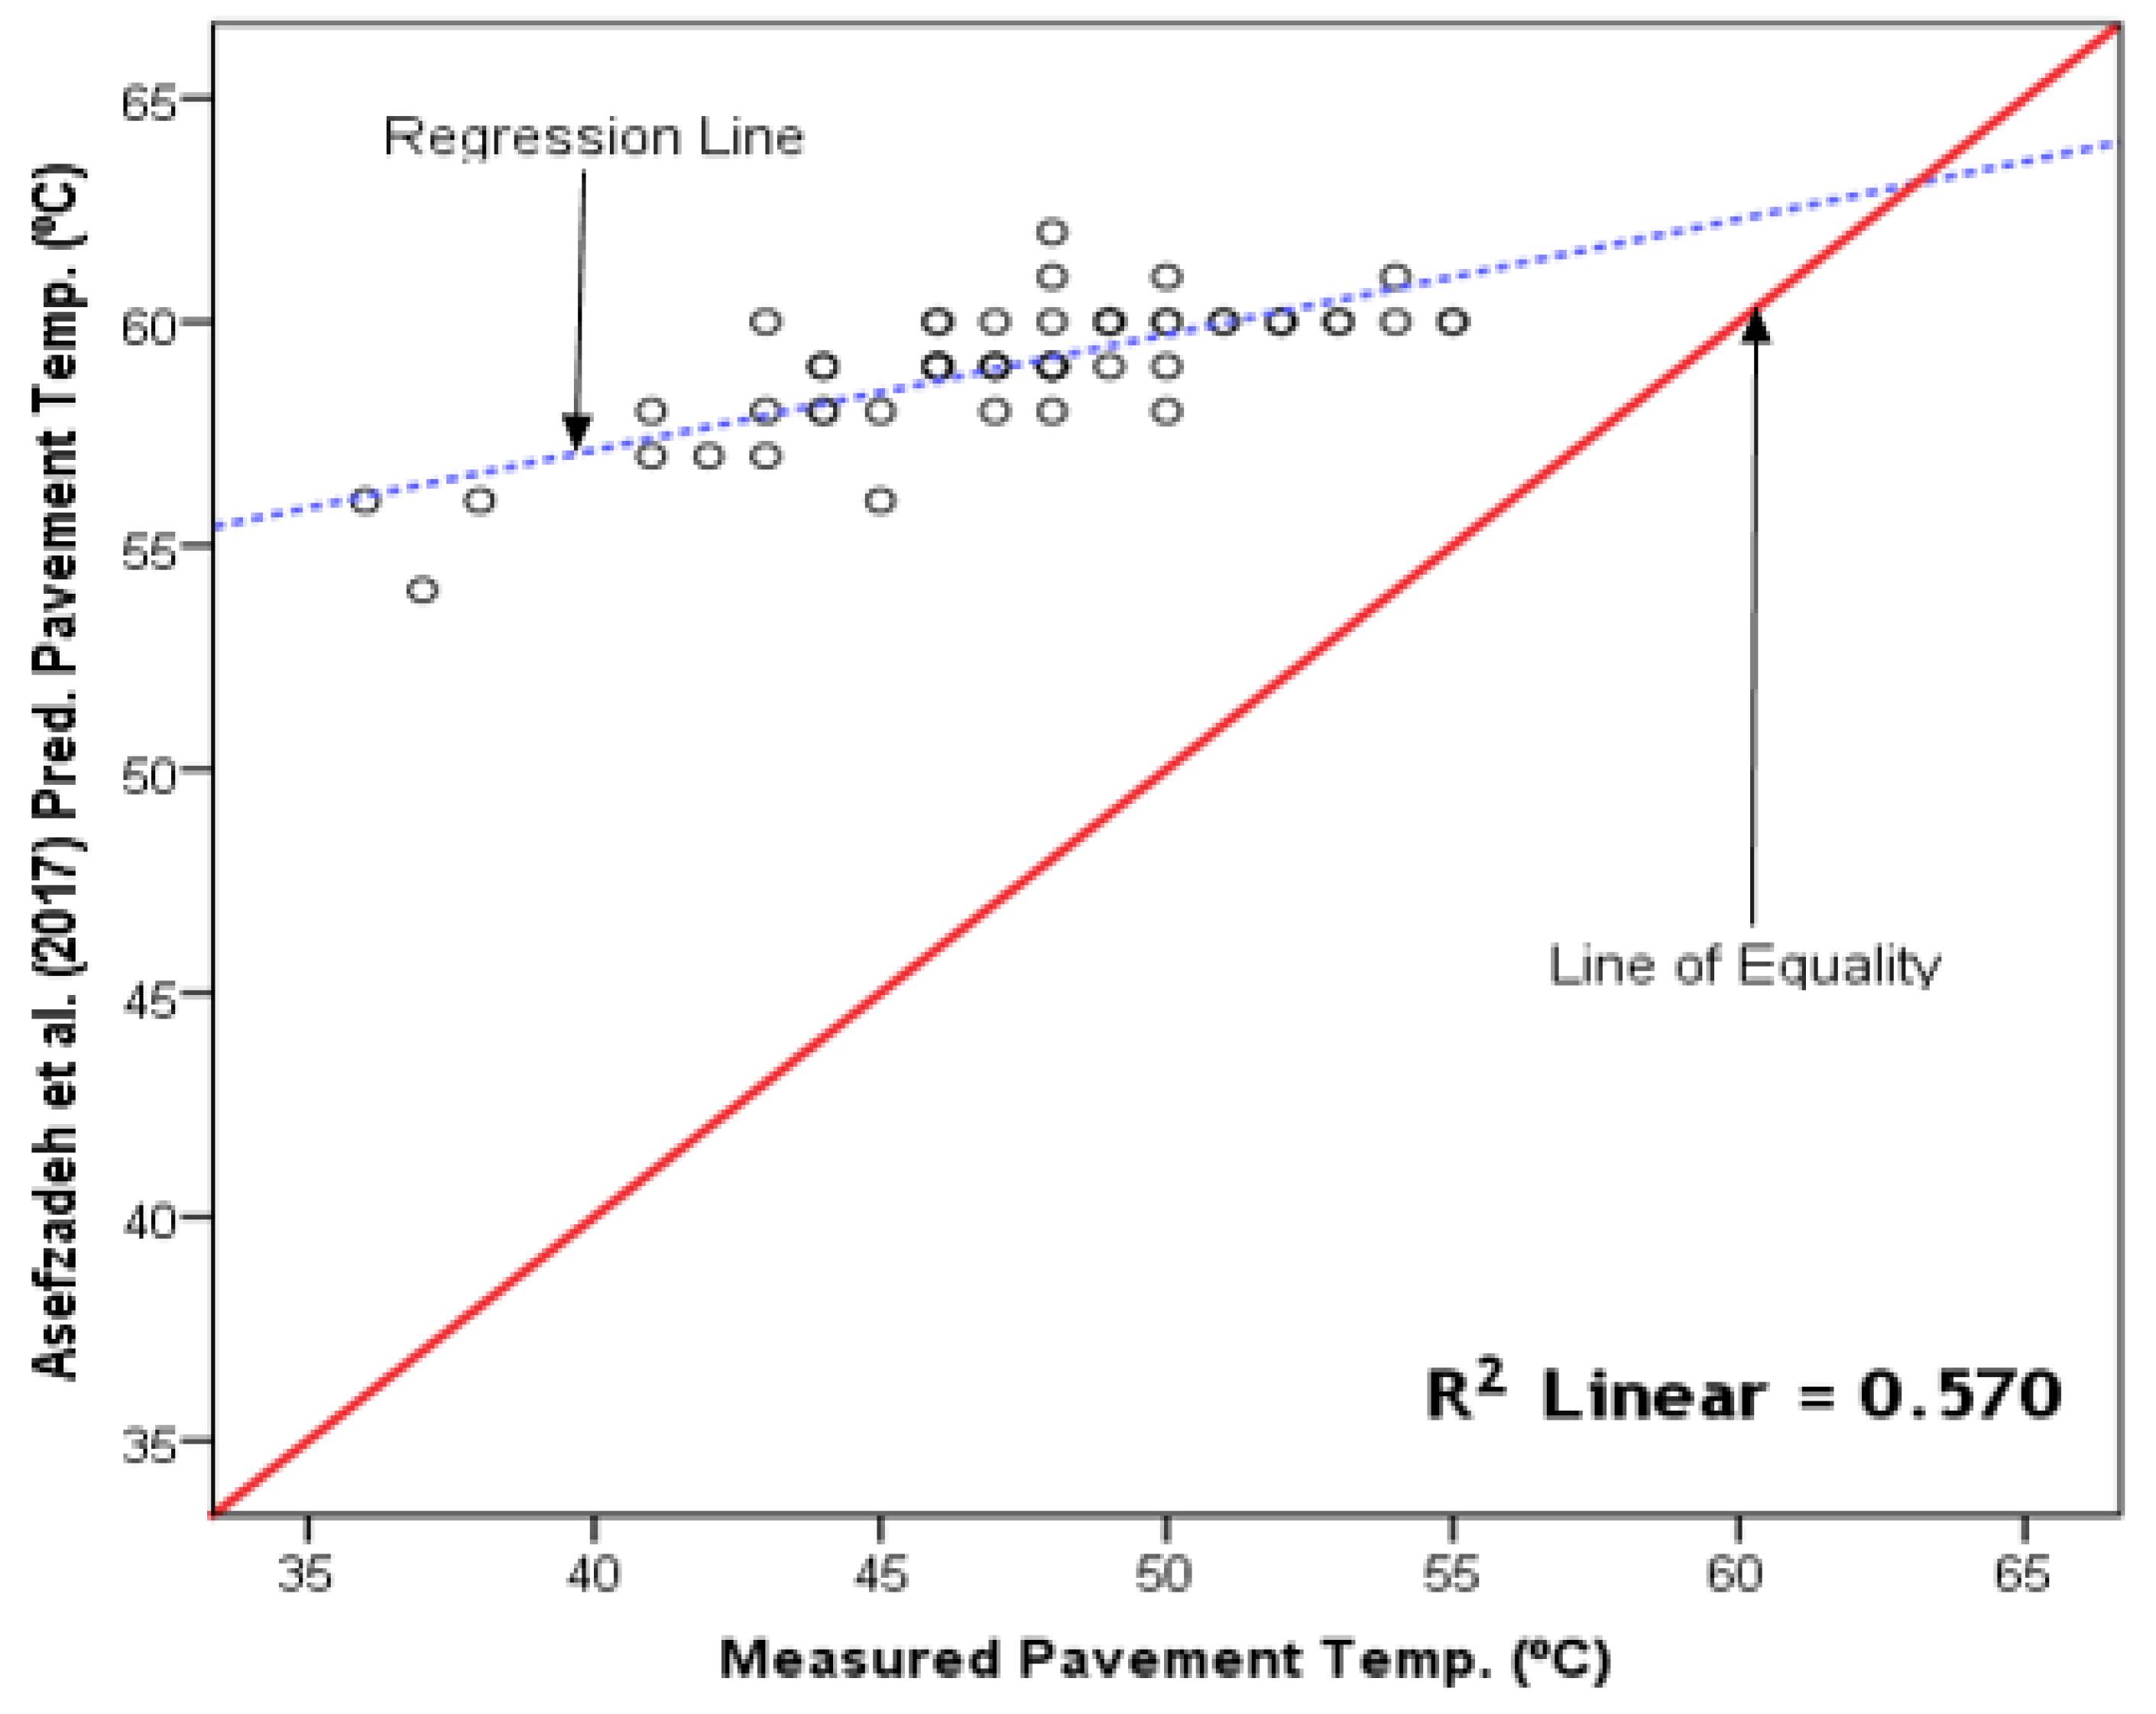
4.3. Model Evaluation Based on the Line of Equality and the Coefficient of Determination

Figure 3 shows a graph of BELLS 3 [9] model-predicted versus measured asphalt pavement temperature for Kumasi. The predicted temperatures did not fully match the measured values, especially at low and high pavement temperatures; there was some amount of under-prediction at the extreme temperatures. The relatively high R2 of 0.866 is notable, but this be viewed in the light of the other evaluation criteria.
The Park [10] model-predicted and the measured temperature for Kumasi were sufficiently balanced along the LOE, indicating a good prediction. However, there were some appreciable over-predictions after temperatures of approximately 47 °C (Figure 4). This can be explained by the fact that the highest pavement temperature considered for developing the Park [10] model was 43 °C, lower than typical maximum pavement temperatures recorded in Ghana. The R2 of 0.825 shows a well-fitted model but its relevance must be established after a careful consideration of the other evaluation criteria.
Figure 5 shows a weak correlation between the predicted pavement temperature by the Diefenderfer [11] model and the measured temperature for Kumasi, with a low R2 of 0.309 and no clustering along the LOE. This finding indicated a mismatch between the predicted and measured pavement temperature. Thus, the Diefenderfer [11] model is inappropriate for asphalt pavement temperature prediction in Ghana.
Figure 6 and Figure 7, respectively, show the Taamneh [12] and Asefzadeh [13] model-predicted asphalt pavement temperature against the measured temperature for Kumasi. Though the Taamneh [12] model prediction shows some moderately positive relationship with measured temperature (R2 of 0.594), almost all the pavement temperatures lay above the LOE, indicating over-prediction errors, making it unsuitable for use. The Asefzadeh [13] model prediction (Figure 7) produced a weak correlation with the measured pavement temperature (R2 of 0.305), and all the temperatures were above the LOE, an indication of over-prediction. The weak R2 value attests to the inappropriateness of the Asefzadeh [13] model for pavement temperature prediction for the Forest zone.
The LOE plots have highlighted the disparity between the predicted and measured asphalt pavement temperatures, an important factor in assessing model performance. For example, the Diefenderfer [11] model error levels for the Forest zone were moderate, but the distribution around the LOE was unsatisfactory. Singh et al. [23] classified R2 values in the range of 0.70–0.89 as good; hence, the BELLS 3 [9] and Park [10] models may be described as good based on R2. However, an overall assessment is necessary to reach a practical decision about model acceptability.
Figure 8, Figure 9, Figure 10, Figure 11 and Figure 12 present similar results for the Savannah zone. Figure 8 shows under-prediction (more data points below the LOE than above it) by the BELLS 3 [9] model. Notwithstanding, a high R2 of 0.930 was recorded.
However, the Park [10] model prediction for Tamale (Figure 9) produced a good clustering along the LOE, indicating a good match between the measured and predicted pavement temperature (up to approximately 47 °C), which was corroborated by the high R2 value of 0.905.
The Diefenderfer [11] model-predicted daily maximum versus measured pavement temperature is shown in Figure 10. The Diefenderfer [11] model did not correctly predict pavement temperature, as there was no balance between the predicted and measured pavement temperatures around the LOE. Considerable errors were associated with the use of this model for asphalt pavement temperature prediction in the Savannah zone. The model prediction yielded a moderate R2 value of 0.599.
As seen in Figure 11, the Taamneh [12] model-predicted pavement temperature versus measured pavement temperature is scattered above the LOE, indicating significant errors between the predicted and measured temperatures. The data point distribution shows significant over-prediction of pavement temperatures for Tamale. As expected, a relatively low R2 value of 0.443 was recorded, affirming the unsuitability of the Taamneh [12] model for use in the Savannah zone.
The Asefzadeh [13] model-predicted and measured pavement temperature for Tamale lay above the LOE (Figure 12), indicating significant over-prediction. The Asefzadeh [13] model also yielded a moderate R2 value of 0.570.

4.4. Summary of Model Evaluation Results

For the Forest zone, the Park [10] and Diefenderfer [11] models were the only models in which asphalt pavement temperature predictions did not differ significantly from measured temperatures. However, the Park [10] model displayed a better distribution of pavement temperatures around the LOE, registered the smallest error levels, and had the highest R2. Hence, the Park [10] model may be considered to have outperformed Diefenderfer’s [11].
For the Savannah zone, all the assessment criteria were in favor of the Park [10] model, making it the most feasible model. It should be noted that the Park [10] model registered lower error statistics and higher R2 values for the Savannah zone compared with the Forest zone. Overall, the Park [10] model’s performance was better in the Savannah zone.
The failure of the BELLS 3 [9] model to predict pavement temperature with high accuracy in both cities could have resulted from the fact that the model was calibrated for a maximum pavement temperature of 40 °C [6,9] which is smaller than the highest pavement temperatures in Ghana. Additionally, the non-use of climatic data by the Park [10] model could have accounted for its high prediction accuracy. The Diefenderfer [11], Taamneh [12] and Asefzadeh [13] models utilized computed incoming solar radiation parameters which did not factor in the fraction reflected due to surface albedo. This could have affected the prediction accuracy of these models. The R2 and RMSE values produced for Kumasi by the Diefenderfer [11] model compared well with Lekea and Steyn [27] findings, where an evaluation of the Diefenderfer [11] model in Pretoria yielded R2 of 0.378 and RMSE of 4.6 °C. However, higher R2 and RMSE values were recorded by the Diefenderfer [11] model for Tamale than Pretoria [27].
The evaluation results imply that the Park [10] model can reasonably predict asphalt pavement temperature in Ghana up to approximately 47 °C; thereafter, over-prediction can be expected. However, to predict asphalt pavement temperature over a broader range of temperatures, it is necessary to develop local models rather than fully depending on the Park [10] model. Such new models should be able to predict asphalt pavement temperatures which are comparable to measured pavement temperature values, with lowest error margins and highest R2 values.

5. Conclusions and Recommendations

This study evaluated the applicability of the BELLS 3, Park, Diefenderfer, Taamneh, and Asefzadeh models for asphalt pavement temperature prediction in Ghana’s Forest and Savannah climate zones. Based on the results of this study, the following conclusions and recommendations are provided:
  • The Park model showed the highest accuracy in predicting asphalt pavement temperature for both the Forest and Savannah zones.
  • Asphalt pavement temperature predicted by the BELLS 3, Taamneh, and Asefzadeh models were significantly different from the measured pavement temperatures in both climatic zones. The BELLS 3 model under-predicted, while the Taamneh and Asefzadeh models over-predicted asphalt pavement temperatures, in both climatic zones.
  • The Diefenderfer model significantly under-predicted asphalt pavement temperature for the Savannah zone and was poorly fitted for prediction in the Forest zone.
  • The Park model is recommended for asphalt pavement temperature prediction in both the Forest and Savannah zones of Ghana pending locally developed models. The implication of using the Park model for asphalt pavement temperature prediction in Ghana above 47 °C could result in over-prediction errors, the reason a local model will be needed for a wide range of temperatures.
  • The findings of this study may be generally applicable to countries with similar climatic characteristics as the Forest and Savannah climatic zones of Ghana, particularly nearby West African countries such as Togo, Benin, Nigeria, Cote D’Ivoire, Liberia, Sierra Leone, and Burkina Faso.
  • This study’s findings are directly applicable to newer asphalt pavements and non-shaded pavement surfaces. Future model improvement efforts should consider pavement conditions other than these.

Author Contributions

Conceptualization, K.A.T., S.N. and Y.A.T.; methodology, S.N., K.A.T., Y.A.T. and C.A.A.; validation, S.N., K.A.T. and Y.A.T.; formal analysis, S.N. and E.K.A.; investigation, S.N.; resources, K.A.T., Y.A.T. and C.A.A.; data curation, S.N. and E.K.A.; writing—original draft preparation, S.N.; writing—review and editing, S.N., K.A.T., E.K.A., Y.A.T. and C.A.A.; supervision, K.A.T., Y.A.T. and C.A.A. All authors have read and agreed to the published version of the manuscript.

Funding

This research received no external funding.

Institutional Review Board Statement

Not applicable.

Informed Consent Statement

Not applicable.

Data Availability Statement

The data are available upon request.

Acknowledgments

The authors acknowledge all enumerators who helped with the field data collection and TRECK for supporting financially.

Conflicts of Interest

The authors declare that they have no conflicting interest.

References

  1. Alavi, M.Z.; Pouranian, M.R.; Hajj, E.Y. Prediction of asphalt pavement temperature profile with finite control volume method. Transp. Res. Rec. 2014, 2456, 96–106. [Google Scholar] [CrossRef]
  2. Kassem, E.; Bayomy, F.M.S.; Williams, C.; Saasita, E.; Lamichane, S.; Permadi, D.D. Development of Pavement Temperature Prediction Model, Report No. FHWA-ID-20-279; Transportation Department: Moscow, Idaho, 2020.
  3. Liang, Y.; Wu, R.; Harvey, J.T.; Jones, D.; Alavi, M.Z. Investigation into the Oxidative Aging of Asphalt Binders. Transp. Res. Rec. 2019, 2673, 368–378. [Google Scholar] [CrossRef]
  4. Kennedy, T.W.; Huber, G.A.; Harrigan, E.T.; Cominsky, R.J.; Hughes, C.S.; Von Quintus, H.; Moulthrop, J.S. Superior Performing Asphalt Pavements (Superpave): The Product of the SHRP Asphalt Research Program. Report SHRP-A-410; National Research Council: Washington, DC, USA, 1994.
  5. Gedafa, D.S.; Hossain, M.; Romanoschi, S.A. Perpetual pavement temperature prediction model. Road Mater. Pavement Des. 2014, 15, 55–65. [Google Scholar] [CrossRef]
  6. Walia, A.; Rastogi, R.; Kumar, P.; Jain, S.S. Development of a temperature prediction model for asphalt pavements considering air temperature data of preceding hours. Int. J. Pavement Eng. 2022, 1–17. [Google Scholar] [CrossRef]
  7. Viljoen, A. Estimating Asphalt Temperatures from Air Temperatures and Basic Sky Parameters; CSIR Transportek: Pretoria, South Africa, 2001. [Google Scholar]
  8. Koranteng-Yorke, J.B. Proposed Framework for Asphaltic Concrete Pavement Design for Tropical Soils—Case Study of Ghana. Ph.D. Thesis, University of Birmingham, Birmingham, UK, 2012. [Google Scholar]
  9. Lukanen, E.O.; Stubstad, R.; Briggs, R. Temperature Predictions and Adjustment Factors for Asphalt Pavement. Publication no. FHWA-RD-98-085; Turner-Fairbank Highway Research Center: McLean, VA, USA, 2000. [Google Scholar]
  10. Park, D.; Buch, N.; Chatti, K. Effective Layer Temperature Prediction Model and Temperature Correction via Falling Weight Deflectometer Deflections. Transp. Res. Rec. 2001, 1764, 97–111. [Google Scholar] [CrossRef]
  11. Diefenderfer, B.K.; Al-Qadi, I.L.; Diefenderfer, S.D. Model to predict pavement temperature profile: Development and validation. J. Transp. Eng. 2006, 132, 162–167. [Google Scholar] [CrossRef]
  12. Taamneh, M. Temperature profile prediction for flexible pavement structures. HKIE Trans. Hong Kong Inst. Eng. 2016, 23, 150–156. [Google Scholar] [CrossRef]
  13. Asefzadeh, A.; Hashemian, L.; Bayat, A. Development of statistical temperature prediction models for a test road in Edmonton, Alberta, Canada. Int. J. Pavement Res. Technol. 2017, 10, 369–382. [Google Scholar] [CrossRef]
  14. World Bank World Bank Climate Change Knowledge Portal. 2021. Available online: https://climateknowledgeportal.worldbank.org/country/ghana/climate-data-historical (accessed on 10 August 2023).
  15. Tutu, K.A.; Ntramah, S.; Tuffour, Y.A. Superpave performance graded asphalt binder selection for asphalt mixture design in Ghana. Sci. Afr. 2022, 17, e01348. [Google Scholar] [CrossRef]
  16. Rigabadi, A.; Rezaei Zadeh Herozi, M.; Rezagholilou, A. An attempt for development of pavements temperature prediction models based on remote sensing data and artificial neural network. Int. J. Pavement Eng. 2021, 23, 2912–2921. [Google Scholar] [CrossRef]
  17. Chen, J.; Wang, H.; Xie, P. Pavement temperature prediction: Theoretical models and critical affecting factors. Appl. Therm. Eng. 2019, 158, 113755. [Google Scholar] [CrossRef]
  18. Wang, D.; Roesler, J.R.; Guo, D.-Z. Analytical Approach to Predicting Temperature Fields in Multilayered Pavement Systems. J. Eng. Mech. 2009, 135, 334–344. [Google Scholar] [CrossRef]
  19. Xu, B.; Dan, H.C.; Li, L. Temperature prediction model of asphalt pavement in cold regions based on an improved BP neural network. Appl. Therm. Eng. 2017, 120, 568–580. [Google Scholar] [CrossRef]
  20. Milad, A.; Adwan, I.; Majeed, S.A.; Yusoff, N.I.M.; Al-Ansari, N.; Yaseen, Z.M. Emerging Technologies of Deep Learning Models Development for Pavement Temperature Prediction. IEEE Access 2021, 9, 23840–23849. [Google Scholar] [CrossRef]
  21. Bessah, E.; Amponsah, W.; Ansah, S.O.; Afrifa, A.; Yahaya, B.; Wemegah, C.S.; Tanu, M.; Amekudzi, L.K.; Agyare, W.A. Climatic zoning of Ghana using selected meteorological variables for the period 1976–2018. Meteorol. Appl. 2022, 29, e2049. [Google Scholar] [CrossRef]
  22. Yamba, E.I.; Aryee, J.N.A.; Quansah, E.; Davies, P.; Wemegah, C.S.; Osei, M.A.; Ahiataku, M.A.; Amekudzi, L.K. Revisiting the agro-climatic zones of Ghana: A re-classification in conformity with climate change and variability. PLoS Clim. 2023, 2, e0000023. [Google Scholar] [CrossRef]
  23. Singh, D.; Zaman, M.; Commuri, S. Evaluation of predictive models for estimating dynamic modulus of hot-mix asphalt in Oklahoma. Transp. Res. Rec. 2011, 2210, 57–72. [Google Scholar] [CrossRef]
  24. Khalil, S.A.; Shaffie, A.M. Performance of Statistical Comparison Models of Solar Energy on Horizontal and Inclined Surface. Int. J. Energy Power 2013, 2, 8–25. [Google Scholar]
  25. Quansah, E.; Amekudzi, L.K.; Preko, K.; Aryee, J.; Boakye, O.R.; Boli, D.; Salifu, M.R. Empirical Models for Estimating Global Solar Radiation over the Ashanti Region of Ghana. J. Sol. Energy 2014, 2014, 897970. [Google Scholar] [CrossRef]
  26. Solatifar, N.; Abbasghorbani, M.; Kavussi, A.; Sivilevičius, H. Prediction of depth temperature of asphalt layers in hot climate areas. J. Civ. Eng. Manag. 2018, 24, 516–525. [Google Scholar] [CrossRef]
  27. Lekea, A.; Steyn, W.J. Performance of Pavement Temperature Prediction Models. Appl. Sci. 2023, 13, 4164. [Google Scholar] [CrossRef]
Figure 1. Climatic zones of Ghana.
Sustainability 15 15846 g001
Figure 2. Installed digital thermometer for in situ temperature measurement in Kumasi.
Sustainability 15 15846 g002
Figure 3. BELLS 3 model-predicted versus measured pavement temperature on Mango Road (Kumasi).
Sustainability 15 15846 g003
Figure 4. The Park model-predicted versus measured pavement temperature on Mango Road (Kumasi).
Sustainability 15 15846 g004
Figure 5. The Diefenderfer model-predicted daily maximum versus measured daily maximum pavement temperature on Mango Road (Kumasi).
Sustainability 15 15846 g005
Figure 6. The Taamneh model-predicted daily maximum versus measured daily maximum pavement temperature on Mango Road (Kumasi).
Sustainability 15 15846 g006
Figure 7. The Asefzadeh model-predicted daily maximum versus measured daily maximum pavement temperature on Mango Road (Kumasi).
Sustainability 15 15846 g007
Figure 8. BELLS 3 model-predicted versus measured pavement temperature on RSM Road (Tamale).
Sustainability 15 15846 g008
Figure 9. The Park model-predicted versus measured daily maximum pavement temperature on RSM Road (Tamale).
Sustainability 15 15846 g009
Figure 10. The Diefenderfer model-predicted daily maximum versus measured daily maximum pavement temperature on RSM Road (Tamale).
Sustainability 15 15846 g010
Figure 11. The Taamneh model-predicted daily maximum versus measured daily maximum pavement temperature on RSM Road (Tamale).
Sustainability 15 15846 g011
Figure 12. The Asefzadeh model-predicted daily maximum versus measured daily maximum pavement temperature on RSM Road (Tamale).
Sustainability 15 15846 g012
Table 1. Details of Study Roads.
RoadCityAC Layer Thickness (mm)Distance from GMet Station (km)Latitude of GMet Station (°)
Mango RoadKumasi760.86.68
RSM RoadTamale701.99.58
Table 2. Pavement Temperature Data Collection Schedule.
MonthMay 2022June 2022July 2022August 2022September 2022October 2022November 2022December 2022
Week No.44121443
Data Collection Period23rd–29th22nd–28th4th–10th8th–14th1st–7th24th–30th22nd–28th15th–21st
Table 4. Comparison of Error Statistics.
ModelsKumasi (Forest Zone)Tamale (Savannah Zone)
RMSE (°C)MPE (%)MBE (°C)RMSE (°C)MPE (%)MBE (°C)
BELLS3 [9]3.56.5−2.33.67.9−2.8
Park [10]3.6−0.90.53.20.80.0
Diefenderfer [11]4.81.2−1.14.04.0−2.2
Taamneh [12]7.5−15.66.46.7−13.25.9
Asefzadeh [13]13.2−29.612.412.1−25.411.7
Disclaimer/Publisher’s Note: The statements, opinions and data contained in all publications are solely those of the individual author(s) and contributor(s) and not of MDPI and/or the editor(s). MDPI and/or the editor(s) disclaim responsibility for any injury to people or property resulting from any ideas, methods, instructions or products referred to in the content.

