Article

Quantifying Bus Accessibility and Mobility for Urban Branches: A Reliability Modeling Approach

1
School of Civil Engineering, Zhengzhou University, Zhengzhou 450001, China
2
Henan Urban Plan & Design Institute Co., Ltd., Zhengzhou 450044, China
*
Author to whom correspondence should be addressed.
Sustainability 2023, 15(22), 15770; https://doi.org/10.3390/su152215770
Submission received: 15 September 2023 / Revised: 29 October 2023 / Accepted: 7 November 2023 / Published: 9 November 2023

Abstract

:
In order to quantitatively assess the realization degree of urban branch road function, an evaluation method based on reliability theory was established. Firstly, the main characteristics of urban branch road functions, that is, emphasizing accessibility while maintaining mobility, were analyzed. Based on common road network patterns, the branch road network between adjacent higher-level roads was selected as the research object. Public transportation, which is more representative of accessibility, was considered in the evaluation method. Then, a reliability model for branch road function evaluation was proposed, in which walking distance and travel time by bus were taken as the main indicators. Combining Dijkstra algorithm and Monte Carlo simulation, the model was solved. The feasibility of the method was verified through a case study of two branch road units. Then, influences of road network density, connectivity, and bus route layout on the reliability of branch road unit functions were clarified by sensitivity analysis. Results showed that the reliability of the branch unit exhibited a trend of initially increasing and then decreasing with the growth of road network density and connectivity, which indicated that excessively high road network density may hinder the performance of the branch road unit. Adjusting the layout of bus routes within branch road units and expanding the service area of bus routes can enhance reliability. Finally, some suggestions for optimizing branch road unit reliability were provided.

1. Introduction

The concept of the functionally hierarchical road network has been recognized since long ago, with the purpose of achieving higher network efficiency [1]. It is now used throughout the entire project development process and influences all urban road project development phases, from planning through design and into maintenance and operation [2]. Urban roads are classified into several levels according to the priority given for mobility or accessibility. This concept is widely realized in some countries such as the U.S. and China, by incorporating it into the road planning guidelines [3,4]. In the U.S., there are three primary classifications in the conventional urban road system: arterial, collector, and local roads [3]. Arterials serve a primary function of vehicle mobility, generally for longer trips at a more regional scale. Collectors serve a function of balance of regional and local trips, especially as transitions between local accessibility streets and arterial mobility streets. Locals are oriented primarily toward accessibility.
According to “Standard for urban comprehensive transport system planning” (Ministry of Housing and Urban-Rural Development of the People’s Republic of China, State Administration of Market Quality 2018) [5] and “Code for design of urban road engineering” (Ministry of Housing and Urban-Rural Development of the People’s Republic of China 2012) [6] currently used in China, there are four classes of urban roads: expressways, major arterials, minor arterials, and branches. Unlike arterials in the U.S., functions assigned to minor arterials are providing transitions between major arterials and branches, which is the same as that of collectors in the U.S. Expressways, major arterials, and minor arterials constitute the urban arterial system. Branches are designed for providing service for local traffic, similar to local roads in the U.S.
Performance evaluation of urban roads is an essential task for transportation engineers and authorities. Performance indicators can provide information to enable guided decision making regarding urban road planning, design, and management. In the operation phase, level of service (LOS) is commonly adopted to evaluate the performance of urban roads [7,8,9]. However, it is not appropriate to evaluate the functions of different levels of urban roads using the same metrics. The LOS at the operational level is not a perfect metric for the evaluation of all types of roads, especially for branches or local roads whose functional characteristics are low mobility and high accessibility. The four LOS methodologies for the motorized vehicle, pedestrian, bicycle, and transit modes are developed with a focus on arterial and collector road conditions [8]. The research on the evaluation methods of branch road function implementation is always overlooked.
Though functional classification is necessary work throughout the planning and design stages, it is rare to see research concerning the operational performance evaluation taking into account urban road functions. In addition, public transit systems are essential services to the sustainability, equity, and livability of any city. Operators are encouraged to provide a reliable transit service in order to maintain an efficient and attractive system, which increases users’ satisfaction and loyalty [10]. Due to the distinctive characteristics of branch roads’ function and the specificity of their service recipients, the significance of public transportation is more pronounced in branch road areas. The convenience of bus travel is also considered a crucial indicator of how effectively branch roads fulfill their functions. Qian et al. introduced an approach based on the distribution of public transportation for road network evaluation [11]. In light of the above, this paper proposes a reliability methodology for evaluating the function provided to transit traffic on branch roads in the operation stage. The proposed methodology is then implemented to evaluate bus accessibility and mobility of urban branch facilities in Zhengzhou City, China. The objective of the proposed method is to assess the performance of public transportation within branch road units and provide recommendations for improving the functionality of public transportation within branch road units. Public transportation, due to its higher transport efficiency, is considered an important measure for sustainable development. Therefore, establishing a rational assessment method for the functionality of public transportation within branch road units contributes to promoting the development of public transportation. This, in turn, alleviates urban issues related to congestion, pollution, energy, noise, among others, ensuring sustainability.

1.1. Literature Review

Currently, the definition of urban road functions is not entirely clear, especially in the case of studies related to branch roads [12]. Existing research on the classification of urban road functions often revolves around factors such as road traffic conditions and the nature of the surrounding land [13]. Such research tends to overlook the functional designation of different roads during the planning phase. Based on a synthesis of various studies and in conjunction with the functional evaluation objectives in this paper, the specific characterization of branch road functions can be summarized as follows: branch roads primarily emphasize service functions based on accessibility characteristics, with transportation functions serving as secondary [12,13,14]. When travelers are walking to the bus stop of their target bus route, a shorter walking distance is expected, which is an intuitive expression of the demand for service functions. However, when travelers are on board the bus of the target bus route, they hope to arrive at their desired destination as quickly as possible; at this point, the demand for auxiliary road mobility functions is manifested.
At present, there has been relatively limited quantitative research on urban road function evaluation. Existing studies have focused more on assessing traffic operational parameters of urban roads [15]. Among these, service levels based on operational parameters such as travel speed, traffic flow at segments and intersections, and saturation have been widely applied in such evaluation methods [16,17,18]. However, the core evaluation indicators selected in these methods, such as speed and traffic flow, are more oriented toward demonstrating the achievement of road capacity and may not adequately reflect the accessibility of urban roads. Since the primary function of branch roads is to provide good accessibility for the entire urban road network, the aforementioned methods are more suitable for the evaluation of higher-level roads primarily focused on transportation functions and may not be easily transferred to branch roads primarily focused on service functions [19]. In terms of quantitative mathematical methods, subjective methods such as fuzzy comprehensive assessment and the Analytic Hierarchy Process (AHP) are predominantly used [16,20]. In these methods, the establishment of weightings depends on the subjective judgment of researchers, and a fixed set of weight parameters can be challenging to apply to different operational scenarios.
There has been relatively more research on public transportation evaluations, but these studies are always focused on assessing the operational performance of individual bus routes and are not integrated with road classifications and functions [21,22]. Such research relies more on multi-source data related to bus route operations and uses service levels during bus operations as a reference point to evaluate the performance of bus routes or bus networks. For instance, Shi et al. extracted metrics such as passenger flow and service levels based on multi-source data, including smart card transaction data, bus location data, and static attributes of bus networks, thereby proposing a bus route evaluation indicator system [23]. Similarly, Li et al. constructed a bus operation assessment method using data envelopment analysis [24].
In contrast, the focus of this study is on the accessibility of public transit within road areas. Starting from the topological structure and relative positions of the road network in branch road areas and the public transportation network, this study better reflects the achievement of branch road functions through the accessibility and mobility of public transportation.

1.2. Objectives and Contributions

The main contributions of this study can be summarized in two points, shown as follows:
(1)
A new quantitative reliability method for evaluating branch road functions based on bus mobility and accessibility is proposed in this paper, which can reflect the actual performance of branch road functions in the operational phase.
(2)
Factors influencing bus mobility and accessibility within branch road units are analyzed. Specific measures for enhancing bus mobility and accessibility within branch road units are also put forward.

2. Methodology

2.1. Definition of Research Object

Based on the above analysis, as compared to urban arterial roads primarily focused on mobility and transportation functions, branch roads prioritize the realization of accessibility and service functions. In current engineering practices, there is no fixed value for spacing between different levels of urban roads. But the spacing between higher-level roads is usually much larger than the spacing between lower-level roads. Therefore, between adjacent main roads, multiple branch roads often intersect and interconnect, forming a high-density branch network. For such a network of branch roads, its overall integrity is high, and it is of limited significance to simply investigate the service function of a specific road segment. Therefore, this paper takes the branch network system as the evaluation object of branch road functional reliability, and defines it as the structural unit of branch roads (branch unit for short), as shown in Figure 1.

2.2. Quantifying Model

2.2.1. Reliability Evaluation

The basic elements of public transportation within a branch unit include access points, branch networks, bus stops, and bus routes. The public transportation travel of passengers within a branch unit consists of two processes and functional requirements: ① From the access point, walking a reasonable distance to the nearest bus stop on the target bus route, corresponding to the accessibility and service functionality of the bus network in branch unit. ② From the bus stop, being able to take the target bus route within an acceptable amount of time to leave the branch subset area, corresponding to the mobility and traffic functionality of the bus network. In order to better assess the functionality of branch road units, the concept of system reliability is introduced. System reliability is typically defined as the probability of the system performing the specified function within a specified time and under specified conditions. Reliability evaluation is also one of the commonly used methods in the transportation field. For the two processes of public transportation within branch road units mentioned above, the specified condition is the condition during daily off-peak periods, and the specified time refers to the maximum travel time threshold that travelers are willing to accept when choosing public transportation, i.e., the maximum acceptable travel time. Therefore, the total travel time is a crucial factor in determining whether travelers choose public transportation as the travel mode. The total travel time primarily consists of walking time and bus travel time (including waiting time, transfer time, and time on the bus). Among these, walking distance is the main determinant of walking time and serves as a more intuitive indicator of accessibility. Hence, in the proposed model, walking distance and bus travel time are chosen as the primary evaluation indicators for the reliability of public transportation within branch road units. In summary, with accessibility and mobility, or service functionality and traffic functionality as the primary evaluation objectives, the reliability of public transportation functionality within the branch unit is defined as the probability measurement of successfully completing the trip by bus within the branch unit, and within an acceptable walking distance and an acceptable bus travel time under specified time and conditions.
Assuming there are n road access points and J bus routes in a certain branch unit, the bus stop set for any bus route j within this branch unit is { j 1 , , j m } , with the first stop j 1 and the last station j m both located at the boundary area of the branch unit and collectively denoted as j M . Therefore, the reliability R i j of travelers from access i using bus route j for transportation can be represented as follows:
R i j = P ( l i j L ( s ) ,   t i j T i j ( s ) )
where P represents the probability function of l i j and t i j ; l i j is the walking distance of travelers from access i to the nearest bus stop among the target bus route j ; L ( s ) denotes the acceptable walking distance threshold for travelers; T i j ( s ) represents the travel time of the passenger from bus stop j i taking bus route j to bus stop j M ; T i j ( s ) is the acceptable travel time threshold for passengers from bus stop j i taking bus route j to bus station j M . Given that walking distance and bus travel time are independent of each other and considering the varying importance of each access and bus route within the unit, Formula (1) can be expressed as:
R = i = 1 n j = 1 J R i j I i I j = i = 1 n j = 1 J P ( l i j L ( s ) ) P ( t i j T i j ( s ) ) I i I j
where I i is the weight coefficient of access i ; I j is the weight coefficient of bus route j .

2.2.2. Walking Distance

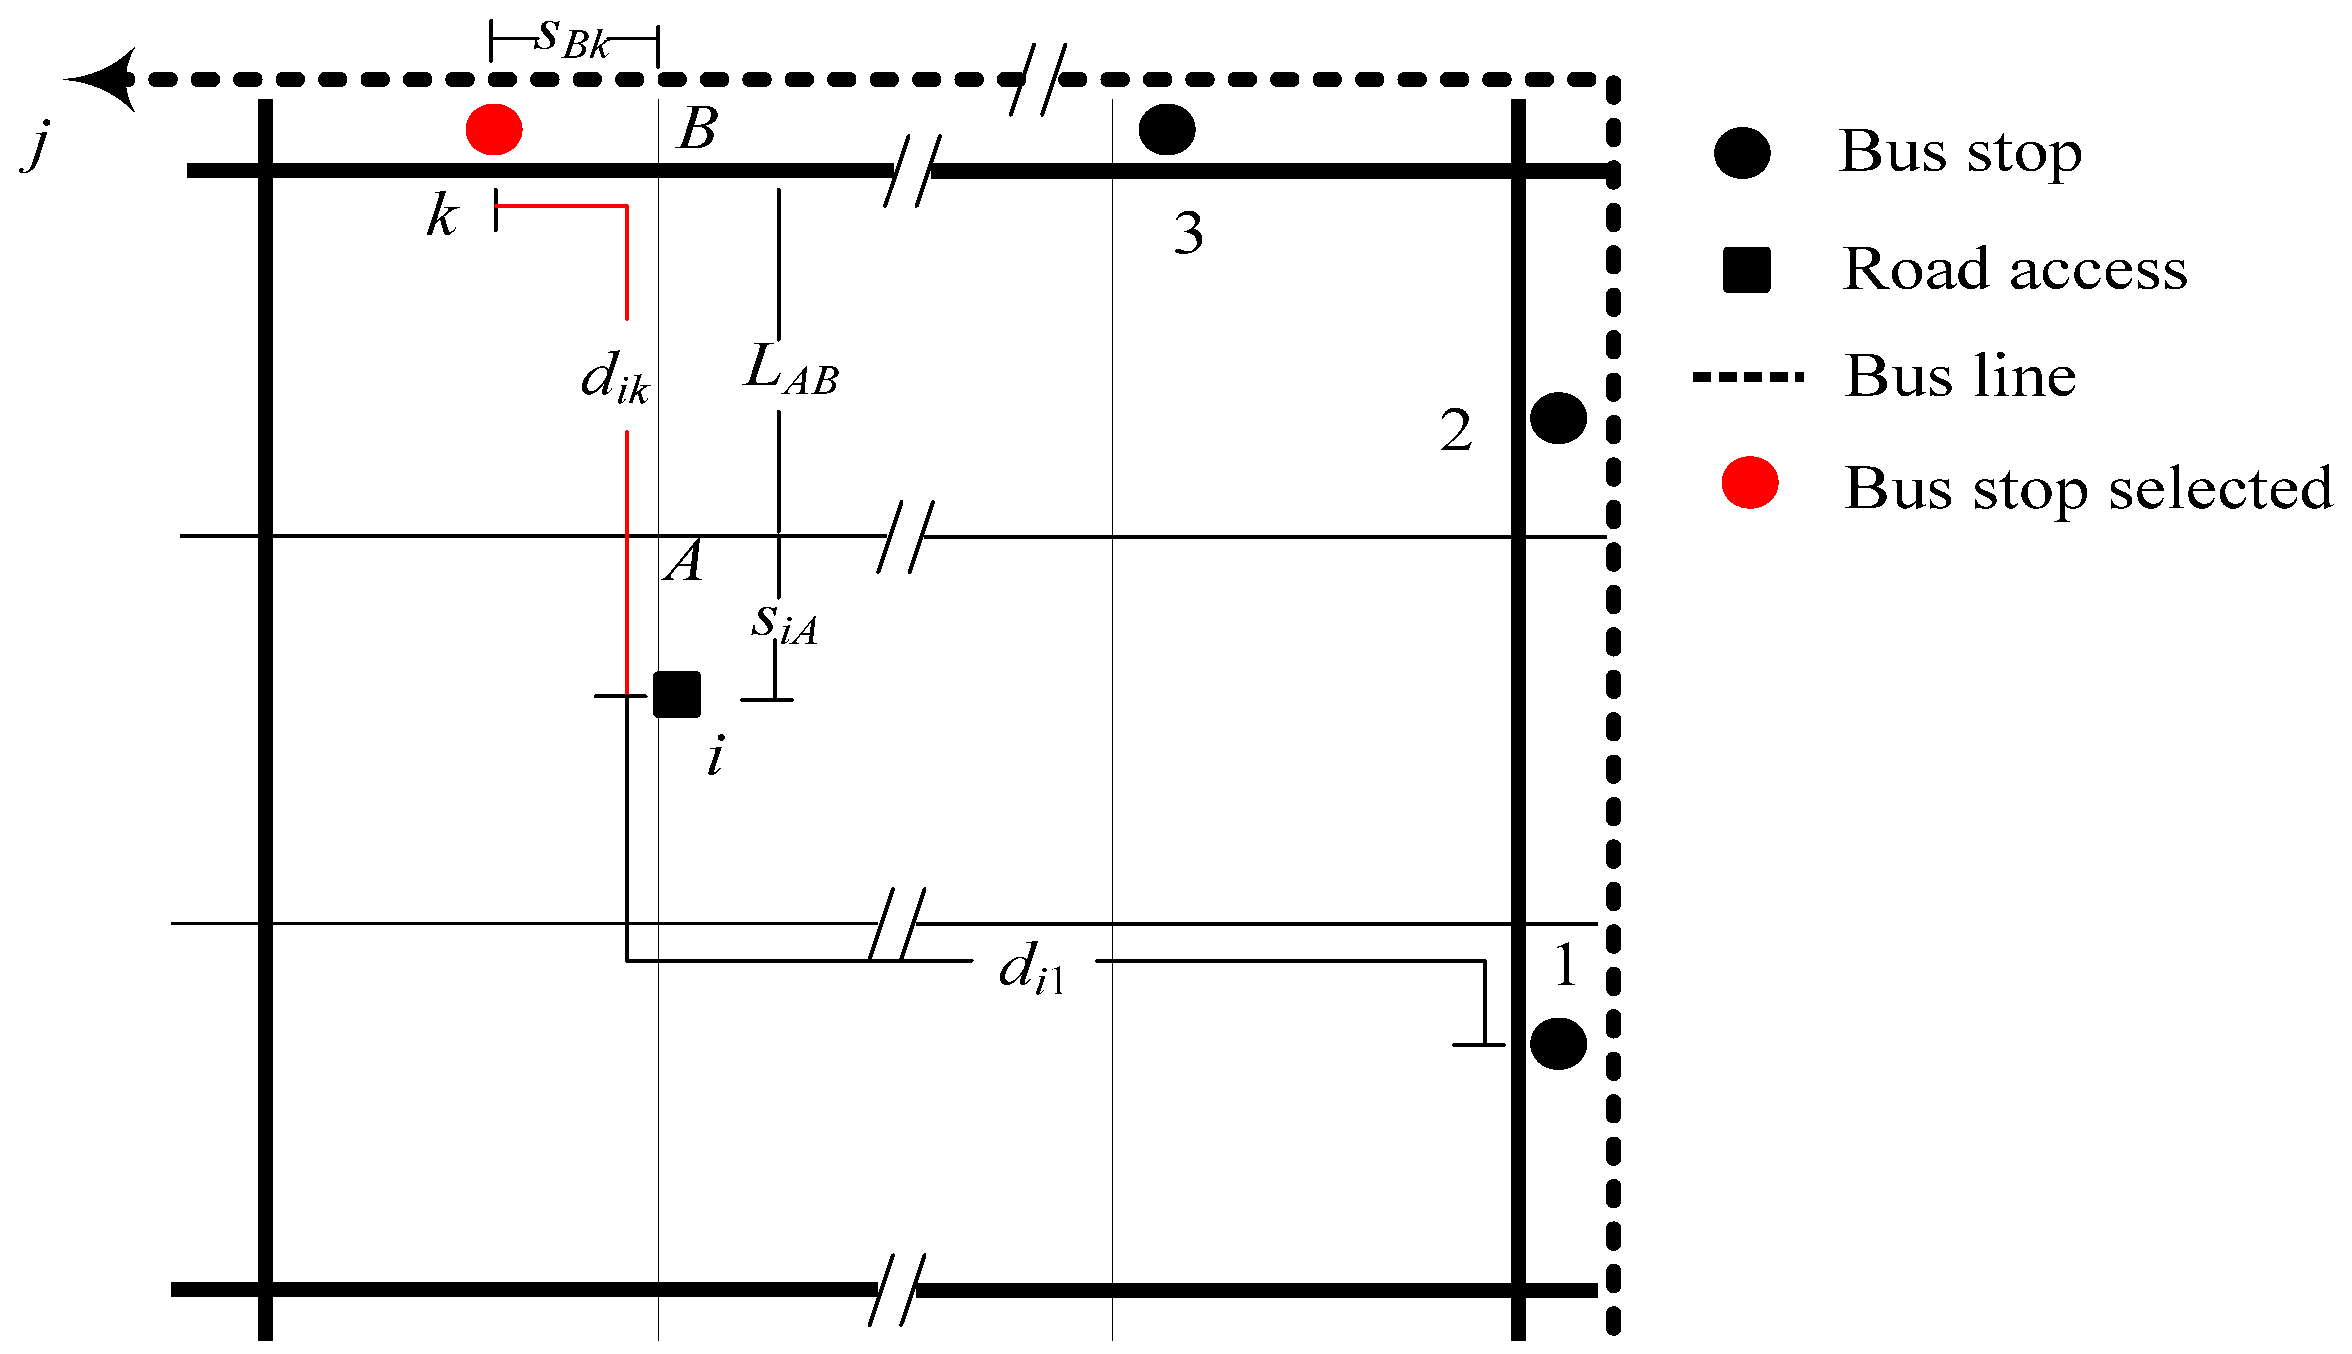
As shown in Figure 2, the travel path of travelers from access i to the nearest bus stop j i among the target bus route j can typically be decomposed into three stages: (1) travelers move from access i to the nearest intersection A ; (2) they then proceed from intersection A to the nearest intersection B near the target bus stop j i ; (3) finally, they travel from intersection B to the target bus stop j i . Therefore, the calculation formula is as follows:
l i j = d i A + l A B + d B j
where d i A is the distance between access i and intersection A ; l A B denotes the shortest path length between intersection A and B ; d B j represents the distance between intersection B and the target bus stop j i . l i B is the shortest path length between access i and intersection B , and l A j is the shortest path length between intersection A and the target bus stop j i . Then,
d i A = { | d i A | ; l i B l A B | d i A | ;   l i B < l A B
d B j = { | d B j | ; l A j l A B | d B j | ;   l A j < l A B
The shortest path between road network nodes is a classic problem in transportation research, and various mature algorithms have been developed. To consider computational efficiency, the Dijkstra algorithm has been chosen to perform the solution. The pseudocode for the solving process is presented in Algorithm 1.
Algorithm 1 The pseudocode of Dijkstra algorithm
# N was adjacency matrix; List_N and List_UN were the list of marked points and unmarked points, respectively; m was the number of network nodes.
Input: N, O, D, d0 = 0, P0 = None, Num = 1, List_N = [0], List_UN = [0:m]-List_N
For Num in range(m):
  For i in List_N:
  For j in List_UN:
  dj = min [dj,di + lij]
  Return k  # k was the number corresponding to the smallest value of dj.
  Select Pi   # Pi was the point, which directly connects the point k, in List_N.
  List_N.append(k)
Return List_N, LAB
In conclusion, the probability function P ( l i j L ( s ) ) can be represented as a piecewise function:
P ( l i j L ( s ) ) = { 0 ,   l i j > L ( s ) 1 ,   l i j L ( s )

2.2.3. Bus Travel Time

The travel time for bus travelers within the branch unit is a primary parameter reflecting the level of public transportation service. It is influenced by a variety of factors, such as the control conditions at intersections, the road traffic conditions, travelers’ waiting time at bus stop, and travelers’ transfer time between different bus routes. Therefore, the bus travel time within the branch unit can be expressed as follows:
t i j = l j M v b + T d
where l j M represents the path length of bus travelers going from the stop j i exit at the branch area; v b is the average operating speed of the bus under free-flow conditions; T d is the travel delay. The delay caused by intersections, travelers’ waiting time at bus stop, and travelers’ transfer time are all considered in the calculation of T d .
T d = a = 1 M T a ( s ) + M ( T e + T l ) + T w + T t
where M is the number of intersections encountered by travelers on their bus travel path; T a ( s ) is the stopping delay at intersection a ; T e stands for the average startup delay time for buses at intersections; T l is the average deceleration delay for buses at intersections; T w is travelers’ waiting time at bus stop; T t is travelers’ transfer time. The probability function of the random variable t j i j M can be transformed into the probability function of the random variable T a ( s ) .
P ( t i j T i j ( s ) ) = P ( a = 1 M T a ( s ) T i j ( s ) M ( T e + T l ) T w + T t l j M v b )
The moment when vehicles arrive at intersection a is entirely random. Assuming that the probability of a bus arriving at any moment within the signal cycle T c , a at intersection a is equal, meaning that the arrival time t of bus follows a uniform distribution on the interval (0, T c , a ), then the probability distribution function of T a ( s ) can be expressed as follows:
P ( T a ( s ) x ) = { T g , a T c , a 1 ; x = 0 ( T g , a + x ) T c , a 1 ; x ( 0 ,   T r , a ) 1 ; x ( T r , a , + )
where T r , a is the red time for the corresponding phase at intersection a ; T g , a is the green time for the corresponding phase at intersection a . Due to the fact that T a ( s ) satisfies a uniform distribution, the calculation of Equation (9) can be performed using the Monte Carlo simulation method. The pseudocode for the calculation is presented in Algorithm 2.
Algorithm 2 The pseudocode of Monte Carlo simulation method
  Num = 0
  For i in range (Times):   #Times is a large integer greater than 1 × 10⁵.
     T 1 ( s ) , , T M ( s ) = Generate M random numbers according to Equation (10)
    If Sum ( T 1 ( s ) , , T M ( s ) ) T i j ( s ) M ( T e + T l ) T w + T t l j M / v b :
      Num + = 1
Return Num/Times

2.2.4. Weightings and Thresholds

From the perspective of public transportation, the importance of each access and each bus route within the branch unit varies. The importance of access i is primarily determined by the volume of people choosing public transportation for travel, while the importance of bus route j is mainly dependent on the route’s transportation capacity. Pedestrian traffic flow and departure frequency are chosen as representative indicators for weights I i and I j , respectively. The formulas are as follows:
I i = Q i i = 1 n Q i
I j = N j j = 0 J N j
where Q i represents the traffic volume of people choosing public transportation for travel at access i , and N j stands for the daily number of departures for route j .
Obviously, the choice of two thresholds significantly affects the calculation results, and the selection of appropriate thresholds is crucial to the feasibility of the method. In the calculation, it is found that when threshold L ( S ) for acceptable walking distance or threshold T i j ( s ) for acceptable travel time is too small, the calculated reliability for any branch road unit tends to be 0. Conversely, when both threshold L ( S ) and threshold T i j ( s ) are too large, the calculated reliability for any branch road unit tends to be 1. Only when the two thresholds are within a reasonable range, the reliability value of the branch road unit will increase with the increase in the thresholds, and the reliability calculation is meaningful. Therefore, selecting an appropriate threshold within a reasonable range is crucial for the feasibility of the proposed model. Thus, for the selection of the two thresholds, the reasonable range of each threshold is firstly determined separately. Then, the threshold L ( S ) of the acceptable walking distance is determined through a questionnaire survey, and the threshold T i j ( s ) of the acceptable travel time primarily is mainly based on existing research.
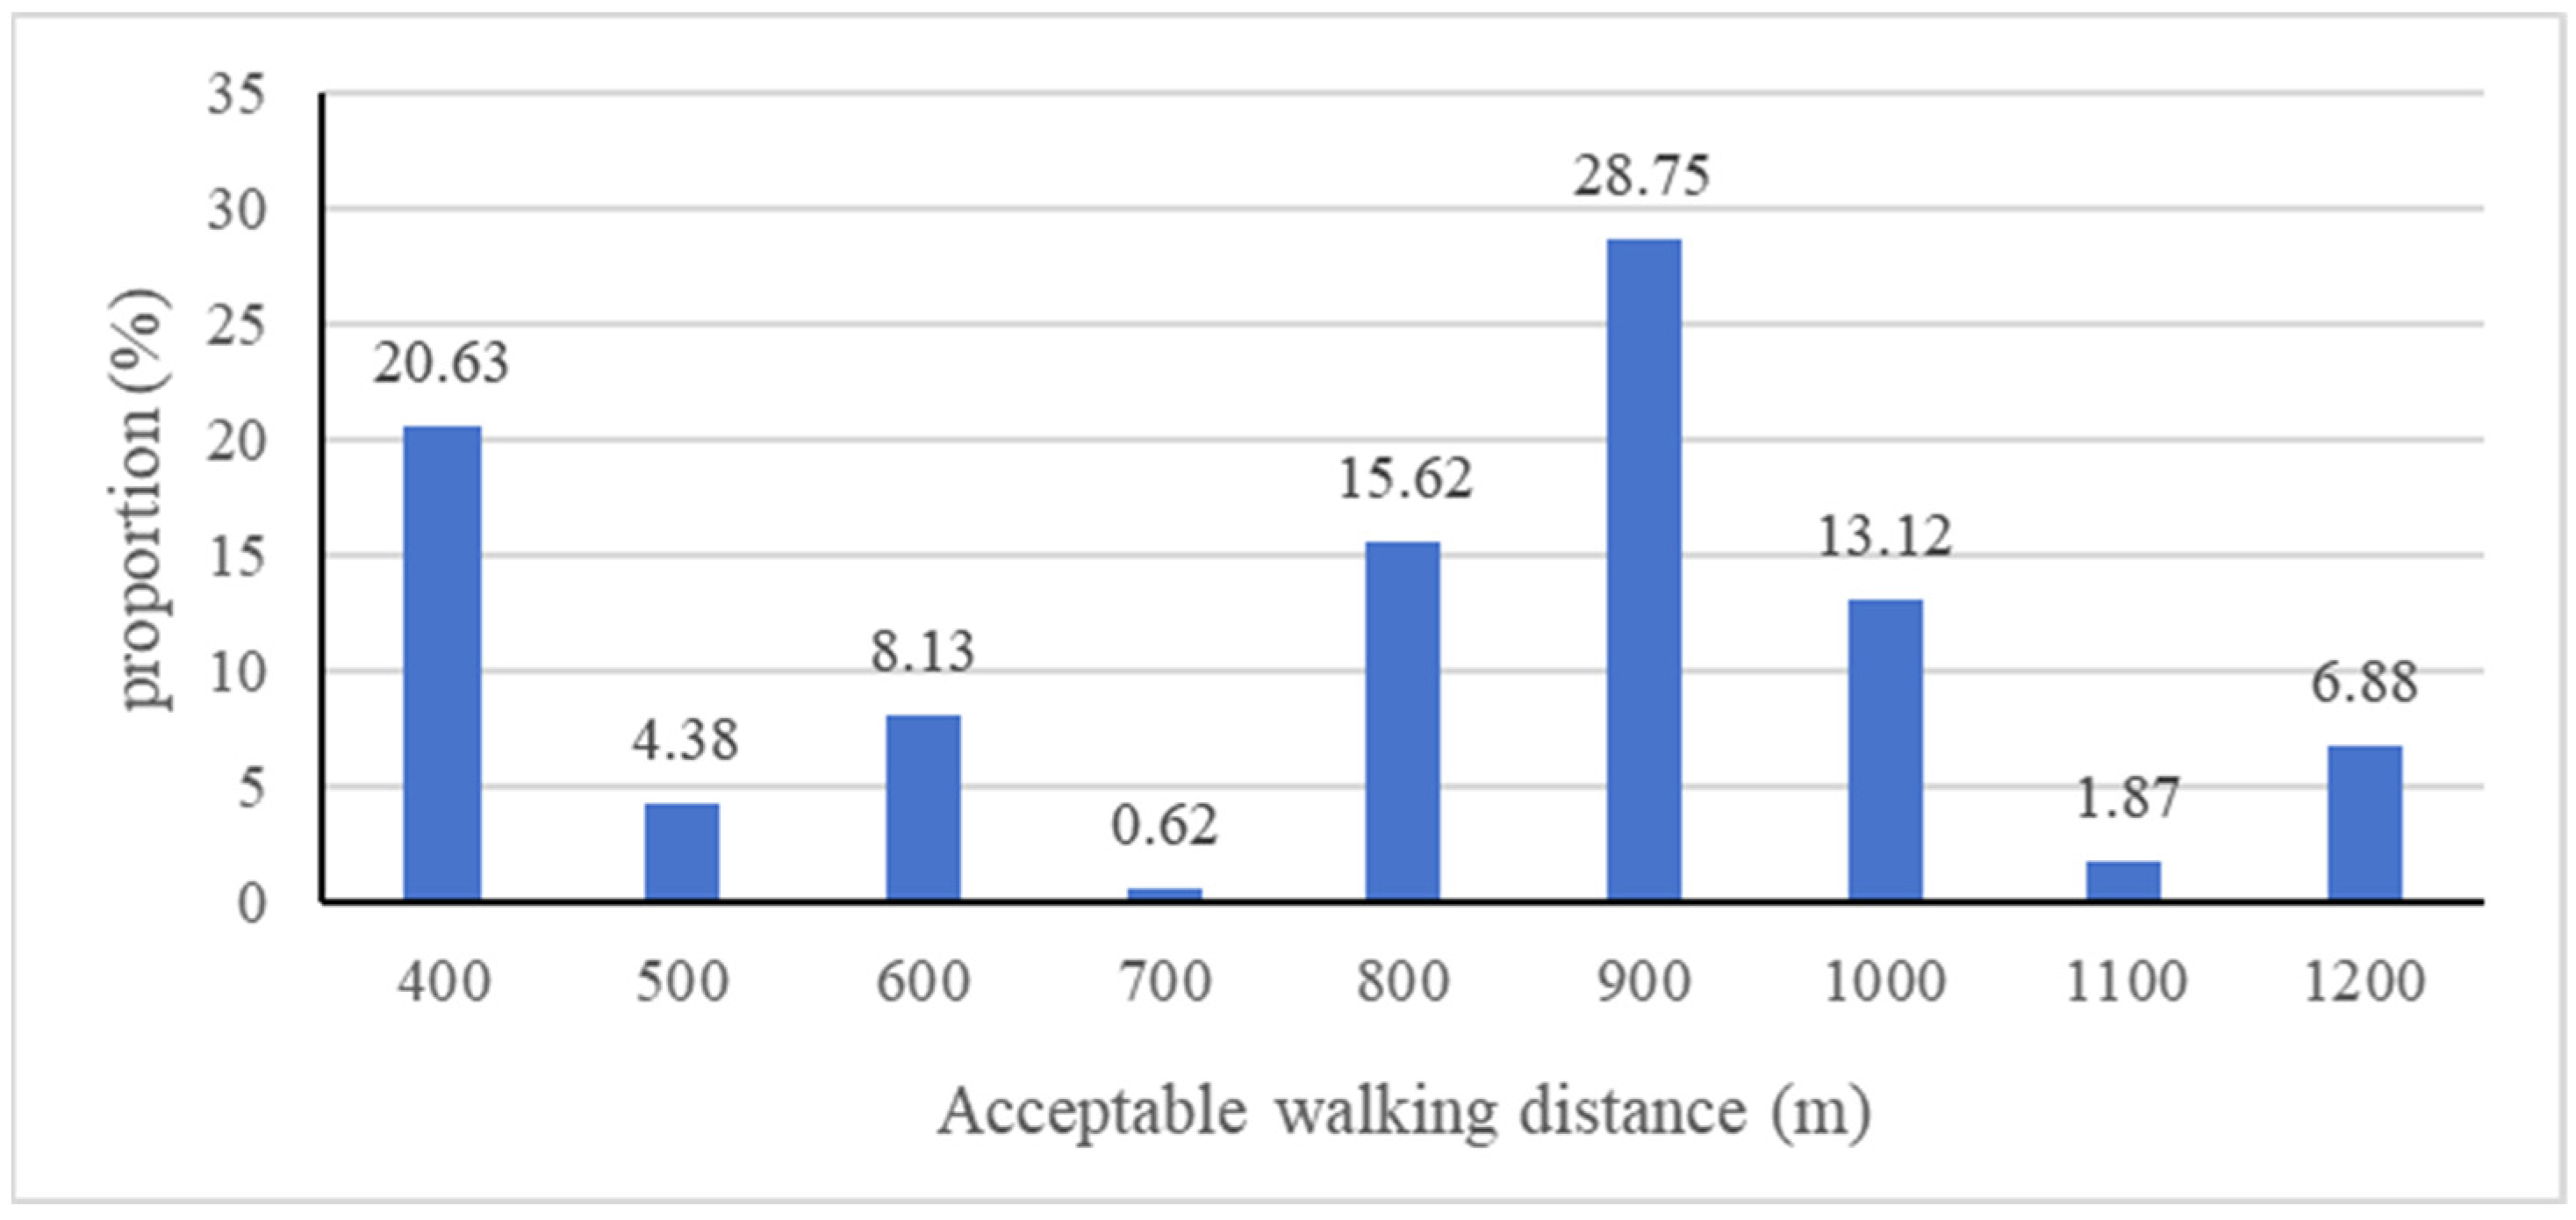
For different groups of people, the acceptable walking distance is completely different. This can be related to various factors, such as gender, age, occupation, income, and even health status. Therefore, the acceptable walking distance may be within a wide range. However, for the approach described in this study, thresholds that are too small or too large make the probabilistic approach ineffective. Therefore, based on the survey results (as shown in Figure 3), this study chose the most acceptable walking distance (900 m) for most people as the final threshold.
The acceptable bus travel time is related to various factors such as different weather conditions, varying ticket prices, seat availability, and diverse travel purposes. Even for the same traveler, the acceptable delay varies for different bus trips. However, existing studies indicated that travelers typically decide to select public transportation by comparing travel time differences between different modes of transportation. In particular, the comparison with car travel time is crucial for travel choices. Leurent [25] and Xu et al. [26] have suggested that the acceptable bus travel time should be 1.3 to 1.6 times the travel time for car trips. The Land Transport Masterplan of Singapore also pointed out in “Land Transport Masterplan” [27] that reducing public transportation travel time from 1.7 times the current car travel time to 1.5 times can enhance the competitiveness of public transportation. In the study on public transportation travel time reliability, Tong et al. compared the optimization results of the bus network under different tolerance coefficient values and finally selected 1.6 as the final tolerance coefficient for bus travel [28]. This study also stated that when bus travel time is 1.6 times longer than car travel time, travelers find it difficult to accept.
T i j ( s ) = 1.6 L j M car v f
where L j M car is the path length of the car from bus stop j i out of the branch unit; v f is the average speed of the bus under free-flow conditions.

3. Case Study

3.1. Calculation and Comparison of Two Units

Two similar structural units within Zhengzhou have been selected for comparative analysis. Based on the POI (Point of Interest) data from the map open platform and traffic survey data, the basic data for these two branch units are presented in Table 1.
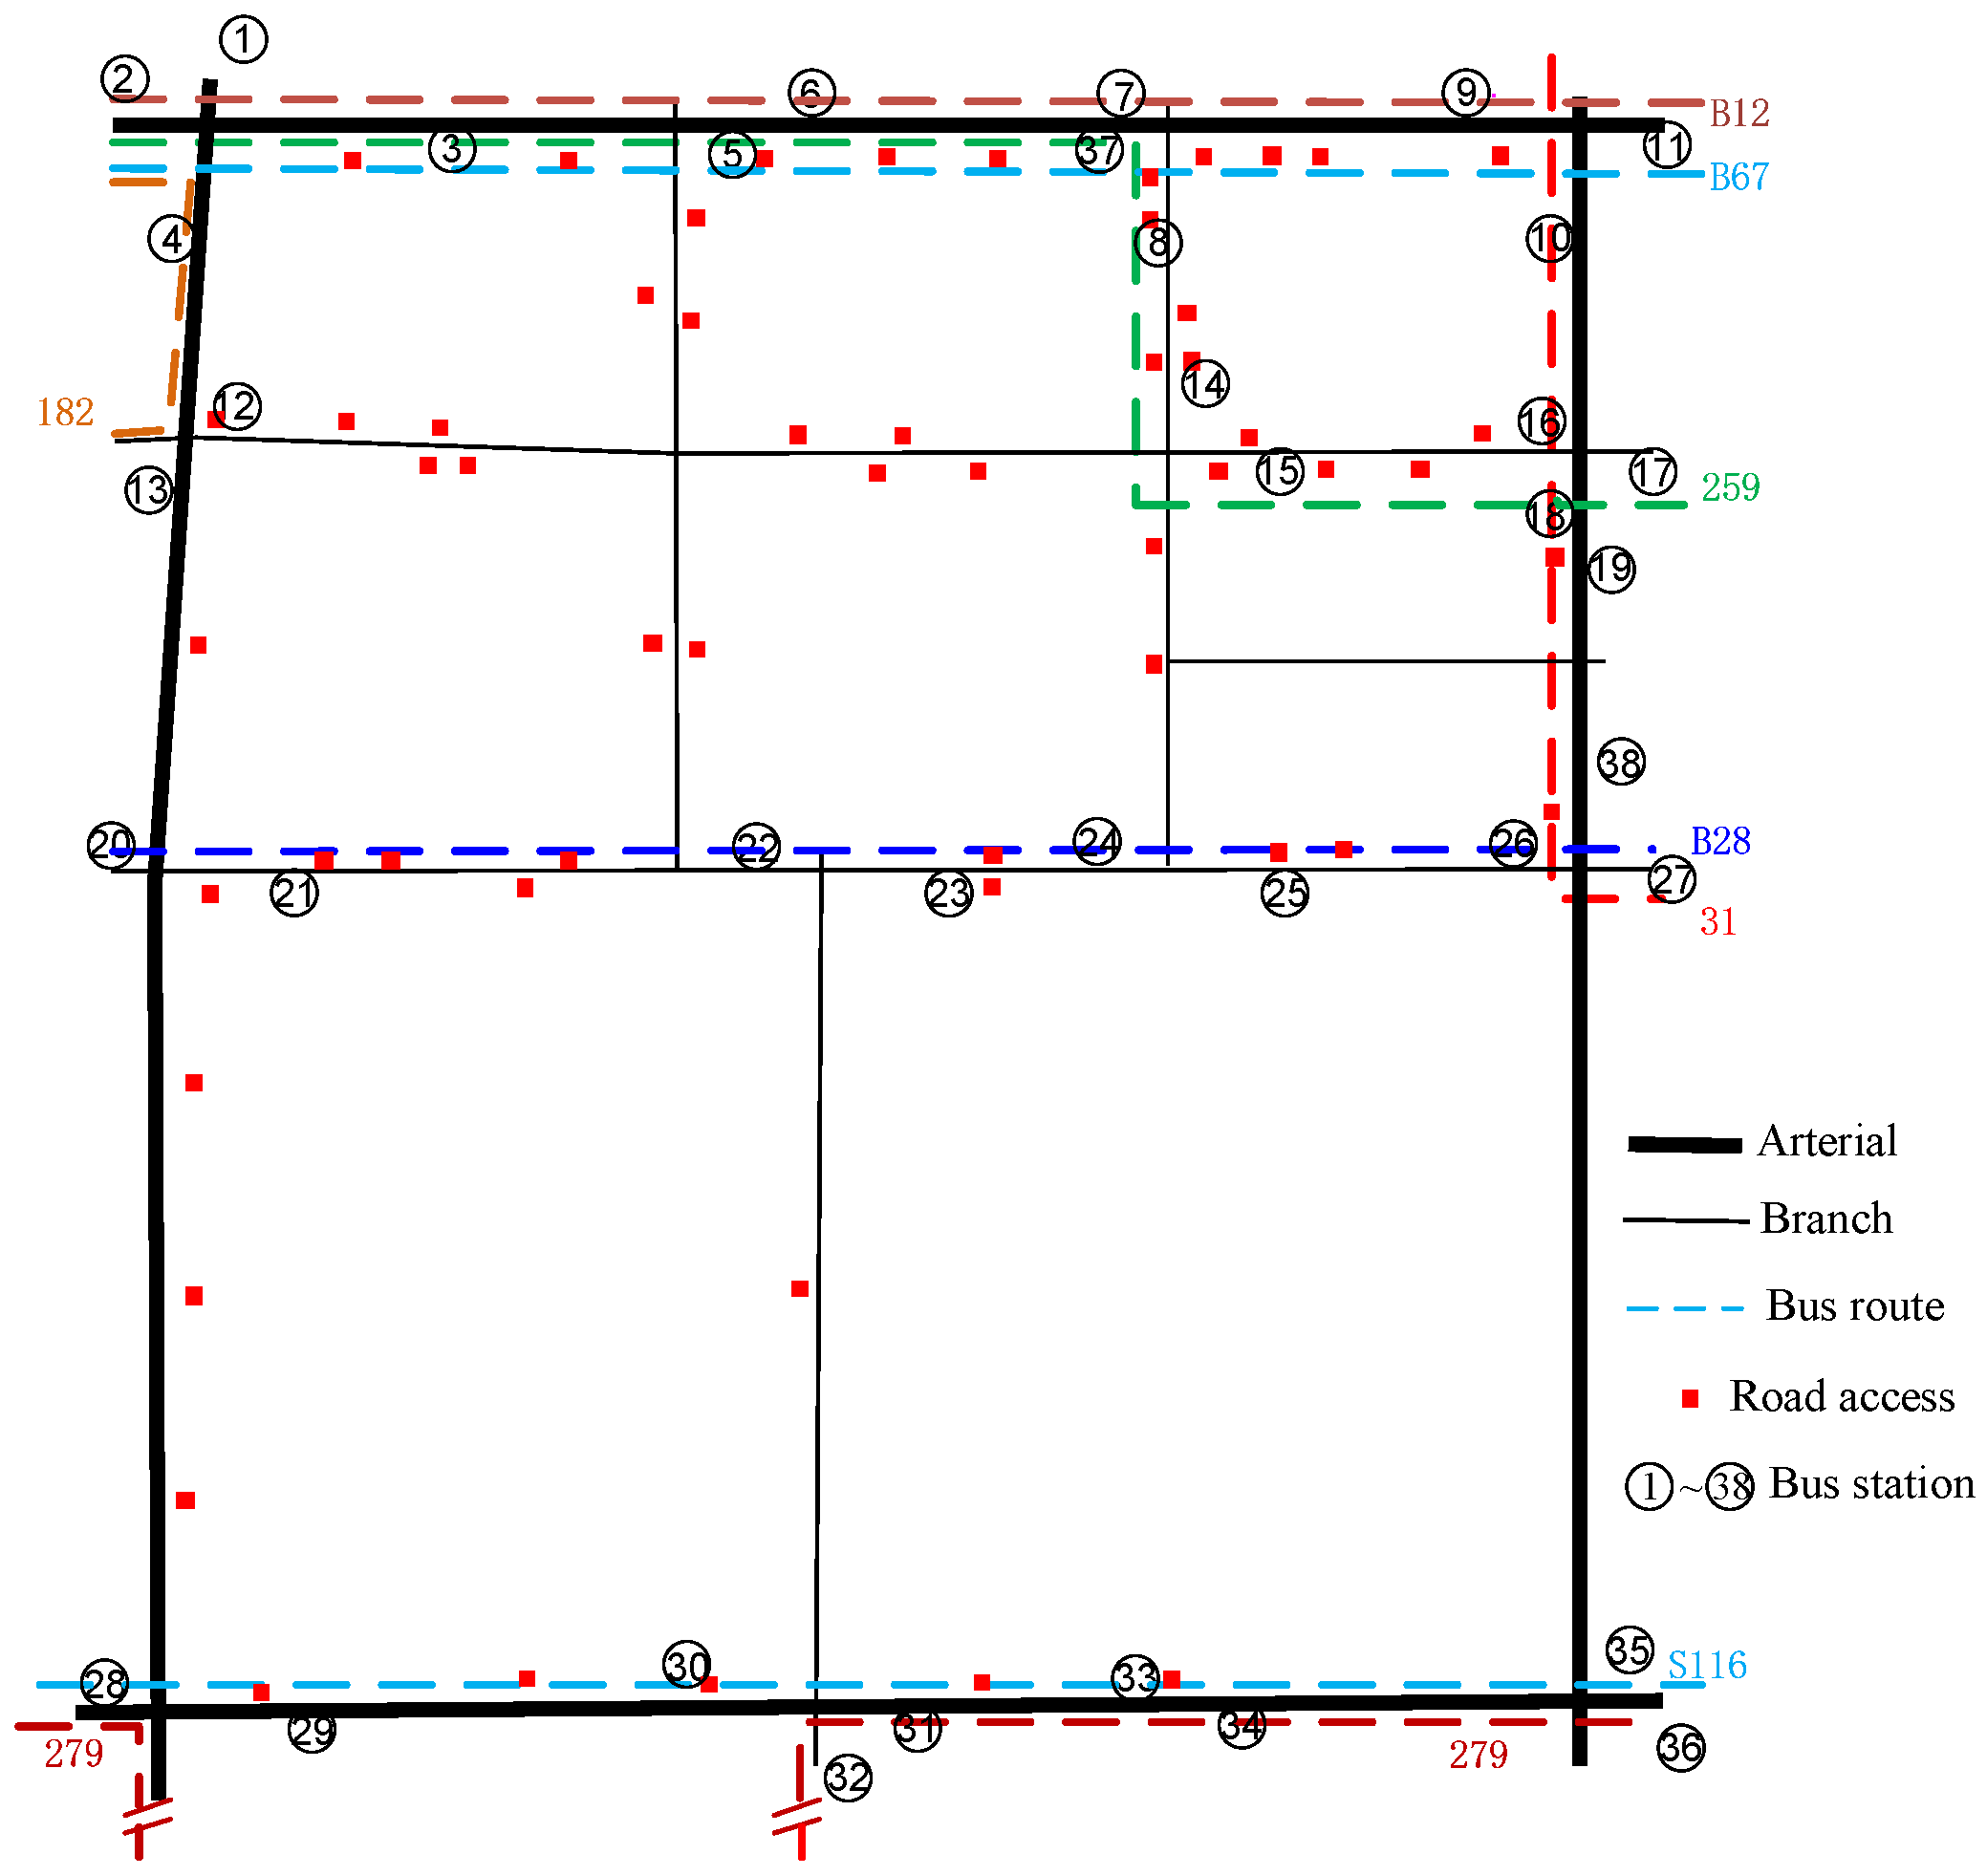
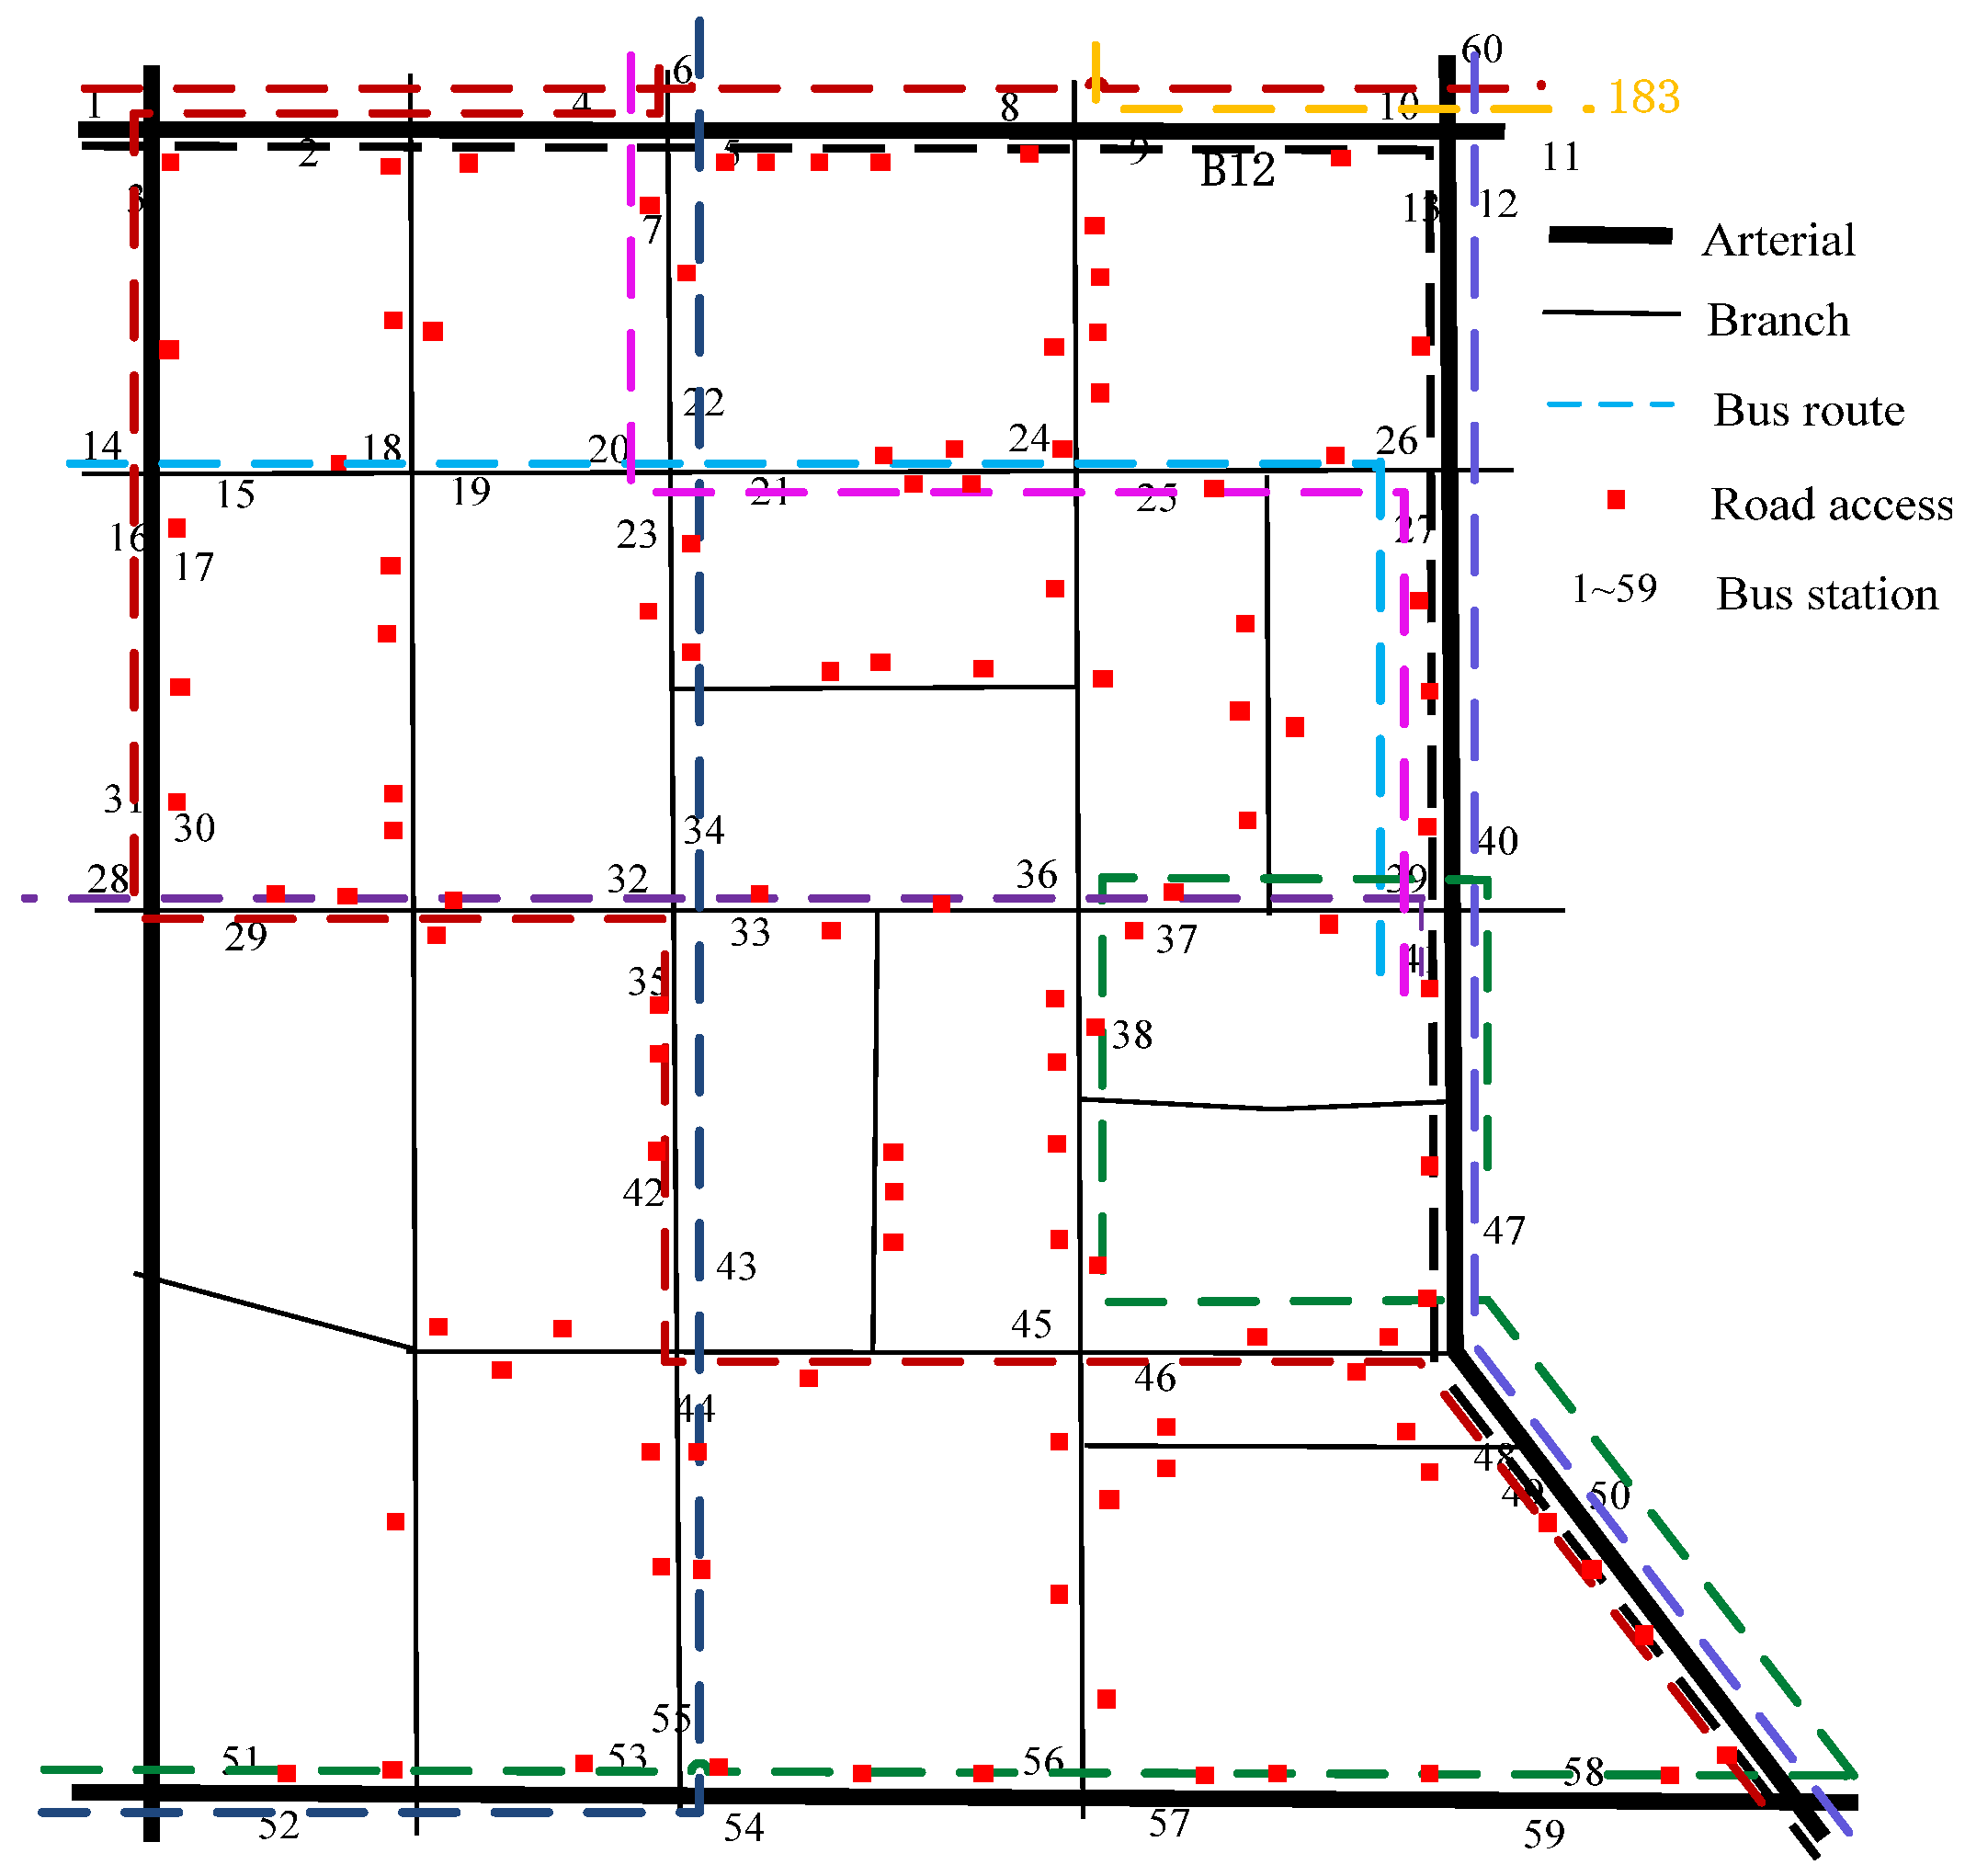
The area of Unit e is similar to Unit f, but the latter, in comparison to the former, has a higher road network density and a longer total road length. At the same time, both regions have a similar number of effective bus routes, but due to the higher road network density of the latter and a lower straight-line coefficient, it has a longer total length of bus routes, more bus stops, and higher density of bus stops. The road network modeling for both evaluation units is shown in Figure 4 and Figure 5, while the arrangement of bus routes, departure conditions, and the calculation results of the weight factor I j for each bus route within both units are presented in Table 2 and Table 3.
The reliability of public transportation for Unit e and Unit f are computed by writing a Python script, and the calculation results are shown in Table 4. Unit f has a higher road network density and a more rational road network structure. Bus routes are relatively dense, and the walking distance for residents’ public transportation trips is relatively short, resulting in a higher reliability of public transportation service functionality compared to Unit e. However, due to the higher road network density in Unit f, it increases the travel time of public transportation vehicles, to some extent, reducing the reliability of public transportation service functionality in that unit.
The evaluation results of the two units based on the traditional Level of Service (i.e., LOS) analysis method are presented in Table 5. Under both methods, the functional performance of Unit f is better than that of Unit e. This consistent trend is mainly due to better actual traffic conditions in Unit f, resulting in shorter travel times for vehicles in Unit f. Additionally, compared with calculation results based on the traditional LOS analysis method, the functional performance difference between the two units is greater in the calculation results of the proposed method. This is because the proposed method also considers walking distance as a factor, and the advantage of Unit f in accessibility further exacerbates the gap between calculation results of the two units.

3.2. Sensitivity Analysis

The mechanism of residents’ public transportation travel is analyzed, and the factors influencing the reliability of public transportation service functionality in branch units are outlined into two main categories: road network density and connectivity within branch units, and the layout of public transportation routes within branch unit boundaries. These two factors interact together, influencing the selection of bus stops and walking paths for residents’ public transportation travel, thereby affecting the overall reliability of public transportation service functionality in the entire unit. Based on the principle of controlling variables, a comparative analysis is conducted on the impact of road network structural factors and public transportation route layout factors on the overall reliability of the branch unit.

3.2.1. Road Network Density and Connectivity

Road network density is a parameter indicator reflecting the abundance of road resources within a region. The greater the road network density, the richer the road resources in the area, more options for travel routes being provided to residents. However, an increase in the road network density within the region will also lead to an increase in the number of intersections along public transportation routes, thereby increasing the travel time for public transportation vehicles. Road network connectivity is an important parameter indicator that reflects the structural characteristics of the road network by examining the connectivity status of various nodes in the network. Typically, it is described as the strength of connectivity between nodes within the planning area through road traffic. For a grid-like road network, the non-linear coefficient of the road network is 1, and the calculation method for road network connectivity can be simplified, as shown in Equation (14).
C = L / ε m H = L / ε m S = ω m
where C represents the road network connectivity; L stands for the total road network mileage; ε is the non-linearity coefficient of the road network, defined as the ratio of total road network mileage to the mileage of straight-line road segments; m represents the number of road network nodes; H is the average spatial straight-line distance between two nodes; S denotes the total area of the planning region; ω represents the number of edges in the road network.
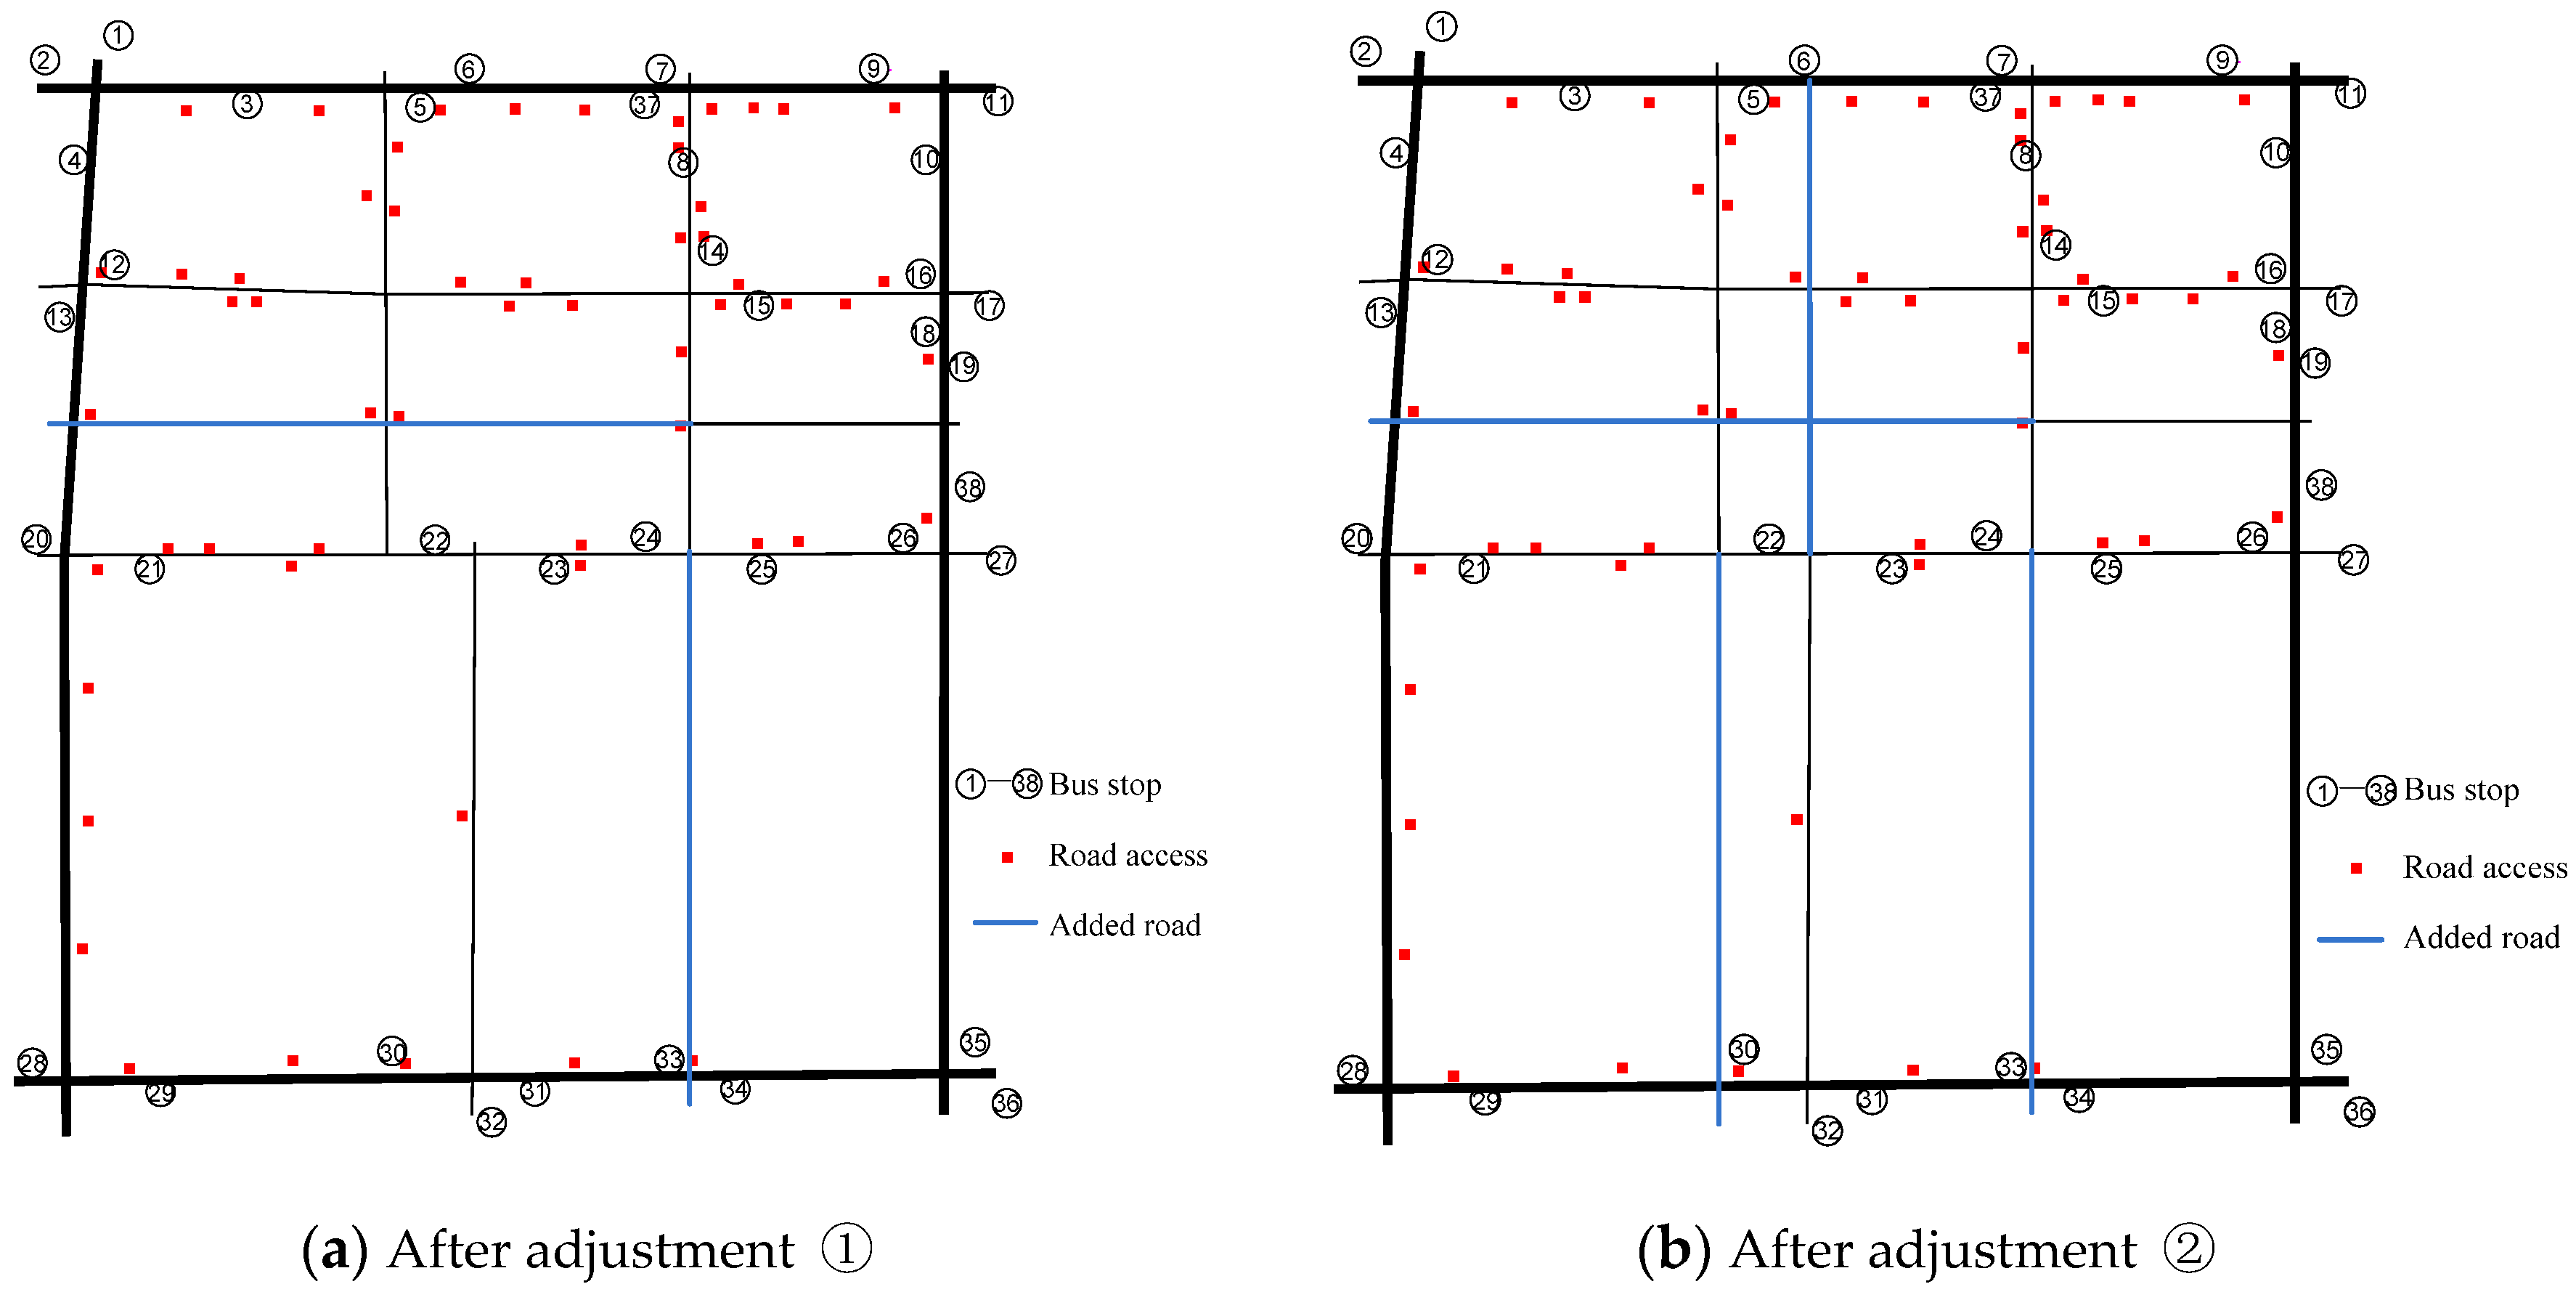
Unit e was selected as the object of comparative analysis. While maintaining the original layout of public transportation routes and accesses distribution, two adjustments were made to the regional road network structure: ① At appropriate locations, dead-end roads within Unit e were connected, increasing road network density and enhancing road network connectivity, as shown in Figure 6a. ② the branch road network was excessively densified, as shown in Figure 6b. After these adjustments, the road network density increased from 5.36 km/km2 to 6.25 km/km2 and 7.03 km/km2, respectively, and the connectivity of the road network in Unit e improved from 1.44 to 1.52 and 1.60. The reliability of public transportation service functionality for these three types of road network structures was calculated, and the results are shown in Figure 7.
Compared to the road network before the adjustments, the structure of the road network after adjustment ① became more rational, with higher road network density, providing residents with greater flexibility in choosing their travel routes. T-shaped intersections within the unit were connected, significantly improving road network connectivity and reducing the proportion of residents’ detours in walking travel. As a result, residents’ walking distances for public transportation travel were reduced, leading to a significant improvement in the reliability of the unit’s public transportation service functionality. The reliability calculation results increased from 0.416 to 0.481. The structure of the road network after adjustment ②, compared to adjustment ①, exhibited higher road network density and greater connectivity, but certain local areas of the network were overly dense. This prevented further reduction in walking distances, and the small spacing between intersections increased the travel time for buses, resulting in a slight decrease in reliability. In comparison to the situation before adjustments, the road network density increased by 16.6% in the case of the road network after adjustment ①, leading to an 8.65% increase in reliability. However, as road network density continued to increase and reached the road network after adjustment ②, reliability decreased by 6.03%. This to some extent indicates that higher road network density does not always promote residents’ travel, as there is an upper limit to the optimal road network density. When road network density exceeds a reasonable range, it can inhibit the reliability of residents’ travel. It is worth noting that the decrease in reliability with increasing road network density is due to the excessively short spacing between intersections. Properly planning intersection spacing can effectively enhance the reliability of the branch unit.
From the above analysis, it can be inferred that road network density and connectivity are crucial factors influencing the functionality of branch road units. The computed reliability of branch road unit functionality exhibits a trend of increasing and then decreasing with the growth of road network density and connectivity. The underlying reason for this trend is the inherent trade-off between accessibility and mobility. Increasing road network density can enhance the accessibility of branch road units. But it may simultaneously sacrifice the unit’s mobility. Hence, setting an appropriate intersection spacing is essential to maximize the functionality of branch road units. Moreover, the reasonable spacing is not fixed. It is influenced by various factors, such as the density and distribution of access points within the unit and the relative positioning of bus routes and access points. Therefore, for different branch road units, the most suitable intersection spacing varies, making it difficult to employ a uniform quantitative value. During the branch network planning phase, the intersection spacing should be set according to the specific operation of each unit to ensure that its function is fully utilized.

3.2.2. Bus Routes Layout

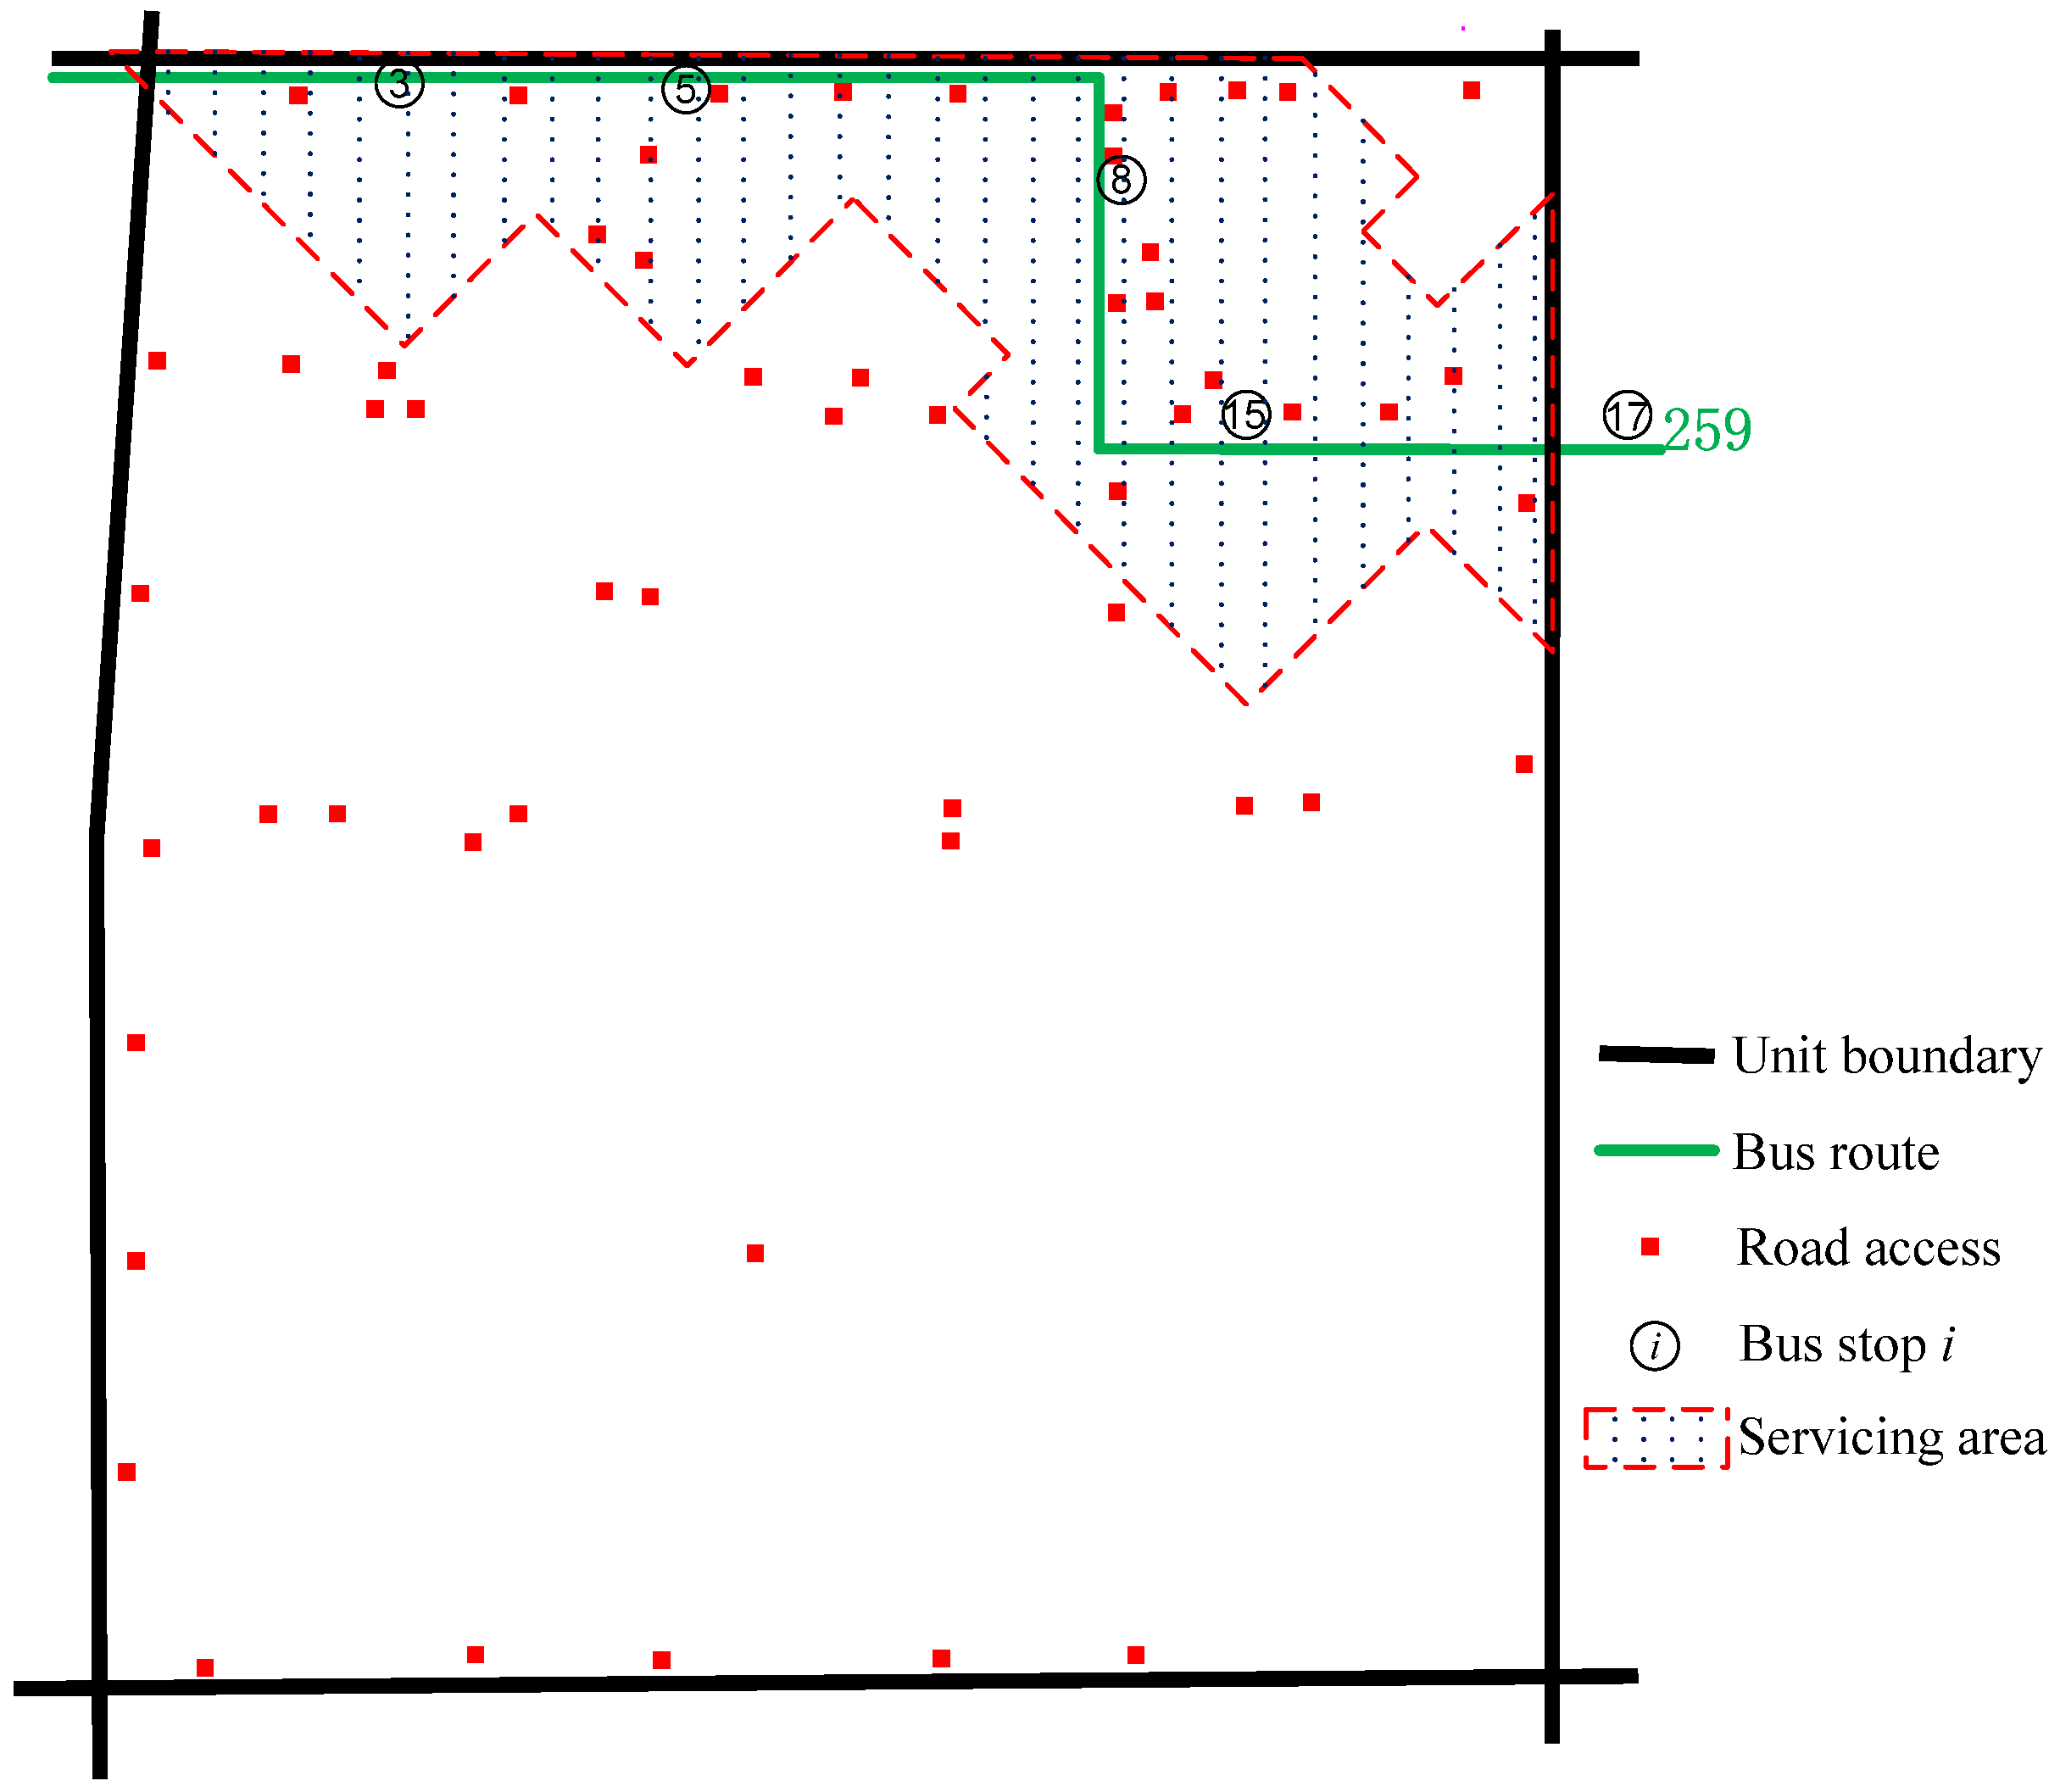
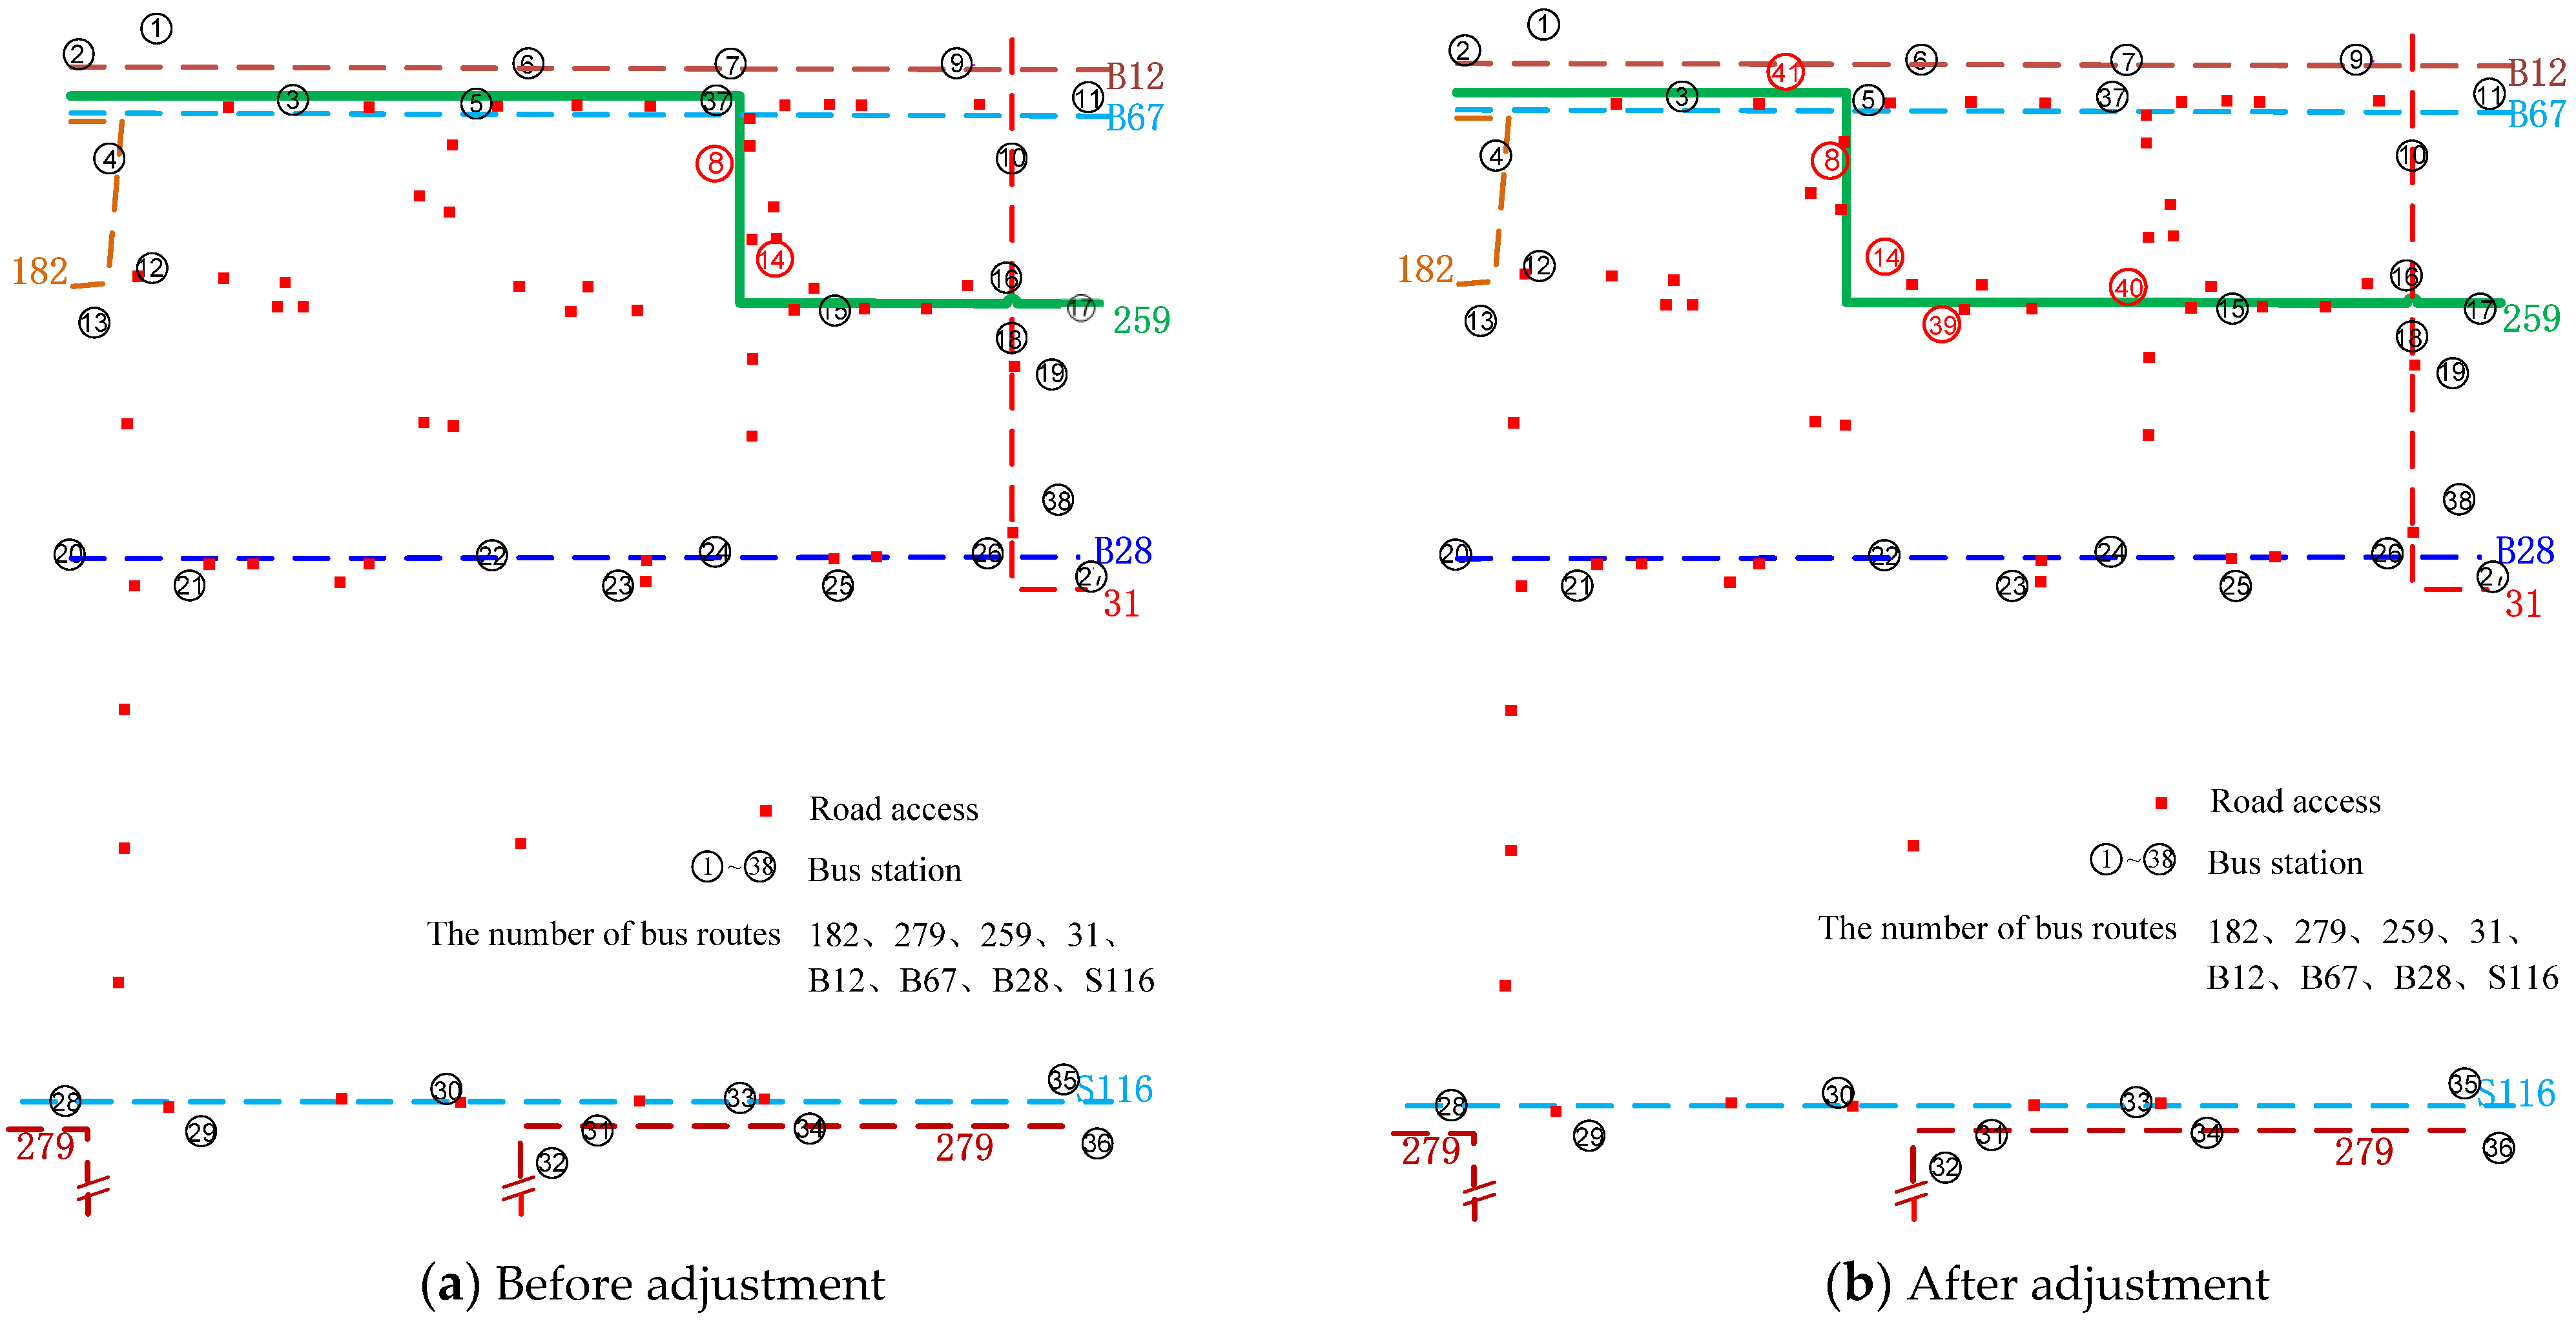
The layout of bus routes determines the relative positioning between public transportation and the branch unit area, thereby affecting the walking distance of residents’ public transportation travel within the area and subsequently altering the reliability of the unit’s public transportation service functionality. To investigate the specific mechanism by which the layout of bus routes affects the reliability of public transportation service functionality, the concept of the bus route service area is introduced. This area is defined as the region within which the walking distance from any point to the nearest stop along the route does not exceed the maximum walking distance ( L ( S ) ), as illustrated in Figure 8. The radiation range of a bus stop is usually expressed as a circular area centered around the bus stop. However, this study focuses on a small-area branch road network, which is usually presented in the form of a square grid. Therefore, the walking path of travelers within the branch road network is usually in the form of a fold line rather than straight lines. Hence, a square with the bus stop as the center and a side length of 2 L ( S ) can better reflect the area where the walking distance from the bus stop does not exceed the threshold L ( S ) . The larger the service area of bus routes within the branch unit, the higher the probability of covering more access points within the region. Similarly, Unit e was selected as the object for comparative analysis. While maintaining the original road network structure and access distribution, appropriate adjustments were made to the public transportation routes within the unit. To ensure the effectiveness of the comparative analysis, the method of adjusting public transportation routes strictly controlled variables, following the principles outlined in Table 6. Based on these principles, route 259 was selected for adjustment, and the results of the adjustment are shown in Figure 9. The adjusted route alignment and stop details are provided in Table 7.
After adjustment, while maintaining stable basic data for route 259, the service areas for both the upstream and downstream directions of route 259 increased from the original 1.26 km2 and 1.29 km2 to 1.39 km2 and 1.41 km2, respectively. The number of covered access points also increased from 39 to 42. When calculating the reliability of public transportation service functionality for the adjusted branch unit, the reliability calculation result increased from 0.416 to 0.431.
Based on the above analysis, it can be concluded that altering the layout of bus routes within branch road units affects the service area of public transportation within the unit, even if the route’s length, starting, and ending points within the unit remain unchanged. When bus routes are moved closer to the interior of the branch road unit from the region’s periphery, the service area expands. A larger service area within the branch road unit increases the probability of covering more access points. However, this is not guaranteed and depends on the distribution of access points within the region. Therefore, when conditions permit, moving bus routes closer to areas with a concentration of access points helps to improve the reliability of the unit.

3.3. Discussion

The reliability of public transportation service functionality in the branch unit is influenced by several factors, among which, the unit’s road network density, road network connectivity, and the layout of bus routes within the unit are determined to be crucial. The supply of road resources within the unit is constrained by unit road network density. Higher road network density provides residents with more route choices and more opportunities to travel with shorter walking distances. However, excessive road network density can lead to increased travel times for buses and increased intersection delays. Enhanced road network connectivity is considered advantageous for the reduction in detours in residents’ walking travel, the decrease in walking distances, and consequently, the improvement in the reliability of the unit’s public transportation service functionality. The allocation of public transportation resources is determined by the layout of public transportation routes within the unit. A more abundant and rational layout of public transportation routes leads to a larger service area covered by public transportation within the region. This, in turn, results in a higher proportion of the area covered by the public transportation system and an increase in the reliability of public transportation service functionality. To improve the reliability of public transportation service functionality in the branch unit, the following recommendations are suggested:
(1)
Within reasonable limits, the consideration of appropriately increasing unit road network density is encouraged, as it forms the foundation for enhancing public transportation accessibility within the unit. However, it is emphasized that road network density should not be excessively high.
(2)
The improvement of the road network structure by optimizing challenging nodes such as a T-shape intersection within the unit’s road network is recommended, as this would contribute to the enhancement of road network connectivity.
(3)
In cases where conditions allow, the increase in the number of public transportation routes, the augmentation of bus stop density, and the allocation of more buses are suggested to maximize the supply of public transportation resources.
(4)
When faced with limitations in resources for public transportation, the optimization of the layout of public transportation routes is proposed to expand their service area within the unit.
(5)
The reasonable optimization of intersection signal configurations is recognized as an effective means to enhance the reliability of public transportation service functionality in the branch unit.

4. Conclusions

In the urban road network system, service functions are primarily taken by branch roads. Public transportation is an integral component of branch road service functions, and accessibility is a concentrated reflection of service functions. Therefore, based on reliability theory, the concept of reliability for branch road public transportation service functionality is introduced as a quantitative measure to evaluate the performance of branch road units. A mathematical model for assessing public transportation service functionality reliability is developed, and Python scripting is employed to facilitate model calculations. Through on-site traffic surveys, calculations, and analysis, the feasibility, rationality, and intuitiveness of the public transportation service functionality reliability metric are demonstrated. Comparative analyses of public transportation service functionality reliability under different road network structures and public transportation layouts reveal the primary influencing factors on reliability, leading to optimization recommendations for public transportation service functionality. The concept of public transportation service functionality reliability for branch roads holds value as a reference for quantifying branch road functions, improving branch road network structures, and optimizing the layout of local public transportation routes. This contributes to the advancement of public transportation, improves traffic efficiency within urban branch areas, alleviates various issues associated with urban transportation, and ensures the sustainable development of cities. The method proposed in this study is a general approach, and can be applied in any regions. When the proposed method is applied to other regions, the main difference is that travelers in different countries have different tolerances for walking distances and travel delays. Hence, it is essential to select appropriate thresholds based on the specific conditions of the region. It should also be noted there are still some limitations in this study. The overall traffic flow situation is an important factor affecting the travel time reliability. However, because the main purpose of this study is evaluating the functional realization of the branch unit during daily off-peak periods, the proposed method only applies to the free-flow situation. Furthermore, given the limited data, the estimation model regarding bus travel time is simplified, which may lead to some degree of difference compared with the actual situation. In future work, the method will be deepened and improved according to the engineering practice.

Author Contributions

Conceptualization, Y.Y. and P.T.; methodology, Y.Y. and P.T.; software, W.D.; validation, W.D. and P.T.; formal analysis, W.D.; investigation, W.D. and P.T.; resources, P.T. and W.D.; data curation, P.T. and J.L.; writing—original draft preparation, P.T.; writing—review and editing, Y.Y., W.D. and P.T.; visualization, W.D.; supervision, Y.Y.; project administration, Y.Y.; funding acquisition, Y.Y. All authors have read and agreed to the published version of the manuscript.

Funding

This research was funded by the Key Research Projects of Henan Higher Education Institutions (Grant No. 24A580005).

Institutional Review Board Statement

Not applicable.

Informed Consent Statement

Not applicable.

Data Availability Statement

The data used to support the findings of this study are available from the corresponding author upon request.

Conflicts of Interest

The authors declare no conflict of interest.

References

  1. Goto, A.; Nakamura, H.; Asano, M. Evaluation of the functionally hierarchical road network considering junction types. In Proceedings of the 92nd Transportation Research Board Annual Meeting, Washington, DC, USA, 13–17 January 2013. [Google Scholar]
  2. National Academies of Sciences, Engineering, and Medicine. Developing an Expanded Functional Classification System for More Flexibility in Geometric Design; The National Academies Press: Washington, DC, USA, 2018. [Google Scholar]
  3. AASHTO. A Policy on the Geometric Design of Highways and Streets, 6th ed.; AASHTO: Washington, DC, USA, 2018. [Google Scholar]
  4. Department for Transport of Britain. Guidance on Road Classification and the Primary Route Network; Department for Transport of Britain: London, UK, 2012. [Google Scholar]
  5. GB/T51328-2018; Standard for Urban Comprehensive Transport System Planning. Ministry of Housing and Urban-Rural Development of the People’s Republic of China, State Administration of Market Quality: Beijing, China, 2018.
  6. CJJ37-2012; Code for Design of Urban Road Engineering. Ministry of Housing and Urban-Rural Development of the People’s Republic of China: Beijing, China, 2012.
  7. Bhuyan, P.; Nayak, M. A review on level of service analysis of urban streets. Transp. Rev. 2013, 33, 219–238. [Google Scholar] [CrossRef]
  8. Transportation Research Board. Highway Capacity Manual; Transportation Research Board: Washington, DC, USA, 2016. [Google Scholar]
  9. Friedrich, M. Functional structuring of road networks. Transp. Res. Procedia 2017, 25, 568–581. [Google Scholar] [CrossRef]
  10. Diab, E.I.; Badami, M.G.; El-Geneidy, A.M. Bus transit service reliability and improvement strategies: Integrating the perspectives of passengers and transit agencies in North America. Transp. Rev. 2015, 35, 292–328. [Google Scholar] [CrossRef]
  11. Qian, D.; Wang, Y.; Zhang, X.; Zhao, D. Rationality Evaluation of Urban Road Network Plan Based on the EW-TOPSIS Method. In Proceedings of the 2021 13th International Conference on Measuring Technology and Mechatronics Automation (ICMTMA), Beihai, China, 16–17 January 2021. [Google Scholar]
  12. Mou, Z.; Guangming, H.; Dong, W. Classification System of Intersection Guide Sign Information Which Based on the Urban Road Classified by Function. Road Traffic Saf. 2007, 1, 15–19. [Google Scholar]
  13. Kawakami, Y.; Honda, Y.; Takeuchi, D.; Iwasaki, M. A Study on Macroscopic Mechanism of Traffic Accident Occurrence caused by Mismatch between Road Function and Roadside Land Use. Infrastruct. Plan. Rev. 1991, 9, 165–172. [Google Scholar] [CrossRef]
  14. Hu, S.; Gao, S.; Wu, L.; Xu, Y.; Zhang, Z.; Cui, H.; Gong, X. Urban function classification at road segment level using taxi trajectory data: A graph convolutional neural network approach. Comput. Environ. Urban Syst. 2021, 87, 101619. [Google Scholar] [CrossRef]
  15. Wei, R.; Weng, J.; Xu, J.; He, H. Evaluation of Urban Regional Road Network Topological Characteristics Considering Traffic Operating Parameters. In Proceedings of the 20th & 21th COTA International Conference of Transportation Professionals, Xi’an, China, 17 December 2021. [Google Scholar]
  16. Hu, Y. Study on Urban Road Capacity Evaluation Based on Multi-Level Fuzzy Comprehensive Evaluation Method. Adv. Appl. Math. 2021, 10, 1003–1015. [Google Scholar] [CrossRef]
  17. Yu, P.; Anna, M.; Wu, Z. The Fusion Evaluation of Urban Road Network and External Highway Network. Highw. Eng. 2018, 43, 57–60+76. [Google Scholar]
  18. Dong, J.X.; Cheng, T.; Xu, J.; Wu, J. Quantitative assessment of urban road network hierarchy planning. Town Plan. Rev. 2013, 84, 445–472. [Google Scholar] [CrossRef]
  19. Sahitya, K.; Prasad, C. GIS-Based Urban Road Network Accessibility Modeling Using MLR, ANN and ANFIS Methods. Transp. Telecommun. J. 2021, 22, 15–28. [Google Scholar] [CrossRef]
  20. Li, W.; Yang, A.; Wu, D. Research on evaluation and optimization method of urban road traffic management facilities effectiveness. J. Guangxi Univ. 2018, 43, 1200–1210. [Google Scholar]
  21. Farhan, B. Evaluation, Modeling and Policy Assessment for Park-and-Ride Services as a Component of Public Transportation; The Ohio State University: Columbus, OH, USA, 2003. [Google Scholar]
  22. Tong, W. Fuzzy Evaluation of General Public Transportation Service Level in Small and Medium-Sized Cities. Appl. Mech. Mater. 2012, 209–211, 856–860. [Google Scholar]
  23. Shi, Q.; Zhang, K.; Weng, J.; Dong, Y.; Ma, S.; Zhang, M. Evaluation model of bus routes optimization scheme based on multi-source bus data. Transp. Res. Interdiscip. Perspect. 2021, 10, 100342. [Google Scholar] [CrossRef]
  24. Li, J.; Chen, X.; Li, X.; Guo, X. Evaluation of Public Transportation Operation based on Data Envelopment Analysis. Procedia-Soc. Behav. Sci. 2013, 96, 148–155. [Google Scholar] [CrossRef]
  25. Leurent, F. Curbing the computational difficulty of the logit equilibrium assignment model. Transp. Res. Part B Methodol. 1997, 31, 315–326. [Google Scholar] [CrossRef]
  26. Xu, X.; Chen, A.; Jansuwan, S.; Yang, C.; Ryu, S. Transportation network redundancy: Complementary measures and computational methods. Transp. Res. Part B Methodol. 2018, 114, 68–85. [Google Scholar] [CrossRef]
  27. Authority, L.T. Land Transport Masterplan. Singapore, 2008. Available online: https://www.lta.gov.sg/content/dam/ltagov/who_we_are/statistics_and_publications/master-plans/pdf/LTMP-Report.pdf (accessed on 14 September 2023).
  28. Tong, P.; Yan, Y.; Wang, D.; Qu, X. Optimal route design of electric transit networks considering travel reliability. Comput.-Aided Civ. Infrastruct. Eng. 2021, 36, 1229–1248. [Google Scholar] [CrossRef]
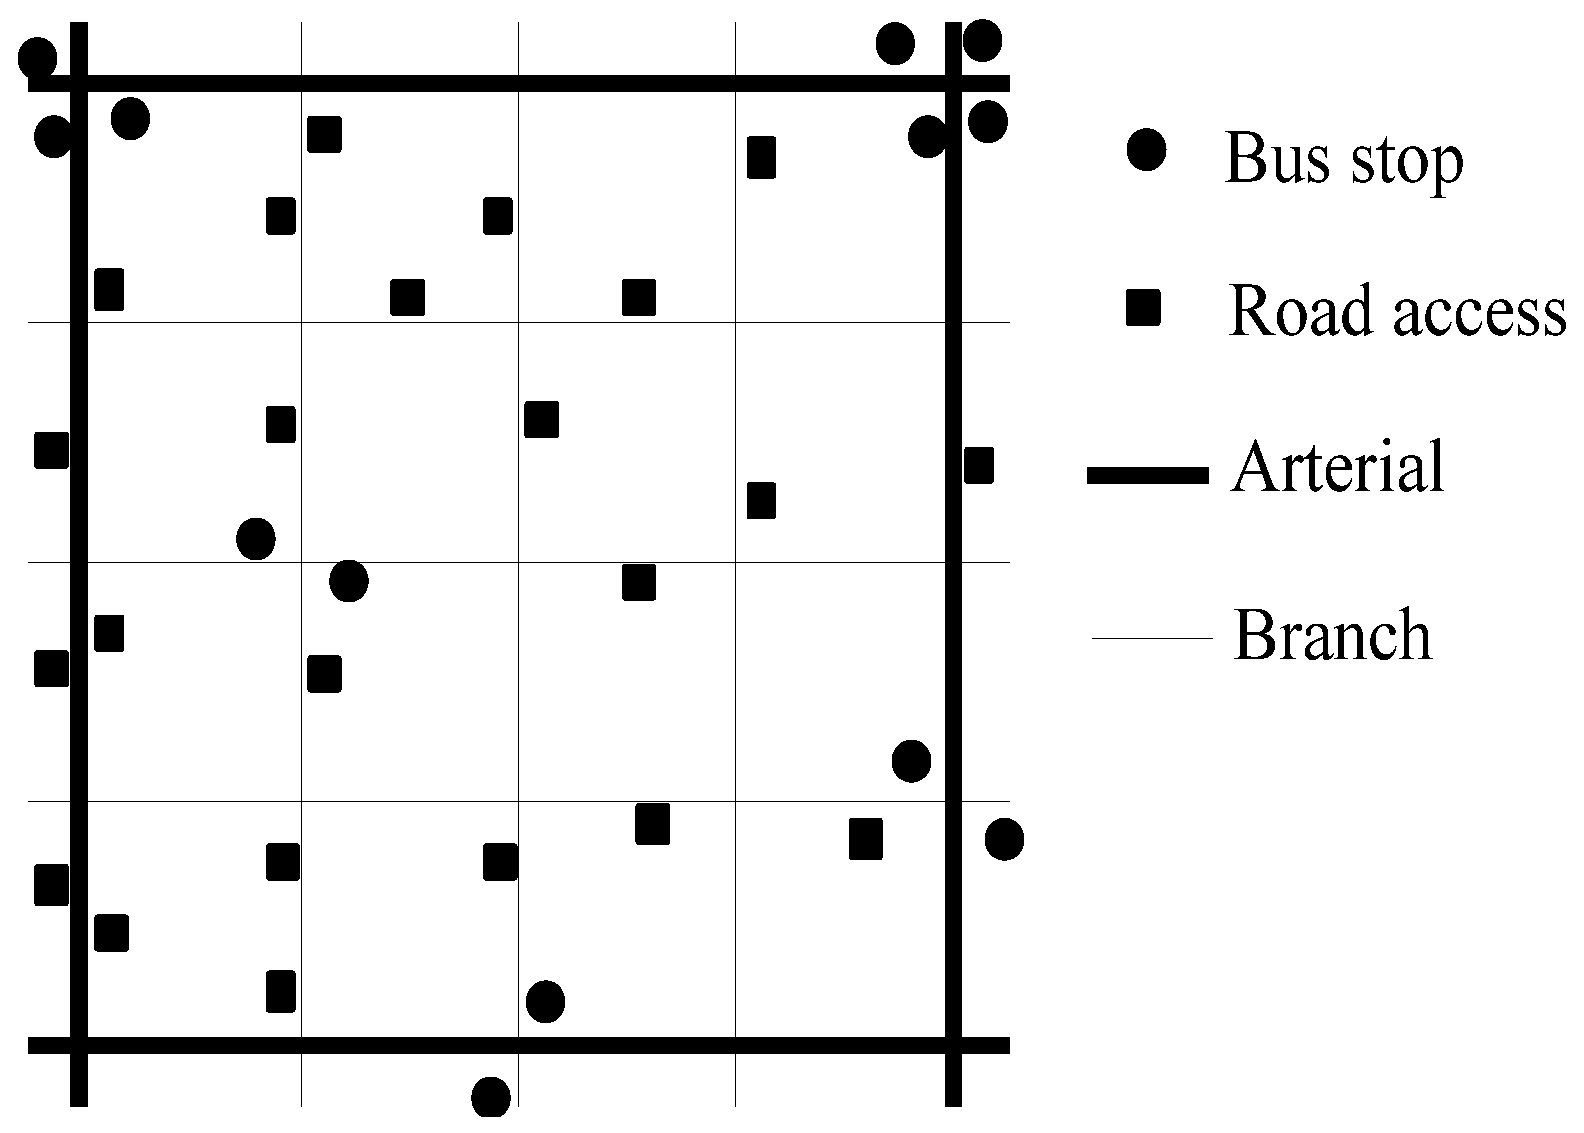
Figure 1. Structural units of branch roads.
Sustainability 15 15770 g001
Figure 2. Target bus stop and route choice for travelers.
Sustainability 15 15770 g002
Figure 3. Survey about acceptable walking distance.
Sustainability 15 15770 g003
Figure 4. Unit e.
Figure 4. Unit e.
Sustainability 15 15770 g004
Figure 5. Unit f.
Figure 5. Unit f.
Sustainability 15 15770 g005
Figure 6. Adjustment of road network structure.
Sustainability 15 15770 g006
Figure 7. Calculation results.
Sustainability 15 15770 g007
Figure 8. Servicing area of bus routes.
Sustainability 15 15770 g008
Figure 9. Adjustment of bus routes.
Sustainability 15 15770 g009
Table 1. Basic data analysis of evaluation units.
UnitArea (km2)Road Network Density (km/km2)Total Road Length
(km)
Number of Bus RoutesNumber of Bus StopsNumber of Road Access Points
e2.095.3611.30143659
f1.519.9915.08155981
Table 2. Bus departure and I j calculation in Unit e.
jRouteRunning Time (h)Bus Departure FrequencyIj
0B12 (upline)151430.118
1B12 (downline)151430.118
2B67 (upline)14.51390.114
3B67 (downline)14.51390.114
4259 (upline)13360.030
5259 (downline)13360.030
6271 (downline)13550.045
7182 (downline)13.5560.045
8B28 (upline)13560.046
9B28 (downline)13560.046
10S116 (upline)13.25910.075
11S116 (downline)13.25910.075
12279 (upline)13.5420.035
13279 (downline)13.5420.035
1431 (downline)15900.074
Total20612151
Table 3. Bus departure and I j calculation in Unit f.
jRouteRunning Time (h)Bus Departure FrequencyIj
0B12 (upline)151430.088
1B12 (downline)151430.088
2B67 (upline)14.51390.086
3B67 (downline)14.51390.086
431 (upline)15900.056
531 (downline)15900.056
6S116 (upline)13.25910.056
7S116 (downline)13.25910.056
8B27 (upline)13.5560.035
9183 (upline)14800.049
10183 (downline)14800.049
11B2 (upline)151710.106
12B2 (downline)151710.106
13259 (downline)13360.022
14B28 (downline)13560.035
15279 (upline)13.5420.026
Total226.516181
Table 4. Computing result of reliability.
Threshold of Walking DistanceThreshold of Bus Travel TimeReliability of Public Transportation R
Unit eUnit f
900 m1.60.4160.574
Table 5. Calculation results by LOS analysis method.
The Proportion of the Road Mileage of Different LOS in the Unit
Level 1Level 2Level 3Level 4
Unit e0.740.150.080.03
Unit f0.810.140.050.00
Table 6. Principles of bus routes adjustment.
1. Keep the number of bus routes in the unit and only select one bus route to adjust.
2. Keep two endpoints location of the bus route and only adjust the bus route alignment in the unit.
3. Keep the total length of the adjusted line close to the original line and retain original bus stops as much as possible.
4. Keep the number of stops in the area and ensure that the distance between the stops is close to the original line.
Table 7. Adjustment of bus No. 1.
RoutesBus StopsNumber of StopsLine Length (km)Average Spacing (m)Service Area
(km2)
Before adjustment259 (upline)3-5-8-15-1751.69363.31.26
259 (downline)16-14-7-6-251.69419.21.29
After adjustment259 (upline)3-8-39-15-1751.68363.31.39
259 (downline)16-40-14-41-251.68419.21.41
Disclaimer/Publisher’s Note: The statements, opinions and data contained in all publications are solely those of the individual author(s) and contributor(s) and not of MDPI and/or the editor(s). MDPI and/or the editor(s) disclaim responsibility for any injury to people or property resulting from any ideas, methods, instructions or products referred to in the content.