Article

Spatial and Temporal Variation in Soil Salinity and Correlation with Groundwater Depth in the Karamay Irrigation District of China

1
Xinjiang Institute of Ecology and Geography Chinese Academy of Sciences, Urumqi 830011, China
2
University of Chinese Academy of Sciences, Beijing 100049, China
3
Karamay Lucheng Agricultural Development Co., Ltd., Karamay 834000, China
*
Author to whom correspondence should be addressed.
Sustainability 2023, 15(22), 15680; https://doi.org/10.3390/su152215680
Submission received: 25 August 2023 / Revised: 9 October 2023 / Accepted: 13 October 2023 / Published: 7 November 2023
(This article belongs to the Special Issue Soil-Water-Plants and Environmental Nexus)

Abstract

:
The secondary salinization of irrigated areas poses a direct threat to both the sustainable development of oasis agriculture and ecological stability in arid regions. In this study, we conducted an experiment to examine alterations in groundwater levels and soil salinity within the plow layer, as well as their combined impact, in arid regions following extended reclamation in standard diversion irrigation areas. For this experiment, the Karamay irrigation district was selected. Four different years, namely, 1996, 2006, 2016, and 2021, were selected for soil sampling and groundwater monitoring data. Descriptive statistics, along with the use of GIS technology and Pearson’s correlation, were employed to analyze the data in order to discern the patterns of soil salinity and groundwater depth within the plow layer. Additionally, this approach helped establish the correlation between these factors over the last 25 years of reclamation in the Karamay irrigation district. The results showed that, (1) due to an increase in the reclamation duration, the groundwater depth in the irrigation area decreased year by year, and the salinity of the arable soil showed an overall decreasing trend, but it increased in local low-lying areas; (2) the influence of the groundwater depth on the salinity of the arable soil had a threshold value. It decreased from 3.1 m in 2016 to 2.4 m in 2021, and a significant negative correlation was observed between salinity and the depth of groundwater. When the groundwater depth was shallower than the threshold value, the soil salinity in the plow layer was negatively correlated with the groundwater depth. In the arid irrigation zone, inadequate drainage facilities resulted in a significant rise in the groundwater table due to the excessive amount of irrigation water. This created secondary salinization of the arable soil. It is thus concluded that implementing adequate drainage systems in arid irrigation regions will help prevent secondary salinization and promote the sustainable development of agriculture in these areas.

1. Introduction

Soil salinization is one of the most serious problems in arid and semi-arid zones. It has seriously threatened local agricultural production and oasis ecological stability [1,2]. According to the Food and Agriculture Organization of the United Nations (FAO), about 833 million hectares of land are under saline conditions, covering 8.7% of the entire Earth’s land area. Most saline soils are distributed in arid or semi-arid zones in Asia, Africa, and Latin America [3]. In China, Xinjiang has the largest saline soil resources, as almost one-third of the land in Xinjiang, i.e., 1.62 × 10⁶ hm2, is saline [4]. Soil salinization has led to problems such as reduced soil fertility and crop yield and the deterioration of the ecological environment [5]. It is statistically estimated that crop yields are reduced by 10–15% annually due to the salinization of arable land [6].
Secondary soil salinization is caused by various human factors or changes in natural conditions. There are many factors causing soil salinization, such as groundwater depth, irrigation volume, rainfall, soil lithology, and vegetation coverage [7]. Poor irrigation systems, the rise in phreatic water depth caused by unsound water diversion, and poor drainage projects are the main reasons for the secondary salinization of soil [8]. The comprehensive effect of these factors, which intersect, restrict, and superimpose each other, is bound to continuously change the process and condition of water and salt circulation in irrigation areas [9]. During water diversion and irrigation, the groundwater level is raised and exceeds the threshold depth, so phreatic water continuously evaporates, and a large amount of salt accumulates on the surface. Therefore, controlling the phreatic water levels in irrigation areas is an effective measure to prevent secondary soil salinization. In recent years, many researchers have conducted extensive studies on soil water and salt transport from the perspective of improving saline–alkali soil and developing oasis ecological agriculture, which has laid a certain theoretical foundation and practical guidance for the improvement in salinized land and the development of agricultural production in Xinjiang [10]. However, most of the research work only focused on the soil salt content and groundwater depth, but the correlation between these two factors has been less investigated. In order to realize the sustainable development of agricultural production, it is essential to study the response of soil salinity to the change in groundwater depth and determine the appropriate threshold of groundwater depth.
Building on previous research, the aim of this study was to examine the evolving traits of topsoil salinity and the depth of phreatic water over a span of 25 years of reclamation. Additionally, it sought to analyze how alterations in the phreatic water depth affect topsoil salinity. This paper examines the patterns of soil salinization following extended reclamation in an irrigation area situated downstream in an arid region. Its purpose is to furnish a scientific foundation for the sustainable advancement of agriculture in such arid regions.

2. Materials and Methods

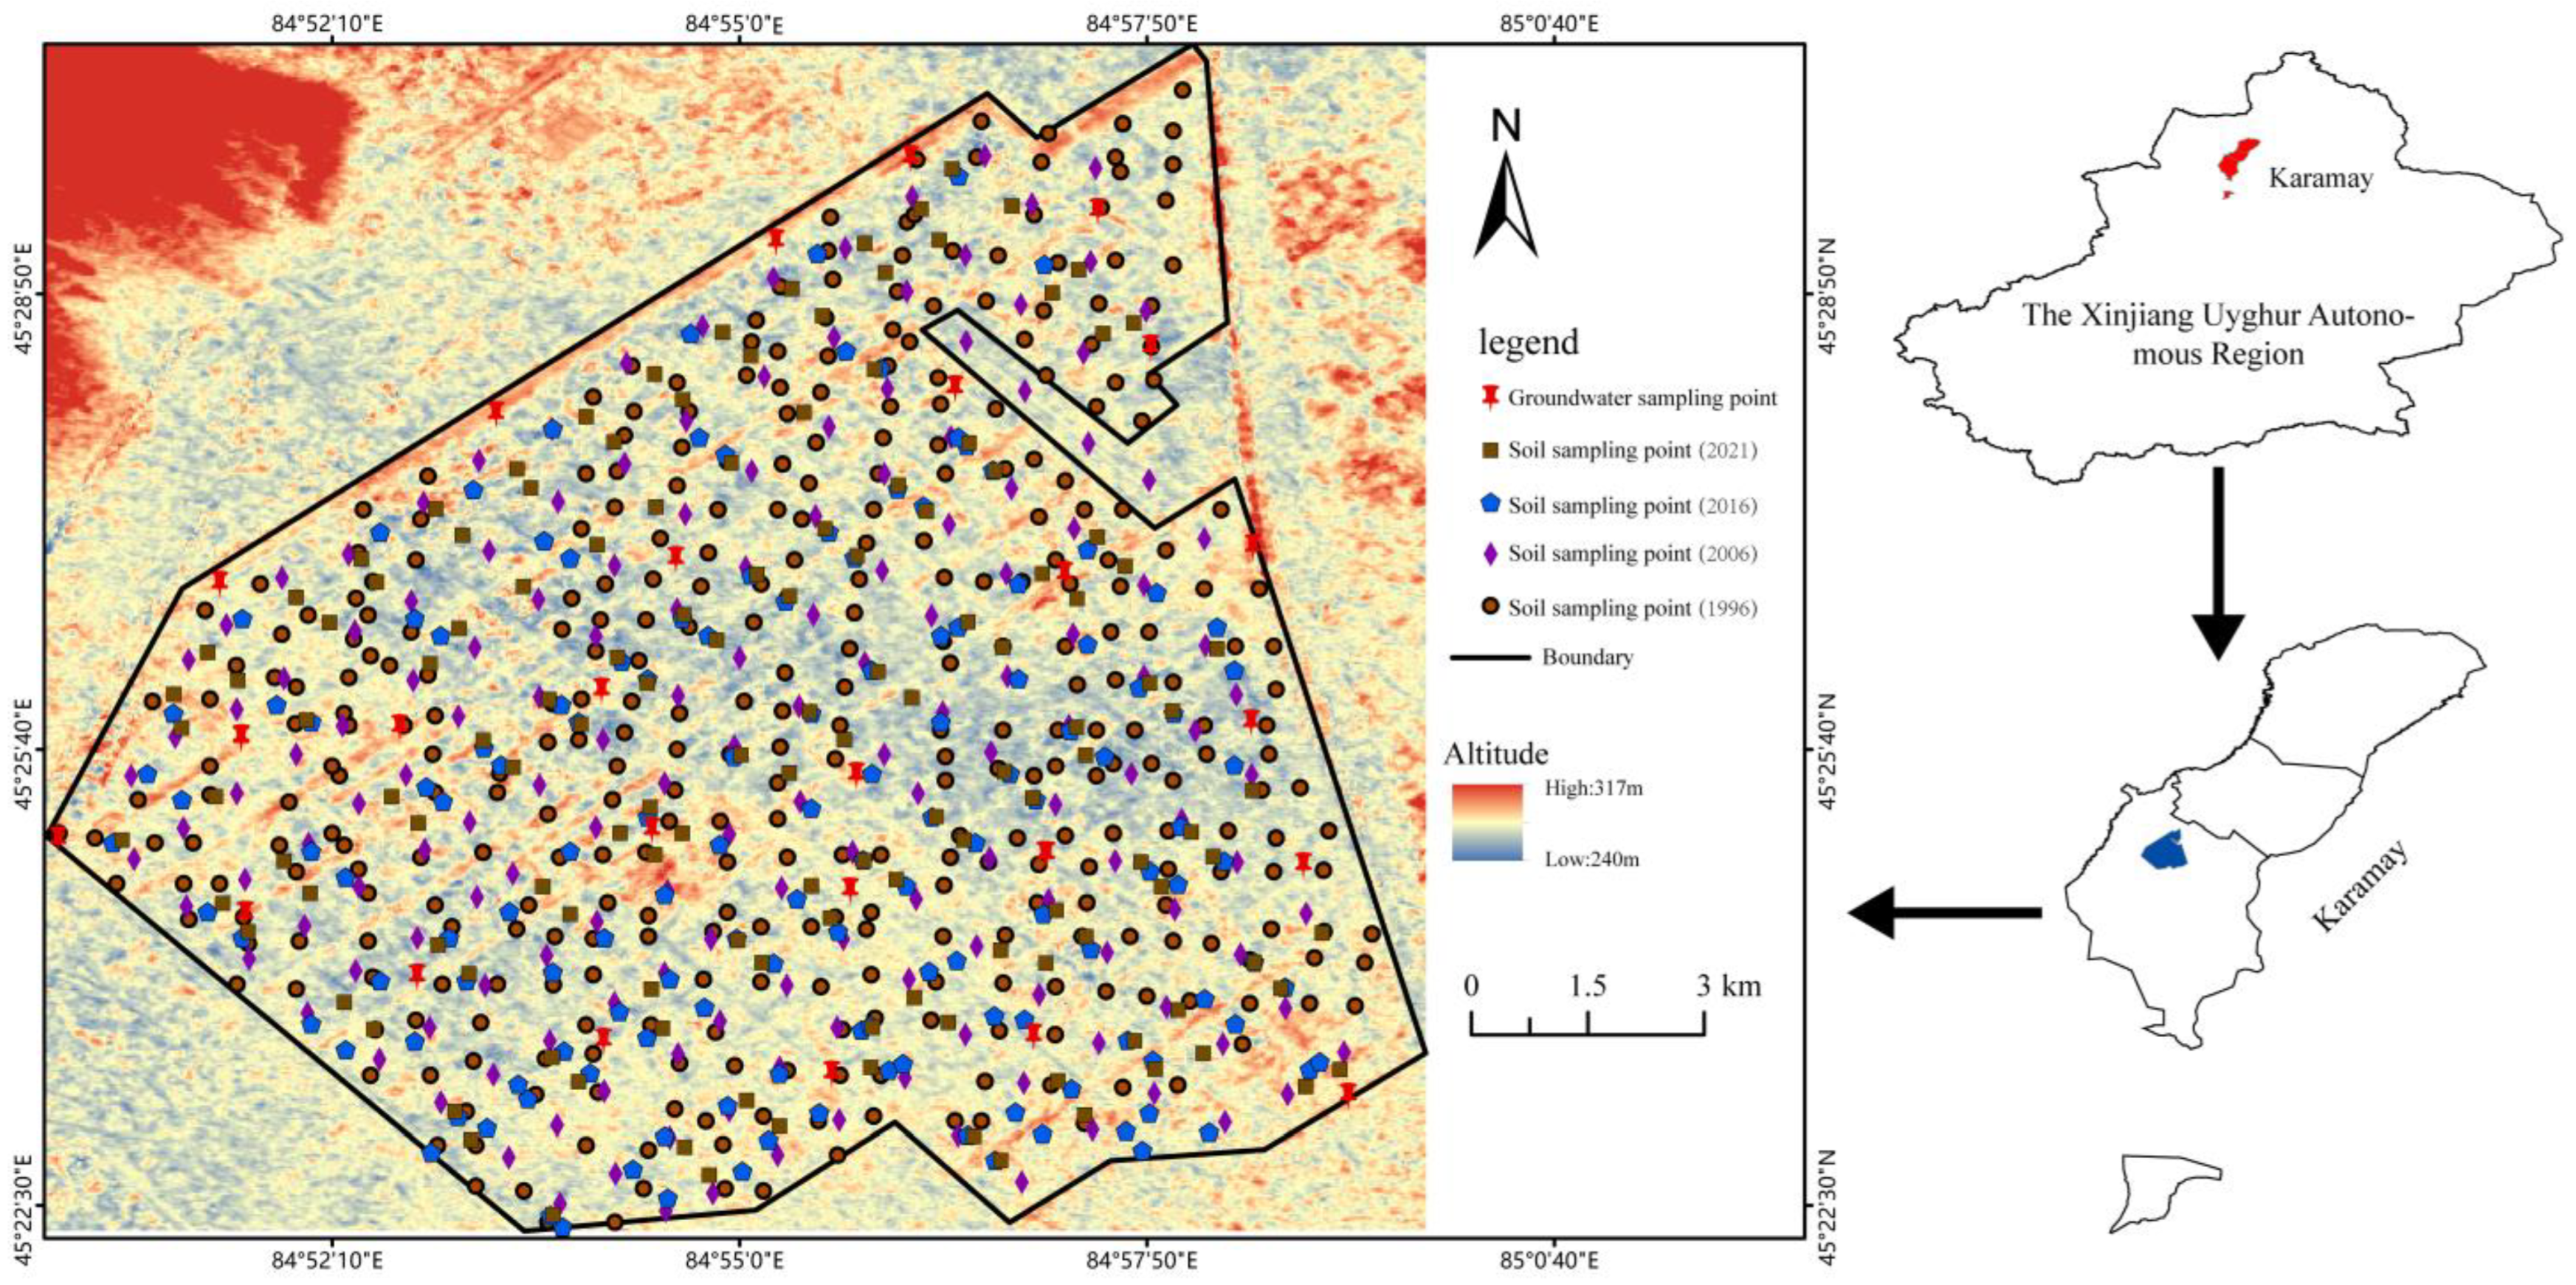
2.1. Regional Overview

The Karamay irrigation district is located on the northwestern edge of the Junggar Basin on the alluvial plains of the ancient Manas Lake. It is bordered by the Gurbantunggut desert in the east and the desert plain in the north, as shown in Figure 1. The overall terrain is slightly lower in the middle and slightly higher in the surrounding shallow basin. The climate of Karamay is a typical temperate continental desert climate, with cold winters and hot summers. It is mostly arid, with little rain, strong evaporation, an average annual temperature of 8 °C, an average annual precipitation of 108.9 mm, an average annual evaporation of up to 3008.9 mm, and a frost-free period of 180–220 d [10]. The irrigation area is characterized by sparse vegetation growth, and pike, salt spice wood, large-fruited white thorns, tamarisks, and other arid- and salinity-tolerant plants are the predominant species [11]. The main crops include cotton, corn, pumpkin, alfalfa, sunflower, and gourd [12].
The Karamay Irrigation district has been reclaimed since 1996. At present, the cultivated area is 10,043 hectares. Since 2006, water-saving irrigation has been increasingly used on a large scale. In 2006, the area with water-saving irrigation accounted for only one-fourth of the irrigation area. By 2011, however, all irrigation areas had adopted water-saving irrigation. Since 2016, a large area of dead seedlings and non-emerged areas have appeared in the south of the irrigation area in Karamay. A large number of white salt blocks have appeared on the surfaces of these areas, which has seriously affected farmers’’ enthusiasm for planting in this region.

2.2. Data Sources

2.2.1. Data Collection and Soil Sampling

The data used for this study included soil salinity data from four different periods, i.e., 1996, 2006, 2016, and 2021. The Karamay Agricultural District Management Committee provided data on soil salinity for the years 1996 and 2006, while the soil salinity data for the years 2016 and 2021 were measured with the help of field sampling before planting crops. The whole irrigation district contains almost 100 acres and has many individual fields. Different points were randomly selected in these fields for soil sampling. At every selected point, five soil samples were collected with the help of a soil auger (5 cm in diameter) within a radius of 50 m, and then all five samples were mixed to make one sample for this selected point [13].

2.2.2. Analysis of Soil Samples

The total salts in these soil samples were determined by the gravimetric method. Each soil sample involved the extraction of 10 g of soil with 100 mL, with a detection limit set at 10 mg/kg. For the same sample, three independent determinations were made, and the average value of these three determination results was taken as the final value of the total salt for this soil sample.

2.3. Data Processing

Descriptive statistics of soil salinity samples for each year were calculated with SPP26.0. A normal distribution test was carried out with JMP pro16. Data that failed to follow a normal distribution with JMP pro16 were subjected to logarithmic transformation or Box–Cox transformation to conform to a normal distribution. After that, GS + 9.0 was used to carry out the calculation of the semi-variance function and determine the theoretical model. Based on the semi-variance model, the spatial distribution map of the soil salinity in each period and the spatial distribution map of soil depth were plotted by using origin pro 2021. Furthermore, based on the semi-variance model, ArcGIS10.4 was used to perform ordinary kriging interpolation and indicate the kriging interpolation results on the map of soil salinity and the spatial distribution in each period, as well as the spatial distribution of soil depth. The temporal variation in soil depth and the analysis of its correlation with total soil salinity in the plow layer were also plotted using Origin2021.

3. Results

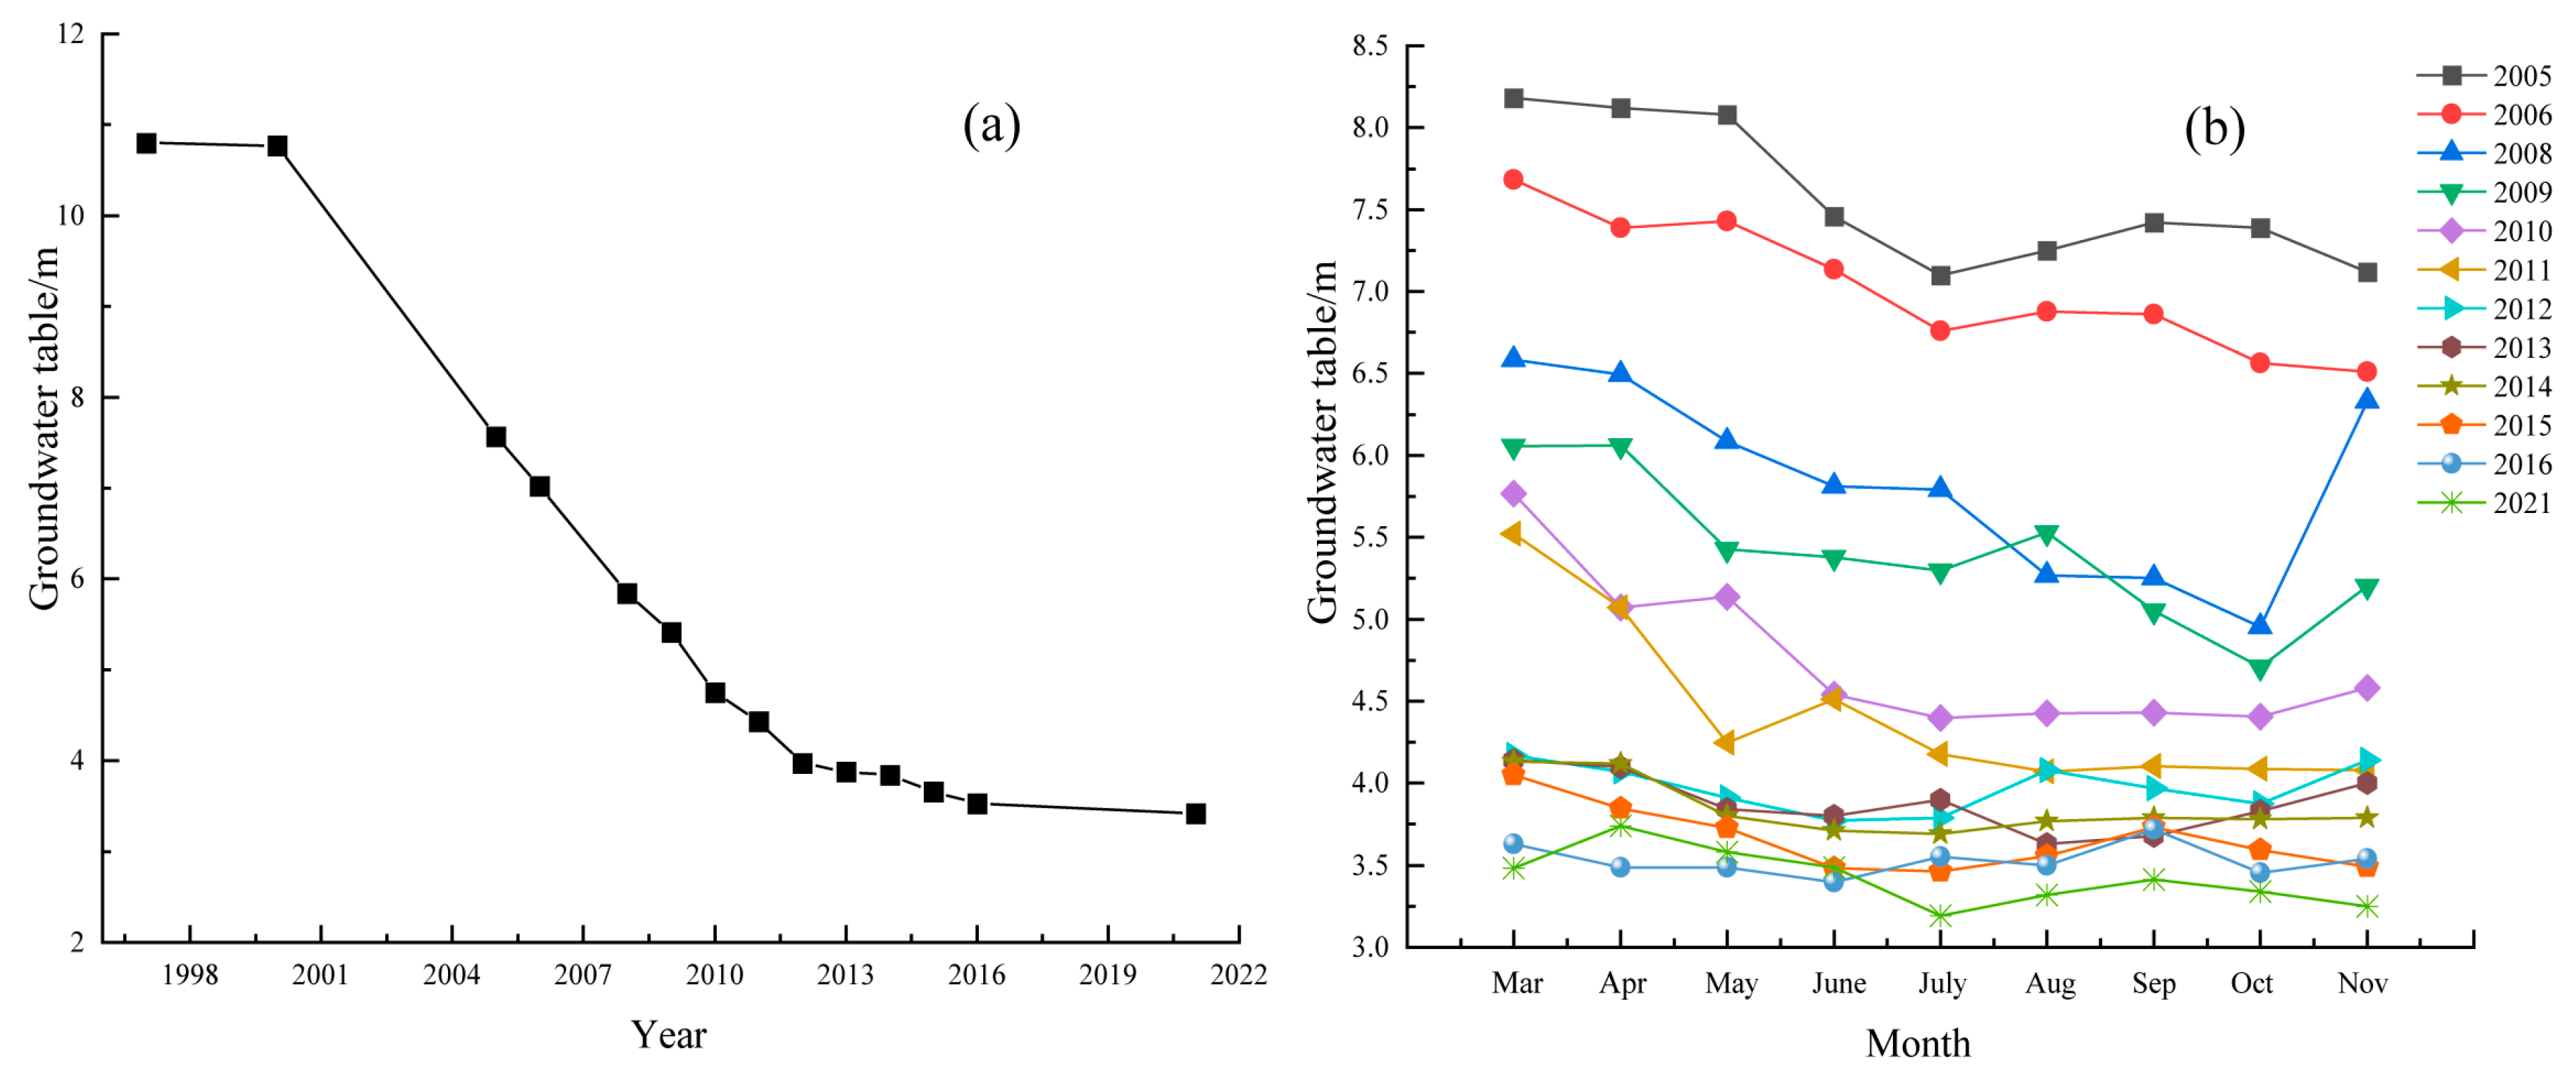
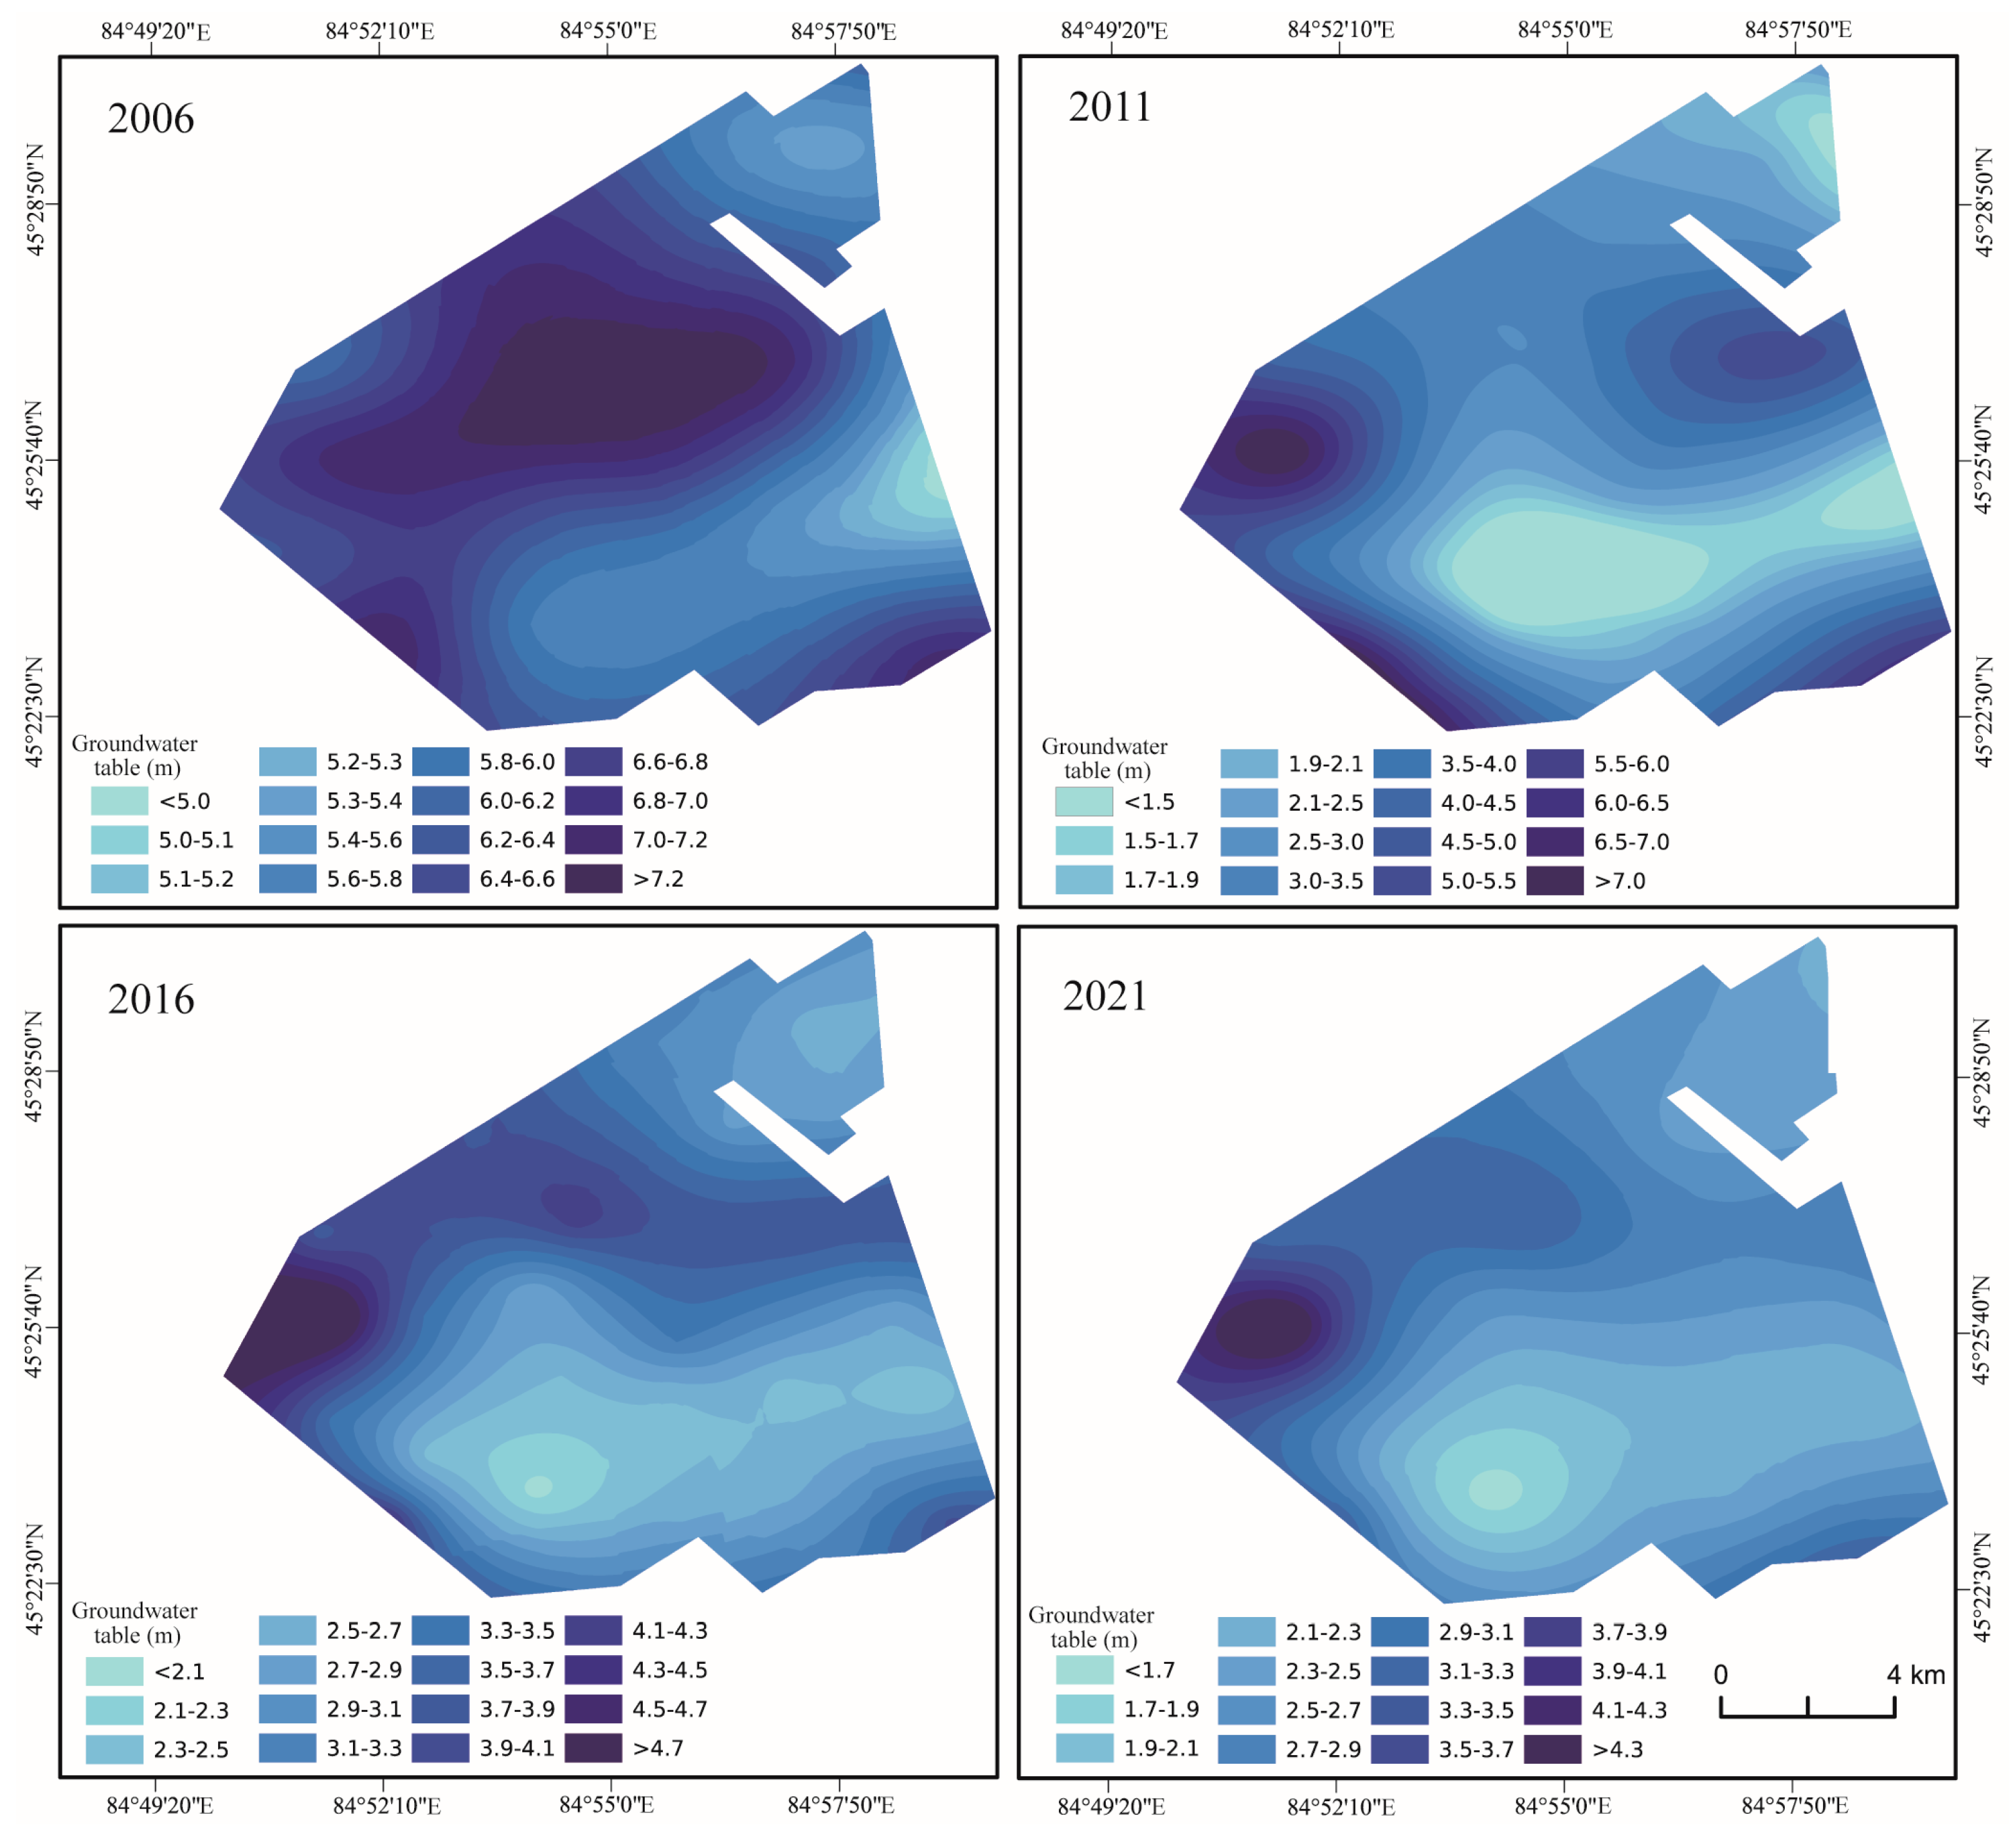
3.1. Characteristics of and Spatiotemporal Variation in Groundwater Depth

As shown in Table 1, the groundwater depth in different irrigation areas has changed drastically; areas with a depth shallower than 3 m are increasing, whereas areas with a depth of more than 4 m are continuously decreasing. In 2006, the depth of groundwater irrigation was more than 5 m in many areas, but in 2011, the depth was shallower than 5 m in many irrigation areas, as shown in Table 1. Only 10% of the area exceeded the limit of 5 m within the total area. Five years after further reclamation, in 2016, less than 5% of the area had a groundwater depth of more than 4 m. Afterward, the upward trend of the groundwater level in the irrigation areas slowed down, and the results in 2021 showed little change as compared to 2016.
As shown in Figure 2, the average depth of the groundwater table was more than 10 m before the large-scale reclamation of the irrigation area. Since 1996, when the large-scale reclamation of the irrigation area began, the groundwater table has increased significantly, and the groundwater depth decreased from 10.77 m in 1997 to 4.29 m in 2011. The irrigation water volume had dropped significantly in 2012, before the installation of water-saving irrigation systems. Although the groundwater table continued to maintain an upward trend, the groundwater depth decreased from 4.29 m to 3.43 m. After the installation of water-saving irrigation systems, a decrease of 0.86 m occurred in the ten years from 2012 to 2021. At the same time, the inter-monthly variation in the groundwater depth in the irrigation area over the past 16 years can be clearly seen, as shown in Figure 2. The groundwater table increased in the irrigation area mainly in the crop-planting season, from May to October. This is because of the low-lying and closed terrain of the irrigation area. When crops are planted, water cannot be discharged, and it accumulates in the irrigation area, which makes the groundwater level of the irrigation area continuously elevated.
The groundwater depth data for 2006, 2011, 2016, and 2021 were interpolated by kriging, and the results are shown in Figure 3. As a whole, the groundwater depths of the irrigation area in different years were distributed in strips, with a rising trend in general. Locally, the groundwater depth in the south is obviously shallower than in other areas, and the depth gradually increases from south to north. In 2006, the groundwater depth was generally deep; only the southeast and northeast regions had shallow groundwater depths. The groundwater depth in the middle of the irrigation area was shallow, forming a spatial distribution pattern of shallow in the middle and deep in the area around it. Comparing 2011 with 2006, the spatial distribution of the phreatic water depth changed significantly. On the basis of the overall rise in the groundwater table in the irrigation area, the low point of the groundwater depth originally located in the southeast of the irrigation area moved to the southwest, and the high point of the groundwater depth moved from the middle to the northwest. In 2021, the distribution of the groundwater depth changed little; the groundwater accumulation peak was still located in the southwest of the irrigation area, and the area showed a trend of first decreasing and then increasing.

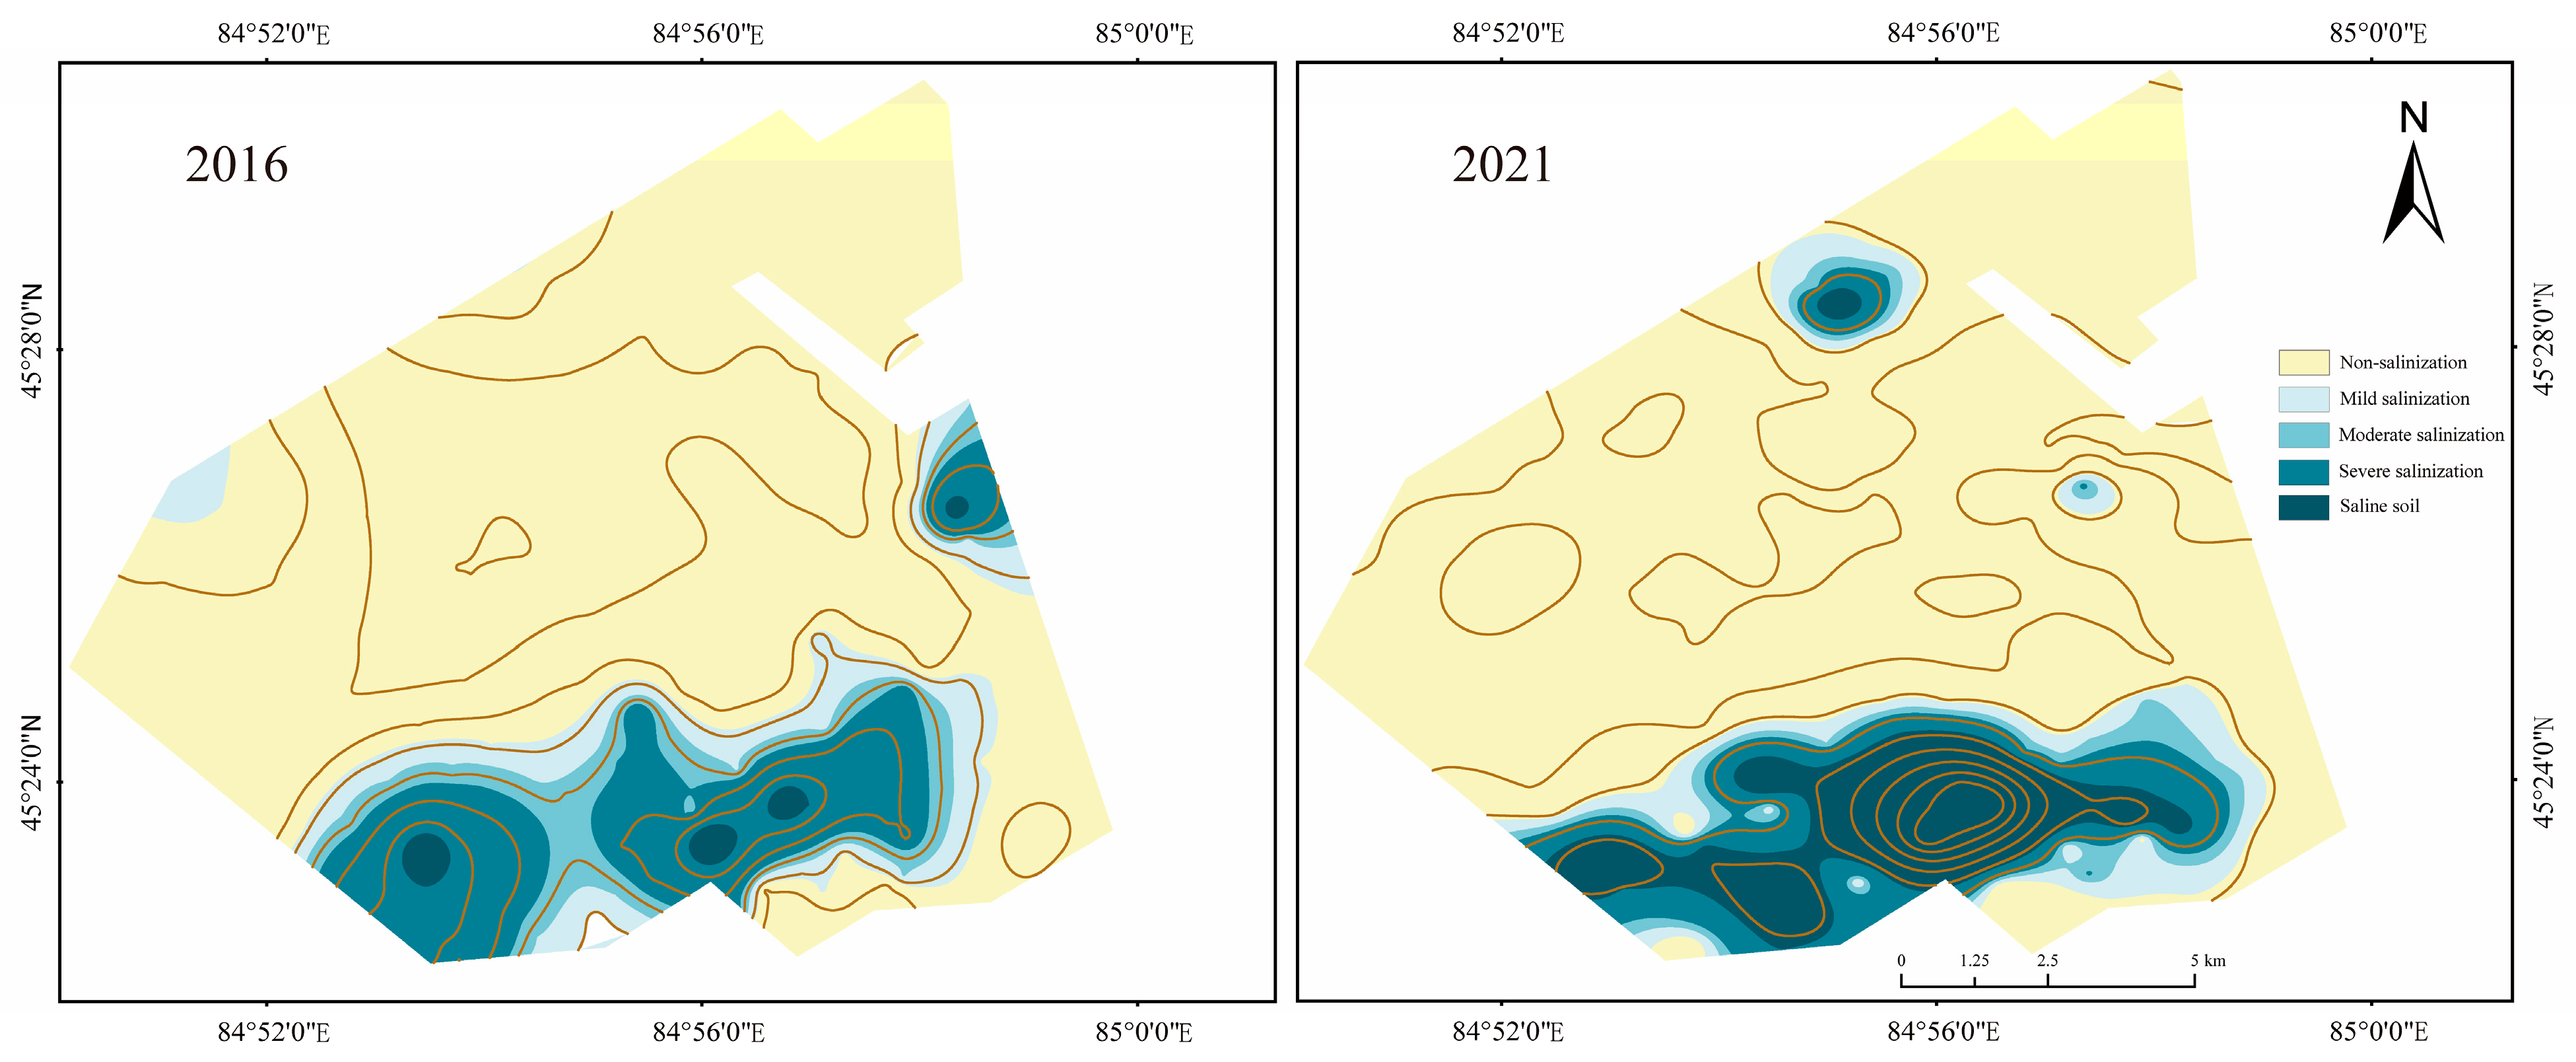
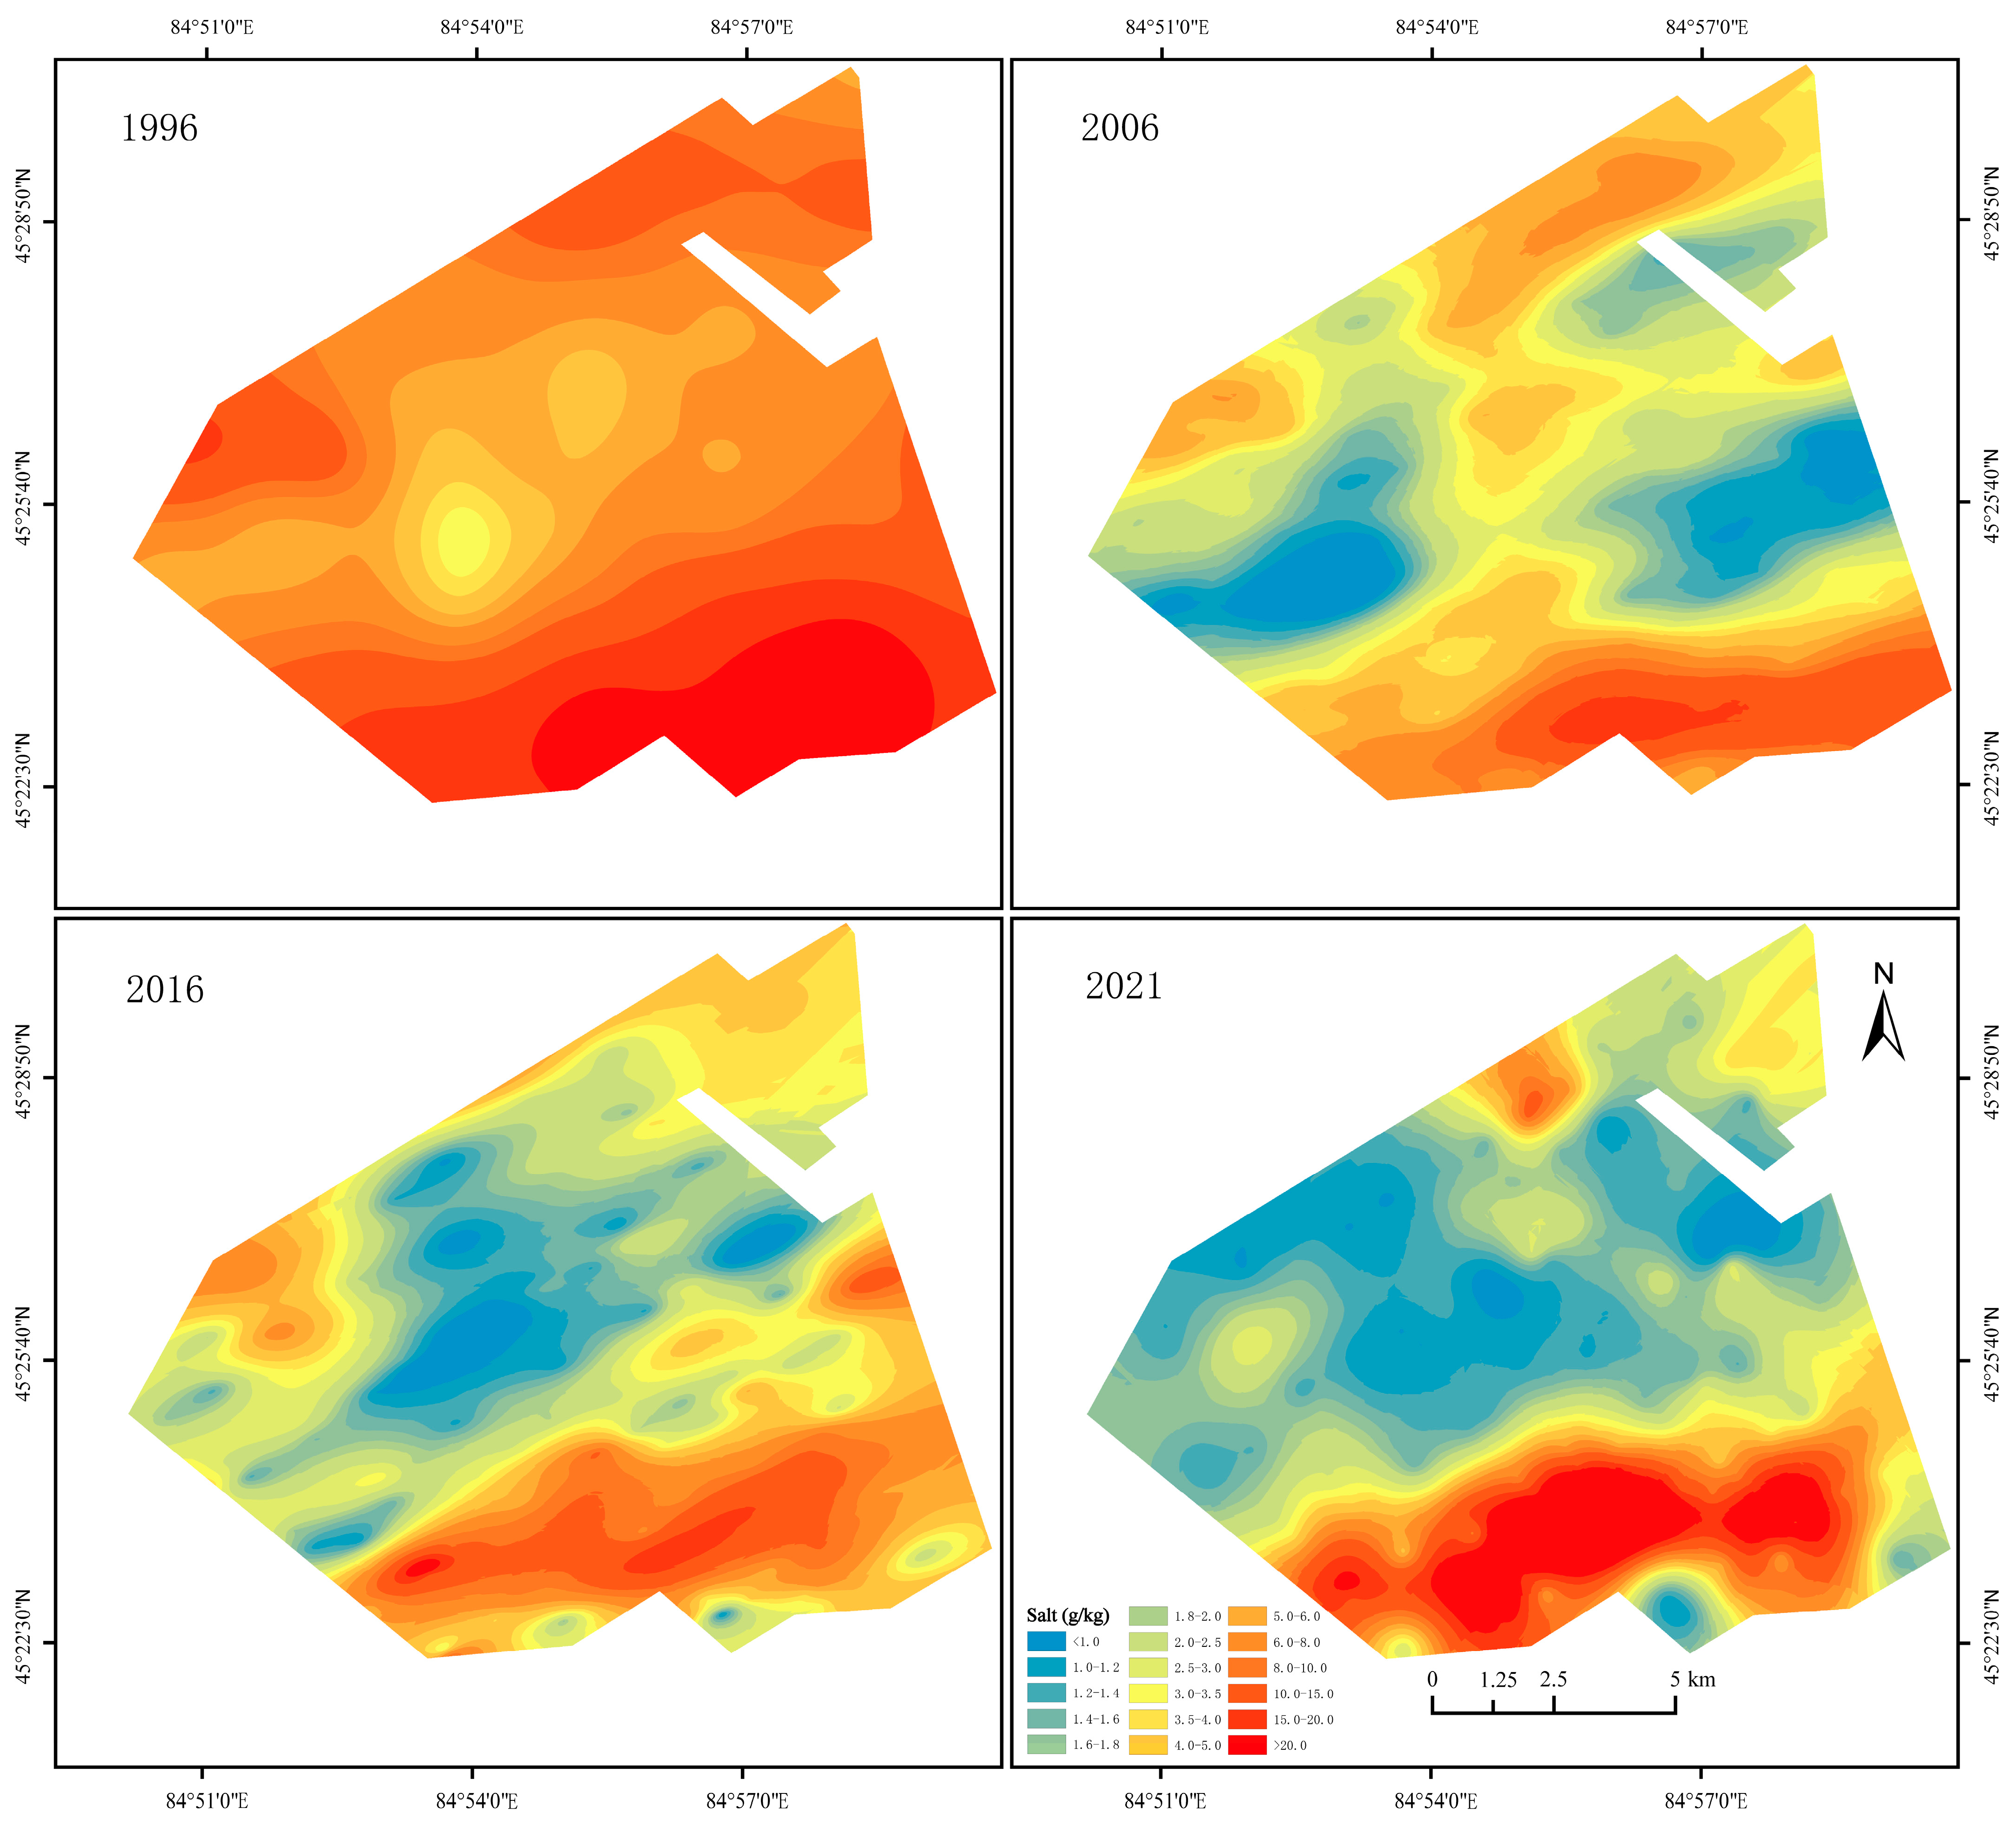
3.2. Salinization Status and Spatiotemporal Variation in Arable Soil

Following the classification criteria outlined in the specification for the geochemical evaluation of soil quality in Xinjiang [14], the soil salinity in the arable layer of the irrigation area was categorized into five types, depending on the degree of salinization, namely, non-salinized soil (<5.54 g/kg), mildly salinized soil (5.54~7.27 g/kg), moderately salinized soil (7.27~8.66 g/kg), severely salinized soil (8.66~13.45 g/kg), and saline soil (>13.45 g/kg).
As shown in Table 2, there was a substantial range of variation in soil salinity across the sampling results from the four phases of the irrigation area. Due to the increase in reclamation years, there was a consistent decrease in the mean value of soil salinity from one period to the next. Although there was a notable increase in its coefficient of variation, suggesting the heightened spatial heterogeneity of soil salinity in the plow layer of the irrigation area, the trends of changes in soil salinity varied across different areas.
The mean value and the coefficient of variation can briefly describe the overall situation of soil salinity changes in the irrigation area. However, the effect is very disappointing for analyzing the characteristics of local soil salinity changes in the irrigation area. In order to show the spatial distribution of soil salinity in the arable layer more intuitively and compare the differences in the soil sampling results between the four phases, the soil sample results for the four phases in the four years, 1996, 2006, 2016, and 2021, based on the theoretical model of the semi-variance function and relevant parameters are shown in Figure 4. Based on the theoretical semi-variance function model and related parameters, the soil samples of four years, 1996, 2006, 2016, and 2021, were subjected to ordinary kriging interpolation. The color-coded results for the four periods show the spatial distribution of salinity in the tillage layer of soil in the irrigation area in Figure 4.
In Figure 4, except for the existence of patches of salinity in some areas, the kriging interpolation results of soil salinity in the four phases of the irrigation area were higher in the south as compared to the north. While the trend was the same as that of the groundwater depth in the irrigation area, the soil salinity was distributed in strips and gradually increased from south to north. Therefore, at the same time, there was a significant accumulation of salinity near the desert edge in the southern part of the irrigation area. From the perspective of the time series, the salt content in the topsoil in the total irrigation area decreased significantly in the first ten years of crop planting in the irrigation area from 1996 to 2006. In the second decade of reclamation, from 2006 to 2016, the soil salinity distribution in the southern part of the study area did not change significantly, but salt accumulation existed only in some small areas. Furthermore, the soil salinity condition in the northern area was further alleviated, but the area of salt blocks, originally existing in the north and east, was significantly reduced. Comparing the interpolation results for 2021 and 2016, most of the northern part of the irrigation area still maintained soil salinity. In 2021, only one serious salt block area appeared in the northeast, and the soil salinity in the southern part of the irrigation area showed the opposite trend as compared to the previous two decades. Therefore, the area near the edge of the oasis in the southern part of the irrigation area experienced an increase in the degree of salinization as well as an increase in the saline area.
Table 3 shows the area proportions of different types of soil salinization in different years in the irrigation area. In 1996, at the beginning of reclamation in the irrigation area, there were no non-saline, mildly saline, or moderately saline soils distributed in the irrigation area, but soil with above moderate salinity accounted for 79% of this irrigation region. However, in 2006, the area with above moderate salinity significantly decreased by almost 16.8%, and the saline soil area almost disappeared, but the area of non-saline and mildly saline soil increased by up to 83%. After ten years of continuous crop planting, the remaining soil salinization areas had not changed significantly, except that some areas with mild salinity changed to non-saline. After 25 years of reclamation, the area of non-saline soil increased significantly by up to 64.25%, but the area of mild and moderate soil salinity decreased significantly. Therefore, the saline soil area again increased by up to 7.27%, showing a more obvious situation of “global reduction, local aggravation”.

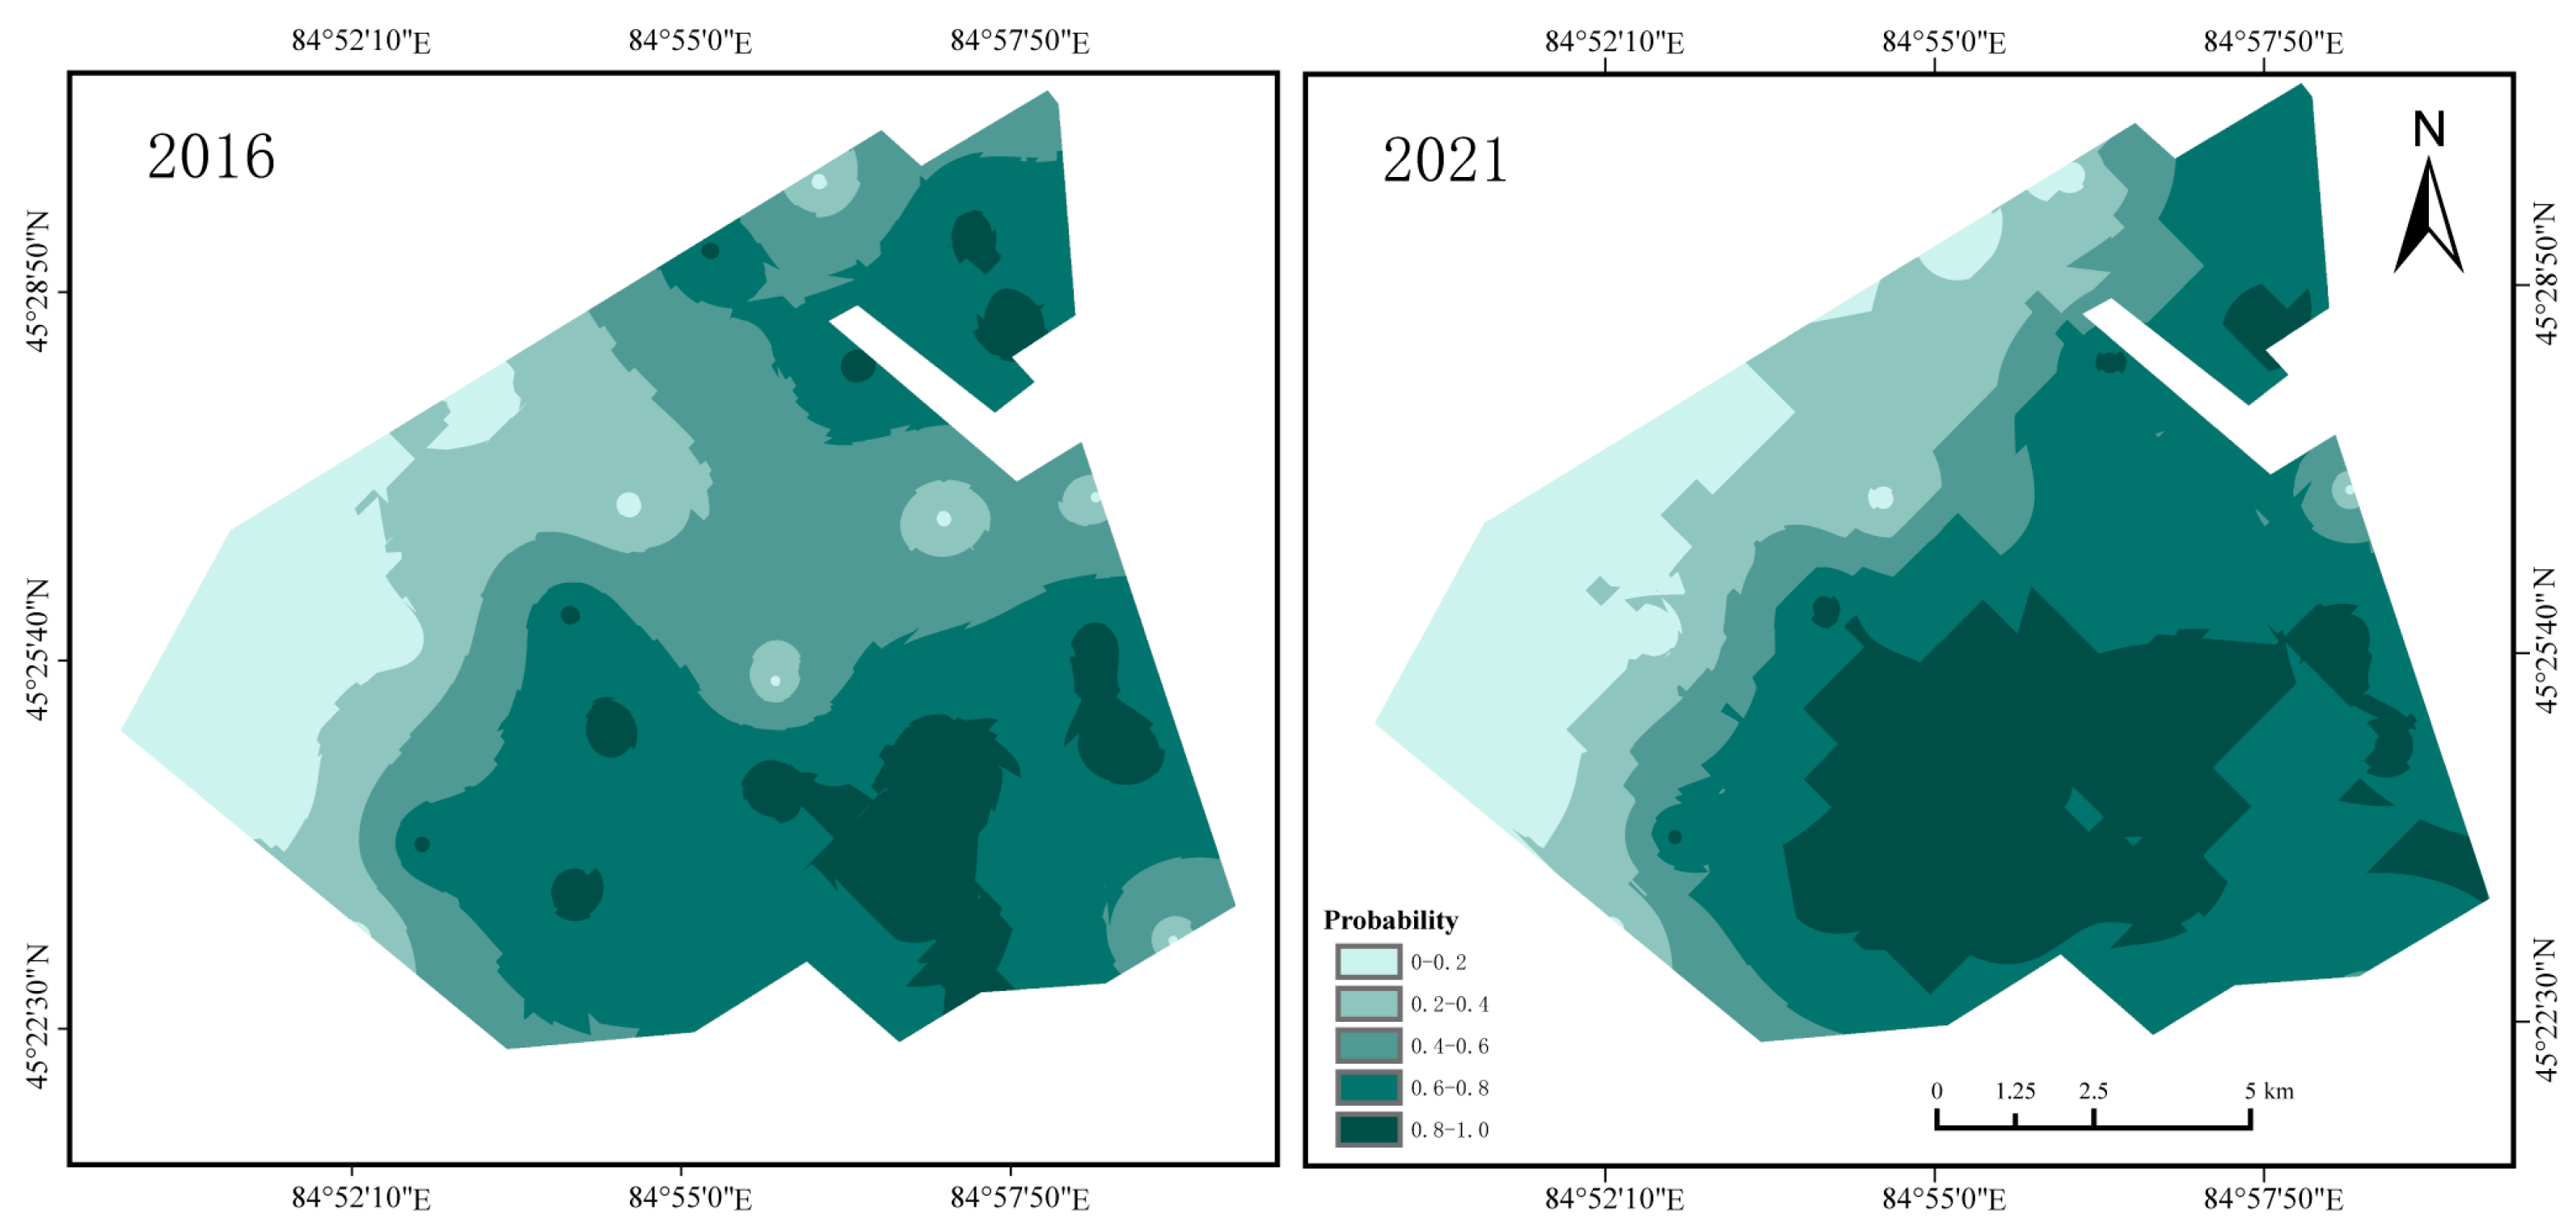
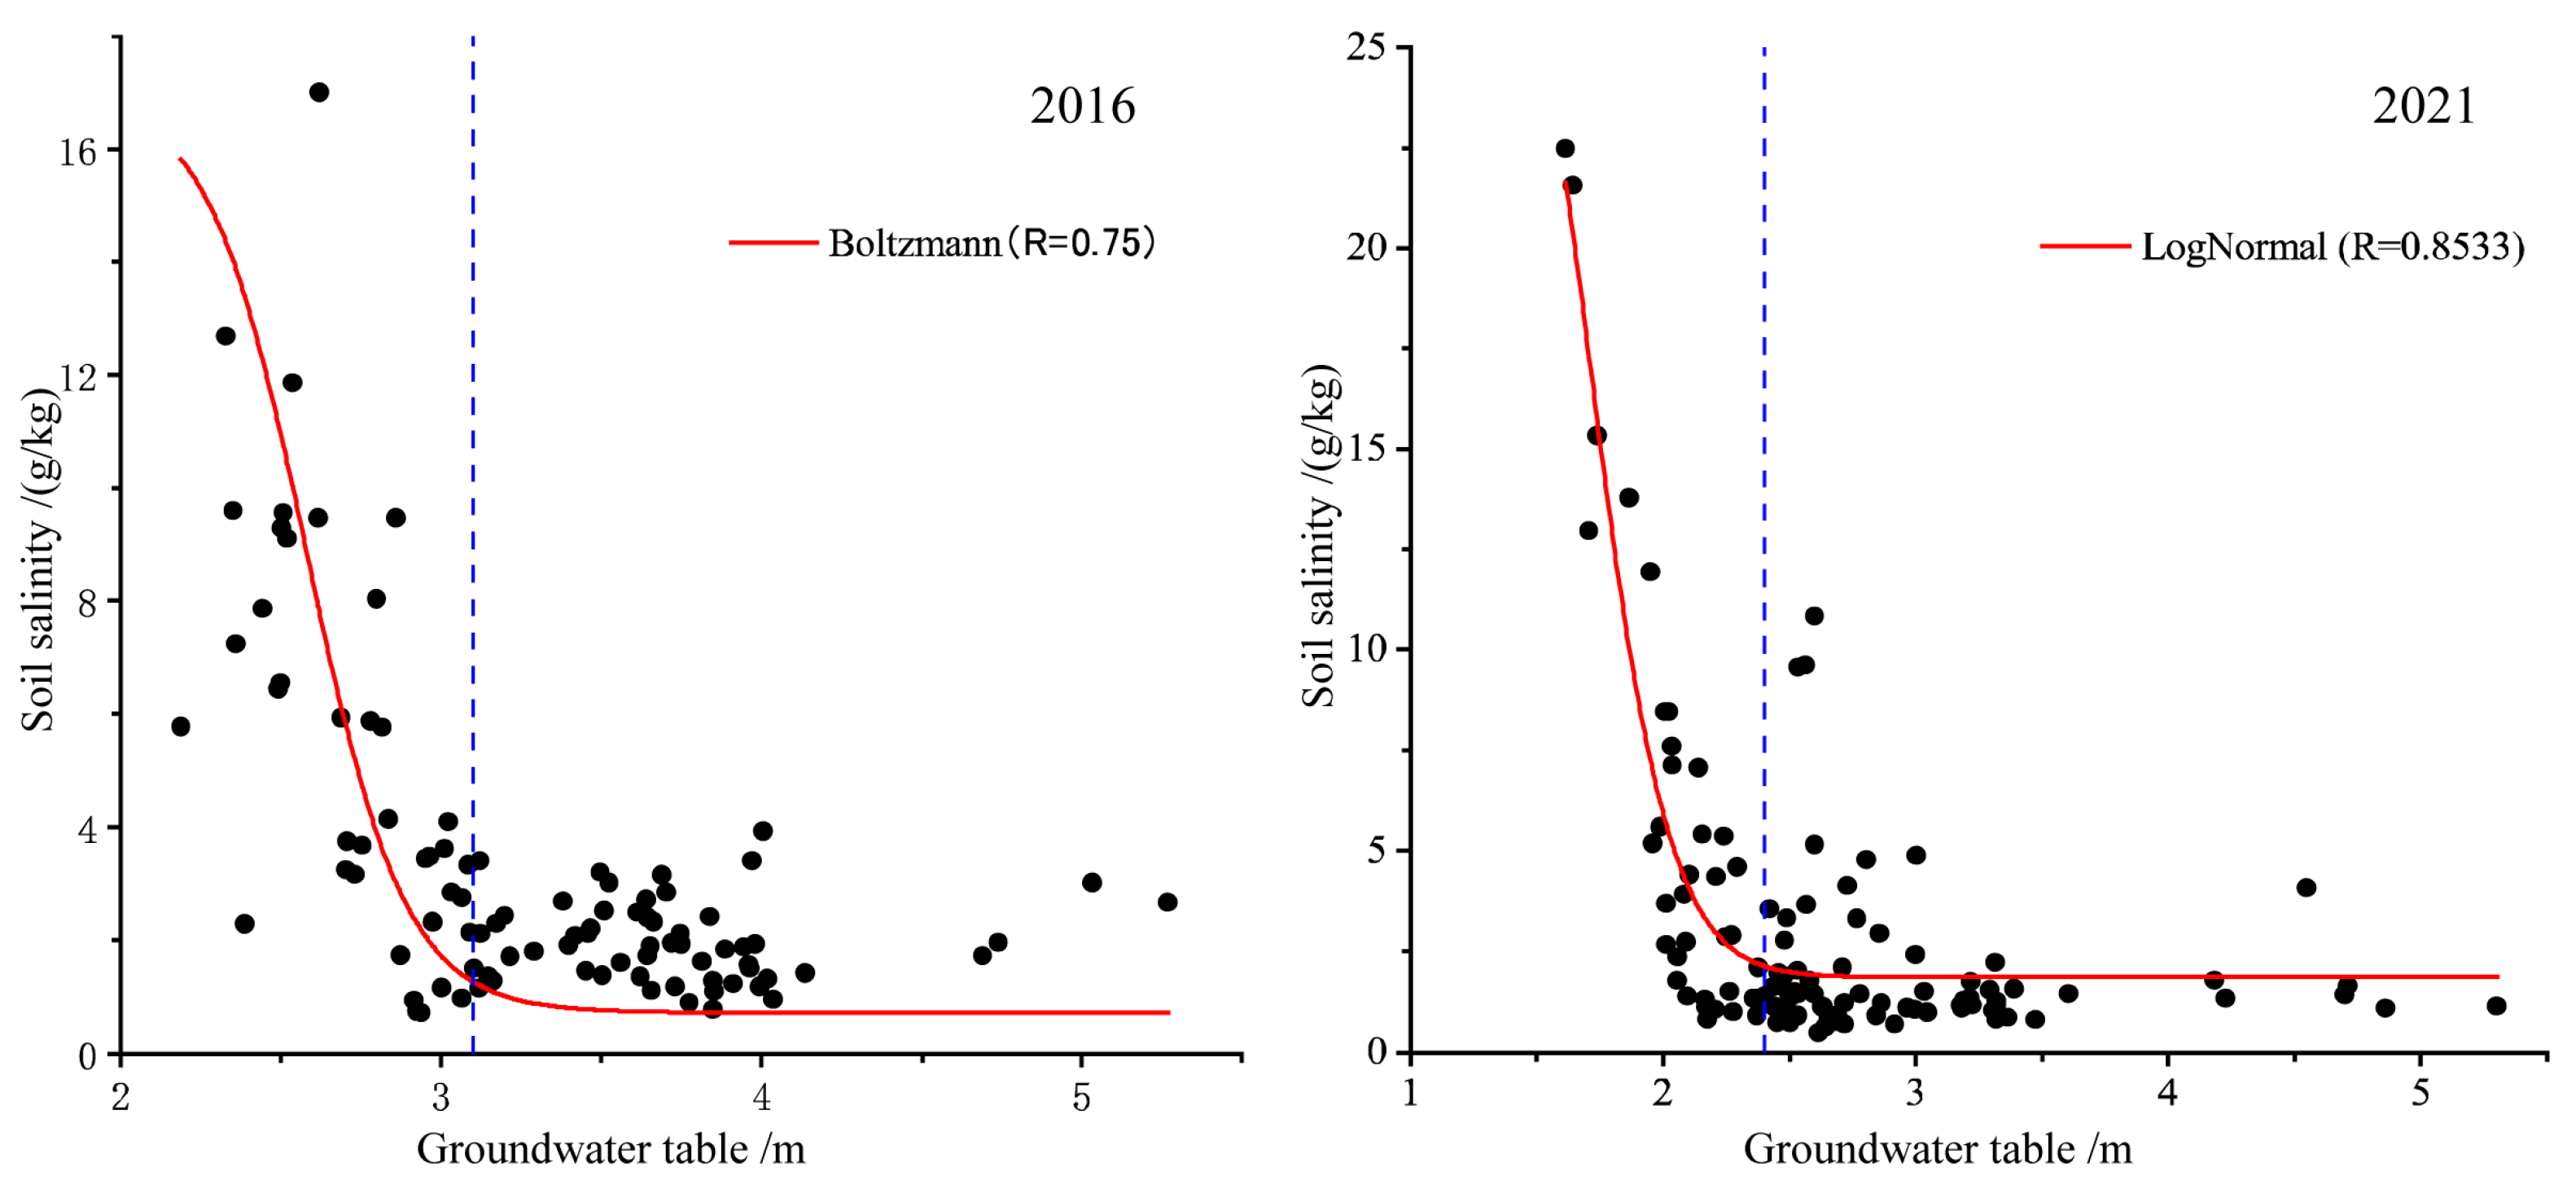
3.3. Correlation between Soil Salinity and Groundwater Depth

The soil salinity and groundwater depth of the irrigation area in 2016 and 2021 were fitted by using curve-fitting techniques. By comparing the goodness of fit (R), it was determined that the fitting model of groundwater depth and soil salinity in 2016 with the best fitting effect was the Boltzmann model, and the R-value was 0.75. In contrast, for 2021, the R-value of the log-normal model is 0.85, and its fitting effect is the best. As shown in Figure 5, the inflection point of the fitted curve for 2016 is a depth of 3.1 m, indicating that when the depth of groundwater is less than 3.1 m, the soil salinity decreases rapidly with the increase in the depth of groundwater. When it exceeds 3.1 m, the relationship between the two tends to be gentle. The inflection point of the fitted curve for 2021 is 2.4 m. When the groundwater depth is less than 2.4 m, the soil salinity decreases sharply with the increase in groundwater depth. When it is more than 2.4 m, the change in soil salinity with the increase in groundwater depth is not obvious. In comparison, the inflection point of the fitted curve of the correlation between soil salinity and groundwater depth in the irrigation area decreased by 0.7 m in the five years from 2016 to 2021. This indicates that the critical depth of the groundwater table in 2021 was shallow, and the risk of secondary salinization in the entire irrigation area was further increased in the five years.
In order to further verify the correlation between soil salinity in the plow layer and the critical depth of groundwater, the groundwater depths in 2016 and 2021 were interpolated by using the kriging method, taking 3.1 m and 2.4 m as the threshold values, to obtain spatial distribution maps of the probability of submerged depths in the irrigation area in 2016 and 2021. The results are shown in Figure 6 and Figure 7, It was compared to the distribution maps of different soil salinization types in the irrigation area in 2016 and 2021. In the spatial distribution map of the depth probability in 2016, high-probability (above 0.6) areas with a depth less than the critical depth (3.1 m) are mainly concentrated in the middle and south of the irrigation area. The low-probability areas are mainly concentrated in the north. In the distribution map of different soil salinization types in 2016, areas with more than moderate salinization are also located in the middle and south of the irrigation area, which has a closer correspondence to high-probability areas with a depth less than the critical depth and high-probability areas with the non-saline soil type. There is a closer correspondence between non-saline areas and low-probability areas with less than the critical depth to some extent.
In the 2021 results, the area of the high-probability region with a groundwater table exceeding the critical depth (2.4 m) had expanded in size compared to 2016, but it was still concentrated in the south-central part of the study area. Meanwhile, the range of the high-probability area covered the areas with above-moderate-salinity soil types in 2021. Therefore, the coincidence between the two was further improved compared to 2016, which indicates that the rise in the groundwater table played a great role in the aggravation of the secondary salinization of soils in the south from 2016 to 2021.

4. Discussion

4.1. Temporal and Spatial Variations in Topsoil Salinity in Irrigation Area

The results of this study illustrate that the soil salinity of the soil layer in the irrigation area showed a trend of decreasing in the whole area at first and then increasing, with salt blocks even occurring in local areas. As a whole, the average soil salinity of the soil layer in the irrigation area decreased from 14.424 g/kg to 5.109 g/kg, but the coefficient of variation increased from 77.74% to 160.45%, which indicates obvious heterogeneity characteristics. The main reasons for this change are as follows: (1) From the reclamation of the irrigation area to 2006, the method of flood irrigation was adopted in the irrigation area. The irrigation water could clean the topsoil. With continuous irrigation cleaning and crop improvement, the soil salinity decreased rapidly, and many sub-regions could return to a state of non-salinization or mild salinization. After that, with the change in irrigation mode from flood irrigation to water-saving drip irrigation, the cleaning efficiency of irrigation water was seriously weakened, and the phenomenon of “returning salt” began to appear in some areas [15]. (2) Due to the low-lying and enclosed terrain, along with the specific topographic conditions of the irrigation area, the irrigation water remains within the study area and cannot be discharged [16]. It converges with the underground runoff in the lower-lying southern region, where the groundwater depth is significantly shallower than that in other regions. Because of the strong evaporation in the irrigation area, the capillary effect of the soil has been greatly enhanced. The soluble salts in groundwater accumulate on the surface of the topsoil after evaporation and concentration in the topsoil, forming a white salt shell with a thickness of 2–5 cm [17]. This increase in salt in the topsoil greatly inhibited the growth of crops [18] and further aggravated salinization in some regions [19].

4.2. Effect of Groundwater Depth on Soil Salinity in Irrigated Area

Groundwater is the carrier of salt transfer in the topsoil; the movement and accumulation of salt ions in the soil layer are realized through the migration of groundwater [20]. In this study, we found that there is a threshold value for the influence of soil depth on the salt content of the arable soil. It is in the process of constant change, and the threshold value of soil depth decreased from 3.1 m in 2016 to 2.4 m in 2021. In the area where the depth is less than the threshold value [21], the salinity of the arable soil and the depth have a highly significant negative correlation. When the depth is more than the threshold value, the correlation is non-significant [22], and the reasons are as follows. (1) When the depth of groundwater is lower than the threshold value, the groundwater zone and the capillary zone are connected for a long time, and the saltwater’s movement path is smooth. Moreover, the shallower the depth of phreatic water, the more reliable the connection and the less likely it is to be interrupted [23]. Because of the action of strong evaporation, groundwater continuously moves to the surface through capillaries in the soil and continuously transfers the base ions in the groundwater and deep soil to the surface for accumulation [24,25]. Therefore, in the shallow groundwater area, the soil salinity in the topsoil increases with the decrease in groundwater depth. (2) When the depth exceeds the threshold, the connection between the capillary zone and the diving zone in the soil is not stable [26,27,28]. The capillary zone is even in a state of rupture in some areas where the diving depth is deeper, and at this time, the energy consumed by diving to the surface is higher. Water and salt transport is relatively difficult, and water transported to the surface through the action of capillaries is greatly reduced. This leads to the transport of water to the surface and then to a reduction in water transported to the surface [29,30]. The water transported to the surface through capillary action was greatly reduced. This led to the same reduction in salt transported to the surface for accumulation, which is inconsistent with the results reported by Kang Manping [31]. This was due to drought in the irrigation area, with little rainfall and intense evaporation. Additionally, the local farmers’ irrigation method does not work in a short period of time; effects are observed more quickly with large-scale water flood irrigation but take a long time to appear with drip irrigation. Relevant research work also shows that the wetting peak of drip irrigation can reach the surface of the ground at about 50 cm [32], so in the case of the fracture of the capillary zone, the soil in the tillage layer of the soil is not as dry as it was in the past. Therefore, in the case of capillary zone fracture, the salts in the soil of the plow layer can be transported to the lower soil layer with drip irrigation water. The soil sampling depth of this study is 0–30 cm, so when the depth exceeds the threshold value [33,34], the correlation between the depth and the soil salts in the plow layer is non-significant.

5. Conclusions and Prospects

5.1. Conclusions

After analyzing the variation patterns of soil salinity and groundwater depth in the arable layer over the 25-year reclamation period in the Karamay irrigation district, along with their interactions, the following conclusions can be drawn:
(1) After a long period of reclamation in the Karamay irrigation district, the overall salinity of the plow layer in the whole area of Karamay decreased gradually in the first two decades of reclamation. In the last five years, while the soil salinity in the northern part of the study area still maintained a decreasing trend, more serious secondary salinization occurred in the southern part, and the area was significantly enlarged while the degree of salinization was aggravated.
(2) The change in soil depth caused the non-homogeneous characteristics of soil salinity in the arable layer, and there are threshold values for its influence on soil salinity in the arable layer. These threshold values are not constant. When the soil depth is shallower than the threshold value, there is a highly significant negative correlation. When the soil depth exceeds the threshold value, their correlation is non-significant.
Combined with the results of this study, the following suggestions are made to address the widespread problem of rising groundwater tables and the secondary salinization of soil in water diversion irrigation areas:
(1) Groundwater drainage should be carried out to achieve the goal of “salt goes with water” to reduce the groundwater table in the irrigation area. (2) In the southern area, where the groundwater is shallow and the degree of salinization is heavy, the installation of underground pipe drainage facilities can reduce the infiltration of irrigation water into the groundwater, and this can take away the salt in the soil. (3) According to different degrees of salinization, selecting suitable salt-tolerant crops or salt-accumulating plants can effectively slow down the secondary salinization trend and realize the sustainable development of irrigation areas.

5.2. Prospects

While this paper has presented a comprehensive investigation on how topsoil salinity responds to changes in groundwater depth in the Karamay irrigation district and has provided pertinent suggestions for the current situation in the area based on the research findings, it is crucial to acknowledge that these recommendations are currently theoretical and have not undergone practical testing in the irrigation area. Following this, further research on groundwater drainage can be conducted in the heavily salinized region located to the south of the irrigation area. The monitoring of soil salinity post-drainage can be carried out to ascertain whether an increase in phreatic water depth can mitigate the occurrence of secondary salinization in the soil.

Author Contributions

Conceptualization, W.M., J.Y. and C.T.; methodology, G.L.; software, G.L.; validation, G.L.; formal analysis, G.L.; investigation, G.L.; resources, G.L.; data curation, G.L.; writing—original draft preparation, G.L.; writing—review and editing, G.L. and A.A.; visualization, G.L.; supervision, G.L.; project administration, W.M. and C.T.; funding acquisition, W.M. and C.T. All authors have read and agreed to the published version of the manuscript.

Funding

Special Fund for the Key Program of Science and Technology of Xinjiang Province, China, grant number 2020A01003.

Institutional Review Board Statement

Not applicable.

Informed Consent Statement

Not applicable.

Data Availability Statement

The data will be available for review from the corresponding author upon request.

Conflicts of Interest

The authors declare no conflict of interest.

References

  1. Jordán, M.M.; Navarro-Pedreno, J.; García-Sánchez, E. Spatial dynamics of soil salinity under arid and semi-arid conditions: Geological and environmental implications. Environ. Geol. 2004, 45, 448–456. [Google Scholar] [CrossRef]
  2. Odeh, I.O.A.; Onus, A. Spatial analysis of soil salinity and soil structural stability in a semiarid region of New South Wales, Australia. Environ. Manag. 2008, 42, 265–278. [Google Scholar] [CrossRef] [PubMed]
  3. Huang, J.; Kong, Y.L.; Xu, Q.S. Progresses for Characteristics and Amelioration Measures of Saline Soil. Soil 2022, 54, 18–23. [Google Scholar] [CrossRef]
  4. Fan, W.H.; Xuan, J.W.; Li, B.G.; Shi, J.C.; Liu, Y.H.; Sheng, J.D. The Impact of Long-term Drip Irrigation on Spatiotemporal Variation in Salt in the Proximity of Soil Surface in a Cotton Field. J. Irrig. Drain. 2020, 39, 83–89. [Google Scholar] [CrossRef]
  5. BAI, J.D.; Peng, J.; Bao, Z.J.; Wang, J.W.; Wu, J.L. Clarifying Spatial-Temporal Variability of Surface Soil Salinization in Arid Cotton Fields. Chin. J. Soil Sci. 2021, 52, 527–534. [Google Scholar] [CrossRef]
  6. Fan, Z.L.; Qiao, M.; XU, H.L. Rational Groundwater Exploitation and Utilization, an Important Approach of Improving Salinized Farmland in Xinjiang. Arid Zone Res. 2011, 28, 737–743. [Google Scholar] [CrossRef]
  7. Zhao, D.; Eyre, J.X.; Wilkus, E. 3D characterization of crop water use and the rooting system in field agronomic research. Comput. Electron. Agric. 2022, 202, 107409. [Google Scholar] [CrossRef]
  8. Zhuang, Q.W.; Wu, S.X.; Yang, Y. Spatiotemporal characteristics of different degrees of salinized cultivated land in Xinjiang in recent ten years. J. Univ. Chin. Acad. Sci. 2021, 38, 341–349. [Google Scholar] [CrossRef]
  9. Hu, Y.; Yang, F.; Yang, N. Analysis and Prospects of Saline-alkali Land in China from the Perspective of Utilization. Chin. J. Soil Sci. 2023, 54, 489–494. [Google Scholar] [CrossRef]
  10. Hu, M.F.; Tian, C.Y.; Zhao, Z.Y. Salinization causes and research progress of technologies improving saline-alkali soil in Xinjiang. J. Northwest AF Univ. 2012, 40, 111–117. [Google Scholar] [CrossRef]
  11. Guo, M.; Wu, K.N.; Du, K.C. Attribution of Saline Soils in Xinjiang Based on Chinese Soil Taxonomy. Chin. J. Soil Sci. 2020, 51, 253–262. [Google Scholar] [CrossRef]
  12. Meng, C.R.; Yan, L.; Zhang, S.J. Variation of Soil Salinity in Plow Layer of Farmlands under Long-term Mulched Drip Irrigation in Arid Region. Acta Pedologica Sinica. 2017, 54, 1386–1394. [Google Scholar] [CrossRef]
  13. Zhang, Y.; Liu, B.; He, X.L. Change of Groundwater Depth and Impact Factors in Arid Irrigation Area. Water Sav. Irrig. 2017, 6, 63–67. [Google Scholar] [CrossRef]
  14. Yao, X.R.; Pan, C.D.; Zhang, Y.Y. Study on the Water-Soil Environment Characteristics in Karamay Agricultural Development Region after Land Exploitation. J. Xinjiang Agric. Univ. 2008, 31, 1–6. [Google Scholar] [CrossRef]
  15. Chen, Y.L.; Chen, J.J.; Ma, Z.M. Analysis of soil water-salt movement and influence factor in Karamay agricultural development area. J. Shihezi Univ. (Nat. Sci.) 2016, 34, 222–231. [Google Scholar] [CrossRef]
  16. Zhang, S.Y.; Wu, S.X.; He, K. Variation of Soil Salinity in Karamay Agricultural Development Area in Different Reclamation Years. Soil 2018, 50, 574–582. [Google Scholar] [CrossRef]
  17. Yang, Y.F.; Li, Z.S.; Chen, S.Q. Study on the dynamic law of groundwater in the Agricultural Development Zone of Karamay City. Jiangxi Hydraul. Sci. Technol. 2016, 42, 398–403. [Google Scholar] [CrossRef]
  18. Yang, W.J.; Hudan, T.; Millishati, M. Spatial Distribution Characteristics of Salt in Drip Irrigation Cotton Field Under Mulch. Water Saving Irrigation. 2020, 9, 58–63. [Google Scholar] [CrossRef]
  19. Liu, G.H.; Mai, W.X.; Tian, C.Y. Effect of organic fertilizer application on the improvement of saline soils-Meta analysis. J. Agric. Resour. Environ. 2023, 40, 86–96. [Google Scholar] [CrossRef]
  20. Sun, J.S.; Geng, Q.L.; Cheng, F.H. Spatial Distribution Pattern Quantitative Analysis of Soil Salt Accumulation and Groundwater Depth in the Karamay Agricultural Development Zone. Xinjiang Agric. Sci. 2012, 49, 1471–1476. [Google Scholar] [CrossRef]
  21. Zhang, X.N.; Li, Y.; He, X.M. Responses of plant functional trait and diversity to soil water and salinity changes in desert ecosystem. Acta Ecol. Sin. 2019, 39, 1541–1550. [Google Scholar] [CrossRef]
  22. Urban, L.; Aarrouf, J.; Bidel, L.P.R. Assessing the effects of water deficit on photosynthesis using parameters derived from measurements of leaf gas exchange and of chlorophyll a fluorescence. Front. Plant Sci. 2017, 8, 2068. [Google Scholar] [CrossRef]
  23. Li, B.; Shi, H.B.; Yan, J.W. Relation Between Groundwater Depth and Soil Water and Salt After Water Saving Reform in salinization irrigation district. J. Soil Water Conserv. 2014, 28, 117–122. [Google Scholar] [CrossRef]
  24. Hao, Y.Y.; Xu, X.; Huang, Q.Z. Modeling soil water-salt dynamics and maize yield responses to groundwater depths and irrigations. Trans. Chin. Soc. Agric. Eng. (Trans. CSAE) 2014, 30, 128–136. [Google Scholar] [CrossRef]
  25. Yao, R.J.; Yang, J.S. Relationship Between Salt Accumulation in Topsoil of Deserted Land and Groundwater in areas with Shallow Groundwater Table in Kashi, Xinjiang. Acta Pedol. Sin. 2014, 51, 75–81. [Google Scholar] [CrossRef]
  26. Zhu, G.; Liu, Y.; Shi, P.; Jia, W.; Zhou, J.; Liu, Y.; Zhao, K. Stable water isotope monitoring network of different water bodies in Shiyang River basin, a typical arid river in China. Earth Syst. Sci. Data 2022, 14, 3773–3789. [Google Scholar] [CrossRef]
  27. Fang, Y.; Wang, H.; Fang, P.; Liang, B.; Zheng, K.; Sun, Q.; Wang, A. Life cycle assessment of integrated bioelectrochemical-constructed wetland system: Environmental sustainability and economic feasibility evaluation. Resour. Conserv. Recycl. 2023, 189, 106740. [Google Scholar] [CrossRef]
  28. Xu, J.; Lan, W.; Ren, C.; Zhou, X.; Wang, S.; Yuan, J. Modeling of coupled transfer of water, heat and solute in saline loess considering sodium sulfate crystallization. Cold Reg. Sci. Technol. 2021, 189, 103335. [Google Scholar] [CrossRef]
  29. Liu, Z.; Xu, J.; Liu, M.; Yin, Z.; Liu, X.; Yin, L.; Zheng, W. Remote sensing and geostatistics in urban water-resource monitoring: A review. Mar. Freshw. Res. 2023, 74, 747–765. [Google Scholar] [CrossRef]
  30. Wang, D.; Zhao, C.; Zheng, J. Evolution of soil salinity and the critical ratio of drainage to irrigation (CRDI) in the Weigan Oasis in the Tarim Basin. Catena 2021, 201, 105210. [Google Scholar] [CrossRef]
  31. Guan, X.Y.; Wang, S.L.; Gao, Z.Y. Spatio-temporal variability of soil salinity and its relationship with the depth to groundwater in salinization irrigation district. Acta Ecol. Sin. 2012, 32, 198–206. [Google Scholar] [CrossRef]
  32. Kang, M.P.; Zhao, C.Z.; Li, Q. Characteristics of soil total salt content and its correlation with groundwater in Sugan Lake wetland. Acta Ecol. Sin. 2022, 42, 9026–9034. [Google Scholar] [CrossRef]
  33. Guan, Z.; Jia, Z.; Zhao, Z. Dynamics and distribution of soil salinity under long-term mulched drip irrigation in an arid area of northwestern China. Water 2019, 11, 1225. [Google Scholar] [CrossRef]
  34. Li, J.W.; Di, S.J.; Hu, W.W. Research on Groundwater Characteristics and Its present situation of Soil Salinization in Shanyin County of Shanxi Province. Ground Water 2016, 38, 6–7 + 36. [Google Scholar] [CrossRef]
Figure 1. Different elevations and sampling points within the study area.
Sustainability 15 15680 g001
Figure 2. Inter-annual and inter-monthly variations in groundwater depth in the study area. (a) Inter-annual variation in groundwater depth; (b) inter-monthly variation in groundwater depth.
Sustainability 15 15680 g002
Figure 3. Spatial distribution of groundwater levels in the study area in 2006, 2011, 2016, and 2021.
Sustainability 15 15680 g003
Figure 4. Changes in soil salinity of topsoil in the study area in different years.
Sustainability 15 15680 g004
Figure 5. Fitting results of soil salinity and groundwater depth in soil layer in 2016 and 2021.
Sustainability 15 15680 g005
Figure 6. Probabilistic spatial distribution of groundwater depths under different threshold conditions in the study area in 2016 and 2021.
Sustainability 15 15680 g006
Figure 7. Distribution of soil salinization types in the study area in 2016 and 2021.
Sustainability 15 15680 g007
Table 1. Changes in different groundwater depths of different irrigation areas.
Year<2 m2–3 m3–4 m4–5 m5–6 m>6 mTotal (%)
2006000030.8569.15100
200805.9926.9633.1917.8715.99100
2009023.7532.3221.5211.5710.84100
201018.7828.1524.0018.176.104.79100
201123.7226.8326.0313.286.333.80100
201232.4126.6020.3913.914.502.20100
201327.1736.4030.574.341.520100
201425.9933.4729.769.001.790100
201522.2854.6119.953.1600100
201620.0036.6238.403.601.380100
202110.8469.0315.573.570.990100
Table 2. Descriptive statistics of soil salinity in different years.
ProjectYearMaximum
g/kg
Minimum
g/kg
Range
g/kg
Mean
g/kg
Standard DeviationVariance
%
Skewness
Soil
salinity
199656.7470.45456.29314.42411.21377.741.169
200630.8001.40029.40011.4186.052108.001.488
201673.9500.37073.5805.1887.216139.086.238
202146.4800.49045.9905.1098.198160.453.078
Table 3. Percentage of soil salinization area in the study area in different years (%).
Degree of Salinization1996200620162021
Non-salinization0.0047.0749.3364.25
Mild salinization20.9536.0730.6213.87
Moderate salinization38.838.4412.616.59
Severe salinization29.518.437.358.02
Saline soil10.710.000.107.27
Disclaimer/Publisher’s Note: The statements, opinions and data contained in all publications are solely those of the individual author(s) and contributor(s) and not of MDPI and/or the editor(s). MDPI and/or the editor(s) disclaim responsibility for any injury to people or property resulting from any ideas, methods, instructions or products referred to in the content.

