Abstract
The global significance of fluoride and nitrate contamination in coastal areas cannot be overstated, as these contaminants pose critical environmental and public health challenges across the world. Water quality is an essential component in sustaining environmental health. This integrated study aimed to assess indexical and spatial water quality, potential contamination sources, and health risks associated with groundwater resources in Al-Hassa, Saudi Arabia. Groundwater samples were tested using standard methods. The physiochemical results indicated overall groundwater pollution. This study addresses the critical issue of drinking water resource suitability assessment by introducing an innovative approach based on the pollution index of groundwater (PIG). Focusing on the eastern region of Saudi Arabia, where water resource management is of paramount importance, we employed advanced machine learning (ML) models to forecast groundwater suitability using several combinations (C1 = EC + Na + Mg + Cl, C2 = TDS + TA + HCO3 + K + Ca, and C3 = SO4 + pH + NO3 + F + Turb). Six ML models, including random forest (RF), decision trees (DT), XgBoost, CatBoost, linear regression, and support vector machines (SVM), were utilized to predict groundwater quality. These models, based on several performance criteria (MAPE, MAE, MSE, and DC), offer valuable insights into the complex relationships governing groundwater pollution with an accuracy of more than 90%. To enhance the transparency and interpretability of the ML models, we incorporated the local interpretable model-agnostic explanation method, SHapley Additive exPlanations (SHAP). SHAP allows us to interpret the prediction-making process of otherwise opaque black-box models. We believe that the integration of ML models and SHAP-based explainability offers a promising avenue for sustainable water resource management in Saudi Arabia and can serve as a model for addressing similar challenges worldwide. By bridging the gap between complex data-driven predictions and actionable insights, this study contributes to the advancement of environmental stewardship and water security in the region.
1. Introduction
Access to safe and clean drinking water is a fundamental human right, recognized by the United Nations [1]. Ensuring the quality and safety of drinking water resources is a global concern, as compromised water quality can have significant environmental and public health implications [2,3,4,5]. The presence of contaminants such as fluoride and nitrate in groundwater is a pressing issue, particularly in coastal areas where these pollutants pose critical challenges [6,7,8]. Therefore, the evaluation of water quality, identification of contamination sources, and assessment of associated health risks are of utmost importance [9]. The significance of preserving water quality extends beyond immediate human consumption; it is a cornerstone of environmental health and ecosystem sustainability. Groundwater, in particular, plays a vital role in supplying fresh water to a substantial portion of the global population [10]. Hence, maintaining its quality is crucial for safeguarding both human health and environmental integrity.
This integrated study focuses on addressing these multifaceted challenges in the context of Al-Hassa, a region in Saudi Arabia where groundwater serves as a primary source of drinking water [11]. Al-Hassa is renowned for its extensive oases and agricultural activity, making groundwater quality a critical concern, given the potential for contamination from agricultural practices and industrial activities. An extensive investigation was carried out in a semi-arid region of Yavtmal District, Maharashtra, India, employing a combination of geochemical modeling and health impact assessment [12]. Chloro-alkaline indices indicated cation exchange, with evidence of CaCO3 and CaF2 precipitation in the groundwater [12]. Key water–rock interactions involve calcite, gypsum, and albite dissolution, along with dolomite, fluorite, halite, and K-feldspar precipitation [12]. Groundwater pollution analysis revealed 18% of samples to be in a very-high-pollution zone, 3% in a high-pollution zone, 8% in a moderate-pollution zone, and 24% in a low-pollution zone [12]. Different pollution zones are associated with varying degrees of fluorosis, affecting 15% to 41% of the population with dental fluorosis. Effective monitoring and treatment of high-fluoride water are essential before its use for drinking or cooking [12].
Similarly, Egbueri [13] assessed the potability of groundwater in Ojoto and its vicinity by employing the pollution index of groundwater (PIG), ecological risk index (ERI), and hierarchical cluster analysis (HCA). The investigation focused on major ion concentrations, primarily SO42−, Na+, and Ca2+, all of which were found to be below their respective maximum allowable limits. The water samples were predominantly characterized as NaSO4 (85%), CaSO4 (10%), and MgSO4 (5%) types [13]. The analysis revealed that 80% of the samples exhibited minimal pollution levels, rendering them suitable for drinking, while 20% showed high pollution levels, making them unsuitable for human consumption. Additionally, 20% of the samples posed a significant ecological risk, while 80% presented a low ecological risk. The samples were categorized into two clusters, with the first cluster containing 80% of the water suitable for drinking and the second cluster containing 20% unsuitable for human use. The study recommended water treatment for contaminated sources [13].
In another study, Egbueri et al. [14] conducted an analysis of groundwater quality and the associated probabilistic human health risks resulting from emanation of secondary elements (ESEs) in the Ameka area. This assessment utilized multiple indices and introduced a novel health risk assessment framework named HHRISK. This study in south-eastern Nigeria assessed health risks from water pollution due to mining and agriculture using the HHRISK framework [14]. Samples from wells and boreholes showed extreme pollution. The study identified Cd, As, Se, and other elements posing high health risks, especially for children. Urgent pollution reduction measures are needed in Ameka [14]. Adimalla et al. [15] conducted an integrated study to assess groundwater contamination by comparing it against national guidelines. They also quantified the health risks associated with fluoride and nitrate using a model recommended by the United States Environmental Protection Agency (USEPA). This study assessed fluoride and nitrate contamination in arid regions, finding that groundwater samples exceeded national drinking water guidelines [15]. Non-carcinogenic health risk was higher in infants and children, emphasizing the need for water quality management in these areas to safeguard public health, particularly for vulnerable populations [15].
However, Shukla et al. [16] designed a study to interpret the hydrochemical fluctuations in the groundwater sources of a rural area in Raebareli district. The study examined fluctuations in hydrochemical factors in a rural area. The water was slightly alkaline and influenced by various factors. Most samples were categorized as having “insignificant pollution” during both pre-monsoon and post-monsoon periods. Children were found to be more susceptible to health risks, with fluoride having a greater impact than nitrate [16]. Statistical analysis suggested probable pollution sources involving NO, Cl, Na, and K. The samples were classified as NaHCO3 type and shallow meteoric water percolation type, and they exhibited a dominance of alkalis and weak acids. Most samples fell under the “rock dominance” category, indicating significant rock–water interaction [16]. Nath, et al. [17] conducted a groundwater quality assessment in the Thettiyar watershed of Thiruvananthapuram district, Kerala, India, utilizing a groundwater pollution index and geographic information system (GIS). The work assessed the water quality of the Thettiyar Watershed for drinking and irrigation purposes using various analysis techniques [17]. Water type identification was performed using diagrams, including USSL and Wilcox diagrams. The results indicated slightly acidic water within permissible limits. Seasonal variations were observed, mainly attributed to water–rock interactions and dilution. Both natural and anthropogenic factors influenced water quality, making the Thettiyar Watershed suitable for drinking and irrigation [17].
Groundwater quality in a semi-arid region of India was evaluated using both an entropy-weighted water quality index (EWQI) and a pollution index of groundwater (PIG) [18]. The study looked at the quality of the water and the pollution in a semi-arid region of India [18]. The methods were used to evaluate the data on the parameters of the water. The samples were collected from the Dubbak region in India and were analyzed for a number of parameters [18]. The study region’s water is alkaline. The order in which the cations and anions are abundant is based on their mean values. The average of the values was 93.3. Only a small percentage of the samples were suitable for drinking, but the rest were unsuitable for drinking and would therefore need treatment. Only a small percentage of the samples from the study area were suitable for drinking [18]. To comprehensively assess water quality in Al-Hassa, we adopt an innovative approach centered on the PIG. This index provides a systematic framework for evaluating the pollution status of groundwater by considering a wide range of water quality parameters [19]. By integrating this index with advanced machine learning (ML) models, we aim to predict groundwater suitability for drinking purposes with precision and accuracy.
In recent years, ML has demonstrated remarkable potential in unlocking complex patterns within large datasets [20,21,22]. In this study, we leverage the power of ML to forecast groundwater quality based on the PIG. Our ML models include a diverse set of algorithms, such as random forest (RF), decision trees (DT), XgBoost, CatBoost, linear regression, and support vector machines (SVR). These models, driven by multiple performance criteria, provide valuable insights into the intricate relationships governing groundwater pollution. To enhance the transparency and interpretability of these ML models, we introduce SHapley Additive exPlanations (SHAP). SHAP is an advanced technique in the field of explainable AI, enabling us to gain deeper insights into the predictive decisions made by complex models. By shedding light on the factors contributing to groundwater suitability assessments, SHAP enhances our understanding of the underlying dynamics. PIG prediction using artificial intelligence (AI) has been studied in multiple papers. Derdour et al. [23] created a predictive model employing support vector machine (SVM) and k-nearest neighbors (KNN) classifiers to estimate irrigation water quality index (IWQI) using hydrochemical parameters. Kulisz et al. [24] tested the capacity of ANN methods to model the water quality index in groundwater and found satisfactory accuracy. Saha et al. [25] evaluated groundwater potential maps (GWPMs) using machine learning algorithms (MLA) and achieved satisfactory results for groundwater potentiality assessment. They evaluated groundwater potential maps (GWPMs) using machine learning algorithms (MLA) and achieved satisfactory results for groundwater potentiality assessment [25]. Kumar et al. [26] modelled groundwater drought indices using machine learning techniques, specifically ANN and random forest (RF), and found that the RF model showed superior performance [26]. These studies demonstrate the effectiveness of AI approaches, such as SVM, KNN, ANN, and RF, in predicting groundwater quality indices and potentiality.
In 2023, Musaab et al. [27] in northern Khartoum, Sudan, assessed groundwater quality for drinking using MLP neural network and SVR models to predict the groundwater quality index (GWQI). Most samples met WHO standards, with AI techniques enhancing GWQI predictions, indicating mostly suitable water quality. Mosleh et al. [28] conducted a study in the Al-Baha region of Saudi Arabia using a hybrid model combining single exponential smoothing (SES) with BiLSTM and ANFIS to predict water quality. While both models were effective, SES-BiLSTM was slightly more accurate. These models can reliably predict water quality, benefiting similar groundwater quality studies and confirming Al-Baha’s groundwater suitability for drinking and irrigation. More recent studies of GWQ were conducted by [29,30]. The ultimate goal of this research is to bridge the gap between data-driven predictions and actionable insights in the context of groundwater quality assessment. We believe that the integration of ML models with SHAP-based explainability offers a promising pathway for sustainable water resource management not only in Al-Hassa but also as a model for addressing similar water quality challenges worldwide. In doing so, this study contributes to the advancement of environmental stewardship, public health, and water security. The global significance of groundwater contamination, particularly in coastal areas, necessitates innovative and robust approaches for assessing and ensuring drinking water suitability. This research endeavors to meet this challenge by introducing a comprehensive framework based on the PIG, advanced ML models, and SHAP-based explainability. Through this interdisciplinary effort, we strive to advance the understanding and management of water quality, highlighting the importance of clean and safe drinking water for both humanity and the environment. The uniqueness of this study is associated with explainable AI in pollution control, which receives no less attention in literature.
2. Study Area, Climate, and Measurement
The Al-Hassa oasis is situated in the Eastern Province of Saudi Arabia, approximately 320 km east of Riyadh and 70 km west of the Arabian Gulf coastline (Figure 1). Geographically, it spans latitudes 25°20′ N to 25°40′ N and longitudes 49°30′ E to 49°50′ E, with an elevation ranging from 130 to 160 m above sea level. Its topography gently slopes towards the Gulf coast. This oasis assumes an “L” shape, with one axis extending approximately 30 km in a south-northeast direction and the other stretching about 18 km in a west-east orientation, encompassing a total area of roughly 260 km2. Al-Hofuf City, located at the intersection of these axes in the southwest region of the oasis, serves as the primary urban center [31]. The climate of the Al-Hassa oasis exhibits significant seasonal and annual variations and is categorized as belonging to the subtropical desert zone, characterized by cold, arid winters and scorching, arid summers, as classified by Mansour. The winter season spans from November to the end of March, with average temperatures ranging from 8 °C to 21 °C. In contrast, the summer season extends from May to the conclusion of August, featuring mean temperatures fluctuating between 24 °C and 45 °C. Notably, the summer season is acknowledged as the hottest period in the region. Relative humidity levels range from 21% to 29% during the summer months and increase to 31% to 55% in the winter, with an average monthly value of approximately 38%. Precipitation is most frequent during the winter and spring seasons, with an average annual rainfall totaling approximately 85 mm. The groundwater system in the Al-Hassa region is notably intricate, comprising aquifers originating from Late Cretaceous and Tertiary geological formations, including the Aruma, Umm Er Radhuma, Rus, Dammam, and Neogene. Of particular importance is the Rus formation, which acts as a natural barrier, effectively isolating the Umm Er Radhuma and Dammam aquifers due to its composition primarily consisting of limestone, marls, and evaporates [32].
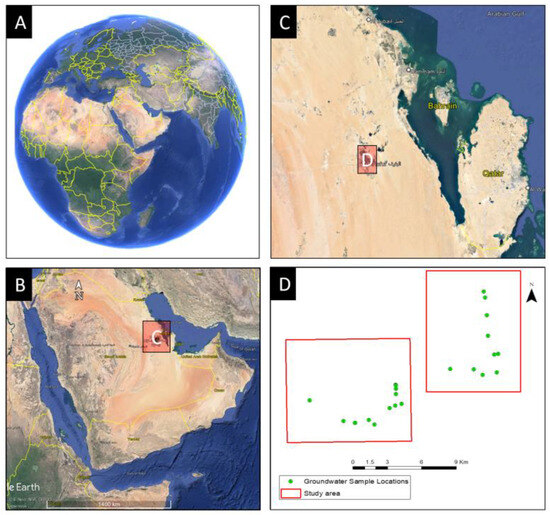
Figure 1.
Study area showing (A) Global Catchment and visualization (B) Regional Visualization of the Kingdom (C) Eastern Province, Saudi Arabia with Al-Hassa location, (D) Study area with samples location.
Within this groundwater system, four partially interconnected aquifers constitute the hydrogeological framework. The uppermost layer comprises the Neogene aquifer complex, characterized by a combination of porous clastic aquifers and karstified fractured bedrock aquifers. The Umm Er Radhuma aquifer primarily consists of a karstified fractured bedrock aquifer. In contrast, the Dammam aquifer complex encompasses a partially karstified fractured bedrock aquifer. The lowermost Aruma aquifer, consisting of karstified fractured bedrock, is of relatively minor significance [32]. The Neogene aquifer is further delineated into three formations: Hofuf, Dam, and Hadrukh, with Hofuf having a thickness of 20 to 100 m, and Dam and Hadrukh formations ranging from 100 to 200 m in thickness. These formations exhibit substantial fissuring and secondary porosity, with groundwater recharge predominantly occurring in the southwest region and groundwater flow primarily directed north-eastward. Groundwater serves as the primary source of irrigation water in the research area [11,33]. Throughout the study, various physical and chemical parameters of groundwater were assessed on-site, including pH, dissolved oxygen, oxidation-reduction potential, electrical conductivity, and temperature. Samples of groundwater sourced from the Neogene aquifer in Al-Hassa were collected and transported to the laboratory for comprehensive physical and hydrochemical analyses.
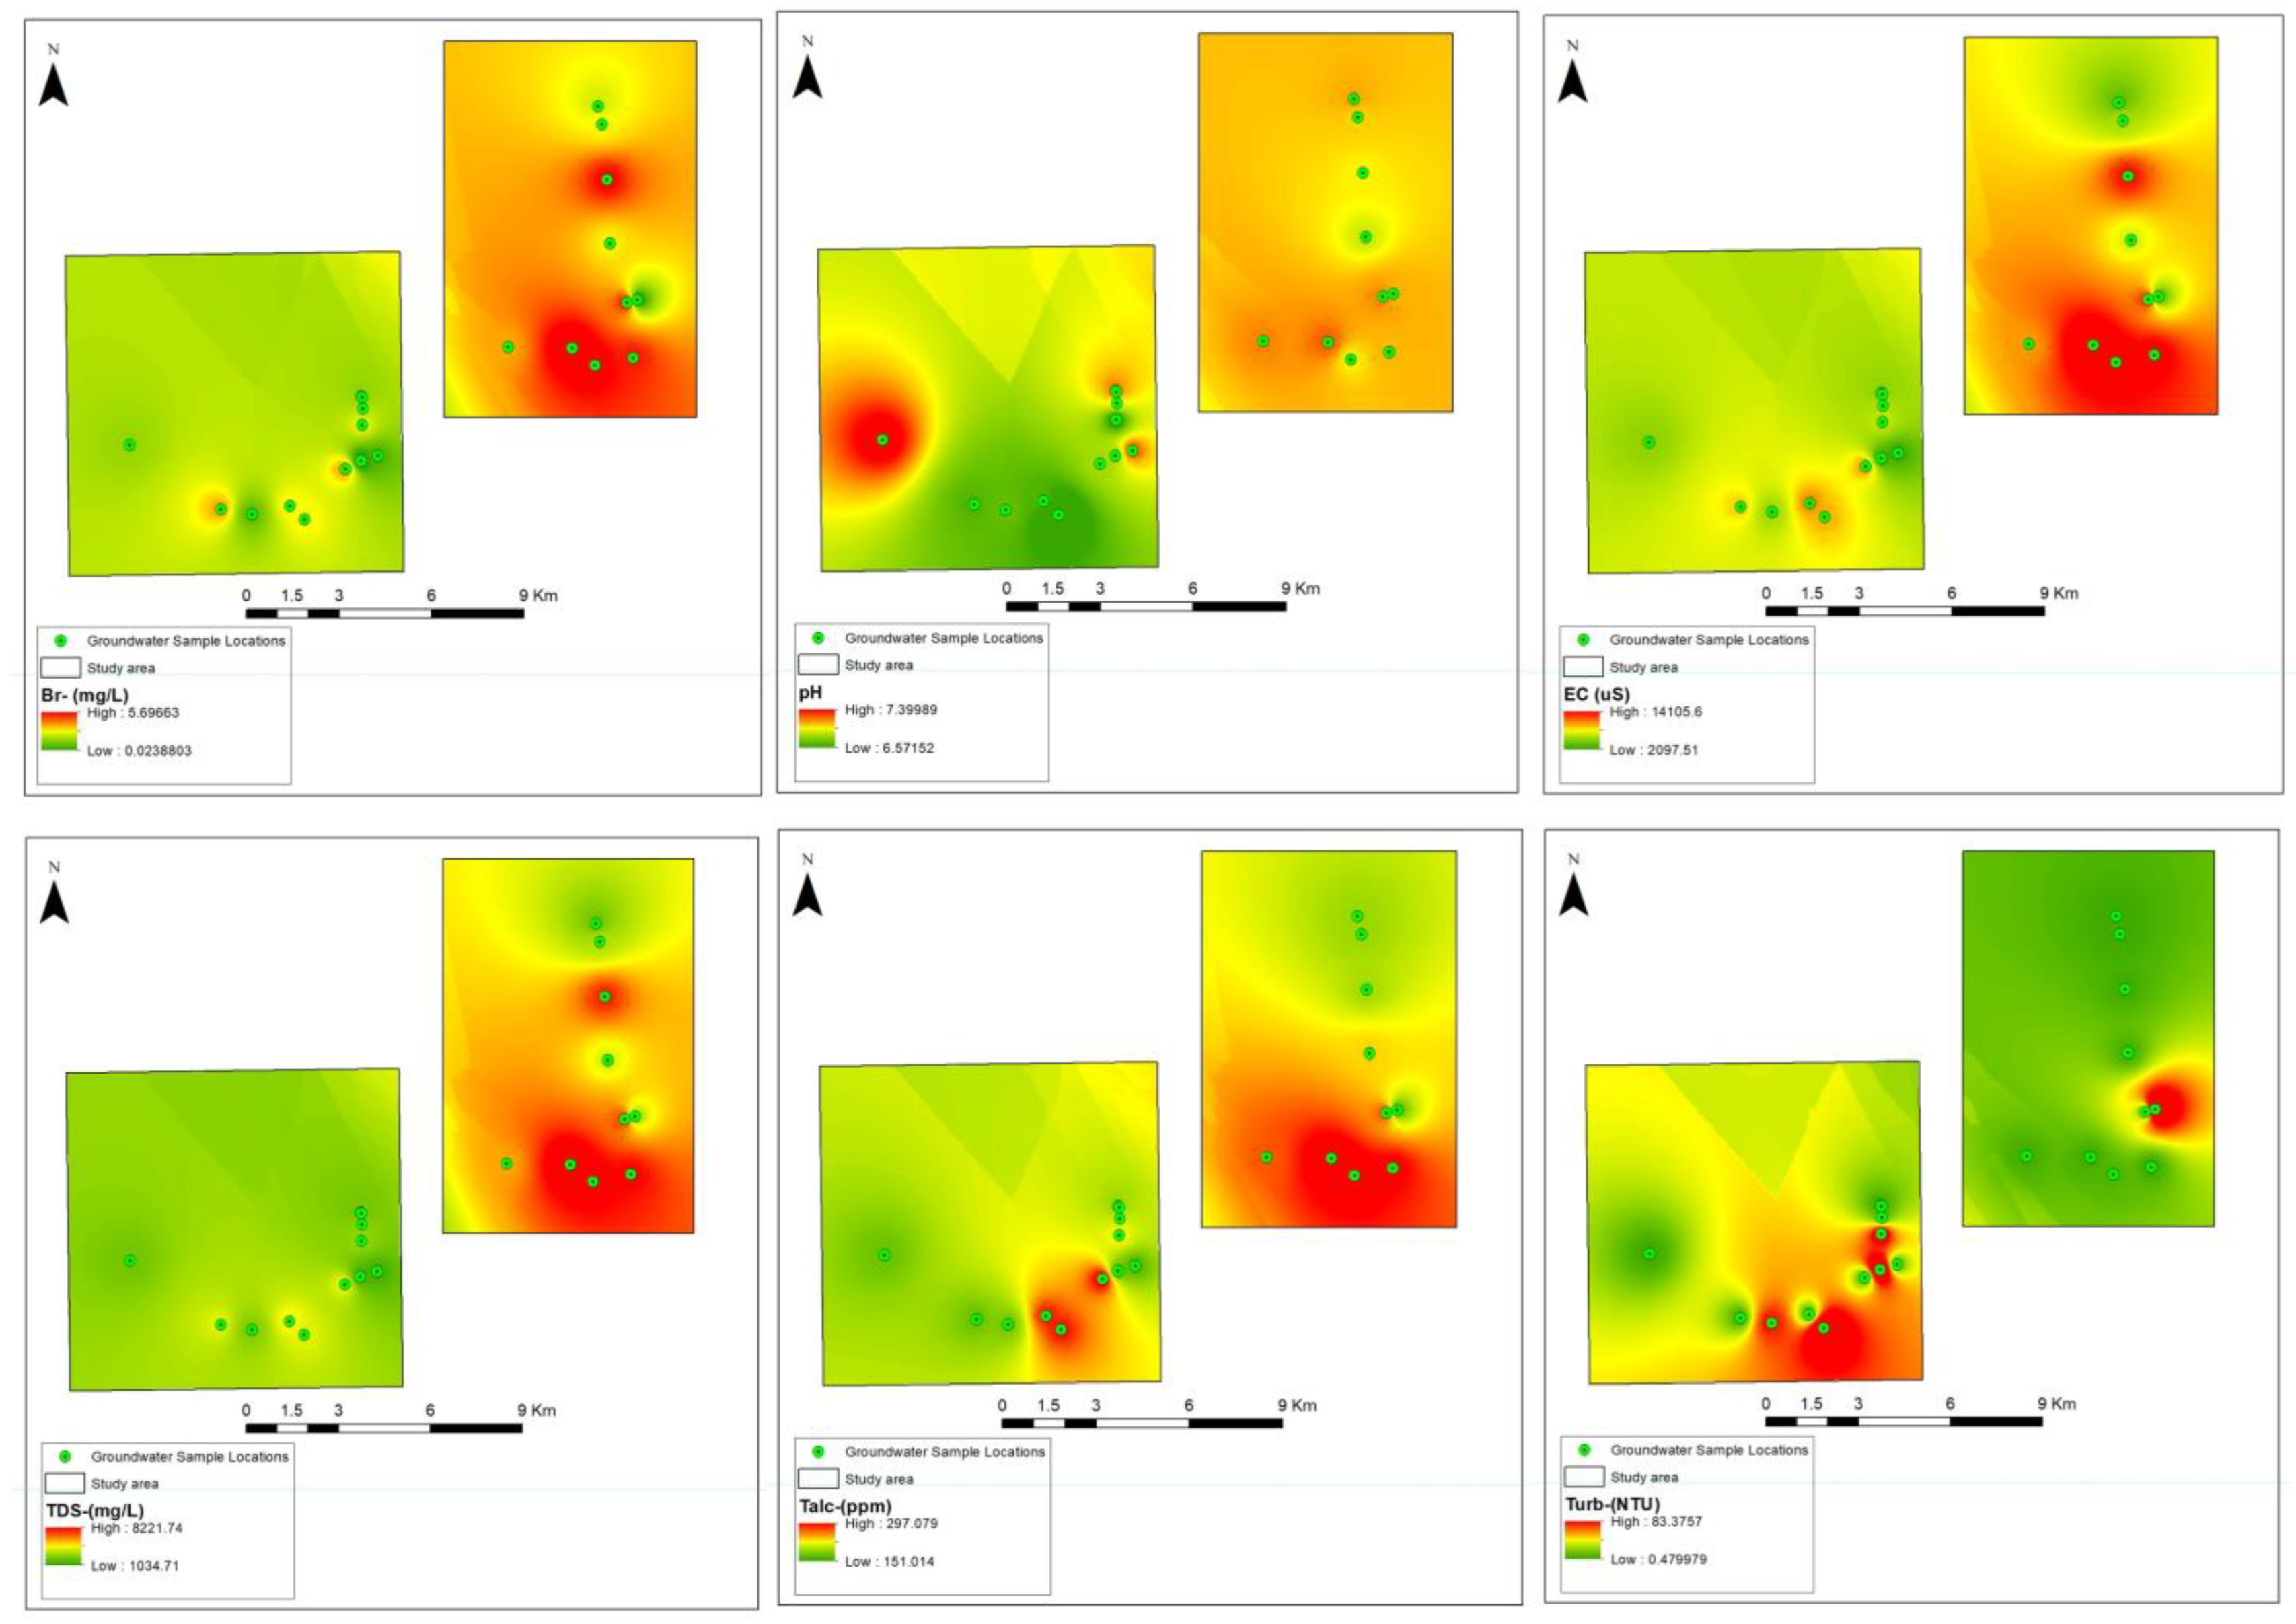
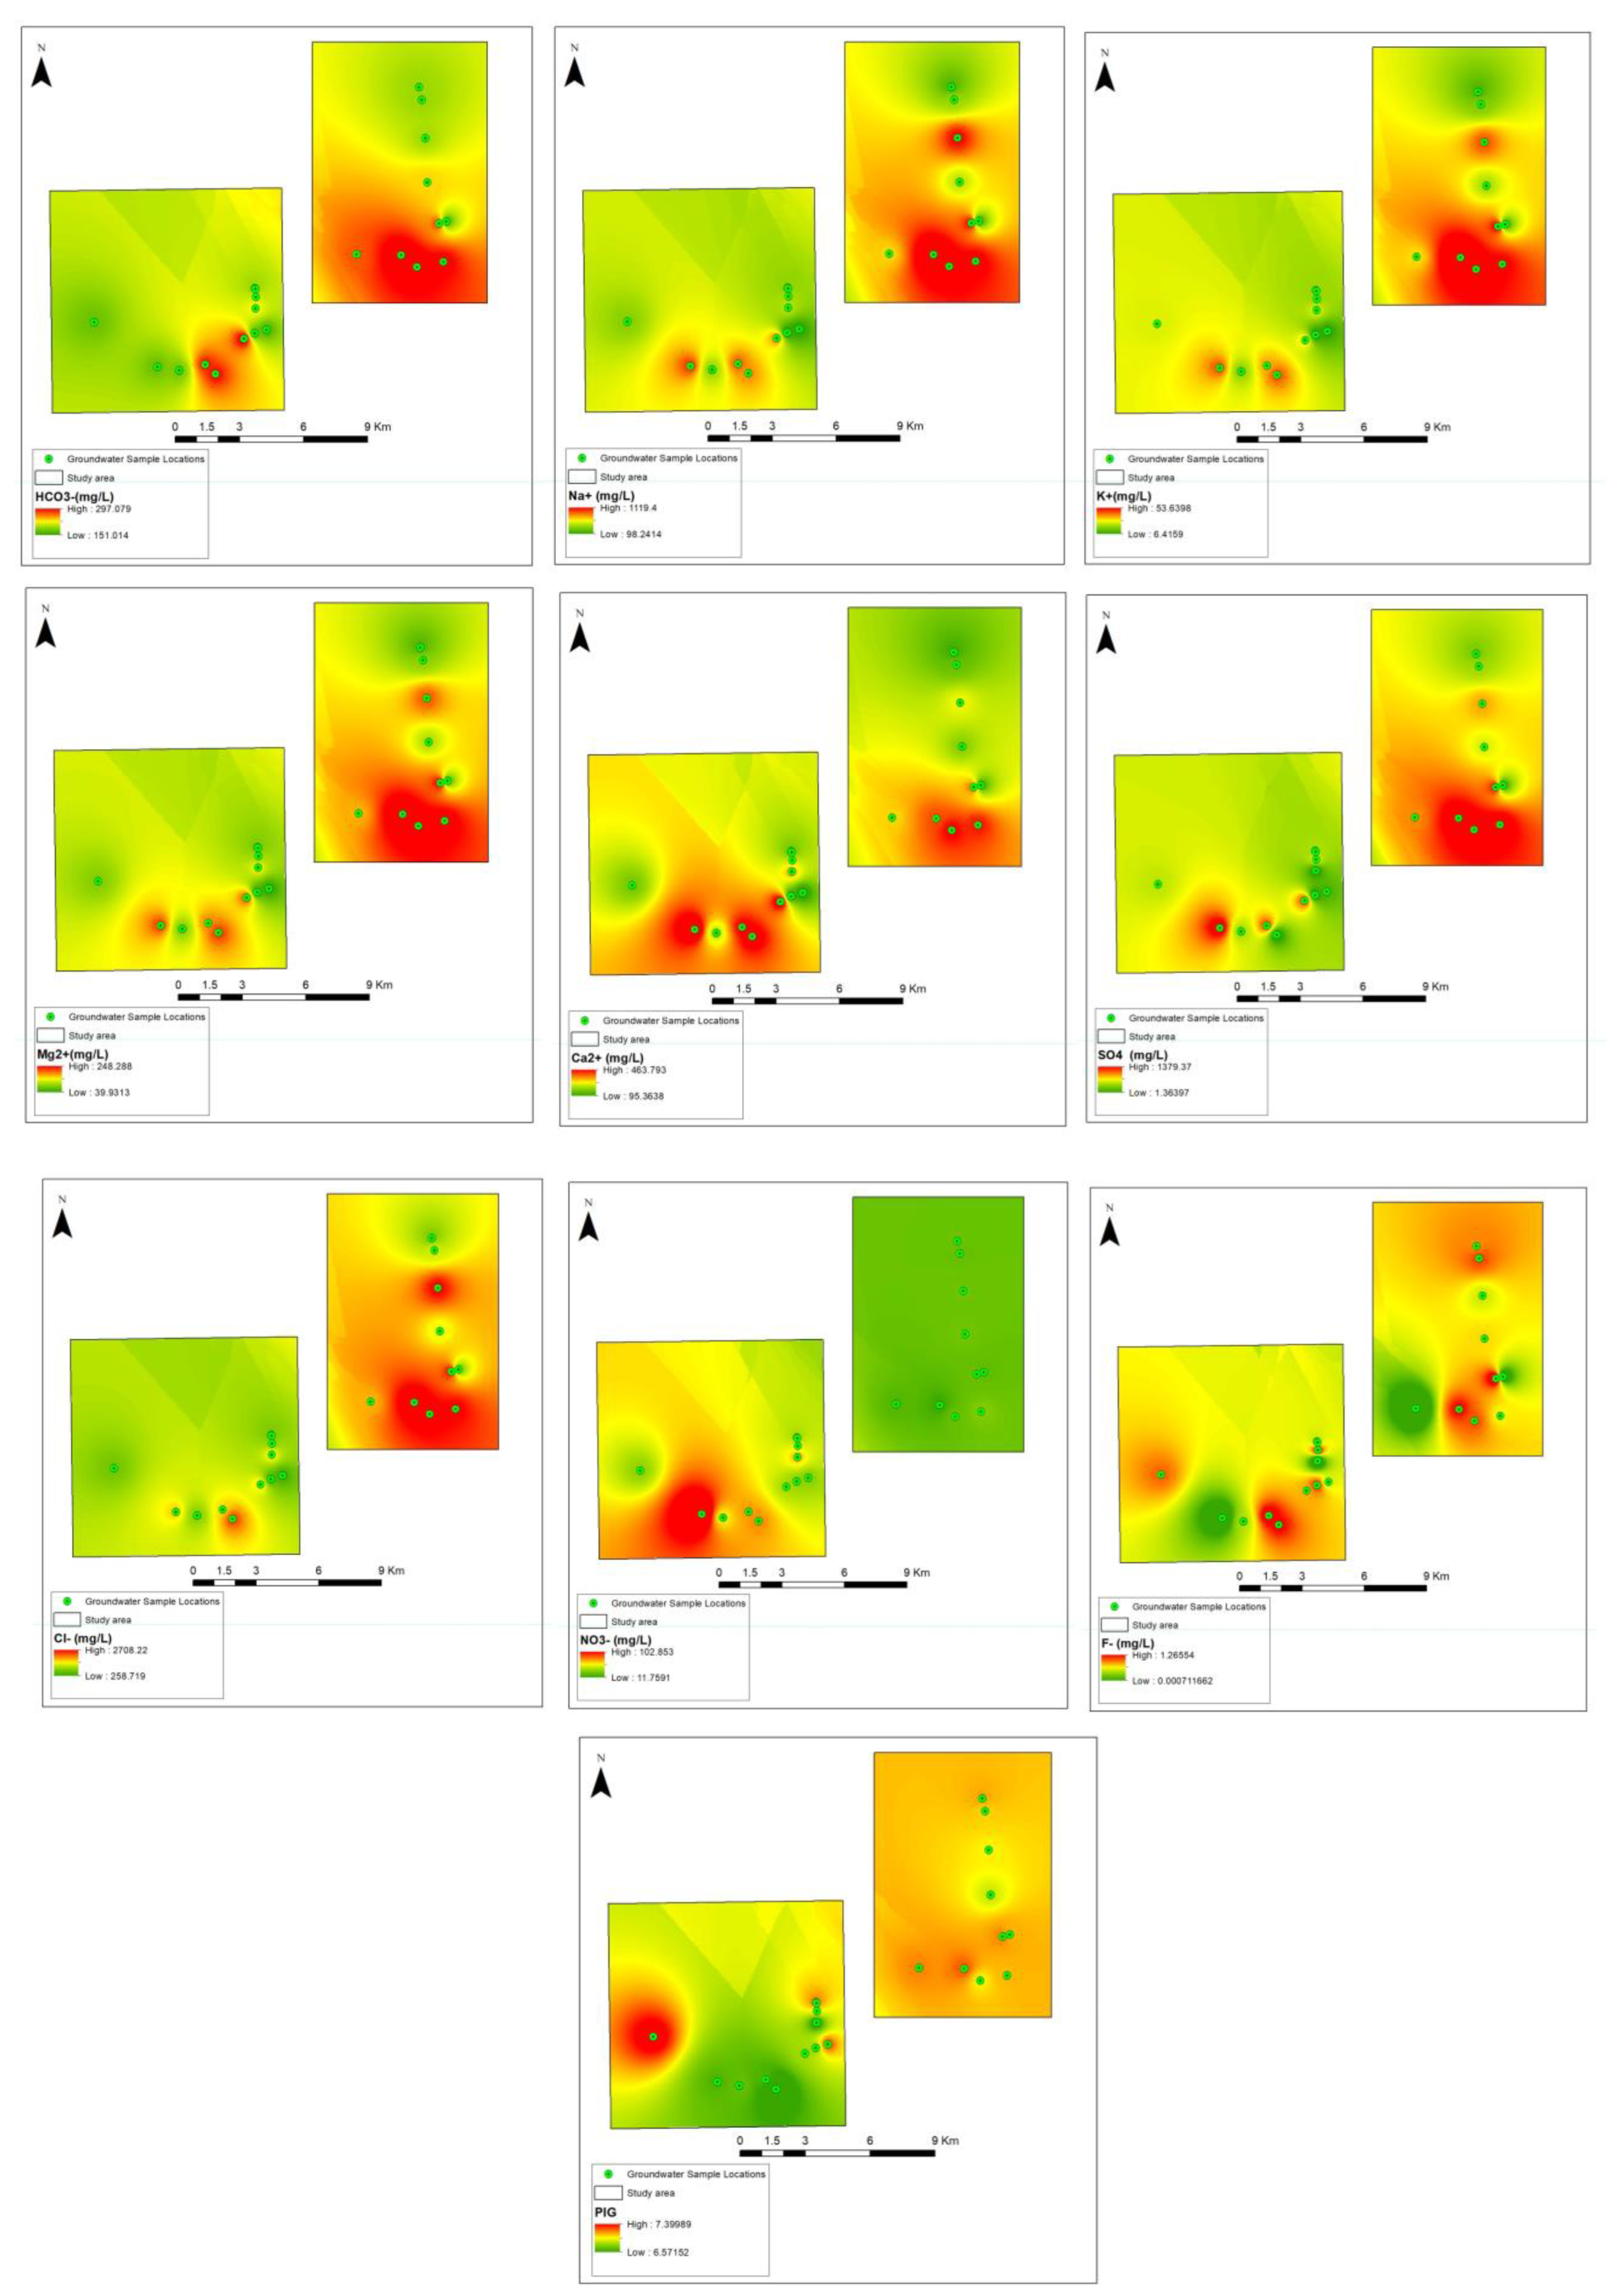
A comprehensive field survey was conducted to acquire data on the physical and chemical attributes of groundwater. Parameters such as pH, oxidation-reduction potential (ORP), electrical conductivity (EC), total dissolved solids (TDS), turbidity, dissolved oxygen (DO), temperature, and air pressure were measured in situ using the Hanna GPS Multiparameter Meter (HI9829). To ensure data accuracy, groundwater wells were purged for 15 min to eliminate standing water before measurements were recorded. A total of 72 groundwater samples were randomly collected from Neogene aquifer wells scattered across the research area, targeting main components for subsequent analysis. In compliance with the sampling requirements stipulated by the US Environmental Protection Agency, the collected water samples were filtered and stored in an icebox, maintaining a temperature below 40 °C. Acid titration techniques were employed to determine bicarbonate concentrations, while ion chromatography was utilized for the identification of ions present in the groundwater samples. Key water characteristics, including chlorine (Cl−), sodium (Na+), magnesium (Mg2+), calcium (Ca2+), potassium (K+), bicarbonate (HCO3), and water salinity (measured in deciSiemens per meter—dS/m), were among the parameters evaluated. The salinity of the water was determined using conductivity units, while chemical characteristics were expressed in milligrams per liter (mg/L) of water (see Figure 2).

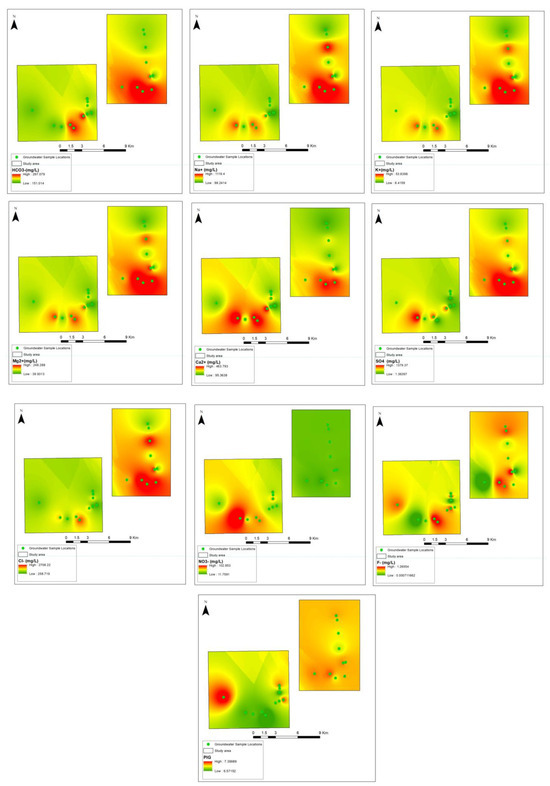
Figure 2.
Spatial visualization of input-output variables.
3. Methods
3.1. Random Forest (RF)
The ensemble learning method, RF is a powerful model. RF reduces overfitting and improves generalization through the use of several decision trees and a random selection of characteristics and data points [34]. The strength of the RF lies in its ability to capture complex relationships within the groundwater dataset, making it well-suited for predicting pollution index values [35]. However, the RF model’s predictions may lack interpretability. To address this, SHapley Additive exPlanations (SHAP) will be incorporated to explain the contributions of each feature in the RF model’s predictions, ensuring transparency and interpretability in the suitability assessment for drinking water resources. By integrating RF into this methodology, it should be able to provide accurate and reliable assessments of drinking water resource suitability [1]. This study sets the stage for more transparent and data-driven decision making in water resource management, underscoring RF’s significance as a valuable tool in addressing critical environmental and health challenges, particularly in regions such as Al-Hassa, Saudi Arabia, and worldwide.
RF is a powerful ensemble learning algorithm that has been employed in this study to predict the pollution index of groundwater. The RF algorithm consists of multiple decision trees that work together to provide accurate predictions [2]. Given a dataset of groundwater quality parameters (features), denoted as X, and the corresponding pollution index values (target variable), denoted as Y, the RF prediction can be formulated as follows:
where represents the prediction made by the random forest for the given input features X; N is the number of decision trees in the random forest ensemble; and represents the prediction made by the i-th decision tree in the ensemble for the input features X.
3.2. Decision Trees (DT)
By breaking down complex solutions into smaller, more manageable options, decision trees (DTs) organize them into a tree-like form [36]. DTs employ splits to choose characteristics that reduce entropy in order to provide accurate class assignments. To predict groundwater quality, decision trees (DTs) are employed as a fundamental component of this predictive modeling framework. A decision tree is a tree-like structure that recursively partitions the groundwater quality dataset based on feature attributes, leading to the prediction of the pollution index for drinking water resources [3]. Mathematically, a DT can be represented as:
where represents the prediction made by the decision tree for a given set of input features X; J is the number of terminal nodes or leaves in the decision tree; represents the region (leaf) in the feature space associated with leaf node j; is the constant value or prediction made within leaf node j; and is an indicator function that equals 1 if the input features X fall within the region , and 0 otherwise.
3.3. XGBoost (Extreme Gradient Boosting)
XGBoost is an optimized gradient-boosting algorithm that focuses on reducing errors iteratively. It builds decision trees sequentially, with each tree correcting the errors of the previous ones [37]. The XGBoost is a powerful gradient boosting algorithm that was also incorporated into this methodology to enhance the accuracy of the pollution index prediction for drinking water resources [38]. XGBoost works by training an ensemble of decision trees sequentially, optimizing for both model performance and interpretability [4]. Mathematically, the XGBoost prediction can be expressed as:
where represents the final prediction made by the XgBoost model for the input features X; N is the total number of decision trees in the ensemble; and denotes the prediction made by the i-th decision tree.
Herein, each is learned sequentially, with each tree aiming to correct the errors of the previous ones. This iterative process makes XgBoost highly accurate in predicting the pollution index. However, to ensure transparency and explainability in our suitability assessment, SHapley Additive exPlanations (SHAPs) were also integrated. SHAPs precisely assist in understanding the contributions of individual features to the XgBoost predictions, offering valuable insights into the groundwater quality factors that most strongly influence suitability assessments for drinking water resources. This combination of XgBoost and SHAP not only enhanced the accuracy of our predictions but also provided valuable explanations for informed decision making in managing drinking water resources.
3.4. CatBoost Algorithm
Gradient boosting decision tree (GBDT) algorithm improvements such as CatBoost [39] have great generality, high robustness, and efficient handling of a variety of data types. Additionally, less hyperparameter tinkering and unnecessary fitting probabilities are required. The gradient of the current model and a weak learner are determined by gradient training, which employs the same data set for each iteration of the typical GBDT technique. Similarly, CatBoost, a high-performance gradient-boosting algorithm, played a pivotal role in predicting the pollution index of groundwater. CatBoost excels in capturing intricate relationships within the groundwater dataset, leading to accurate predictions. However, to ensure that our predictions are interpretable and transparent, SHapley Additive exPlanations (SHAPs) were integrated. SHAPs enabled us to elucidate the impact of individual features on CatBoost’s predictions. Employing SHAP not only enhanced the accuracy of the suitability assessments for drinking water resources but also provided valuable insights into the underlying factors contributing to pollution, ultimately aiding stakeholders and decision-makers in making informed choices regarding groundwater resource management. The synergy between CatBoost and SHAP empowered the methodology with both predictive power and interpretability [5]. Mathematically, the CatBoost prediction can be formulated as:
where represents the final prediction made by the CatBoost model for the input features X; N is the total number of decision trees (boosting iterations) in the CatBoost ensemble; and denotes the prediction made by the i-th decision tree in the ensemble.
3.5. Linear Regression Model
A linear regression model was employed that provided transparency and interpretability, to understand the linear contributions of individual groundwater quality parameters to the pollution index. However, to account for potential nonlinearities and complex interactions within the data, linear regression with SHapley Additive exPlanations (SHAPs) was used. Herein, SHAP enabled us to capture and explain deviations from linearity in the model, ensuring that the suitability assessment is both accurate and comprehensible, thus facilitating informed decision making in managing drinking water resources. The combination of linear regression and SHAP enriched the methodology with the capability to capture linear and nonlinear effects for a more comprehensive understanding of groundwater suitability. This involved employing linear regression as a foundational model for understanding the linear relationships between groundwater quality parameters and the pollution index. It is a classical and interpretable machine learning model, which is a crucial component for predicting the pollution index of groundwater [6]. The linear regression model aimed to establish a linear relationship between the input groundwater quality features, denoted as X, and the pollution index, represented as Y, through the following equation:
where Y represents the pollution index, which we seek to predict; , , … are the groundwater quality parameters considered as features; is the intercept term, and and are the coefficients associated with each feature, indicating their linear impact on the pollution index; and ϵ represents the error term, accounting for the variability in Y not explained by the linear relationship.
3.6. Support Vector Machines (SVMs)
Support vector machines (SVMs), known for their ability to handle both linear and nonlinear relationships, played a critical role in this study for predicting the pollution index of groundwater. The SVMs aimed to find a hyperplane that best separates the groundwater quality features denoted as X into distinct classes or levels of pollution. SVM provided a robust approach for predicting the groundwater pollution index while being capable of handling complex, nonlinear relationships. Integration of SHAP herein enabled us to explain the contributions of individual groundwater quality parameters to the SVM predictions, ensuring that the suitability assessment is not only accurate but also comprehensible, thus facilitating informed decision making in managing drinking water resources. The combination of SVM and SHAP enriched the methodology with both predictive power and interpretability, making it a valuable tool for groundwater resource management [7]. The prediction made by SVM can be expressed as:
where represents the prediction made by the SVM model for the input groundwater quality features X; N is the number of support vectors, which are the data points closest to the decision boundary; represents the Lagrange multipliers associated with each support vector; is the class label of the i-th support vector; is the kernel function that measures the similarity between the input features X and the i-th support vector ; and b is the bias term, which shifts the decision boundary away from the origin.
3.7. Performance Validation and Data Processing
The crucial mechanisms in constructing models prior to the tuning algorithms and modelling involve a convergence on reliability of the data and an analysis of uncertainty, especially when dealing with a small data sample. Reliability analysis is essential in numerical modelling and data-mining methods, with a specific emphasis on dependency analysis. Reliability analysis has been employed in both scientific and engineering contexts to decipher the relationships and resilience of separate input variables towards desired results. For instance, some researchers, such as [40,41], have gauged stability through both linear and nonlinear feature sensitivity analyses.
It is vital to highlight that the efficacy of any complex process is dependent upon the sensitive input variables applied to the system, analogous to those in data-mining models. Given that many relationships are nonlinear, advocating for nonlinear sensitivity becomes imperative. With recent criticisms of correlation methods in selecting suitable input variables, numerous scientists and researchers have transitioned to nonlinear sensitivity methodologies. The data from the field sample and experimental laboratory were divided into 70:30 for training and testing phases, and the performance evaluation indicators are presented in Table 1. The input variables combination is presented in Figure 3. Effective data processing ensures accuracy, relevance, and interpretability, opening the way for informed decision making and optimized outcomes. As mentioned above, 10-fold cross-validation is a technique in ML used to assess the performance of predictive models. The original dataset is randomly split into 10 roughly equal subsets or folds as presented. The model selection and 10-fold cross-validation helps navigate the bias–variance trade-off, potentially introducing slight bias since each training set has only 90% of the data, but significantly reducing variance in model evaluation. Similarly, normalization was conducted prior to model development.

Table 1.
Formulas of different performance measures.

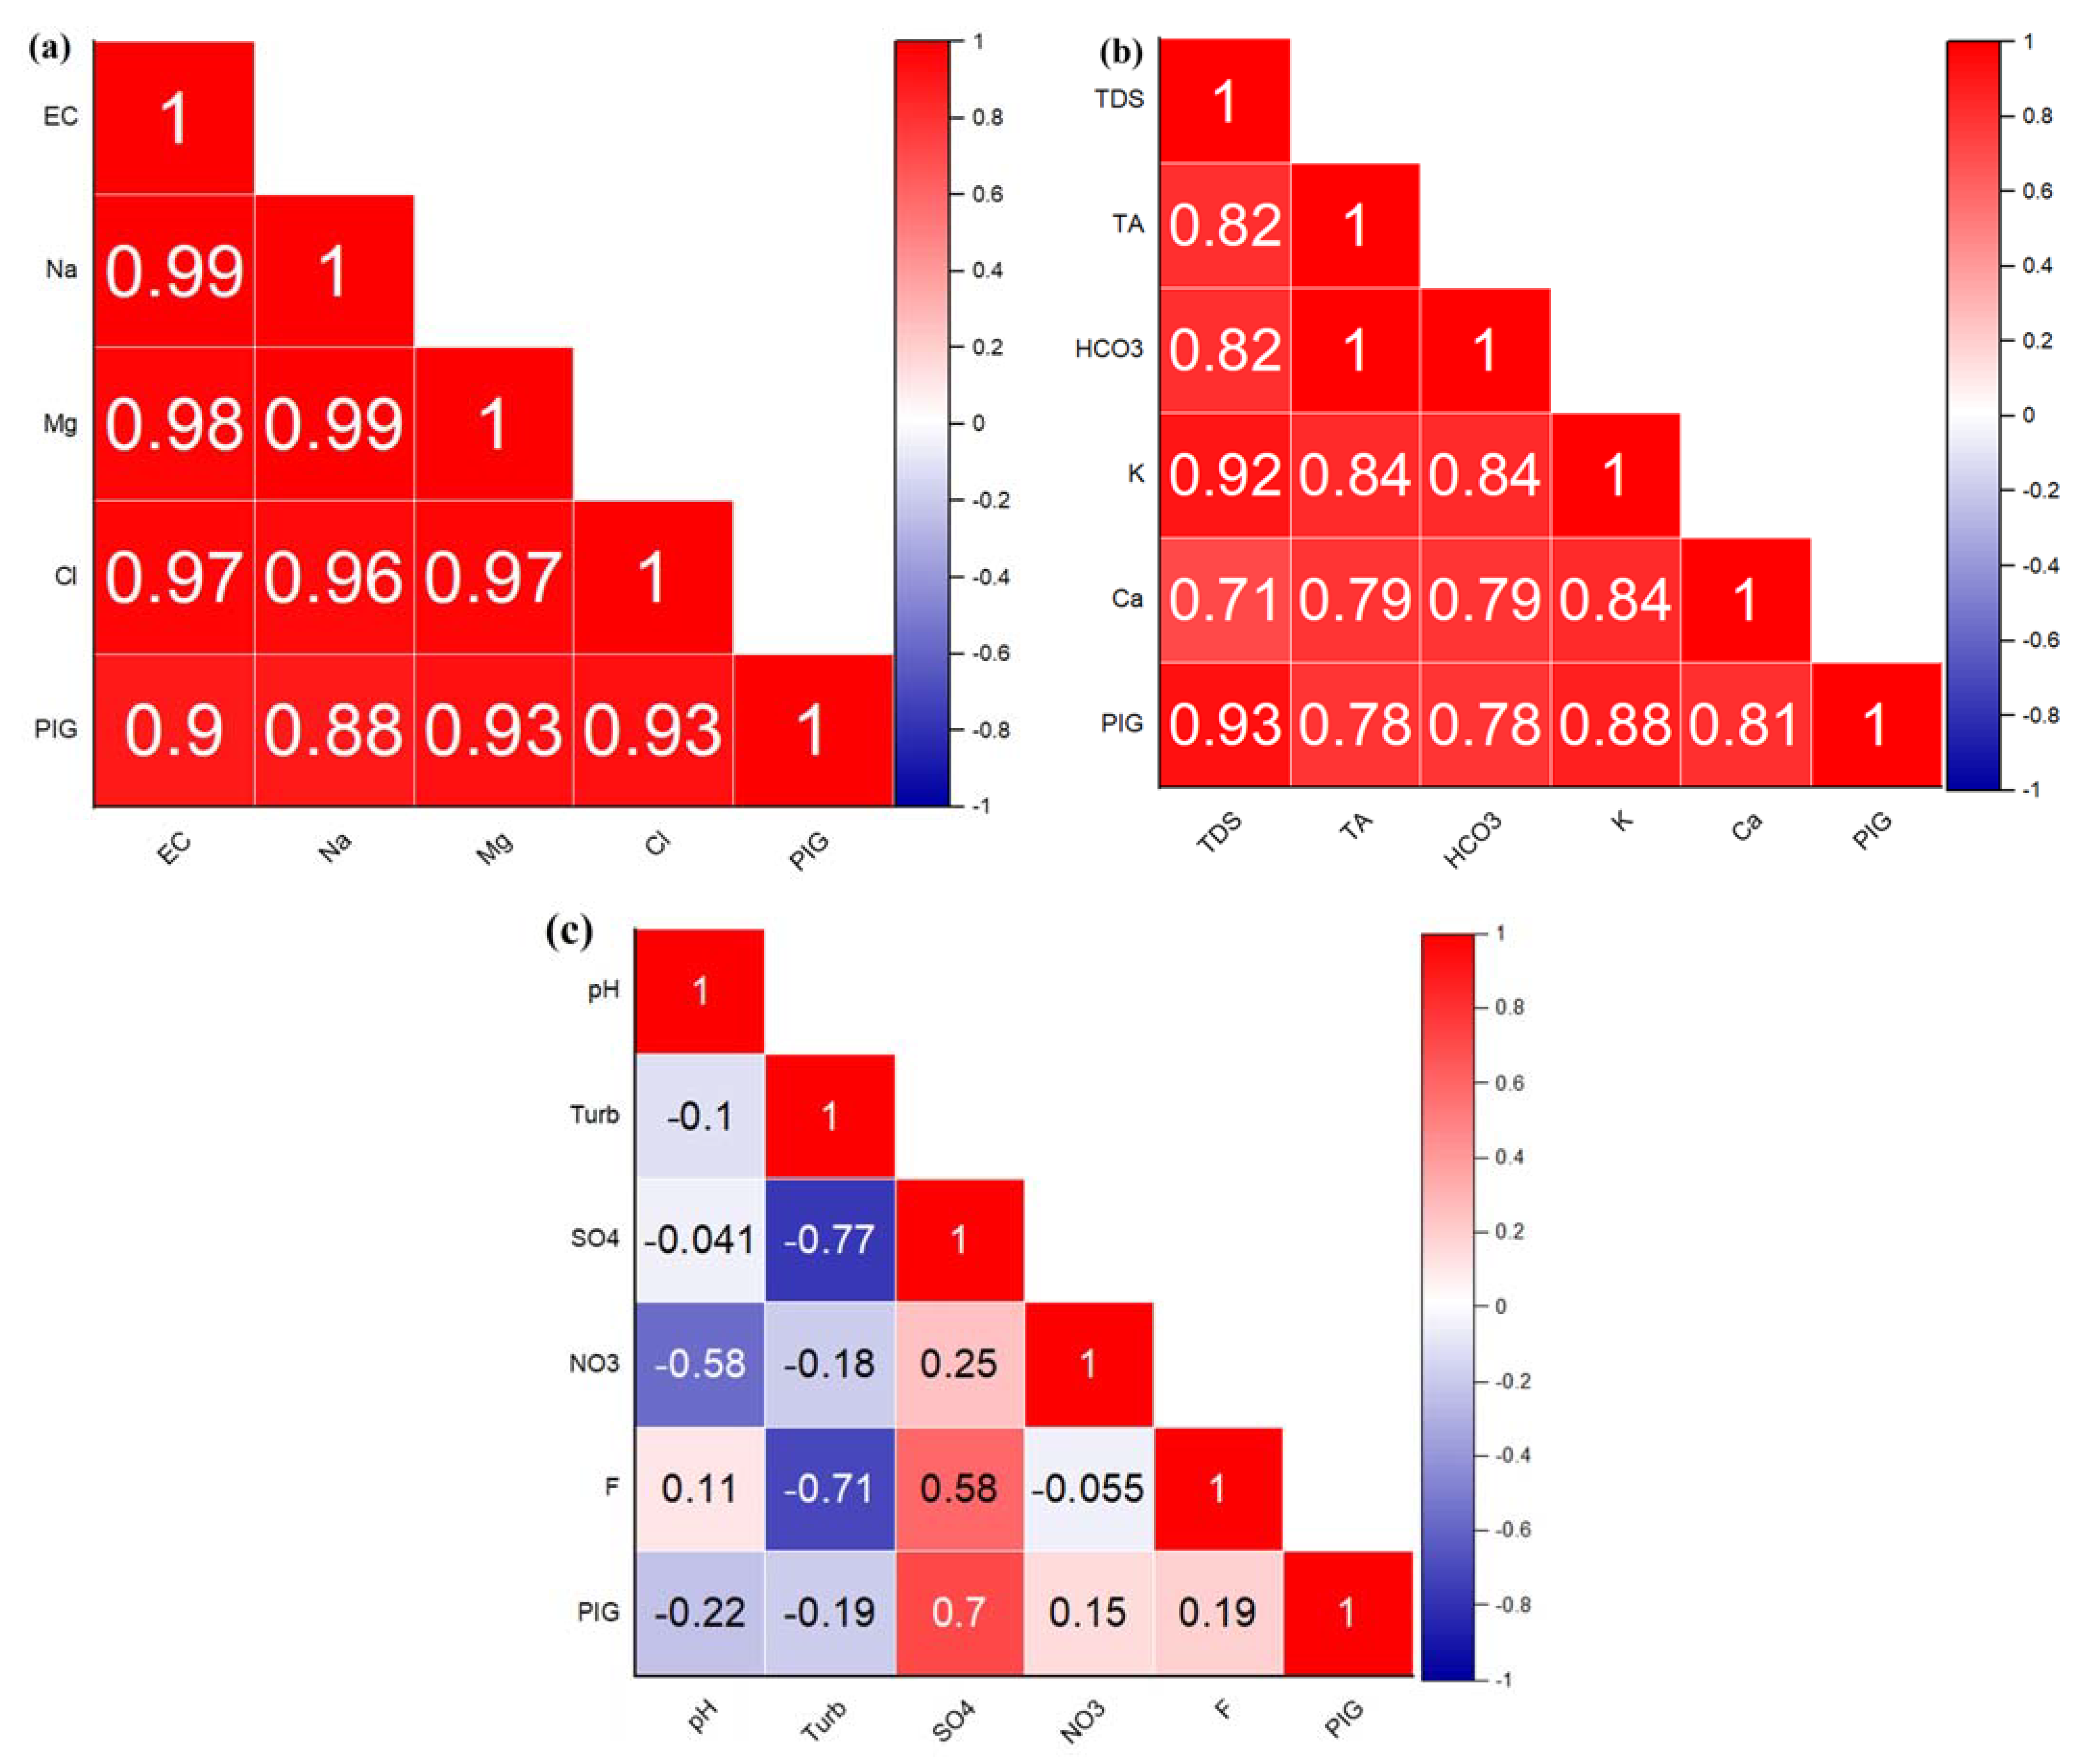
Figure 3.
Combination of computed input variables (a) C1, (b) C2, and (c) C3.
4. Application of Results
In this section, the modeling results and visualization are presented based on the set objectives. Leveraging emerging data-driven AI and IoT technologies would change the perceptions of groundwater resources. The major important result in this section is accessing the input variable combinations; for instance, PIG was determined using three different combinations: C1 = EC + Na + Mg + Cl; C2 = TDS + TA + HCO3 + K + Ca; and C3 = SO4 + pH + NO3 + F + Turb (see Figure 3). With low MAE, MSE, and a high R2 value, RF-C1 performed exceptionally well throughout the training phase. Strong prediction accuracy was shown, demonstrating a very good match to the training data. While MAE and MSE were slightly higher, MAE values, MSE values, and RF-C1 still attained a high R2 value of 97%, indicating its ability to make correct predictions on test data. Similarly, DT-C1, with the lowest MAE, MSE, and highest R2, demonstrated impressive accuracy in the training phase, demonstrating an optimal fit to the training data. While XGBoost-C1 had outstanding accuracy in the training phase with close to zero MAE, zero MSE, and a flawless R2 score, DT-C1 continued to surprise in the testing phase with fair MAE, MSE, and R2 values of 99%. XGBoost-C1 in the testing set achieved almost zero MAE and MSE and optimal R2.
While CatBoost-C1 showed outstanding performance in the training phase, with low MAE, zero MSE, and a nearly flawless R2 value, XGBoost-C1 displayed strong performance in the testing phase. Similarly, CatBoost-C1 in the training phase achieved zero MSE. Throughout testing, CatBoost-C1 achieved a goodness of fit around 99%, demonstrated its consistent performance and its capacity to sustain accuracy on test data. SVR-C1 shows respectable performance, with a moderate MAE, MSE, and a relatively high R2 in the training phase. In the testing phase, SVR-C1 maintained a respectable level of accuracy for MAE, MSE, and R2 value, despite a modest reduction in R2. With low MAE and MSE and a high R2 value, LR-C1 performed well throughout the training phase with values of 93%. With an R2 of 92%, and high MAE and MSE, the LR-C1 showed good performance throughout testing (Table 2).
Table 2.
Results of training phase for PIG.
Further numerical analysis and comparison are presented in Figure 3. For example, Figure 3a for C1 displays strong positive correlations between various variables and PIG, with Mg and Cl showing the highest correlations at 0.93. Almost all pairs of variables exhibit robust intercorrelations, primarily above 0.9, suggesting significant relationships among them. This intense intercorrelation could imply potential multicollinearity concerns if these variables were simultaneously used in a predictive model for PIG. Figure 3b highlights the correlation strengths between various variables and PIG, with TDS showing the highest correlation at 0.93. Among the other variables, K and Ca demonstrate notable correlations with PIG, registering at 0.88 and 0.81, respectively. The variables exhibit substantial intercorrelations, with many values above 0.8, indicating significant relationships. However, Figure 3c indicated that the SO4 variable exhibits the most significant positive correlation with PIG at 0.7. However, many variables show weak or even negative correlations with PIG, such as pH and NO3, with values of −0.22 and 0.15, respectively. Furthermore, there are notable negative correlations between some variables, such as between Turb and SO4 at −0.77. Overall, while some variables, such as SO4, show a stronger relationship with PIG, others display weak or negligible correlations, implying a varied influence on the PIG variable.
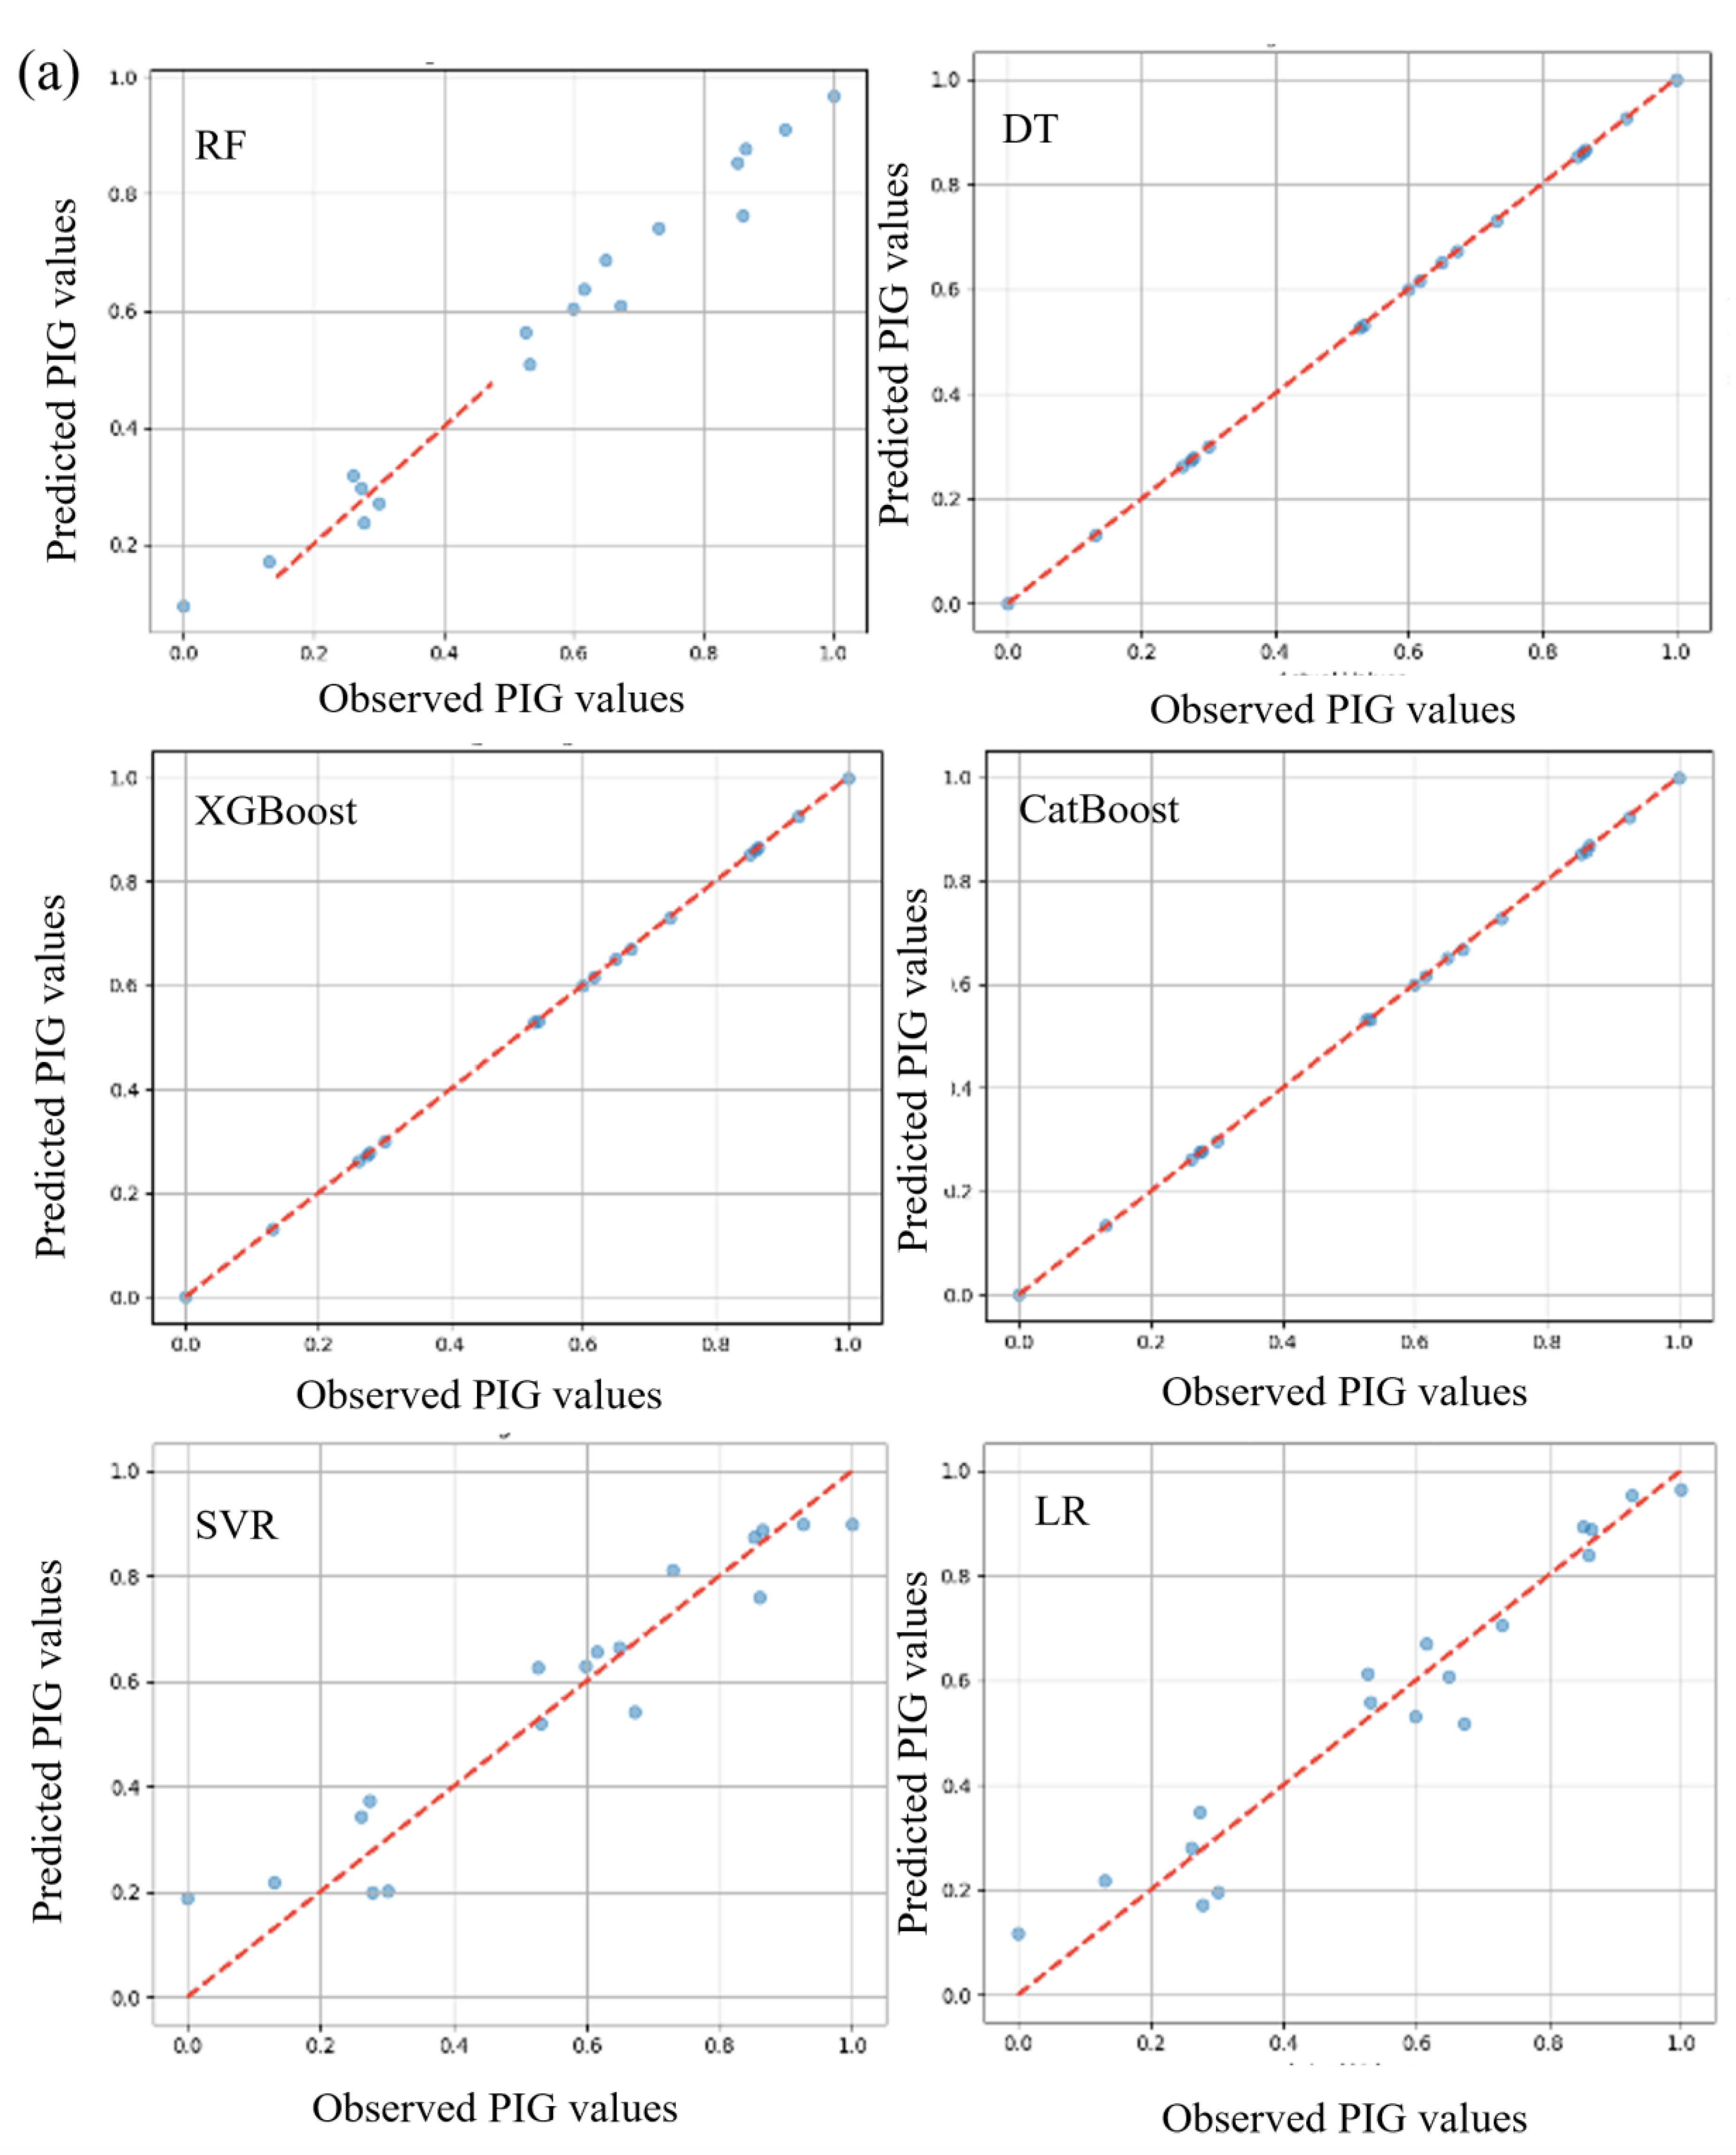
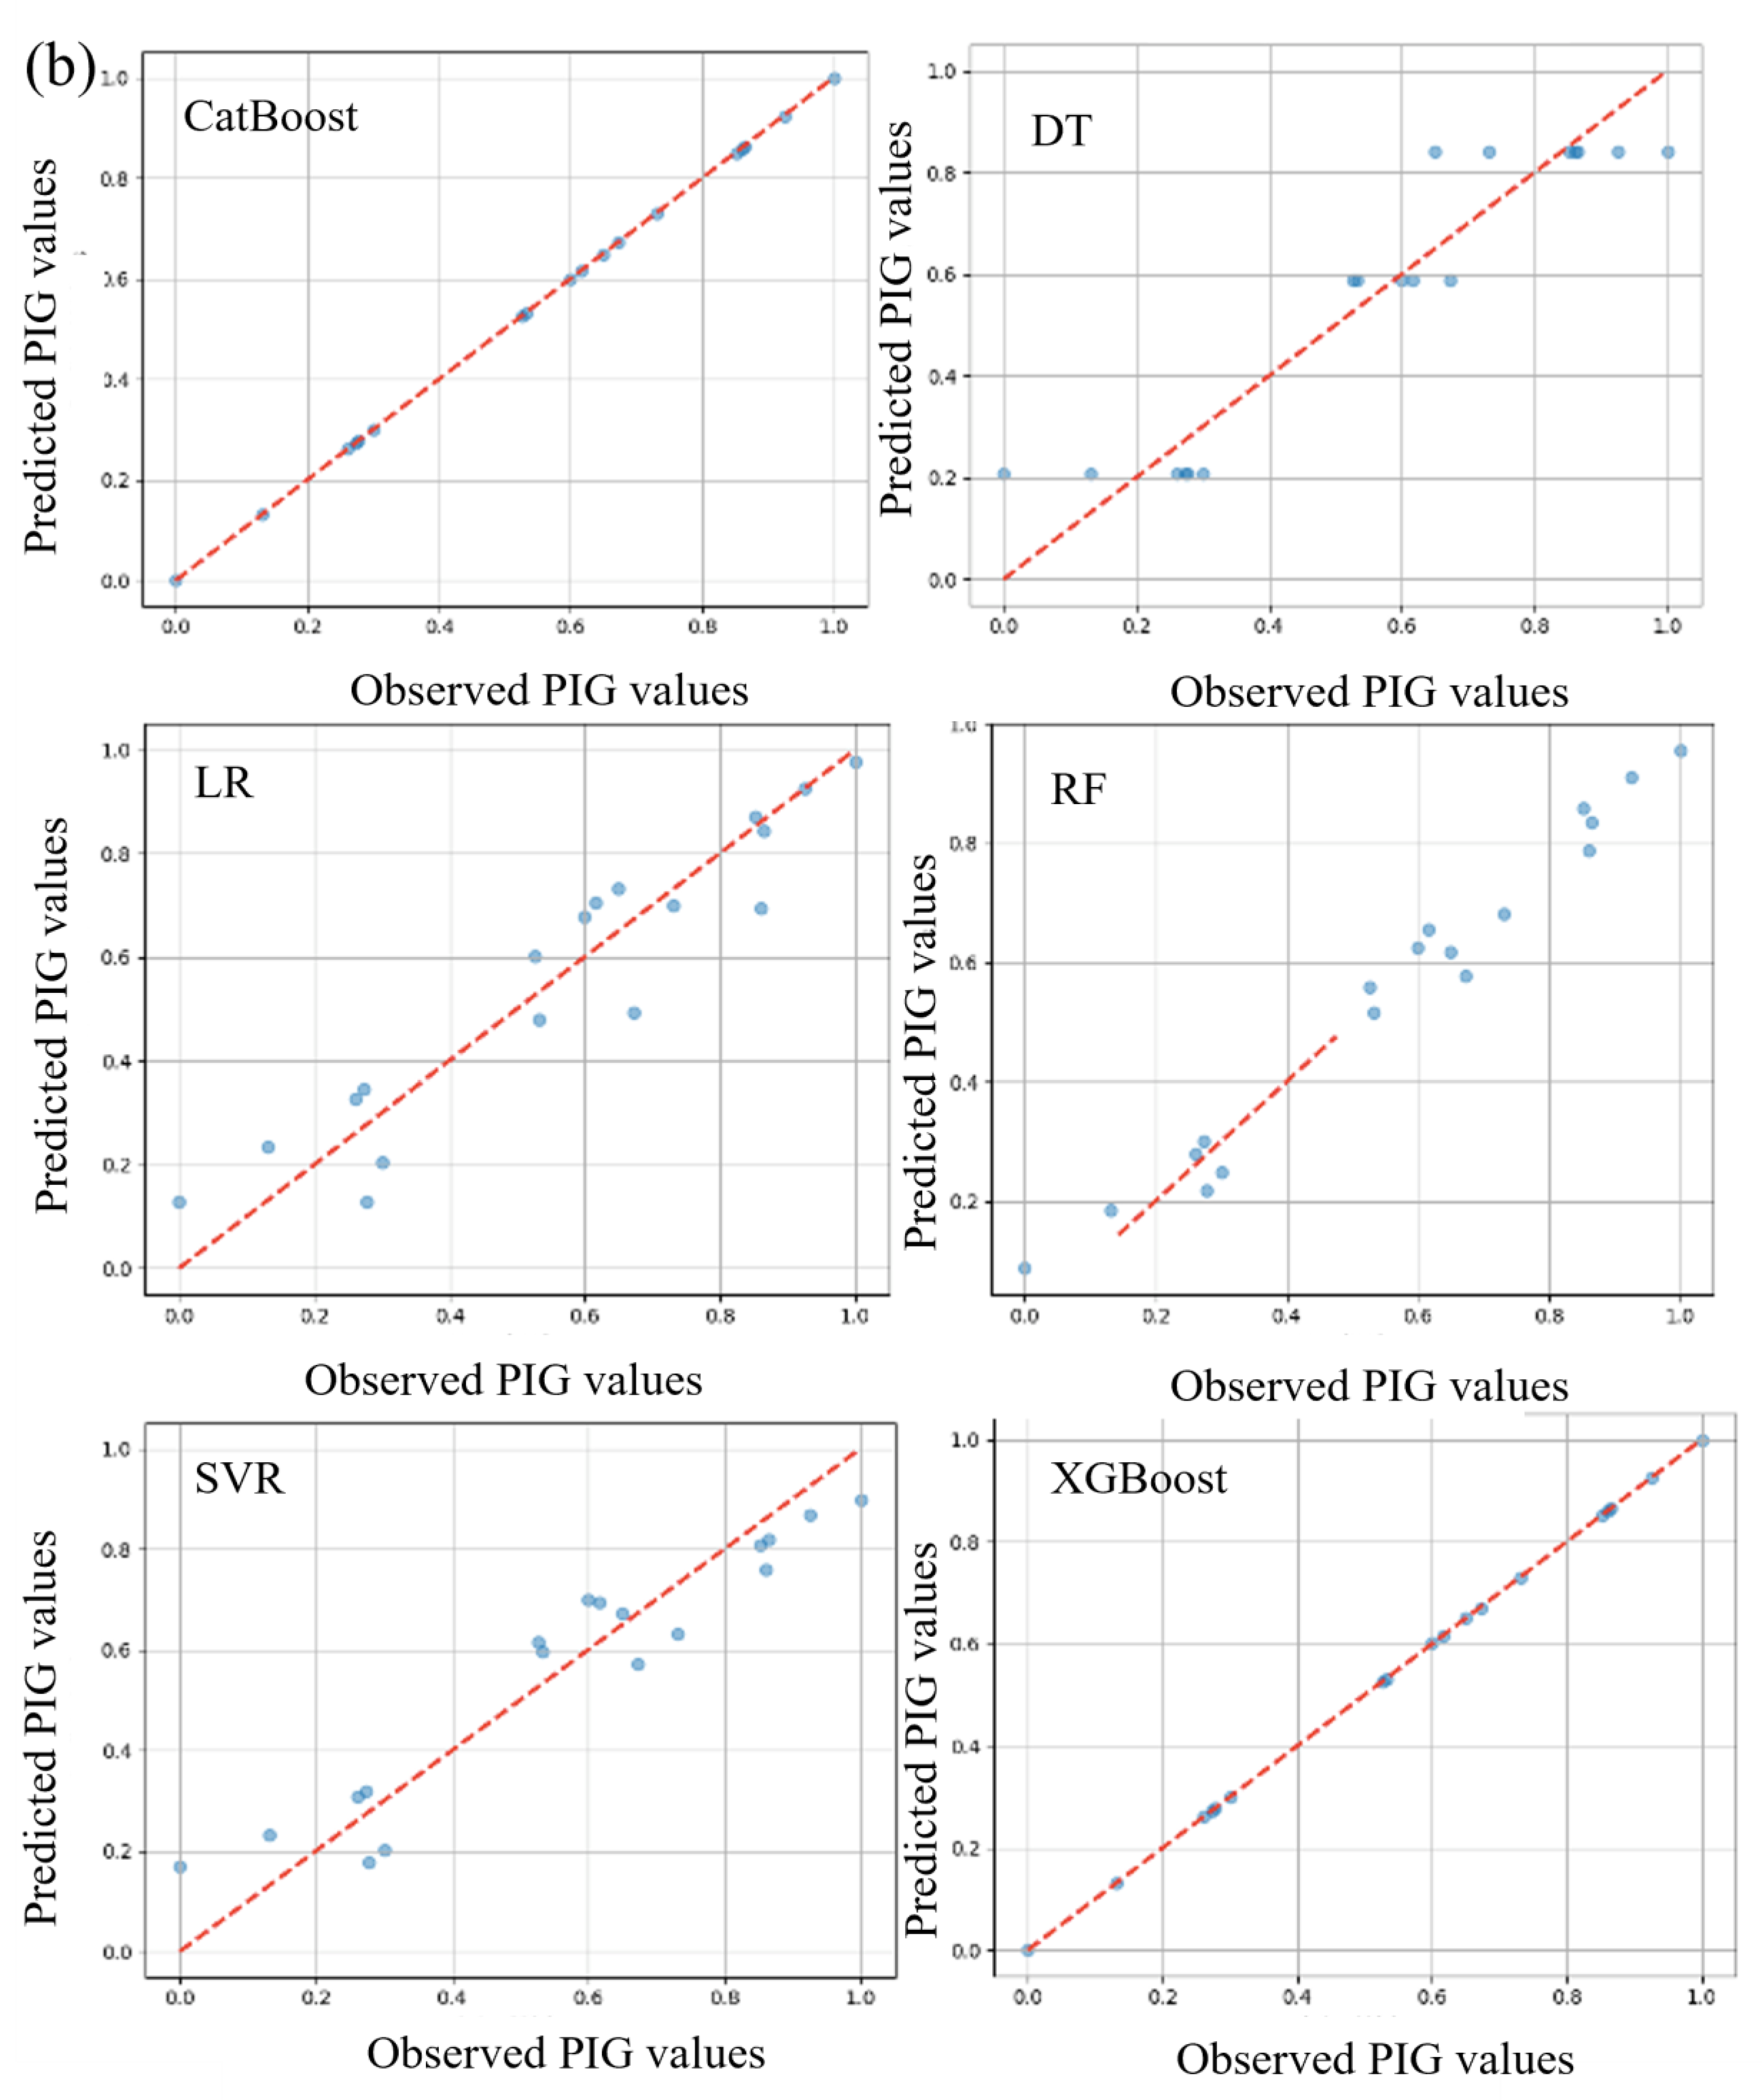
Quantitative analysis and discussion of evaluation criteria indicated that the various algorithms, namely RF-C1, DT-C1, XGBoost-C1, CatBoost-C1, SVR-C1, and LR-C1, showed distinctive results. DT-C1 and XGBoost-C1 exhibited seemingly impeccable performances during training, with both MAE and MSE nearing zero and R2 values touching perfection, albeit raising potential flags for overfitting that require further investigation. Contrastingly, RF-C1 demonstrated a notable performance, albeit with marginally higher MAE and MSE, but still preserving a high R2 value, underscoring its predictive aptitude on test data. Similarly, CatBoost-C1 manifested an impressive, consistent performance across training and testing phases, emerging as a potentially stable and reliable model, with minimal deviation in predictive accuracy, as evidenced by its very high R2 values and low error rates. On a different note, SVR-C1 and LR-C1, while not mirroring the striking precision of certain aforementioned models, still presented respectable, consistent results, showcasing their steady, reliable predictive capabilities. Consequently, while certain models such as DT-C1 and XGBoost-C1 hint at unparalleled precision, it is imperative to delve deeper into further validations and checks, such as cross-validation and regularization, to ensure their genuine, robust applicability in diverse datasets, thereby safeguarding against potential overfitting and securing generalized, reliable predictive performances. The scatter plot is presented in Figure 4 showing the observed and predicted value.

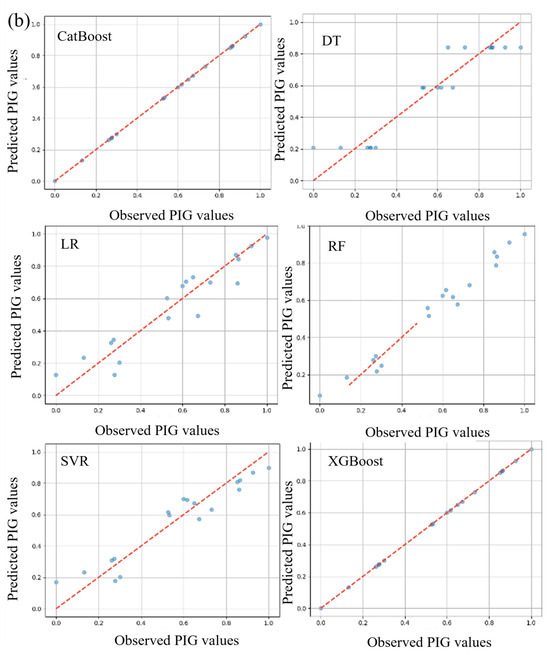
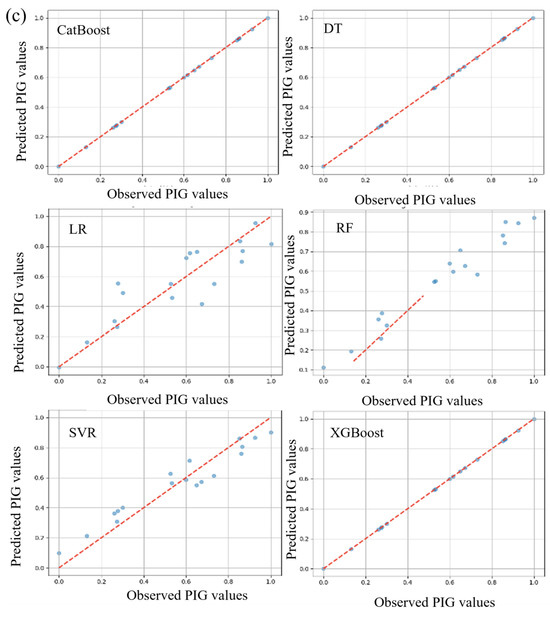
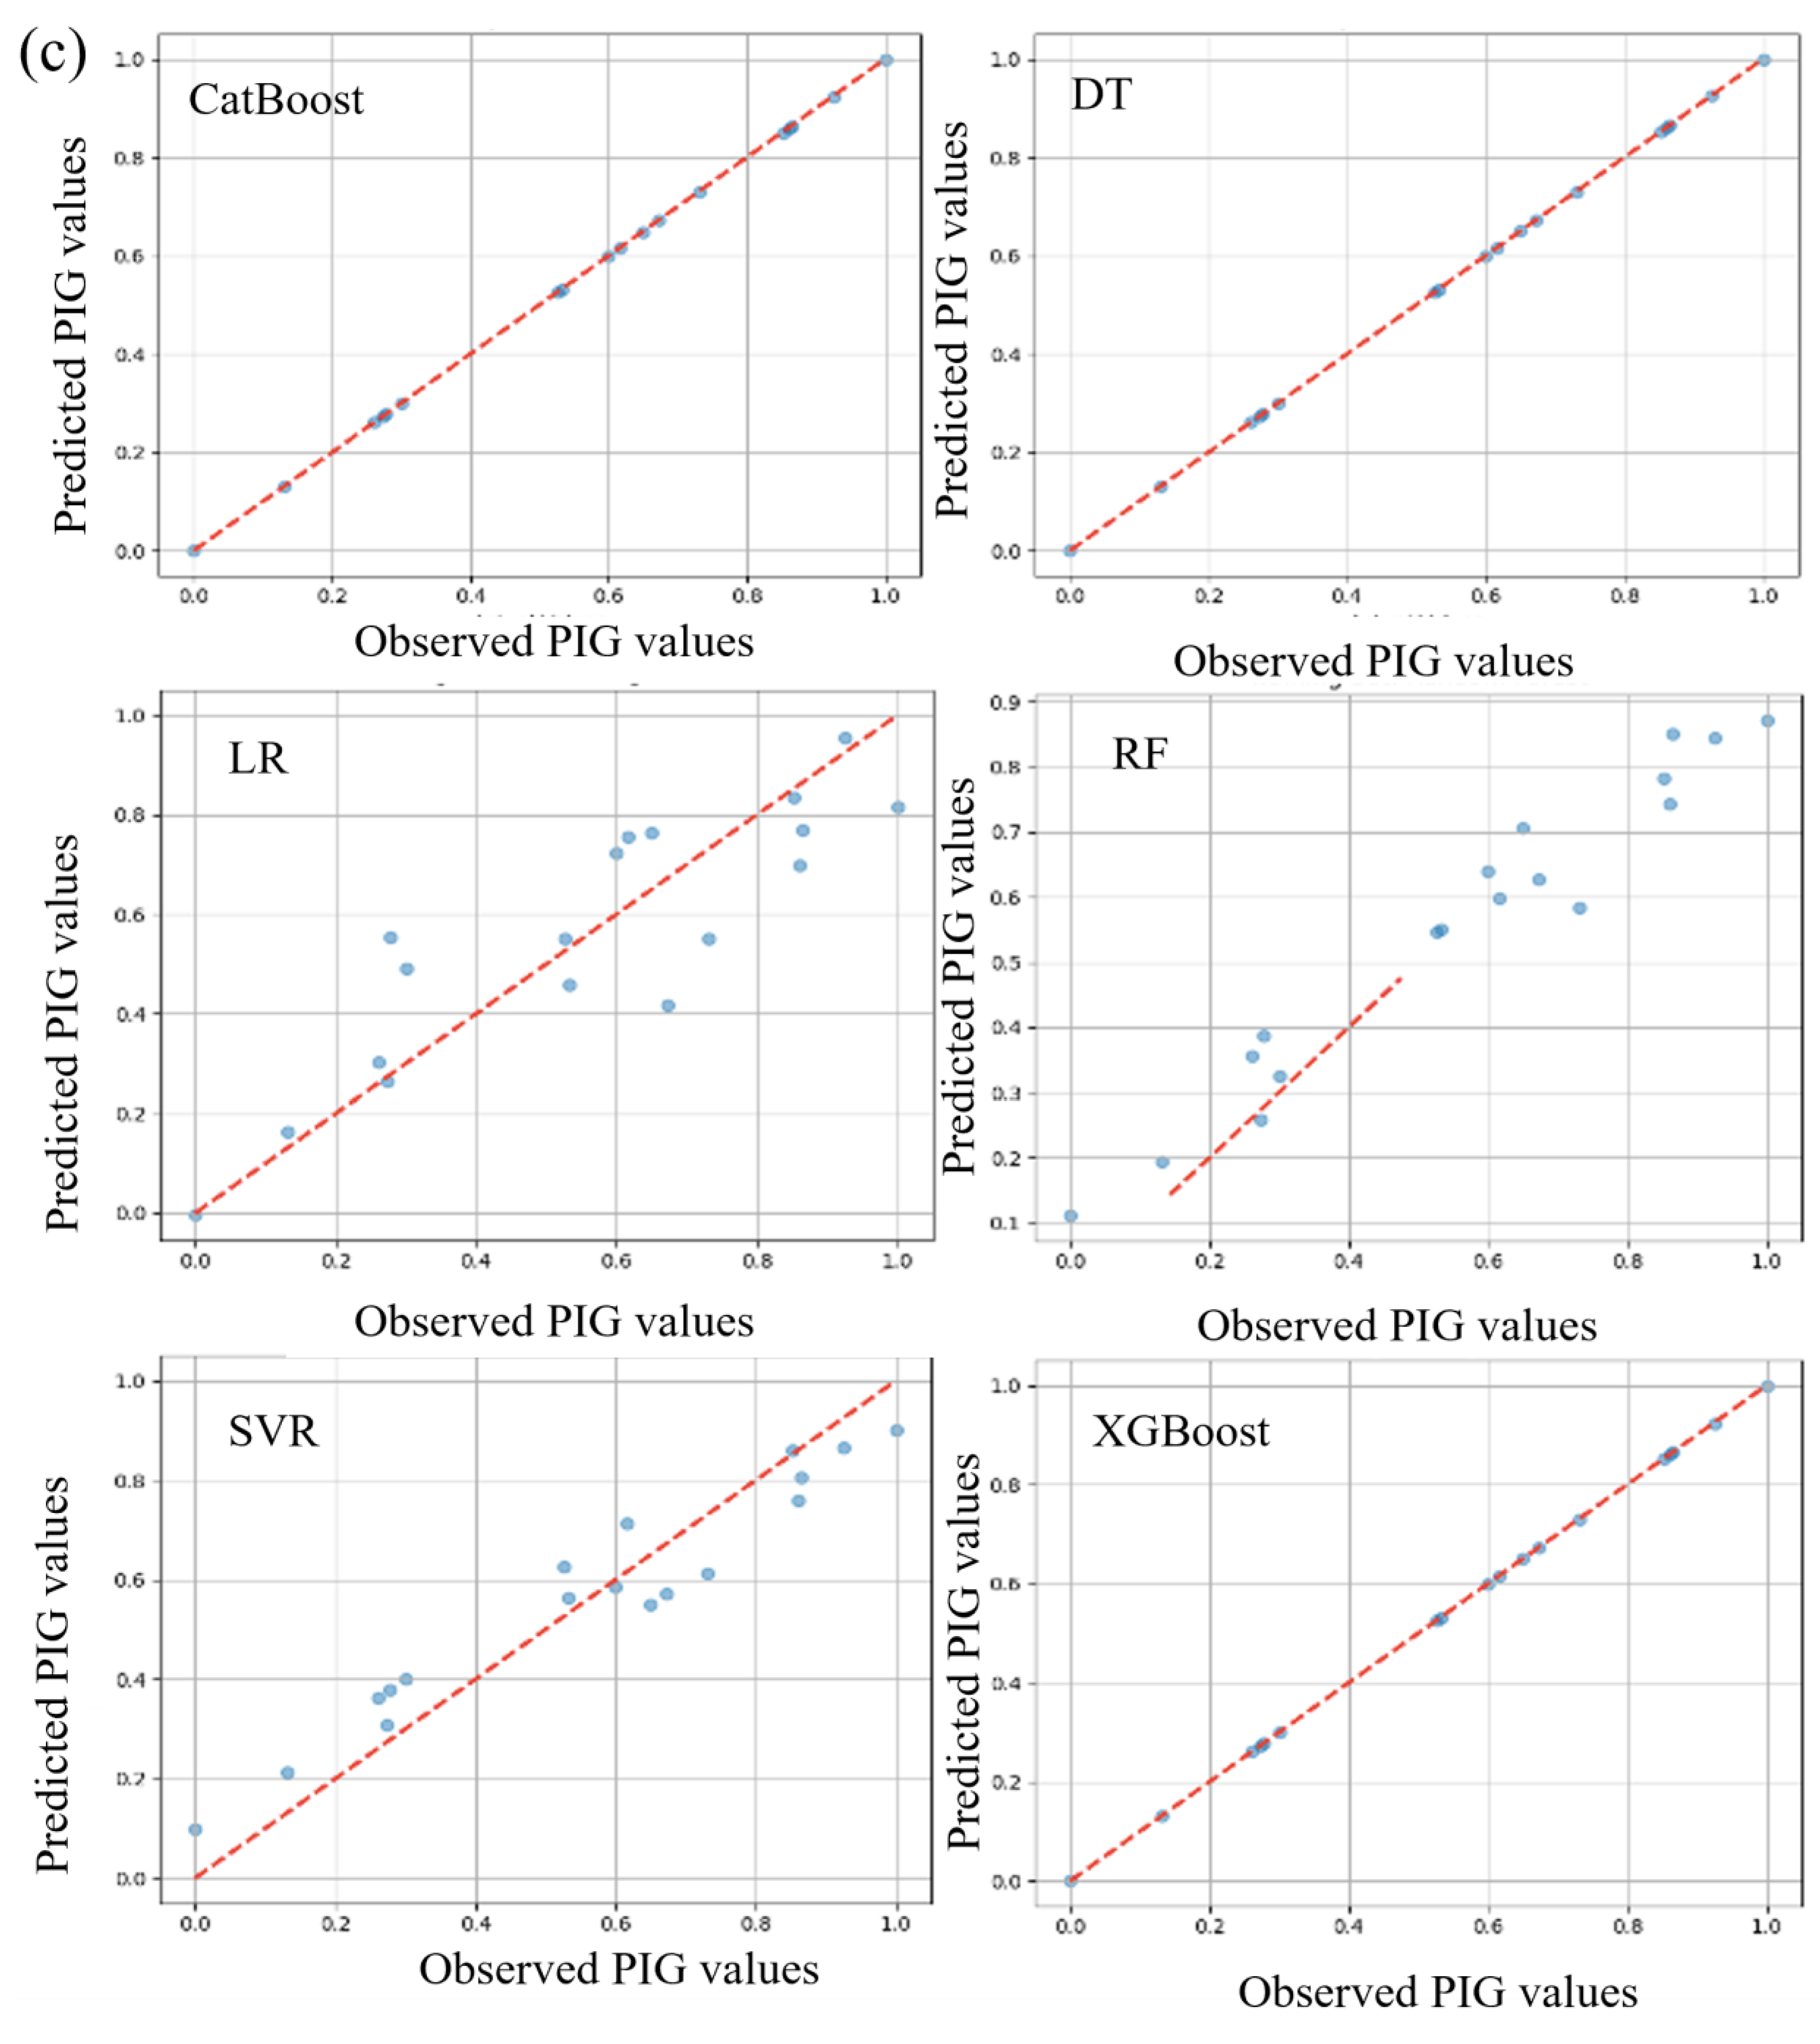
Figure 4.
Scatter plot between the observed and computed value: (a) combo-1, (b) combo-2, and (c) combo-3.
In the training phase, RF-C2 demonstrated great performance with low MAE and MSE and a high R2 value, indicating a good fit to the data. During testing, it achieved commendable metrics, emphasizing its effectiveness. DT-C2, both in training and testing, maintained its respectable performance with noteworthy MAE, MSE, and R2 values. XGBoost-C2 showed outstanding accuracy throughout the training phase and demonstrated consistent performance in the testing phase. CatBoost-C2 consistently performed well in the training phase, with a perfect R2 value and low MAE and MSE. During testing, CatBoost-C2 reaffirmed its excellence and capacity to sustain accuracy on test data. SVR-C2, during both the training and testing phases, achieved respectable R2 values, along with moderate MAE and MSE. LR-C2 displayed stability and accuracy across both phases with appropriate metrics, demonstrating its reliability. RF-C3 provided a good fit to the data in the training phase with impressive metrics and maintained its performance in the testing phase. DT-C3 demonstrated an ideal fit to the training data, achieving near-perfect accuracy. XGBoost-C3 maintained its impressive performance throughout both the training and testing phases. CatBoost-C3 showed remarkable performance during training and maintained its excellence during testing. SVR-C3 performed admirably in the training phase and maintained its accuracy in the testing phase, emphasizing its stability and predictive capacity. Lastly, LR-C3 had an acceptable fit to the training data and showed consistent results during testing. The testing results of these models are presented in Table 3. In the testing phase, RF-C1 achieved an R2 of 97.54%, and DT-C1 and XGBoost-C1 led with an R2 of 99.5%, closely followed by CatBoost-C1 at 99.49%. SVR-C1 and LR-C1 secured 90.34% and 92.89%, respectively. For the C2, RF-C2 attained 96.73%, and DT-C2 had 88.2%, while XGBoost-C2 and CatBoost-C2 both peaked at 99.6%. SVR-C2 and LR-C2 registered 90.11% and 88.74%. In C3, RF-C3 reached 92.27%, and DT-C3, XGBoost-C3, and CatBoost-C3 all impressively tied at 99.7%, with SVR-C3 at 90.86% and LR-C3 lagging at 76.8%. Models such as DT-C1, XGBoost-C1, XGBoost-C2, CatBoost-C2, DT-C3, XGBoost-C3, and CatBoost-C3 showcased their performance with R2 values nearing or exceeding 99.5%, while LR-C3 had the lowest performance criteria.
Table 3.
Results of testing phase for PIG.
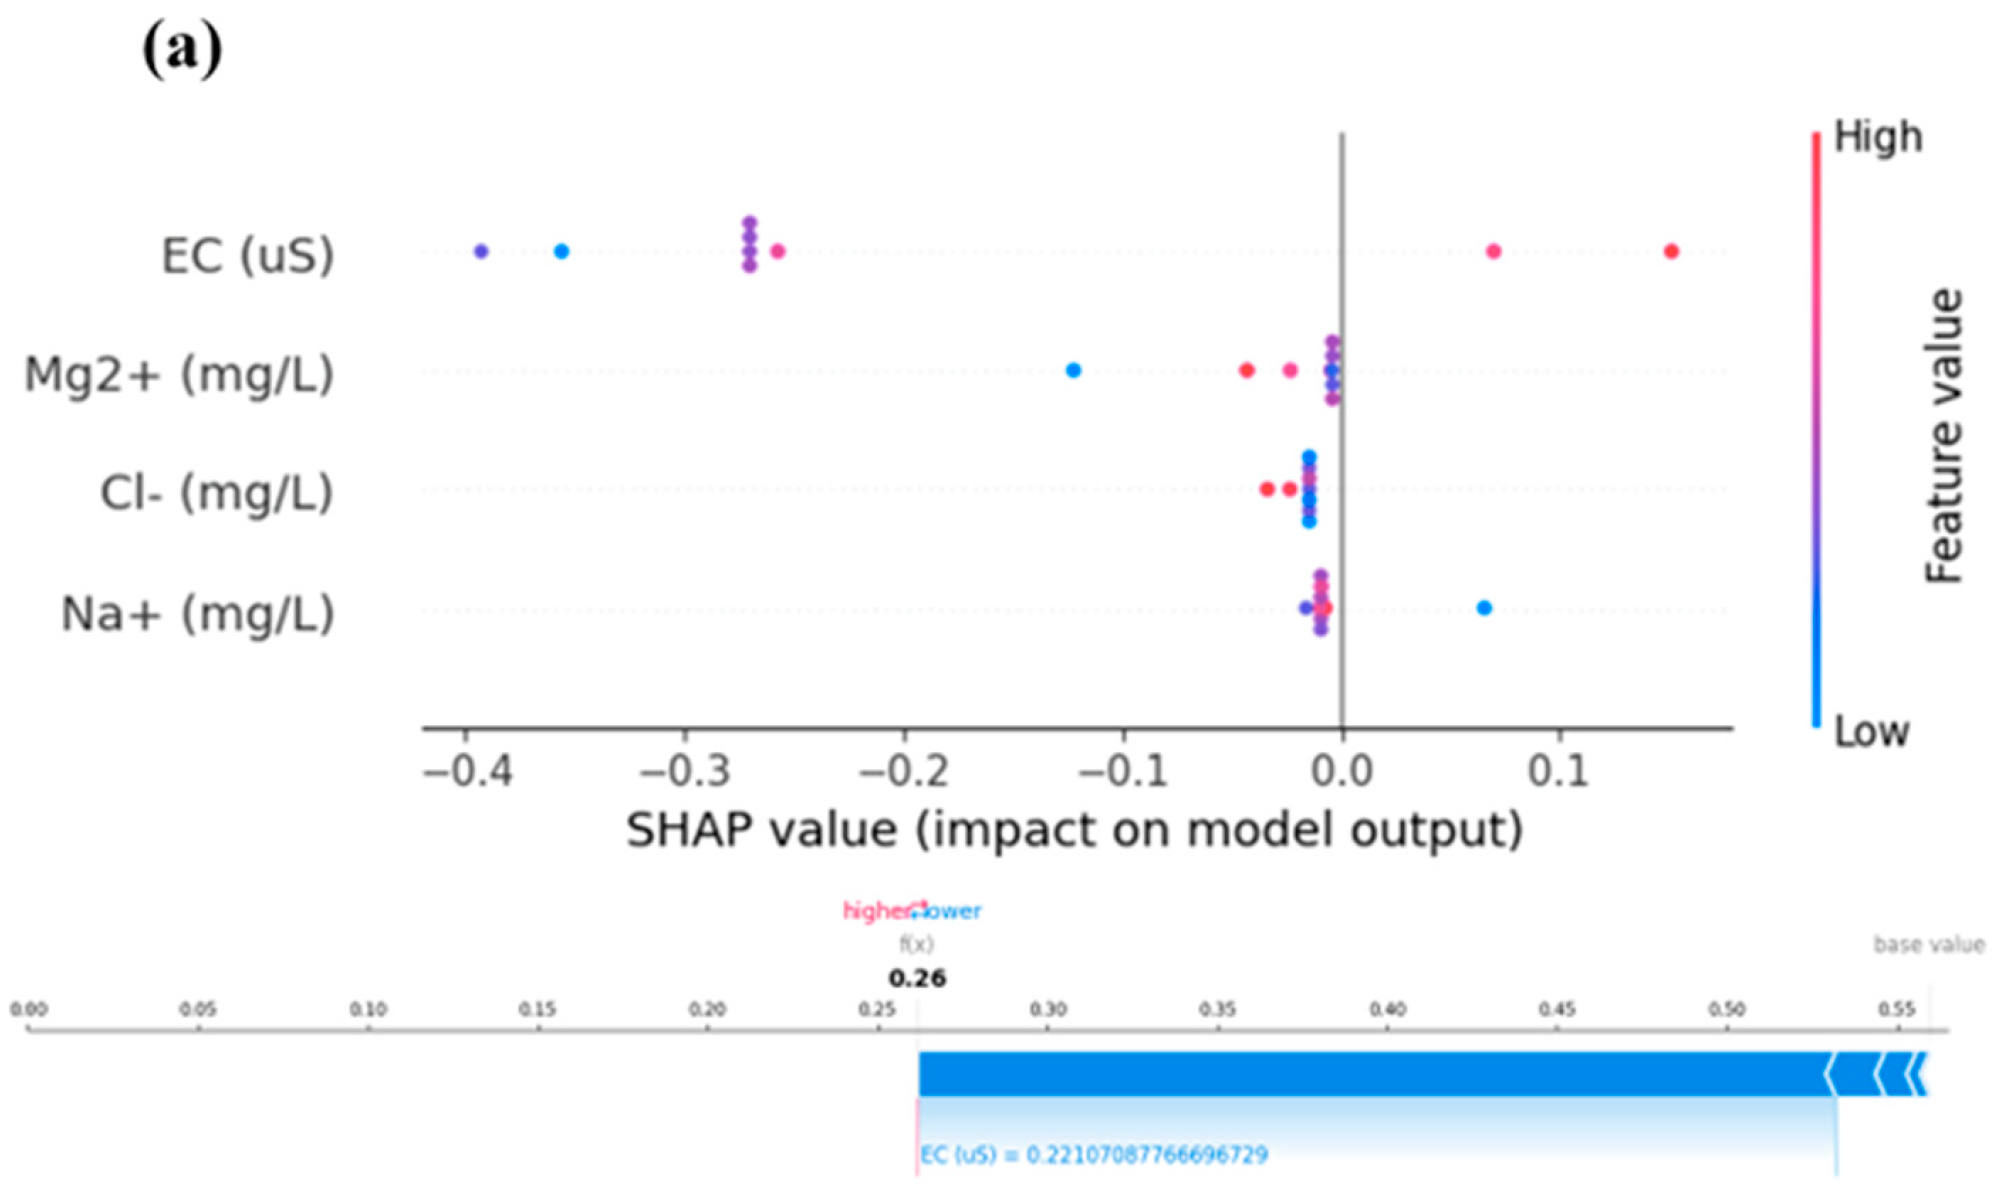
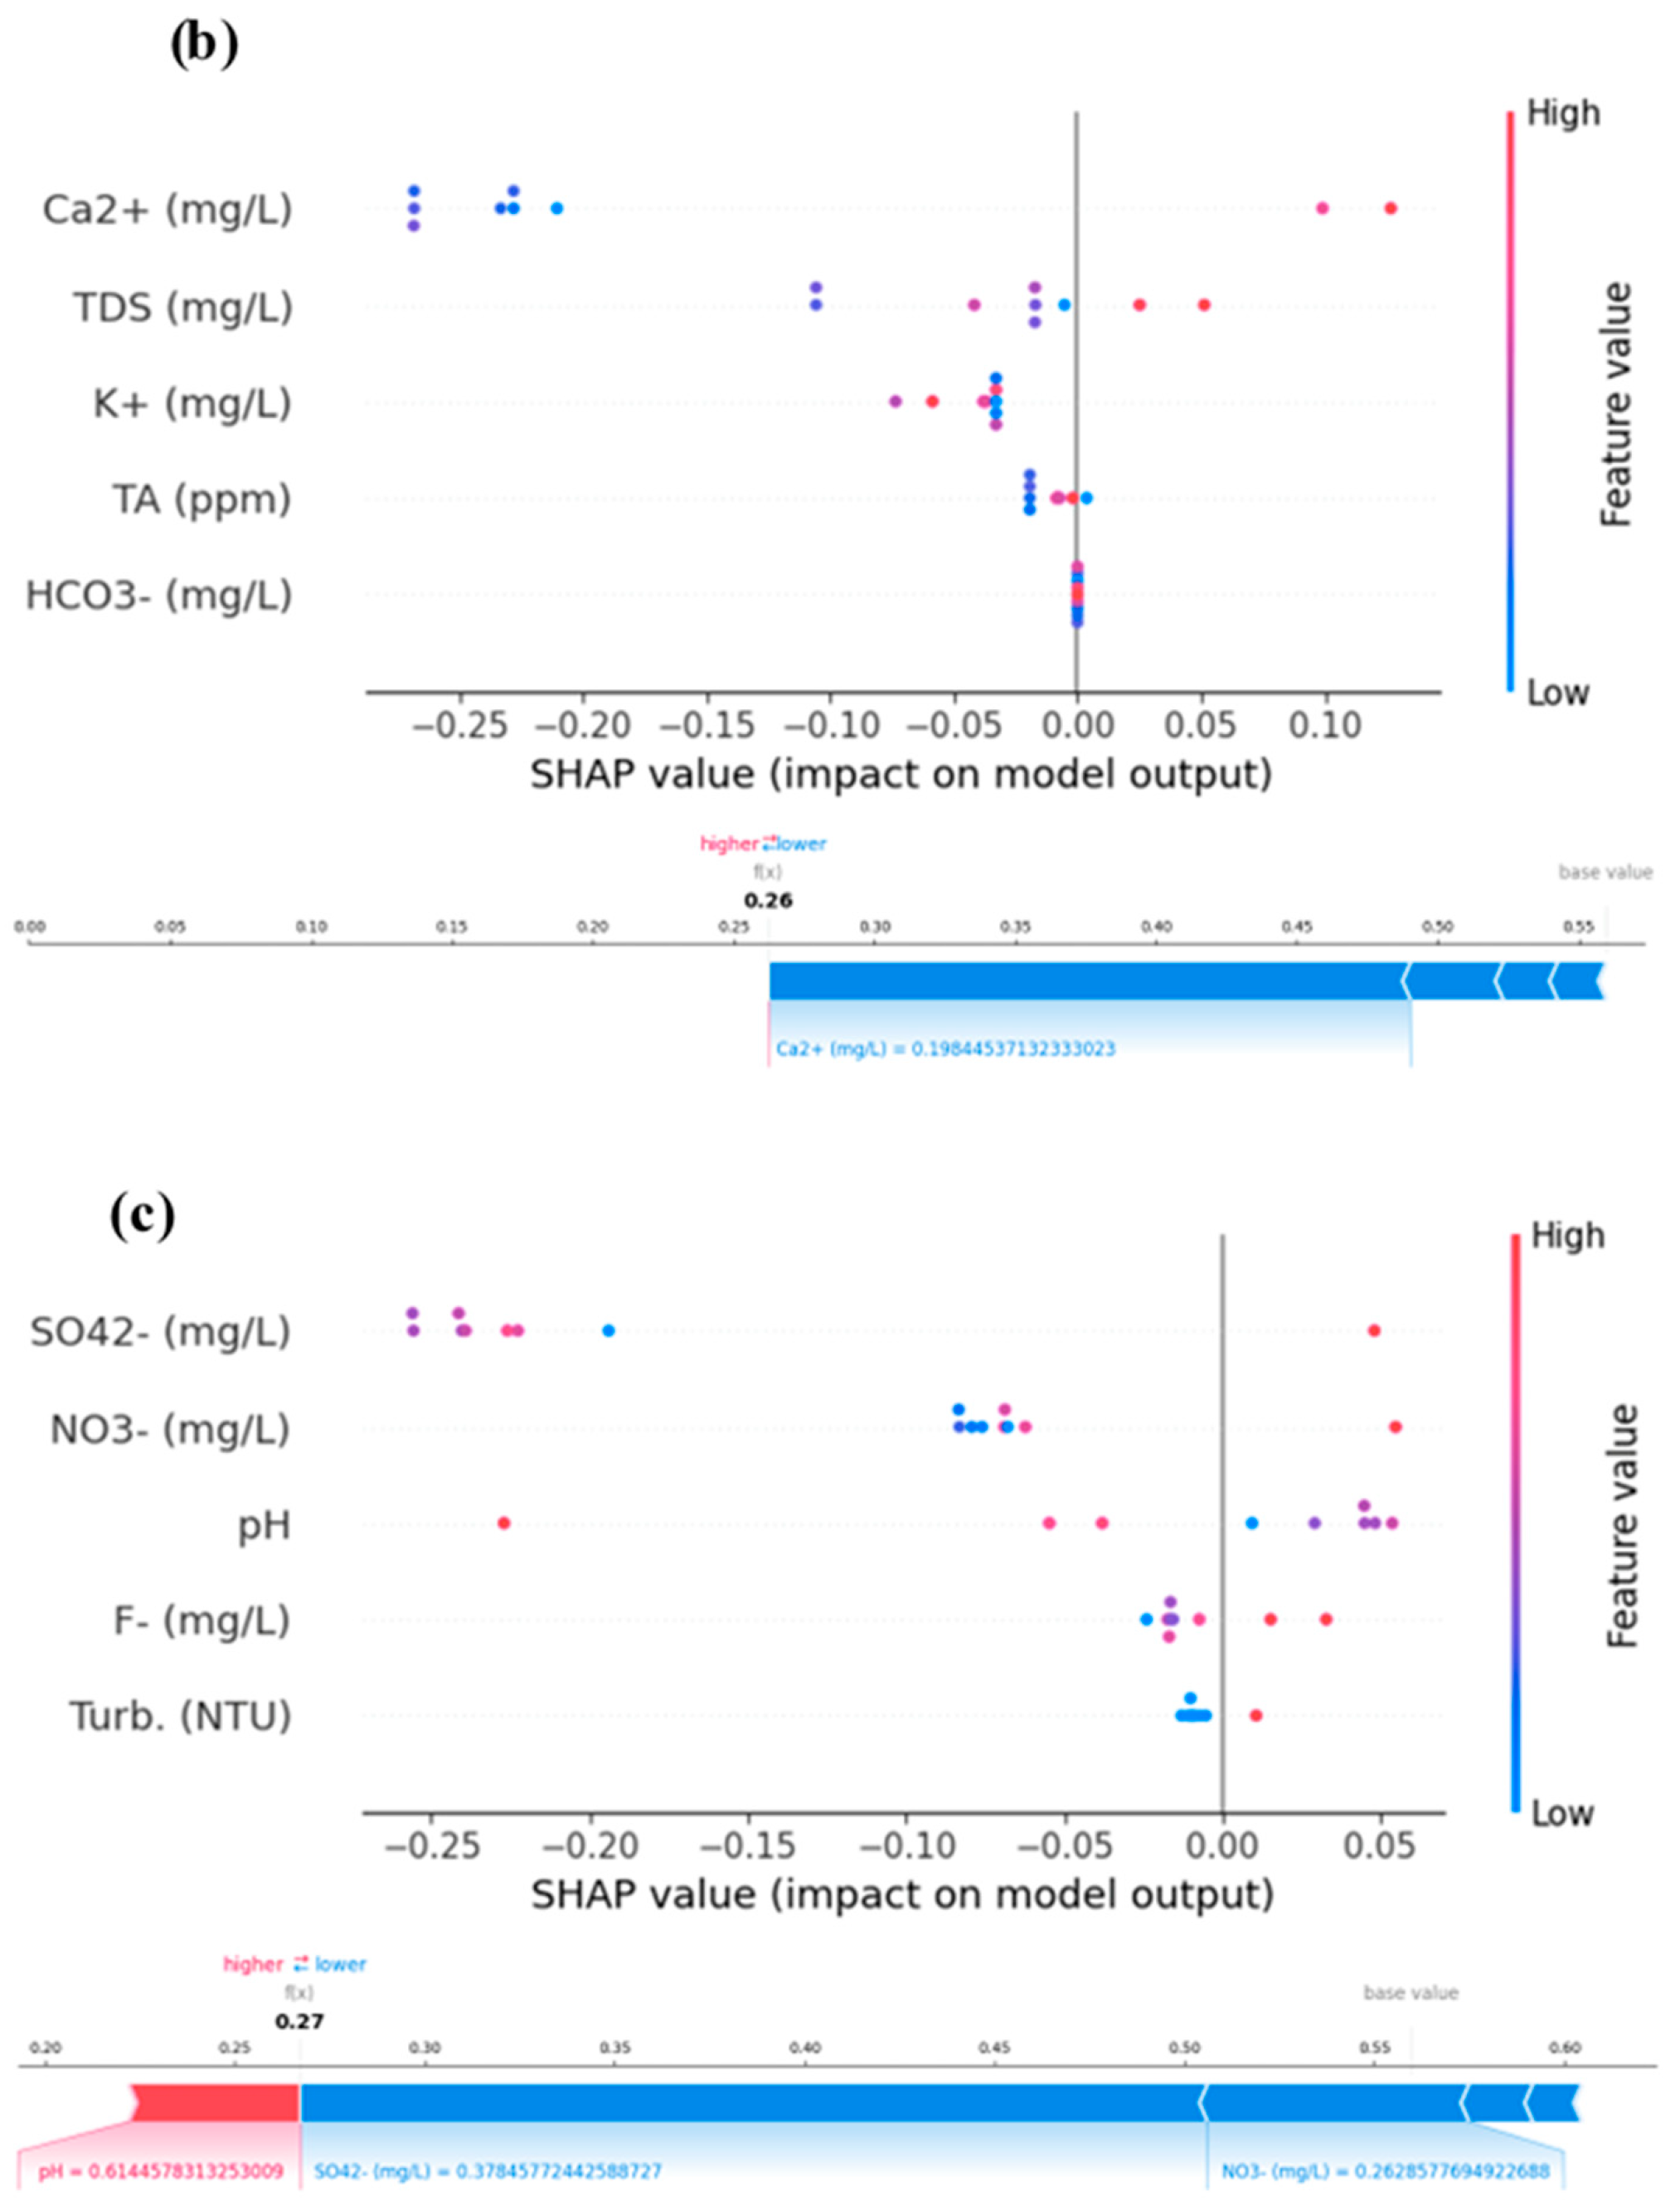
To acquire a deeper understanding of the model predictions, we also used SHAP (SHapley Additive exPlanations) summary plots and force plots. These representations helped us comprehend how particular features affected the model’s predictions and offered insightful justifications for model behavior [42,43]. We were able to investigate general feature relevance and its influence on predictions using SHAP summary plots. In our investigation, we found that while certain factors had a larger influence on the models’ predictions than others, other features did so more significantly. These insights emphasized the variables influencing the models’ conclusions and offered helpful advice for feature selection. We were able to explore the predictions for certain cases in our dataset using SHAP force plots. To visualize the contributions of each attribute to the prediction for that specific instance, we chose specific data points and created force plots. We were able to determine which characteristics were responsible for the predictions and their relative relevance thanks to these plots, which provided thorough justifications for why a model generated a certain forecast for a given input. SHAP summary and force plots for five steps ahead are presented in Figure 5.


Figure 5.
Models’ SHAP summary and force plot for (a) C1, (b) C2, and (c) C3 for the best models XgBoost.
5. Conclusions
The comprehensive modelling of PIG in the complex multi-aquifer groundwater system of the Al-Hassa Oasis using an integrated spatial and chemometric study approach has provided valuable insights into the state of groundwater quality in the region. The investigations conducted in this study have demonstrated that the groundwater resources in the Al-Hassa Oasis are indeed polluted with trace elements. The presence of elevated concentrations of these pollutants raises significant environmental and public health concerns. This integrated investigation has substantially elevated our understanding of the magnitude and drivers of fluoride and nitrate contamination in groundwater resources in Al-Hassa, Saudi Arabia, thereby shedding light on a crucial environmental and public health issue of global significance. By leveraging advanced machine learning (ML) models in tandem with Shapley additive explanations (SHAP) for enhanced interpretability, the study did not only predict groundwater quality with remarkable accuracy but also navigated through the often intricate relationship dynamics among various physiochemical parameters. The devised methodological synergy underscores a novel approach that couples predictive analytics with explainability, facilitating a nuanced understanding of the data-driven insights and consequently enabling informed decision making toward sustainable water resource management.
6. Recommendations
- Wider deployment of the employed ML models and SHAP should be explored in different geographical locales and various types of water bodies to validate their efficacy and adaptability.
- Formulation and enforcement of stringent water quality regulations should be advanced to mitigate the contamination at source points.
- Policymakers and planners should leverage the insights provided by the model to formulate, implement, and monitor strategic interventions aimed at safeguarding water quality.
- Programs should be initiated to raise awareness among local communities regarding water conservation and the impact of contamination on health and the environment.
- Communities should be engaged in water monitoring programs, ensuring a decentralized and participative approach to water management.
- Investments should be made in the development and upgrading of water treatment facilities to ensure the accessibility of safe drinking water for the population, even when natural resources are compromised.
- Further research should delve into devising feasible, eco-friendly, and economically viable solutions to manage and reverse groundwater contamination.
- Other predictive models and methodologies that can be amalgamated with the existing system to enhance prediction accuracy and applicability should be explored.
7. Limitations
- While the models demonstrated high predictive accuracy, their performance is intrinsically tied to the quality and quantity of the data upon which they are trained and validated. Therefore, potential inconsistencies or gaps in data could affect predictions.
- The models were specifically tailored and validated for the Al-Hassa region, and their direct applicability to other regions, with different hydro-geological and contamination contexts, may be limited without further adaptations and validations.
- While the study achieved an accuracy of over 90%, it is paramount to acknowledge that ML models might sometimes overly adapt to the training data (overfitting), potentially limiting their generalization to new, unseen data.
- The study largely focuses on the technical and scientific aspects of water contamination and does not delve deeply into the socio-economic implications or mitigation strategies, which are crucial for holistic water resource management.
- The study does not directly address the long-term impacts of contamination on environmental and public health, which would be pivotal in understanding the broader implications and in strategizing remediation efforts.
In light of the insights and constraints identified in this study, it is imperative for future research to navigate through these limitations, ensuring more robust, holistic, and globally applicable methodologies for water resource management. Furthermore, the recommendations provided should guide pragmatic actions and policy formulations to safeguard water resources, thereby ensuring environmental sustainability and public health.
Author Contributions
Conceptualization, S.I.A., M.A.Y., A.S.M., S.M.H.S., J.U., A.Y.O., S.R.N. and I.H.A.; methodology, M.A.Y.; software, A.S.M.; formal analysis, S.I.A., M.A.Y., A.S.M. and A.Y.O.; investigation, S.I.A., S.M.H.S. and J.U.; resources, S.R.N. and I.H.A.; data curation, S.M.H.S., J.U. and A.Y.O.; writing—original draft, S.I.A., M.A.Y., A.S.M., S.M.H.S., J.U. and A.Y.O.; writing—review and editing, S.R.N.; supervision, I.H.A.; project administration, I.H.A.; funding acquisition, S.R.N. All authors have read and agreed to the published version of the manuscript.
Funding
This research was funded by the Deanship of Research Oversight and Coordination (DROC) at King Fahd University of Petroleum & Minerals (KFUPM) under the Interdisciplinary Research Center for Membranes and Water Security (Grant Number: INMW2113).
Institutional Review Board Statement
Not applicable.
Informed Consent Statement
Not applicable.
Data Availability Statement
The data presented in this study are available on request from the corresponding author.
Acknowledgments
The authors would like to acknowledge all support from the Interdisciplinary Research Center for Membranes and Water Security, King Fahd University of Petroleum and Minerals.
Conflicts of Interest
The authors declare no conflict of interest.
References
- United Nations. The Human Right to Water and Sanitation Media Brief. UN-Water Decade Programme on Advocacy and Communication and Water Supply and Sanitation Collaborative Council; United Nations: New York, NY, USA, 2011. [Google Scholar]
- Tiyasha, T.; Tung, T.M.; Yaseen, Z.M. Deep Learning for Prediction of Water Quality Index Classification: Tropical Catchment Environmental Assessment. Nat. Resour. Res. 2021, 30, 4235–4254. [Google Scholar] [CrossRef]
- Yaseen, Z.M. The next generation of soil and water bodies heavy metals prediction and detection: New expert system based Edge Cloud Server and Federated Learning technology. Environ. Pollut. 2022, 313, 120081. [Google Scholar] [CrossRef] [PubMed]
- Yaseen, Z.M.; Ghareb, M.I.; Bonakdari, H.; Ebtehaj, I. Rainfall Pattern Forecasting Using Novel Hybrid Intelligent Model Based ANFIS-FFA. Water Resour. Manag. 2017, 32, 105–122. [Google Scholar] [CrossRef]
- Bhagat, S.K.; Tiyasha, T.; Kumar, A.; Malik, T.; Jawad, A.H.; Khedher, K.M.; Deo, R.C.; Yaseen, Z.M. Integrative artificial intelligence models for Australian coastal sediment lead prediction: An investigation of in-situ measurements and meteorological parameters effects. J. Environ. Manag. 2022, 309, 114711. [Google Scholar] [CrossRef] [PubMed]
- Abba, S.I.; Egbueri, J.C.; Benaafi, M.; Usman, J.; Usman, A.G.; Aljundi, I.H. Chemosphere Fluoride and nitrate enrichment in coastal aquifers of the Eastern Province, Saudi Arabia: The influencing factors, toxicity, and human health risks. Chemosphere 2023, 336, 139083. [Google Scholar] [CrossRef] [PubMed]
- JJannat, N.; Khan, M.S.I.; Islam, H.M.T.; Islam, M.S.; Khan, R.; Siddique, M.A.B.; Varol, M.; Tokatli, C.; Pal, S.C.; Islam, A.; et al. Hydro-chemical assessment of fluoride and nitrate in groundwater from east and west coasts of Bangladesh and India. J. Clean. Prod. 2022, 372, 133675. [Google Scholar] [CrossRef]
- Jamei, M.; Karbasi, M.; Malik, A.; Abualigah, L.; Islam, A.R.M.T.; Yaseen, Z.M. Computational assessment of groundwater salinity distribution within coastal multi-aquifers of Bangladesh. Sci. Rep. 2022, 12, 11165. [Google Scholar] [CrossRef]
- Deepika, B.V.; Ramakrishnaiah, C.R.; Naganna, S.R. Spatial variability of ground water quality: A case study of Udupi district, Karnataka State, India. J. Earth Syst. Sci. 2020, 129, 221. [Google Scholar] [CrossRef]
- Gleeson, T.; Befus, K.M.; Jasechko, S.; Luijendijk, E.; Cardenas, M.B. The global volume and distribution of modern groundwater. Nat. Geosci. 2016, 9, 161–164. [Google Scholar] [CrossRef]
- Al-Omran, A.M.; Aly, A.A.; Al-Wabel, M.I.; Sallam, A.S.; Al-Shayaa, M.S. Hydrochemical characterization of groundwater under agricultural land in arid environment: A case study of Al-Kharj, Saudi Arabia. Arab. J. Geosci. 2016, 9, 68. [Google Scholar] [CrossRef]
- Marghade, D.; Malpe, D.B.; Rao, N.S.; Sunitha, B. Geochemical assessment of fluoride enriched groundwater and health implications from a part of Yavtmal District, India. Hum. Ecol. Risk Assess. Int. J. 2020, 26, 673–694. [Google Scholar] [CrossRef]
- Egbueri, J.C. Groundwater quality assessment using pollution index of groundwater (PIG), ecological risk index (ERI) and hierarchical cluster analysis (HCA): A case study. Groundw. Sustain. Dev. 2020, 10, 100292. [Google Scholar] [CrossRef]
- Egbueri, J.C.; Ameh, P.D.; Enyigwe, M.T.; Unigwe, C.O. Entropy-Based Analysis of the Impact of Environmentally Sensitive Elements on Groundwater Quality of the Ameka Region of Southeast Nigeria: Medical Geology Implications. Anal. Lett. 2020, 54, 1193–1223. [Google Scholar] [CrossRef]
- Adimalla, N.; Qian, H.; Nandan, M.J. Groundwater chemistry integrating the pollution index of groundwater and evaluation of potential human health risk: A case study from hard rock terrain of south India. Ecotoxicol. Environ. Saf. 2020, 206, 111217. [Google Scholar] [CrossRef] [PubMed]
- Shukla, S.; Saxena, A. Appraisal of Groundwater Quality with Human Health Risk Assessment in Parts of Indo-Gangetic Alluvial Plain, North India. Arch. Environ. Contam. Toxicol. 2021, 80, 55–73. [Google Scholar] [CrossRef]
- Nath, A.V.; Selvam, S.; Reghunath, R.; Jesuraja, K. Groundwater quality assessment based on groundwater pollution index using Geographic Information System at Thettiyar watershed, Thiruvananthapuram district, Kerala, India. Arab. J. Geosci. 2021, 14, 557. [Google Scholar] [CrossRef]
- Adimalla, N. Application of the Entropy Weighted Water Quality Index (EWQI) and the Pollution Index of Groundwater (PIG) to Assess Groundwater Quality for Drinking Purposes: A Case Study in a Rural Area of Telangana State, India. Arch. Environ. Contam. Toxicol. 2021, 80, 31–40. [Google Scholar] [CrossRef] [PubMed]
- Zhao, X.; Wang, D.; Xu, H.; Ding, Z.; Shi, Y.; Lu, Z.; Cheng, Z. Groundwater pollution risk assessment based on groundwater vulnerability and pollution load on an isolated island. Chemosphere 2022, 289, 133134. [Google Scholar] [CrossRef]
- Tahmasebi, P.; Kamrava, S.; Bai, T.; Sahimi, M. Machine learning in geo-and environmental sciences: From small to large scale. Adv. Water Resour. 2020, 142, 103619. [Google Scholar] [CrossRef]
- Wang, H.; Fu, T.; Du, Y.; Gao, W.; Huang, K.; Liu, Z.; Zitnik, M. Scientific discovery in the age of artificial intelligence. Nature 2023, 620, 47–60. [Google Scholar] [CrossRef]
- Sun, A.Y.; Scanlon, B.R. How can Big Data and machine learning benefit environment and water management: A survey of methods, applications, and future directions. Environ. Res. Lett. 2019, 14, 073001. [Google Scholar] [CrossRef]
- Derdour, A.; Abdo, H.G.; Almohamad, H.; Alodah, A.; Al Dughairi, A.A.; Ghoneim, S.S.M.; Ali, E. Prediction of Groundwater Quality Index Using Classification Techniques in Arid Environments. Sustainability 2023, 15, 9687. [Google Scholar] [CrossRef]
- Kulisz, M.; Kujawska, J.; Przysucha, B.; Cel, W. Forecasting water quality index in groundwater using artificial neural network. Energies 2021, 14, 5875. [Google Scholar] [CrossRef]
- Saha, S.; Gayen, A.; Mukherjee, K.; Proughasemi, H.R.; Santosh, M. Spatial Prediction of Groundwater Potentiality Mapping Using Machine Learning Algorithms. Res. Sq. 2021, 610, 127977. [Google Scholar]
- Kumari, S.; Kumar, D.; Kumar, M.; Pande, C.B. Modeling of standardized groundwater index of Bihar using machine learning techniques. Phys. Chem. Earth 2023, 130, 103395. [Google Scholar] [CrossRef]
- Mohammed, M.A.A.; Khleel, N.A.A.; Szabó, N.P.; Szűcs, P. Modeling of groundwater quality index by using artificial intelligence algorithms in northern Khartoum State, Sudan. Model. Earth Syst. Environ. 2023, 9, 2501–2516. [Google Scholar] [CrossRef]
- Al-Adhaileh, M.H.; Aldhyani, T.H.H.; Alsaade, F.W.; Al-Yaari, M.; Albaggar, A.K.A. Groundwater Quality: The Application of Artificial Intelligence. J. Environ. Public Health 2022, 2022, 8425798. [Google Scholar] [CrossRef]
- Javidan, R.; Javidan, N. A novel artificial intelligence-based approach for mapping groundwater nitrate pollution in the Andimeshk-Dezful plain, Iran. Geocarto Int. 2022, 37, 10434–10458. [Google Scholar] [CrossRef]
- Taşan, S. Estimation of groundwater quality using an integration of water quality index, artificial intelligence methods and GIS: Case study, Central Mediterranean Region of Turkey. Appl. Water Sci. 2023, 13, 15. [Google Scholar] [CrossRef]
- El-mahmoudi, A.S.; Hussein, A.A.; Hofouf, A. Hydrochemical Studies of Groundwater at Al Hassa Oasis, Eastern Region, Saudi Arabia. Adsorption 2017, 6, 20–32. [Google Scholar]
- Al Tokhais, A.S.; Rausch, R. The Hydrogeology of Al Hassa Springs. In Proceedings of the 3rd International Conference on Water Resources and Arid Environments & 1st Arab Water Forum, Riyadh, Saudi Arabia, 16–19 November 2008. [Google Scholar]
- Al-Omran, A.M.; Mousa, M.A.; AlHarbi, M.M.; Nadeem, M.E.A. Hydrogeochemical characterization and groundwater quality assessment in Al-Hasa, Saudi Arabia. Arab. J. Geosci. 2018, 11, 4. [Google Scholar] [CrossRef]
- Pavlov, Y.L. Random Forests; De Gruyter: Boston, MA, USA, 2019; pp. 1–122. [Google Scholar]
- Al-Khafaji, Z.; Heddam, S.; Kim, S.; Denouwe, D.D. State-of-Art: Artificial Intelligence Models Era in Modeling Beam Shear Strength. Knowl. Based Eng. Sci. 2022, 3, 1–63. [Google Scholar]
- Mienye, I.D.; Sun, Y.; Wang, Z. Prediction performance of improved decision tree-based algorithms: A review. Procedia Manuf. 2019, 35, 698–703. [Google Scholar] [CrossRef]
- Basilio, S.A.; Goliatt, L. Gradient Boosting Hybridized with Exponential Natural Evolution Strategies for Estimating the Strength of Geopolymer Self-Compacting Concrete. Knowl. Based Eng. Sci 2022, 3, 1–16. [Google Scholar] [CrossRef]
- Szczepanek, R. Daily Streamflow Forecasting in Mountainous Catchment Using XGBoost, LightGBM and CatBoost. Hydrology 2022, 9, 226. [Google Scholar] [CrossRef]
- Hancock, J.T.; Khoshgoftaar, T.M. CatBoost for big data: An interdisciplinary review. J. Big Data 2020, 7, 94. [Google Scholar] [CrossRef]
- Baig, N.; Abba, S.I.; Usman, J.; Benaafi, M.; Aljundi, I.H. Ensemble hybrid machine learning to simulate dye / divalent salt fractionation using a loose nano filtration membrane. Environ. Sci. Adv. 2023, 2, 1446–1459. [Google Scholar] [CrossRef]
- Baig, N.; Usman, J.; Abba, S.I.; Benaafi, M.; Aljundi, I.H. Fractionation of dyes/salts using loose nanofiltration membranes: Insight from machine learning prediction. J. Clean. Prod. 2023, 418, 138193. [Google Scholar] [CrossRef]
- Núñez, J.; Cortés, C.B.; Yáñez, M.A. Explainable Artificial Intelligence in Hydrology: Interpreting Black-Box Snowmelt-Driven Streamflow Predictions in an Arid Andean Basin of North-Central Chile. Water 2023, 15, 3369. [Google Scholar] [CrossRef]
- Iban, M.C. An explainable model for the mass appraisal of residences: The application of tree-based Machine Learning algorithms and interpretation of value determinants. Habitat Int. 2022, 128, 102660. [Google Scholar] [CrossRef]

Disclaimer/Publisher’s Note: The statements, opinions and data contained in all publications are solely those of the individual author(s) and contributor(s) and not of MDPI and/or the editor(s). MDPI and/or the editor(s) disclaim responsibility for any injury to people or property resulting from any ideas, methods, instructions or products referred to in the content. |
© 2023 by the authors. Licensee MDPI, Basel, Switzerland. This article is an open access article distributed under the terms and conditions of the Creative Commons Attribution (CC BY) license (https://creativecommons.org/licenses/by/4.0/).