Article

Mapping Groundwater Prospective Zones Using Remote Sensing and Geographical Information System Techniques in Wadi Fatima, Western Saudi Arabia

by
Mohamed Abdelkareem
1,
Fathy Abdalla
1,2,
Fahad Alshehri
3,* and
Chaitanya B. Pande
3,4,*
1
Geology Department, Faculty of Science, South Valley University, Qena 83523, Egypt
2
Deanship of Scientific Research, King Saud University, Riyadh 11451, Saudi Arabia
3
Abdullah Alrushaid Chair for Earth Science Remote Sensing Research, Geology and Geophysics Department, College of Science, King Saud University, Riyadh 11451, Saudi Arabia
4
New Era and Development in Civil Engineering Research Group, Scientific Research Center, Al-Ayen University, Thi-Qar, Nasiriyah 64001, Iraq
*
Authors to whom correspondence should be addressed.
Sustainability 2023, 15(21), 15629; https://doi.org/10.3390/su152115629
Submission received: 26 September 2023 / Revised: 26 October 2023 / Accepted: 30 October 2023 / Published: 5 November 2023

Abstract

:
Integration of remote sensing (RS) and GIS methods has allowed for the identification of potential water resource zones. Here, climatic, ecological, hydrologic, and topographic data have been integrated with microwave and multispectral data. Sentinel-2, SRTM, and TRMM data were developed to characterize the climatic, hydrologic, and topographic landscapes of Wadi Fatima, a portion of western Saudi Arabia that drains to the Red Sea. The physical characteristics of Wadi Fatima’s catchment area that are essential for mapping groundwater potential zones were derived from topographic data, rainfall zones, lineaments, and soil maps through RS data and GIS techniques. Twelve thematic factors were merged with a GIS-based knowledge-driven approach after providing a weight for every factor. Processing of recent Sentinel-2 data acquired on 4 August 2023 verified the existence of a zone of vegetation belonging to promising areas of groundwater potential zones (GPZs). The output map is categorized into six zones: excellent (10.98%), very high (21.98%), high (24.99%), moderate (21.44%), low (14.70%), and very low (5.91%). SAR CCD derived from Sentinel-1 from 2022 to 2023 showed that the parts of no unity are in high-activity areas in agricultural and anthropogenic activities. The model predictions were proven with the ROC curves with ground data, existing wells’ locations, and the water-bearing formations’ thickness inferred from geophysical data. Their performance was accepted (AUC: 0.73). The outcomes of the applied methodologies were excellent and important for exploring, planning, managing, and sustainable development of resources of water in desert areas. The present study successfully provided insights into the watershed’s hydrologic, climatic, vegetated variation, and terrain database information using radar, optical, and multi-temporal InSAR data. Furthermore, the applied multi-criteria overlay technique revealed promising areas for groundwater abstraction, which can be applied elsewhere in various environmental situations.

1. Introduction

Many regions in the Great Sahara and Arabian Peninsula are presently experiencing water scarcity, mainly determined with frequent droughts, and increasing agriculture and settling. Such regions suffer from limited rainfall and surface freshwater, representing <1% of the world’s freshwater. In comparison, over 30% is preserved in underground aquifer water [1], supplying ~80% of the world’s rural population with a safe water supply. One of the water supplies that can address the issue of water scarcity is groundwater. In arid–semi-arid conditions, groundwater resources are significant natural resources that contribute to potable, industry, and agriculture ~50%, 40%, and 20%, respectively [2,3,4,5]. Thus, groundwater is vital compared to surface water. Growing populations and a wide range of social, economic, environmental, and climatic factors are the primary causes of growing demands on freshwater availability [5,6]. Supplies for water are vital for the growth of urban, agricultural, and industrial undertakings [7,8]. Population development and food rules are the biggest challenges to reaching sustainable development goals [9,10,11]. The obtainability of freshwater resources has become a critical problem due to the high mandate for agricultural, domestic, and industrial uses [12,13,14,15] (therefore, >2 billion people worldwide are suffering from freshwater scarcity [16,17,18]). It is expected that by 2050, one-third of the world’s people will suffer from water scarcity [19]. Climate variation is one of the prominent challenges in the twenty-first century, contributing to drought and water insufficiency problems [20] and surface water supply systems [21].
The key origin of groundwater is precipitation that penetrates down soil openings into shallow aquifers [22,23,24]. Rainwater may mainly act in infiltration and overflow, depending on the intensity of the storm, the type of vegetation present, the temperature, and many other factors, together with geology, landscape, climatic situations, soil [25,26,27], land use [28], slopes, distances from rivers, and rainfall stages [29,30,31,32]. The use of RS and GIS to map groundwater resources has grown in popularity [33,34,35]. Implementing some of these techniques may be beneficial to reveal potential areas of water resources [36,37,38]. Several studies have demonstrated the usefulness of using RS and GIS to locate probable groundwater sources [39,40,41,42,43]. A GIS technique can handle big-data spatial data for processing and combination to predict and allow for finding additional water resources [44,45,46]. For mapping groundwater potentiality, procedures depending on information and understanding were used [47,48,49]. Multiple fields of knowledge, like an overlay analysis [50], an analytical hierarchy process (AHP) [51], Boolean logic [52], index overlays, and fuzzy methods, were involved [53]. Numerous prediction studies have employed the overlay analysis multi-criteria decision-making technique [54,55,56].
The key aim of the current investigation is to model and delimit groundwater prospective zones, GPZs, in the Wadi Fatima basin, western Saudi Arabia. This objective is attained by preparing thematic layers for most significant contributing factors that specify groundwater potential, together with distance to river, soil, lineament density, NDVI, and rainfall, etc., through the GIS component. Field data and geoelectric surveys are functional to assay the cogency of the subsequent GIS system.

2. Materials and Methods
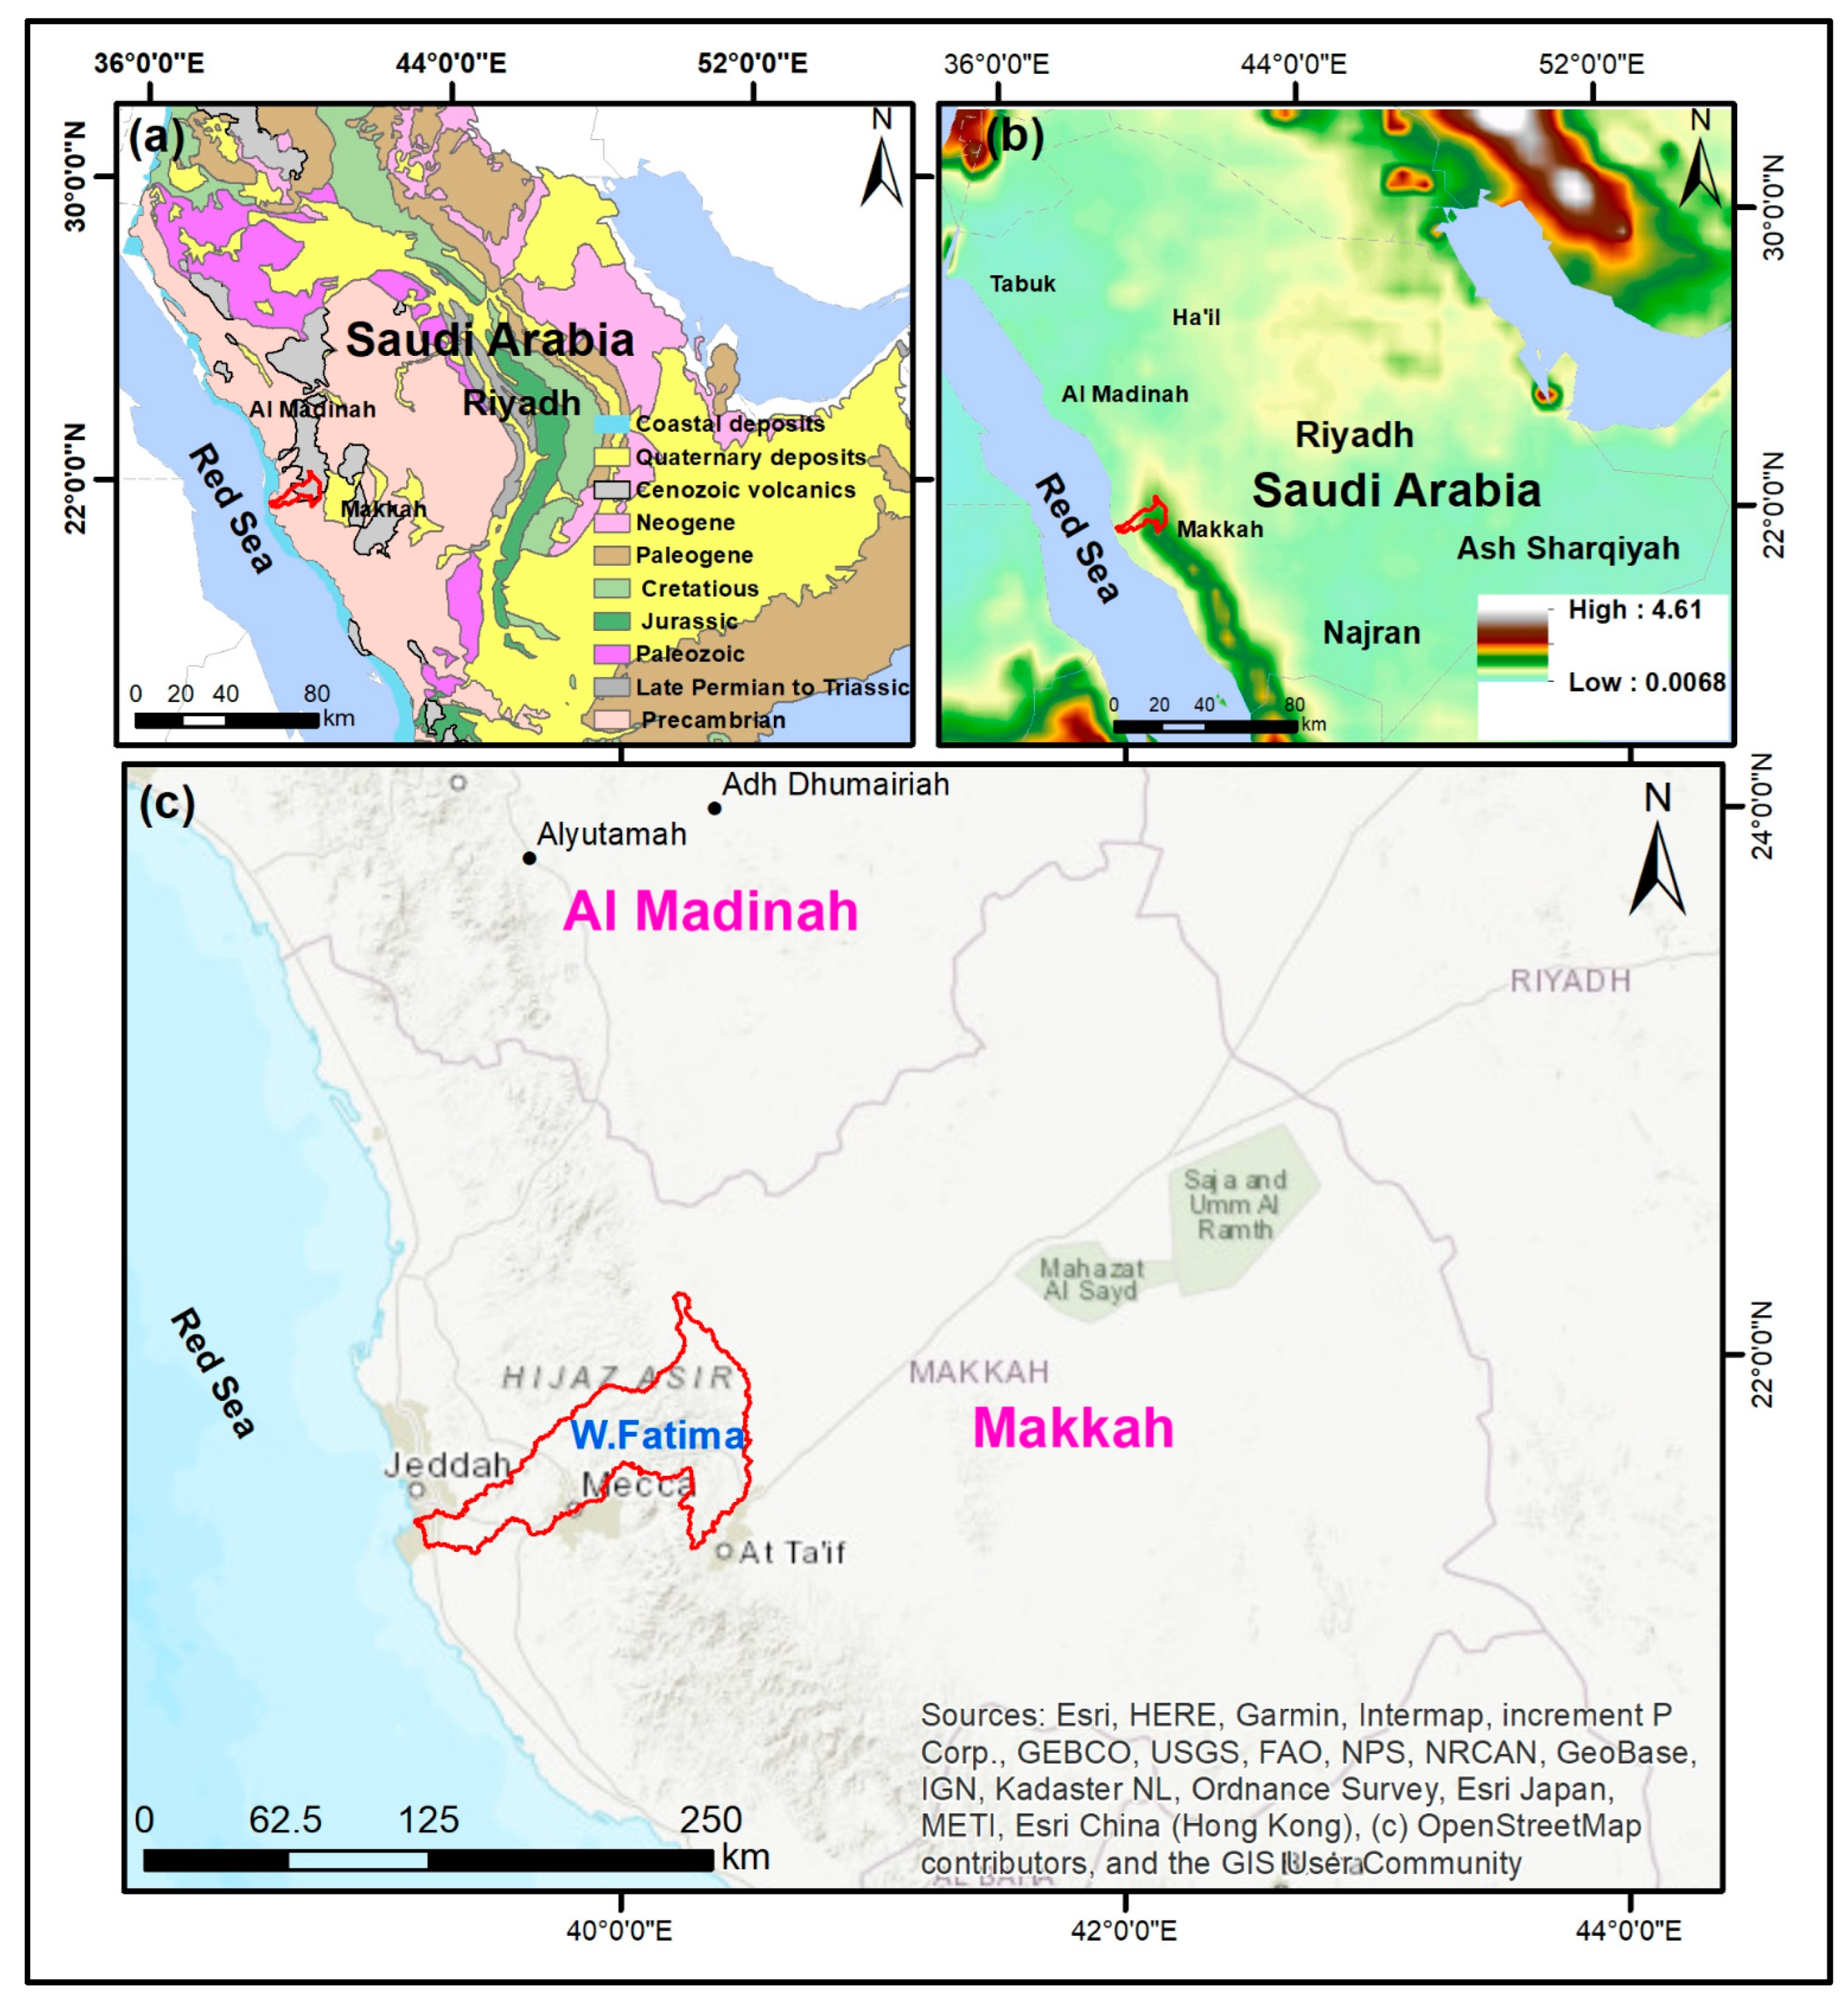
2.1. Study Area

Wadi Fatima is laid within the Makkah region (Figure 1a); it covers a great area of the S and E of Jeddah and prolongs from NE to SW with a region that exceeds 100 km2. It is situated among longitudes 39°15′ and 40°30′, and latitudes 21°16′ and 22°15′ N, as shown in Figure 1. The Wadi Fatima drainage basin, which drains toward the Red Sea, obtains its importance from its location in the Makkah region, west of Kingdom. It is the neighboring stream watershed to the 3 major towns: Jeddah, Makkah, and Taif. The Hijaz Escarpment altitude (high Sarawat Mountains) in the east is the primary parameter regulating the measure and outline of precipitation, where the performance as an orographic freshening obstacle and hence its period, intensity, spreading, and reoccurrence times are major effects [57]. The basin is considered significant, with a greater chance of collecting more flood and rainwater than the smaller basins. Precipitation occurs during the spring and summer, where the mean yearly rain fluctuates from >500 mm in the E parts near the Hijaz Escarpment to <100 mm in the W part, close to the coast of the Red Sea, exposing the influence of elevation. The average evaporation rates exceed 2000 mm/yr. The permeation amount is low down to the Fatima Group’s epiclastic rocks and carbonate [58]. The recharge areas for surficial groundwater aquifers in Wadi Fatima lie near the province of Taif, estimated at 72 mm/y [59].
Geologically, Wadi Fatima is located within the Makkah Quadrangle; it comprises different rock units with ages ranging from the Precambrian basement complex to the Tertiary sedimentary and lavas and the Quaternary alluvial deposits. These rock formations are influenced by structural elements including fractures/fault zones. The width of the Quaternary fill deposits formed from mudstones, sandstones, and conglomerates in the study area varies from 10 m near the upstream parts to 20 m or more in the downstream parts [60,61]. Geomorphologically, Wadi Fatima and its surroundings preset 3 key parts. These rocks are the high mountainous area (Proterozoic rocks), the hilly area (dissected and weathered rocks), and the pediment plain. Wadi Fatima comprises sub-catchments like Wadi Ash-Shamiyah, Wadi Alyamaniyah, Wadi Bani Omair, and Wadi Howarah.

2.2. Data Used and Methods

The current research used RS data and GIS techniques to disclose the prospective areas of water resources. Integration of multi-criteria such as curvature, TRI, drainage density, TWI, distance to river, soil, lineament density, NDVI, rainfall, etc., helped reveal possible water resource areas using remote sensing data from radar and optical sensors (Figure 2). These eleven thematic GIS maps were merged. The DEMs were made after the SRTM. The SRTM-30 m cell size of NASADEM 1arc additional WGS84 data from the SRTM was used to characterize the topographical parameters (elevation, slope, curvature, TRI) and hydrologic parameters (e.g., drainage density, TWI, distance to the river). The stream networks were delineated using the 8-D approach [62]. That is very important in generating stream-density maps, TWI, and distances to rivers [63,64,65].
The NDVI mixtures are generated by computing AVHRR daily readings to produce a closely cloud-free image showing the utmost greenness. The NDVI fractions from bands one and both of the AVHRR combined are combined to form a resulting combined NDVI band, in addition to vegetation rainfall data [66]. The data on average rainfall were collected using TRMM satellite observations. Using the ordinary kriging interpolating application, the generated rainfall average statistics are spatially scattered and cover the span from 1 January 1998 to 30 November 2015. The information was obtained from this website address: https://giovanni.gsfc.nasa.gov/giovanni/ (accessed on 10 February 2021). Two scenes of the Sentinel-2B satellite were acquired on 4 August 2023 and 19 August 2019. The bands of Sentinel-2 data are typically stored in zip-compressed files within the Sentinel’s exclusive SAFE format. To create a unified dataset with a consistent pixel size of 10 m, we stacked the JPEG files from bands B2, to B8 (10 m), and B11 and B12 (20 m). This process involves merging these bands into a single GeoTIFF file. For enhanced efficiency and reduced processing time, a subset of this dataset is often extracted and preprocessed using software like SNAP version 6 [67,68,69].
The study area is covered using two vertical–horizontal (VH) polarized Sentinel-1 radar images, which were chosen to reveal change detection. The CCD process utilizes power and phase variations together and is performed with interferometric IW in the single-look (SLC) format. This method involves the comparison of two interferometric Synthetic Aperture Radar (SAR) images captured at different time points to assess alterations in both phase and intensity. In the specific case of this study, the two SAR image scenes were acquired on the dates of 26th February 2022 and 8th August 2023, focusing on the Wadi Fatima area.
Each pixel in a theme layer corresponds to the same location in the used overlay analysis. To produce a groundwater prospective zone (GWPZ) map as the output, several components of the input’s 11 thematic maps must be integrated. Every map and subclass have a rank, a crucial point to remember. The user can mathematically combine the layers to give each pixel on the final GWPZ map a new rank. The study incorporated a minimum input cell size of 90 m into the geographical information system (GIS) framework. This cell size was utilized to overlay the Geographical Weighted Poverty Zone (GWPZ) map for the research area. The GWPZ map was created through a weighted overlay technique, which involved combining multiple data-based maps using a multi-criteria approach. This technique assigned different weights to each map depending on their relative importance in the modeling process. The resulting GWPZ map denotes a weighted mean of these merged data-based maps, providing a comprehensive and spatially explicit representation of poverty zones in the study area. This approach in GIS allows for a more nuanced and informed understanding of the geographic distribution of poverty and contributes to more effective decision making and policy planning [70,71,72]. For this purpose, the following Equation (1) was used.
G W P Z s = i = 1 n L i × F i
where Li is the rank of an athematic layer of the I factor, n is the number of layers, and Fi denotes the magnitude of the subclass. This makes it possible to combine the eleven theme maps on a pixel basis in accordance with the formula.

3. Results and Discussion

3.1. Factors Controlling Groundwater Occurrence and Infiltration

In the present research, we integrate different datasets and measures to obtain an in-depth comprehension of Wadi Fatima’s optimum areas of groundwater. These factors cover the geologic, climatic, hydrologic, and ecologic features.

3.2. Geology

The characteristics and geometric sorts of the lithologic formations are noteworthy in controlling the occurrence, movement, and accumulation of groundwater. This is due to pore spaces [73,74,75]. For example, zones with well-sorted clastic deposits would hold water rather than massive bedrock. Based on the geologic map of the Saudi Arabian Shield (1963–1983), Wadi Fatima is built up of gneiss (ortho- and para-), volcaniclastics belonging to basaltic to andesitic rocks (Jiddah Group), metasediments to metavolcanic-including marbles (Fatima Group), gabbros, diorites, and various sorts of granites from tonalites to alkali granites either gray or pink colors. These rocks are partially covered with flood basalts (Figure 3a). Several wadis dissected these rocks and filled them with Quaternary deposits, including aeolian sand. Based on the geological map, the geologic map was simplified into four classes: alluvium, Jaddah–Fatima formation, flood basalt, and granites–gabbros that occupied 9.65, 25.68, 16.42, and 48.25% of the entire area, respectively (Figure 3b).

3.3. Elevation

Elevation affects the direction, surface runoff, and groundwater recharging [70,76]. Groundwater potential is significantly influenced by elevation [41], unlike how it relates to the groundwater resource [77,78]. Because of the low topography downstream, precipitation cannot concentrate in locations of high height. The elevation chart of the research area (Figure 4a) is separated into five zones: 0–369, 369.1–756, 756.1–1096, 1097–1440, and 1441–2290 m, which cover 30.45, 20.97, 23.01, 16.58, and 9% of the basin, respectively. The topography layer is of paramount importance in sculpting the landscape and has a profound effect on the flow of water throughout the terrain. It not only shapes the land but also wields substantial control concluding the allocation of water and the capacity for groundwater recharge [70].

3.4. Slope

The occurrence and infiltration capacity of groundwater flow is directly influenced by surface slope, one of the most crucial control parameters [9]. It may be used as a general factor in the flow of groundwater [78]. The slope is a crucial component of watershed governance and the possibility of groundwater zone mapping [79,80]. The likelihood of finding groundwater varies greatly depending on the terrain: extremely high, high, moderately high, low, and very low [81,82,83]. The recharging is contrarywise connected to the slope. When it rains, water runs off steep slopes quickly, not having enough time to percolate beneath the land and replenish the aquifer zone. As a result, locations with steeper slopes produce less recharge due to high surface runoff velocity and vertical percolation, thus affecting water occurrences. The slope angle controls recharge by influencing the amount of land surface infiltration, runoff, drainage, and subsurface drainage. On an elevation map (Figure 4b), five groups are recognized: 0–4.34, 4.34–10.14, 10.15–17.18, 17.19–25.67, and 25.68–52.78, covering 46.19, 22.73, 16.29, 10.37, and 4.48% of the basin, respectively (Figure 2b).

3.5. Surface Curvature

Water accumulation, the rate of infiltration, and overflow are all influenced by the curvature of the land surface [73]. The DEM is employed to induce a land curvature map, which is classified into three groups: concave, convex, and flat (Figure 4c). Each class has a certain capability for holding water and may cause runoff. For instance, flat surfaces and areas of curvature, which also have a greater permeation charge, are better at collecting water than convex surfaces. Flat and concave land surfaces are where water tends to collect and penetrate; hence, places with high levels of curvature (or vice versa) have set high-grade rates [45,84,85]. The output map was divided into three categories: (−5.60 to −0.38), (0), and (0.0001–5.21) (Figure 4c).

3.6. Terrain Roughness Index (TR)

The TRI is a geomorphic parameter that is used in revealing groundwater occurrences. The presence of groundwater potentiality corresponds to the TRI values. It was established to assess the landscape’s diversity and can be applied to investigating groundwater [84,86,87]. This factor can be determined through Equation (2) below:
T R I = A b s   ( m a x 2 m i n 2 )
where the max and min are the highest and lowest grades of the pixels.
Based on the accumulation and recharge of precipitates, the TRI map results were classified into four zones: 0.11–0.37, 0.37–0.48, 0.48–0.59, and 0.59–0.88, covering 17.71, 33.73, 33.14, and 15.42, respectively (Figure 4d).

3.7. Drainage Density

The current and historical climatic and hydrological conditions, along with the recharge capacity of shallow alluvial aquifers, are significantly influenced by the characteristics and geometry of the stream system (Figure 5a). In this context, drainage density plays a pivotal role in delineating areas with the potential for water infiltration and storage. The Dd is determined by dividing the stream’s length by A (sq km) [88]. Several factors control watersheds, including the vegetation type, soil properties, infiltration rates, slope gradients, and the composition and structure of the underlying bedrock. In regions with lower drainage density, there is typically greater potential for infiltration and reduced surface runoff. Consequently, areas characterized by low Dd are well-suited for groundwater development [89]. Furthermore, because this density is a measurement of surface runoff, it infers groundwater recharge indirectly. According to [90], higher drainage densities result in less infiltration and faster surface flow. According to [91,92], high drainage density values suggest a low groundwater potential zone since they are conducive to runoff. The drainage density of the studied basin (Figure 5b) ranges from 0.091 to 1.456, which is classified into four classes, 0.091–0.594, 0.594–0.808, 0.808–1.0065, and 1.007–1.456, that occupy an area of 11.38, 30.19, 40, and 18.43%, respectively.

3.8. Topographic Wetness Factor (TWI)

It is a secondary topographic parameter that is employed to reveal topographic effects on the location and capacity of runoff and infiltration capability [93] and thus groundwater occurrences [94]. Such a factor determines the association between the earth’s surface wetness and slope difference [95]. Moreover, it defines how the water accumulation in a place is influenced by topography. Thus, zones of a high slope angle and areas of high altitudes have more runoff, which minimizes their capability for holding water resources. On the other hand, areas of low elevation tend toward topographical wetness or water accumulation [96,97]. The TWI map is categorized into three classes (Figure 5c): 4.25–7.02, 7.02–8.72, 8.72–10.85, and 10.86–17.83, covering 36.20, 34.16, 21.34, and 8.29, respectively.

3.9. Distance to River

Water flow in a basin can be aided by recharging the stream bed and the nearby areas to stream flow. In arid, high-elevation, and desert areas, the infiltration comes from drainage systems holding water from precipitation. Such water seeps into groundwater aquifers. The distances between locations and rivers indicate that groundwater harvesting may be possible. With growing distance from rivers, recharge of groundwater frequently decreases. In order to lead to stream water loss, bedrock reservoirs in valleys do so. In Arc GIS 10, the spatial analyst tools, we used the Euclidean distance tool to excerpt the distance to river classes [97,98,99]. The resulting map (Figure 3d) is divided into the classes 0–281.6, 281.7–609, and 609.1–1670, occupying 47.14, 34.80, and 18.06, respectively.

3.10. Vegetation

For GWPZs, the NDVI is a commonly used parameter [100]. The density and coverage of the vegetation were displayed on a map using the NDVI. The NDVI ranges from −1 to 1. The NDVI map is categorized into four categories depending on the natural break method; they are 210–900, 900–1500, 1500–2500, and 2500–10,000, respectively (Figure 4a), covering areas of 23, 34.04, 19.43, and 23.53%, respectively (Table 1).

3.11. Rainfall

Precipitation is one of the essential hydrologic components that has been standard as a significant basis of aquifer recharge and a primary source of groundwater availability, especially in arid areas [101,102]. Rainfall percolation within the soil promotes the shallow aquifers to be recharged, and the precipitation significantly affects percolation. The upstream of the Wadi Fatima basin obtains an annual precipitation of 300 to 360 mm. Rainfall patterns and intensity control the water availability in any basin. To identify groundwater potential zones and to recharge aquifers hydrologically, rainfall is one of the most important components.
The eastern part (high elevation) receives approximately greater precipitation yearly than the western part (low height). The possibility of groundwater in each geographical area increases due to precipitation [103]. Regarding precipitation from the TRMM, authors may display, document, and measure the precipitation patterns for the watershed under consideration. The mean precipitation was interpolated depending on using the Kriging technique. Five categories for the rainfall intensity map (Figure 6b) are 0.192–0.267, 0.267–0.365, 0.365–0.452, and 0.452–0.620, covering 19.93, 15.18, 43.34, and 21.55, respectively.
Due to its geographical characteristics, located in western Saudi Arabia, Wadi Fatima is frequently subjected to flash flood storms due to excessive, highly intense rainfall. During flood periods, the penetration of rainfall that reaches the local shallow aquifers recharge in desert conditions [104]. Figure 5 shows the areas recently subjected to rainfall storms in Wadi Fatima. Alshehri and Abdelrahman [61] calculated a coarse drainage texture of 0.059 within the Wadi Fatima basin, promoting additional groundwater recharge from precipitation during flood periods and the rainy season. The recharge of the local alluvial aquifer in the area was confirmed with the increase in water levels after the rainfall period. In addition, the amount of infiltrating water into the aquifer was estimated to occur at a rate of roughly 72 and 85 mm/y [105,106]. This can happen during the rainstorms as they allow for water accumulation and infiltration (Figure 7).

3.12. Soil

The soil texture is another effective element for determining places appropriate for recharging processes. Regarding groundwater recharge and agricultural production, soil type is a crucial factor. Thus, knowledge of soil texture is crucial for understanding invasion rats [98]. The sort of soil has a major impact on the flow volume and infiltration [96]. Sand is an example of fine-grained, well-sorted soil whose infiltration rate is lower than coarse-grained soil [107,108]. Rocks’ porosity, permeability, and geometrical characteristics are thus significant in determining a region’s GPZs. The dimensions, shape, and arrangement of soil grains and the pore structures connected to them can have a major impact on water transport [92]. Sandy soil has a rapid amount of infiltration; more coarse, loamy soil with a great sand content has been assumed to have an upper importance; and fine soil with a smaller rate of infiltration owing to a greater amount of clay has been allocated low priority. The planned basin is characterized by sandy loam to loam of different proportions of sand, silt, and clay (Figure 4c). Thus, it is classified into sandy loam, loam 1, loam 2, and loam 3, ordered from high to infiltration capacity and covering 2.36, 3.16, 13.22, and 81.26, respectively.

3.13. Lineaments

Lineaments have an expressive effect on the circulation and storage of water, as well as how surface runoff gets absorbed into the ground [91]. Groundwater recharge systems, as well as movement directions, are controlled by fracture and fault systems. The fracture and fault systems control the groundwater recharge systems and movement directions. Linear features promoting secondary porosity, known as lineaments, play a significant role in the groundwater dynamics of crystallized terrain. These geological characteristics, whether linear or curved, influence the development and flow of groundwater within such regions. Lineaments, which encompass features like cracks, and joints, often originate due to tectonic stress and strain. Notably, these lineaments facilitate the recharge of rainfall and contribute to the replenishment of hard-rock aquifers. Numerous studies have emphasized the correlation between lineament density and well productivity, underscoring that a higher density of lineaments is associated with increased groundwater availability and, consequently, greater well yields [100,102]. The area is classified into five classes (Figure 4d) including 0–7.95, 7.95–18.75, 18.76–29.83, 29.84–42.33, and 42.34–72.45, respectively.

3.14. Groundwater Prospective Map GPZs

The GPZs were established by combining elevation, slope, curvature, drainage density, distance to river, TWI, rainfall, TRI, NDVI, soil, and lineaments data from satellite pictures, hydrologic and geologic. According to the likelihood of GW, the area was separated into six different zones (Figure 6). The six categories are excellent (10.98%), very high (21.98%), high (24.99%), moderate (21.44%), low (14.70%), and very low (5.91%). The region with the highest potential is now clearly visible (Figure 8). The GW recharge zones are supported with sand and gravel, depressions, and a high flat or gentle slope in this area. The gathered wells confirmed the GPZs to validate the estimated model. Additionally, places with vegetation and agricultural activities relate to good groundwater potential zones. Zones with a high slope, elevated ranges, and low density have little infiltration. Dams in this range would make it possible to capture water and protect the downstream areas as well as newly growing urban areas [103]. Zones with well-sorted sand that promote high porosity variations reveal high infiltration capability.
According to the computational models, high-ranking probabilities are consistent with the well location and vegetated areas. As a result, abundant spring sites coincide with the area of high to excellent potentiality, which does not display more springs from “Low” potential zones. The GWPZ map of the research area is confirmed through the ROC curve (Figure 9). The usefulness of the system’s assessment is shown with the fact that the AUC can be utilized to define the system’s ability to properly anticipate both the occurrence of “groundwater” and its absence from the system. Values for the AUC range are from 0 to 1 (Figure 9), with lower values denoting beneficial predictions and higher values denoting more reliable estimations. The AUC for the model is 0.73, which indicates improved accuracy. As multiple wells are compatible with the high-prospective zones, the field investigations verified the GWPZ map. Several farms also correlate with those zones (Figure 8). Based on the Sentinel-2 band combining 12, 8, and 3, in R, G, and B, accordingly, the planted areas and signature of water shape the most surface area of the extremely high to extreme GWPZs (Figure 10).

4. Discussion

Wadi Fatima’s geologic and topographic setting in western Saudi Arabia promotes the rainfall conditions at the elevated upstream areas that drain to the Red Sea at the city of Jeddah. Such a setting gave it a promising area for water harvesting and accumulation [80]. The applied model utilized multi-criteria of topography, meteorology, geology, structure, and hydrology parameters. Areas of high potentiality are compatible with zones of low topography, high lineament density, and flat-to-gentle slopes [50,100,105]. Additionally, areas with loose sediments in the downstream and highly vegetated areas would promote infiltration and minimize runoff because of high porosity and permeability [106,107,108].
The wet and moist soil in these locations is another effect of the high TWI values [78,98]. This suggests that groundwater has accumulated in these areas. The combined data in a GIS model allowed for highlighting such promising areas consistent with groundwater sites. Such a source of water allowed the reclamation of land for diverse agricultural purposes and the development of new settlements at the down- and midstream areas (Figure 11). Sentinel-1 imagery employing InSAR CCD data proves significant variations in LU/LC, particularly in the context of agricultural and other human activities in the essentially downstream region. Such land cover characteristics are evidence for the presence of water and validate the results of GWPZs [95,107]. The developed model’s validity was assessed through rigorous verification against multiple sources of data, including field observations, previous geophysical investigations, and well-yield information, deemed to have the highest potential for groundwater presence within the study region. Remarkably, the results derived from the groundwater potential zone (GWPZ) map align consistently with the findings from geoelectric assessments, indicating a notable potential for substantial groundwater resources within the shallow aquifer of Wadi Fatima. Moreover, the dense concentration of wells in specific areas correlates with the high transmissivity values of the shallow aquifer, which typically range from 300 m2/d to 1800 m2/d [91]. The storability values, averaging around 0.06, further affirm the water-yielding capacity of the aquifer, with specific yield values falling within the range of 0.12 to 0.2 [11,12,13]. These numerical values collectively suggest that the aquifer yields are situated in the mid-to-high potential range, with favorable water accessibility for the wells. Additional insights provided with aquifer testing and geophysical surveys, as referenced in [23,109], estimate the groundwater volume at an impressive 42 × 106 m3. This verification process solidly substantiates the reliability and representativeness of the GWPZ generated through GIS techniques, thereby underscoring its suitability for practical applications in the region.

5. Conclusions

Groundwater is an extremely precious source of water for conducting industrial and human activities in desert lands. Remote sensing imagery and GIS techniques were efficiently merged to uncover and assess data for finding water resources in varied climatic conditions. To determine probable zones of groundwater potentiality, W. Fatima, located in the Makka region, is explored using GIS and satellite imagery methods. Many GIS maps that show the geology, geomorphic, climatic, and hydrologic conditions have been processed, normalized, and revealed the groundwater potential zones, which are categorized into five zones: excellent (10.98%), very high (21.98%), high (24.99%), moderate (21.44%), low (14.70%), and very low (5.91%). Overall, investigating the GWPZ area utilizing GIS and remote sensing methods is extremely beneficial to sustainability and decision makers. The GWPZ was examined and matched to the receiver operating characteristic (ROC) curves and field data, sites of dug wells, and the width of the water-bearing formations inferred from geophysical data. Thus, the verification proves that the GWPZ developed from GIS techniques is reliable and representative. The study showed that data derived from active remote sensing techniques have the capability to reveal terrain characteristics, hydrologic parameters, and rainfall intensity. Moreover, applying an overlay analysis through the GIS technique has proven to be a powerful technique in revealing areas of potential water resources in arid conditions.

Author Contributions

M.A.: Conceptualization, Methodology, Writing—Original Draft, Writing—Review and Editing, Software, Investigation, Validation. F.A. (Fathy Abdalla): Conceptualization, Methodology, Writing—Original Draft, Writing—Review and Editing, Software, Investigation, Analysis, Validation. F.A. (Fahad Alshehri): Conceptualization, Methodology, Validation, Investigation, Formal Analysis, Project Funding, Supervision, Project Management. C.B.P.: Writing—Original Draft, Writing—Review and Editing, Investigation, Formal Analysis. All authors have read and agreed to the published version of the manuscript.

Funding

This research was funded by the Deputyship for Research & Innovation, Ministry of Education in Saudi Arabia, for funding this research work through project no. IFKSURC-1-7315.

Data Availability Statement

The data are not publicly available due to further research.

Acknowledgments

The authors extend their appreciation to the Deputyship for Research & Innovation, Ministry of Education in Saudi Arabia, for funding this research work through project no. IFKSURC-1-7315.

Conflicts of Interest

The authors declare no conflict of interest.

References

  1. Bharti, V.; Roshni, T.; Jha, M.K.; Ghorbani, M.A.; Ibrahim, O.R.A. Complex network analysis of groundwater level in Sina Basin, Maharashtra, India. Environ. Dev. Sustain. 2023. [Google Scholar] [CrossRef]
  2. Chow, V.T.; Maidment, D.R.; Mays, L.W. Applied Hydrology; McGraw-Hill Book, Co.: Singapore, 1988. [Google Scholar]
  3. Li, Y.; Mi, W.; Ji, L.; He, Q.; Yang, P.; Xie, S.; Bi, Y. Urbanization and agriculture intensification jointly enlarge the spatial inequality of river water quality. Sci. Total Environ. 2023, 878, 162559. [Google Scholar] [CrossRef] [PubMed]
  4. Zhao, Z.; Xu, G.; Zhang, N.; Zhang, Q. Performance analysis of the hybrid satellite-terrestrial relay network with opportunistic scheduling over generalized fading channels. IEEE Trans. Veh. Technol. 2022, 71, 2914–2924. [Google Scholar] [CrossRef]
  5. Zhao, M.; Zhou, Y.; Li, X.; Cheng, W.; Zhou, C.; Ma, T.; Huang, K. Mapping urban dynamics (1992–2018) in Southeast Asia using consistent nighttime light data from DMSP and VIIRS. Remote Sens. Environ. 2020, 248, 111980. [Google Scholar] [CrossRef]
  6. Hasanuzzaman, M.; Mandal, M.H.; Hasnine, M.; Shit, P.K. Groundwater potential mapping using multi-criteria decision, bivariate statistic and machine learning algorithms: Evidence from Chota Nagpur Plateau, India. Appl. Water Sci. 2022, 12, 58. [Google Scholar] [CrossRef]
  7. Connor, R. The United Nations World Water Development Report 2015: Water for a Sustainable World; UNESCO: Paris, France, 2015; 122p. [Google Scholar]
  8. Li, R.; Zhang, H.; Chen, Z.; Yu, N.; Kong, W.; Li, T.; Liu, Y. Denoising method of ground-penetrating radar signal based on independent component analysis with multifractal spectrum. Measurement 2022, 192, 110886. [Google Scholar] [CrossRef]
  9. Zhuo, Z.; Du, L.; Lu, X.; Chen, J.; Cao, Z. Smoothed Lv Distribution Based Three-Dimensional Imaging for Spinning Space Debris. IEEE Trans. Geosci. Remote Sens. 2022, 60, 5113813. [Google Scholar] [CrossRef]
  10. Chakraborty, B.; Roy, S.; Bera, A.; Adhikary, P.P.; Bera, B.; Sengupta, D.; Bhunia, G.S.; Shit, P.K. Groundwater vulnerability assessment using GIS-based DRASTIC model in the upper catchment of Dwarakeshwar river basin, West Bengal, India. Environ. Earth Sci. 2021, 81, 2. [Google Scholar] [CrossRef]
  11. Shit, P.; Bhunia, G.; Bhattacharya, M.; Patra, B. Assessment of domestic water use pattern and drinking water quality of Sikkim, North Eastern Himalaya, India: A cross-sectional Study. J. Geol. Soc. India 2019, 94, 507–514. [Google Scholar] [CrossRef]
  12. Chen, W.; Panahi, M.; Khosravi, K.; Pourghasemi, H.R.; Rezaie, F.; Parvinnezhad, D. Spatial prediction of groundwater potentiality using ANFIS ensembled with teaching-learning-based and biogeography-based optimization. J. Hydrol. 2019, 572, 435–448. [Google Scholar] [CrossRef]
  13. Alshehri, F.; Sultan, M.; Karki, S.; Alwagdani, E.; Alsefry, S.; Alharbi, H.; Sahour, H.; Sturchio, N. Mapping the distribution of shallow groundwater occurrences using Remote Sensing-based statistical modeling over southwest Saudi Arabia. Remote Sens. 2020, 12, 1361. [Google Scholar] [CrossRef]
  14. Liu, H.; Li, J.; Meng, X.; Zhou, B.; Fang, G.; Spencer, B.F. Discrimination Between Dry and Water Ices by Full Polarimetric Radar: Implications for China’s First Martian Exploration. IEEE Trans. Geosci. Remote Sens. 2022, 61, 5100111. [Google Scholar] [CrossRef]
  15. Sun, S.; Liu, H.; Zhang, J.; Wang, W.; Xu, P.; Zhu, X.; Shengli, W. Application of a novel coagulant in reservoir water treatment in Qingdao. Desalination Water Treat. 2023, 284, 49–60. [Google Scholar] [CrossRef]
  16. Li, W.; Zhu, J.; Fu, L.; Zhu, Q.; Xie, Y.; Hu, Y. An augmented representation method of debris flow scenes to improve public perception. Int. J. Geogr. Inf. Sci. 2021, 35, 1521–1544. [Google Scholar] [CrossRef]
  17. UNESCO. The United Nations World Water Development Report (WWDR) (2018): In Nature-Based Solutions for Water; UNESCO: Paris, France, 2018. [Google Scholar]
  18. World Health Organization (WHO). Progress on Sanitation and Drinking Water: 2015 Update and MDG Assessment; WHO: Geneva, Switzerland, 2015.
  19. Abdelkareem, M.; Abbas, M.M.; Akawy, A. Delineating the Potential Areas of Rainwater Harvesting in Arid Regions Using Remote Sensing and GIS Techniques. Water 2023, 15, 3592. [Google Scholar] [CrossRef]
  20. Gao, C.; Hao, M.; Chen, J.; Gu, C. Simulation and design of joint distribution of rainfall and tide level in Wuchengxiyu Region, China. Urban Clim. 2021, 40, 101005. [Google Scholar] [CrossRef]
  21. Xu, Z.; Li, X.; Li, J.; Xue, Y.; Jiang, S.; Liu, L.; Sun, Q. Characteristics of Source Rocks and Genetic Origins of Natural Gas in Deep Formations, Gudian Depression, Songliao Basin, NE China. ACS Earth Space Chem. 2022, 6, 1750–1771. [Google Scholar] [CrossRef]
  22. Xu, J.; Lan, W.; Ren, C.; Zhou, X.; Wang, S.; Yuan, J. Modeling of coupled transfer of water, heat and solute in saline loess considering sodium sulfate crystallization. Cold Reg. Sci. Technol. 2021, 189, 103335. [Google Scholar] [CrossRef]
  23. Darma, S.; Fahrunsyah, F. Effect of Soil Damage on Carrying Capacity of Biomass Production: A Lesson from Tanjung Selor District—Tanjung Redeb, Indonesia. Univers. J. Agric. Res. 2022, 10, 682–690. [Google Scholar] [CrossRef]
  24. Zhao, F.; Wu, H.; Zhu, S.; Zeng, H.; Zhao, Z.; Yang, X.; Zhang, S. Material stock analysis of urban road from nighttime light data based on a bottom-up approach. Environ. Res. 2023, 228, 115902. [Google Scholar] [CrossRef]
  25. Bai, B.; Rao, D.; Chang, T.; Guo, Z. A nonlinear attachment-detachment model with adsorption hysteresis for suspension-colloidal transport in porous media. J. Hydrol. 2019, 578, 124080. [Google Scholar] [CrossRef]
  26. Tian, H.; Pei, J.; Huang, J.; Li, X.; Wang, J.; Zhou, B.; Wang, L. Garlic and Winter Wheat Identification Based on Active and Passive Satellite Imagery and the Google Earth Engine in Northern China. Remote Sens. 2020, 12, 3539. [Google Scholar] [CrossRef]
  27. Hung, L.; Batelaan, O.; Smedt, F.D. Lineament extraction and analysis, comparison of LANDSAT ETM and ASTER imagery. Case study: Suoimuoi tropical karst catchment, Vietnam. In SPIE Remote Sensing for Environmental Monitoring, GIS Applications, and Geology V; SPIE: Bruges, Belgium, 2005. [Google Scholar]
  28. Abd Manap, M.; Nampak, H.; Pradhan, B.; Lee, S.; Sulaiman, W.N.A.; Ramli, M.F. Application of probabilistic-based frequency ratio model in groundwater potential mapping using remote sensing data and GIS. Arab. J. Geosci. 2014, 7, 711–724. [Google Scholar] [CrossRef]
  29. Abdelkareem, M.; Al-Arifi, N.; Abdalla, F.; Mansour, A.; El-Baz, F. Fusion of remote sensing data using GIS-based AHP-weighted overlay techniques for groundwater sustainability in arid regions. Sustainability 2022, 14, 7871. [Google Scholar] [CrossRef]
  30. Avand, M.; Janizadeh, S.; Tien Bui, D.; Pham, V.H.; Ngo, P.T.T.; Nhu, V.-H. A tree-based intelligence ensemble approach for spatial prediction of potential groundwater. Int. J. Digit. Earth 2020, 13, 1408–1422. [Google Scholar] [CrossRef]
  31. Salman, S.; Shahid, S.; Mohsenipour, M.; Asgari, H. Impact of land use on groundwater quality of Bangladesh. Sustain. Water Resour. Manag. 2018, 4, 1031–1036. [Google Scholar] [CrossRef]
  32. Sun, T.; Cheng, W.; Abdelkareem, M.; Al-Arifi, N. Mapping Prospective Areas of Water Resources and Monitoring Land Use/Land Cover Changes in an Arid Region Using Remote Sensing and GIS Techniques. Water 2022, 14, 2435. [Google Scholar] [CrossRef]
  33. Tian, H.; Huang, N.; Niu, Z.; Qin, Y.; Pei, J.; Wang, J. Mapping Winter Crops in China with Multi-Source Satellite Imagery and Phenology-Based Algorithm. Remote Sens. 2019, 11, 820. [Google Scholar] [CrossRef]
  34. Zhou, G.; Li, W.; Zhou, X.; Tan, Y.; Lin, G.; Li, X.; Deng, R. An innovative echo detection system with STM32 gated and PMT adjustable gain for airborne LiDAR. Int. J. Remote Sens. 2021, 42, 9187–9211. [Google Scholar] [CrossRef]
  35. Zhou, G.; Deng, R.; Zhou, X.; Long, S.; Li, W.; Lin, G.; Li, X. Gaussian Inflection Point Selection for LiDAR Hidden Echo Signal Decomposition. IEEE Geosci. Remote Sens. Lett. 2021, 19, 6502705. [Google Scholar] [CrossRef]
  36. Li, S.; Abdelkareem, M.; Al-Arifi, N. Mapping Groundwater Prospective Areas Using Remote Sensing and GIS-Based Data Driven Frequency Ratio Techniques and Detecting Land Cover Changes in the Yellow River Basin, China. Land 2023, 12, 771. [Google Scholar] [CrossRef]
  37. Abdelkareem, M.; El-Baz, F.; Askalany, M.; Akawy, A.; Ghoneim, E. Groundwater prospect map of Egypt’s Qena Valley using data fusion. Int. J. Image Data Fusion 2012, 3, 169–189. [Google Scholar] [CrossRef]
  38. Chen, W.; Zhao, X.; Tsangaratos, P.; Shahabi, H.; Ilia, I.; Xue, W.; Wang, X.; Ahmad, B.B. Evaluating the usage of tree-based ensemble methods in groundwater spring potential mapping. J. Hydrol. 2020, 583, 124602. [Google Scholar]
  39. Naghibi, S.A.; Dolatkordestani, M.; Rezaei, A.; Amouzegari, P.; Heravi, M.; Kalantar, B.; Pradhan, B. Application of rotation forest with decision trees as base classifier and a novel ensemble model in spatial modeling of groundwater potential. Environ. Monit. Assess. 2019, 191, 248. [Google Scholar]
  40. Abdelkareem, M.; El-Baz, F. Analyses of optical images and radar data reveal structural features and predict groundwater accumulations in the central Eastern Desert of Egypt. Arab. J. Geosci. 2015, 8, 2653–2666. [Google Scholar] [CrossRef]
  41. Alshehri, F.; Abdelrahman, K. Groundwater Potentiality of Wadi Fatimah, Western Saudi Arabia: Geophysical and Remote Sensing Integrated Approach. Water 2023, 15, 1828. [Google Scholar]
  42. Dar, I.A.; Sankar, K.; Dar, M.A. Deciphering groundwater potential zones in hard rock terrain using geospatial technology. Environ. Monit. Assess. 2011, 173, 597–610. [Google Scholar] [CrossRef] [PubMed]
  43. Yariyan, P.; Avand, M.; Omidvar, E.; Pham, Q.; Linh, N.; Tiefenbacher, J. Optimization of statistical and machine learning hybrid models for groundwater potential mapping. Geocarto Int. 2020, 11, 2282–2314. [Google Scholar] [CrossRef]
  44. Rokade, V.M.; Kundal, P.; Joshi, A.K. Groundwater potential modeling through remote sensing and GIS: A case study from Rajura Taluka, Chand rapur district, Maharashtra. J. Geol. Soc. India 2007, 69, 943–948. [Google Scholar]
  45. Masood, M.U.; Haider, S.; Rashid, M.; Aldlemy, M.S.; Pande, C.B.; Đurin, B.; Homod, R.Z.; Alshehri, F.; Elkhrachy, I. Quantifying the Impacts of Climate and Land Cover Changes on the Hydrological Regime of a Complex Dam Catchment Area. Sustainability 2023, 15, 15223. [Google Scholar] [CrossRef]
  46. Pande, C.B.; Moharir, K.N.; Singh, S.K.; Varade, A.M.; Ahmed Elbeltagie, S.F.R.; Khadri, P.C. Estimation of crop and forest biomass resources in a semi-arid region using satellite data and GIS. J. Saudi Soc. Agric. Sci. 2021, 20, 302–311. [Google Scholar] [CrossRef]
  47. Zhu, Q.; Abdelkareem, M. Mapping groundwater potential zones using a knowledge-driven approach and GIS analysis. Water 2021, 13, 579. [Google Scholar] [CrossRef]
  48. Senthilkumar, M.; Gnanasundar, D.; Arumugam, R. Identifying groundwater recharge zones using remote sensing & GIS techniques in Amaravathi aquifer system, Tamil Nadu, South India. Sustain. Environ. Res. 2019, 29, 15. [Google Scholar]
  49. Riad, P.; Hassan, A.; Abdel Salam, M.; Nour El Din, M. Application of the overlay weighted model and boolean logic to determine the best locations for artificial recharge of groundwater. J. Urban. Environ. Eng. 2011, 5, 57–66. [Google Scholar] [CrossRef]
  50. Maity, B.; Mallick, S.; Das, S.; Rudra, S. Comparative analysis of groundwater potentiality zone using fuzzy AHP, frequency ratio and Bayesian weights of evidence methods. Appl. Water Sci. 2022, 12, 12–63. [Google Scholar] [CrossRef]
  51. Moghaddam, D.D.; Rahmati, O.; Haghizadeh, A.; Kalantari, Z.A. Modeling Comparison of Groundwater Potential Mapping in a Mountain Bedrock Aquifer: QUEST, GARP, and RF Models. Water 2020, 12, 679. [Google Scholar] [CrossRef]
  52. Zhou, G.; Zhang, R.; Huang, S. Generalized Buffering Algorithm. IEEE Access 2021, 9, 27140–27157. [Google Scholar] [CrossRef]
  53. Halder, S.; Roy, M.B.; Roy, P.K. Analysis of groundwater level trend and groundwater drought using standard groundwater level Index: A case study of an eastern river basin of West Bengal, India. SN Appl. Sci. 2020, 2, 1–24. [Google Scholar] [CrossRef]
  54. Subyani, M.; Alhamadi, F. Rainfall-runoff modeling in the Al-Madinah area of western Saudi Arabia. J. Environ. Hydrol. 2011, 1–19. [Google Scholar]
  55. Moore, T.; Al-Rehaili, H. Geologic Map of the Makkah Quadrangle, Sheet 21D, Kingdom of Saudi Arabia; Ministry of Petroleum and Mineral Resources, Deputy Ministry for Mineral Resources Publication: Jeddah, Saudi Arabia, 1989.
  56. Al Sefry, S.A.; Al Ghamdi, S.A.; Ashi, W.A.; Bardi, W.A. Wadi Fatimah Aquifer as Strategic Groundwater Storage for Makkah Area. In Proceedings of the 6th Gulf Water Conference, Riyadh, Saudi Arabia, 8–12 March 2003. 10p. [Google Scholar]
  57. O’Callaghan, F.; Mark, D. The extraction of drainage networks from digital elevation data. Comput. Vis. Graph. Image Process 1984, 28, 323–3444. [Google Scholar] [CrossRef]
  58. Yin, L.; Wang, L.; Ge, L.; Tian, J.; Yin, Z.; Liu, M.; Zheng, W. Study on the Thermospheric Density Distribution Pattern during Geomagnetic Activity. Appl. Sci. 2023, 13, 5564. [Google Scholar] [CrossRef]
  59. Yin, Z.; Liu, Z.; Liu, X.; Zheng, W.; Yin, L. Urban heat islands and their effects on thermal comfort in the US: New York and New Jersey. Ecol. Indic. 2023, 154, 110765. [Google Scholar] [CrossRef]
  60. Mi, C.; Liu, Y.; Zhang, Y.; Wang, J.; Feng, Y.; Zhang, Z. A Vision-based Displacement Measurement System for Foundation Pit. IEEE Trans. Instrum. Measurement 2023, 72. [Google Scholar] [CrossRef]
  61. Yang, M.; Wang, H.; Hu, K.; Yin, G.; Wei, Z. IA-Net: An Inception–Attention-Module-Based Network for Classifying Underwater Images from Others. IEEE J. Ocean Eng. 2022, 47, 704–717. [Google Scholar] [CrossRef]
  62. Luo, J.; Niu, F.; Lin, Z.; Liu, M.; Yin, G.; Gao, Z. Abrupt increase in thermokarst lakes on the central Tibetan Plateau over the last 50 years. CATENA 2022, 217, 106497. [Google Scholar] [CrossRef]
  63. Cheng, Y.; Lan, S.; Fan, X.; Tjahjadi, T.; Jin, S.; Cao, L. A dual-branch weakly supervised learning based network for accurate mapping of woody vegetation from remote sensing images. Int. J. Appl. Earth Obs. Geoinf. 2023, 124, 103499. [Google Scholar] [CrossRef]
  64. Haider, S.; Masood, M.U.; Rashid, M.; Alshehri, F.; Pande, C.B.; Katipoğlu, O.M.; Costache, R. Simulation of the Potential Impacts of Projected Climate and Land Use Change on Runoff under CMIP6 Scenarios. Water 2023, 15, 3421. [Google Scholar] [CrossRef]
  65. Liu, Z.; Xu, J.; Liu, M.; Yin, Z.; Liu, X.; Yin, L.; Zheng, W. Remote sensing and geostatistics in urban water-resource monitoring: A review. Mar. Freshw. Res. 2023, 74, 747–765. [Google Scholar] [CrossRef]
  66. Benjmel, K.; Amraoui, F.; Boutaleb, S.; Ouchchen, M.; Tahiri, A.; Touab, A. Mapping of Groundwater Potential Zones in Crystalline Terrain Using Remote Sensing, GIS Techniques, and Multicriteria Data Analysis (Case of the Ighrem Region, Western Anti-Atlas, Morocco). Water 2020, 12, 471. [Google Scholar] [CrossRef]
  67. Zhu, X.; Xu, Z.; Liu, Z.; Liu, M.; Yin, Z.; Yin, L.; Zheng, W. Impact of dam construction on precipitation: A regional perspective. Mar. Freshw. Res. 2022, 74, 877–890. [Google Scholar] [CrossRef]
  68. Yin, L.; Wang, L.; Li, T.; Lu, S.; Yin, Z.; Liu, X.; Zheng, W. U-Net-STN: A Novel End-to-End Lake Boundary Prediction Model. Land 2023, 12, 1602. [Google Scholar] [CrossRef]
  69. Yousefi, S.; Sadhasivam, N.; Pourghasemi, H.; Ghaffari Nazarlou, H.; Golkar, F.; Tavangar, S.; Santosh, M. Groundwater spring potential assessment using new ensemble data mining techniques. Measurement 2020, 157, 107652. [Google Scholar] [CrossRef]
  70. Karimi-Rizvandi, S.; Goodarzi, V.; Afkoueieh, J.; Chung, I.-M.; Kisi, O.; Kim, S.; Linh, T. Groundwater-potential mapping using a self-learning bayesian network model: A comparison among metaheuristic algorithms. Water 2021, 13, 658. [Google Scholar] [CrossRef]
  71. Liu, Q.Y.; Li, D.Q.; Tang, X.S.; Du, W. Predictive Models for Seismic Source Parameters Based on Machine Learning and General Orthogonal Regression Approaches. Bull. Seismol. Soc. Am. 2023. [Google Scholar] [CrossRef]
  72. Al Saud, M. Mapping potential areas for groundwater storage in Wadi Aurnah Basin, western Arabian Peninsula, using remote sensing and geographic information system techniques. Hydrogeol. J. 2018, 18, 1481–1495. [Google Scholar] [CrossRef]
  73. Gupta, M.; Srivastava, P.K. Integrating GIS and remote sensing for identification of groundwater potential zones in the hilly terrain of Pavagarh, Gujarat, India. Water Int. 2010, 35, 233–245. [Google Scholar] [CrossRef]
  74. Golkarian, A.; Naghibi, S.A.; Kalantar, B.; Pradhan, B. Groundwater potential mapping using C5.0, random forest, and multivariate adaptive regression spline models in GIS. Environ. Monit. Assess. 2018, 190, 149. [Google Scholar] [CrossRef] [PubMed]
  75. Elewa, H.H.; Qaddah, A.A.; El-Feel, A.A. Determining potential sites for runoff water harvesting using remote sensing and geographic information systems-based modeling in Sinai. Am. J. Environ. Sci. 2012, 8, 42–55. [Google Scholar]
  76. Kalantar, B.; Al-Najjar, H.; Pradhan, B.; Saeidi, V.; Halin, A.; Ueda, N.; Naghibi, A. Optimized Conditioning Factors Using Machine Learning Techniques for Groundwater Potential Mapping. Water 2019, 11, 1909. [Google Scholar] [CrossRef]
  77. Tehrany, M.S.; Kumar, L.; Jebur, M.N.; Shabani, F. Evaluating the application of the statistical index method in flood susceptibility mapping and its comparison with frequency ratio and logistic regression methods. Geomat. Nat. Hazards Risk 2019, 10, 79–101. [Google Scholar] [CrossRef]
  78. Harini, P.; Sahadevan, D.K.; Das, I.C.; Manikyamba, C.; Durgaprasad, M.; Nandan, M.J. Regional Groundwater Assessment of Krishna River Basin Using Integrated GIS Approach. J. Indian Soc. Remote Sens. 2018, 46, 1365–1377. [Google Scholar] [CrossRef]
  79. Magesh, N.; Chandrasekar, N.; Soundranayagam, J. Delineation of groundwater potential zones in Theni district, Tamil Nadu, using remote sensing, GIS and MIF techniques. Geosci. Front. 2012, 3, 189–196. [Google Scholar] [CrossRef]
  80. Cevik, E.; Topal, T. GIS-based landslide susceptibility mapping for a problematic segment of the natural gas pipeline, Hendek (Turkey). Environ. Earth Sci. 2003, 44, 949–962. [Google Scholar]
  81. Yeh, F.; Lee, H.; Hsu, C.; Chang, P. GIS for the assessment of the groundwater recharge potential zone. Environ. Geol. 2009, 58, 185–195. [Google Scholar] [CrossRef]
  82. Pinto, D.; Shrestha, S.; Babel, M.; Ninsawat, S. Delineation of groundwater potential zones in the Comoro watershed, Timor Leste using GIS, remote sensing and analytic hierarchy process (AHP) technique. Appl. Water Sci. 2015, 7, 503–519. [Google Scholar] [CrossRef]
  83. Rahmati, O.; Naghibi, S.A.; Shahabi, H.; Bui, D.T.; Pradhan, B.; Azareh, A.; Rafiei-Sardooi, E.; Samani, A.N.; Melesse, A.M. Groundwater spring potential modelling: Comprising the capability and robustness of three different modeling approaches. J. Hydrol. 2018, 565, 248–261. [Google Scholar] [CrossRef]
  84. Achu, L.; Thomas, J.; Reghunath, R. Multi-criteria decision analysis for delineation of groundwater potential zones in a tropical river basin using remote sensing, GIS and analytical hierarchy process (AHP). Groundw. Sustain. Dev. 2020, 10, 100365. [Google Scholar] [CrossRef]
  85. Pourghasemi, H.; Beheshtirad, M. Assessment of a data-driven evidential belief function model and GIS for groundwater potential mapping in the Koohrang Watershed, Iran. Geocarto Int. 2014, 30, 662–685. [Google Scholar] [CrossRef]
  86. Bera, A.; Mukhopadhyay, B.P.; Barua, S. Delineation of groundwater potential zones in Karha river basin, Maharashtra, India, using AHP and geospatial techniques. Arab. J. Geosci. 2020, 13, 693. [Google Scholar] [CrossRef]
  87. Alyamani, M.; Hussein, T. Hydrochemical study of groundwater in recharge area, Wadi Fatimah basin, Saudi Arabia. GeoJournal 1995, 37, 81–89. [Google Scholar] [CrossRef]
  88. Jaafarzadeh, M.S.; Tahmasebipour, N.; Haghizadeh, A.; Pourghasemi, H.R.; Rouhani, H. Groundwater recharge potential zonation using an ensemble of machine learning and bivariate statistical models. Sci. Rep. 2021, 11, 5587. [Google Scholar] [PubMed]
  89. Beven, K.J.; Kirkby, M.J. A physically based, variable contributing area model of basin hydrology/Un modele a base physique de zone d’appel variable de l’hydrologie du bassin versant. Hydrol. Sci. J. 1979, 24, 43–69. [Google Scholar] [CrossRef]
  90. Singh, A.; Prakash, R. An integrated approach of remote sensing, geophysics and GIS to evaluation of groundwater potentiality of Ojhala sub watershed, Mirzapur district, UP, India. In Proceedings of the First Asian Conference on GIS, GPS, Aerial Photography and Remote Sensing, Bangkok, Thailand, 7–9 August 2002. [Google Scholar]
  91. Guru, B.; Seshan, K.; Bera, S. Frequency ratio model for groundwater potential mapping and its sustainable management in cold desert, India. J. King Saud Univ. Sci. 2017, 29, 33. [Google Scholar] [CrossRef]
  92. Shekhar, S.; Pandey, A. Delineation of groundwater potential zone in hard rock terrain of India using remote sensing, geographical information system (GIS) and analytic hierarchy process (AHP) techniques. Geocarto Int. 2015, 30, 402–421. [Google Scholar] [CrossRef]
  93. Hong, Y.; Abdelkareem, M. Integration of remote sensing and a GIS-based method for revealing prone areas to flood hazards and predicting optimum areas of groundwater resources. Arab. J. Geosci. 2022, 15, 114. [Google Scholar] [CrossRef]
  94. Morin, E.; Grodek, T.; Dahan, O.; Benito, G.; Kulls, C.; Jacoby, Y.; Van Langenhove, G.; Seely, M.; Enzel, Y. Flood routing and alluvial aquifer recharge along the ephemeral arid Kuiseb River, Namibia. J. Hydrol. 2009, 368, 262–275. [Google Scholar] [CrossRef]
  95. Memon, B.A.; Kazi, A.; Bazuhair, A.S. Hydrology of Wadi Al-Yammaniyah, Saudi Arabia. Groundwater 1984, 22, 406–411. [Google Scholar] [CrossRef]
  96. Rajesh, J.; Pande, C.B.; Kadam, S.A.; Gorantiwar, S.D.; Shinde, M.G. Exploration of groundwater potential zones using analytical hierarchical process (AHP) approach in the Godavari river basin of Maharashtra in India. Appl. Water Sci. 2021, 11, 182. [Google Scholar] [CrossRef]
  97. Senanayake, I.; Dissanayake, D.; Mayadunna, B.; Weerasekera, W. An approach to delineate groundwater recharge potential sites in Ambalantota, Sri Lanka using GIS techniques. Geosci. Front. 2016, 7, 115–124. [Google Scholar] [CrossRef]
  98. Sen, Z. Applied Hydrogeology for Scientists and Engineers; CRC Lewis Publishers: Boca Raton, FL, USA, 1995; 465p. [Google Scholar]
  99. Dahan, O.; Shani, Y.; Enzel, Y.; Yechieli, Y.; Yakirevich, A. Direct measurements of floodwater infiltration into shallow alluvial aquifers. J. Hydrol. 2007, 344, 157–170. [Google Scholar] [CrossRef]
  100. Opp, C. Bodenkörper. In Geographie—Physische Geographie und Humangeographie, 3rd ed.; Gebhardt, H., Glaser, R., Radtke, U., Reuber, P., Vött, A., Eds.; Springer: Berlin/Heidelberg, Germany, 2011; pp. 485–490. [Google Scholar]
  101. Subba Rao, N. numerical scheme for groundwater development in a watershed basin of basement terrain: A case study from India. Hydrogeol. J. 2009, 17, 379–396. [Google Scholar] [CrossRef]
  102. ElKashouty, M.; Khan, M.Y.A.; Alharbi, K.; Pande, C.B.; Subyani, A.M.; Tian, F. Hydrogeology and Hydrogeochemistry of Saline Groundwater Seepage Zones in Wadi Bani Malik Basin, Jeddah, Saudi Arabia: Impacts on Soil and Water Resources. Water 2023, 15, 3464. [Google Scholar] [CrossRef]
  103. Souissi, D.; Msaddek, M.H.; Zouhri, L.; Chenini, I.; El May, M.; Dlala, M. Mapping groundwater recharge potential zones in arid region using GIS and Landsat approaches, southeast Tunisia. Hydrol. Sci. J. 2018, 63, 251–268. [Google Scholar] [CrossRef]
  104. Barman, J.; Biswas, B.; Soren, D.D.L. Groundwater trend analysis and regional groundwater drought assessment of a semi-arid region of Rajasthan, India. Environ. Dev. Sustain. 2023, 1–25. [Google Scholar] [CrossRef]
  105. Muthumaniraja, C.K.; Anbazhagan, S.; Jothibasu, A.; Chinnamuthu, M. Remote sensing and fuzzy logic approach for artificial recharge studies in hard rock Terrain of South India. GIS Geostat. Tech. Groundw. Sci. 2019, 91–112. [Google Scholar] [CrossRef]
  106. Mukherjee, I.; Singh, U. Delineation of groundwater potential zones in a drought-prone semi-arid region of east India using GIS and analytical hierarchical process techniques. CATENA 2020, 194, 104681. [Google Scholar] [CrossRef]
  107. Cuthbert, M.O.; Acworth, R.I.; Andersen, M.S.; Larsen, J.R.; McCallum, A.M.; Rau, G.C.; Tellam, J.H. Understanding and quantifying focused, indirect groundwater recharge from ephemeral streams using water table fluctuations. Water Resour. Res. 2016, 52, 827–840. [Google Scholar] [CrossRef]
  108. Dawson, J.W.; Istok, J.D. Aquifer Testing—Design and Analysis of Pumping and Slug Test; Lewis Publishers Inc.: Chelsea, MI, USA, 1991. [Google Scholar]
  109. Selvarani, A.G.; Maheswaran, G.; Elangovan, K. Identification of Artificial Recharge Sites for Noyyal River Basin Using GIS and Remote Sensing. J. Indian Soc. Remote Sens. 2017, 45, 67–77. [Google Scholar] [CrossRef]
Figure 1. Location map of Wadi Fatima; (a) watershed on a geologic map of Saudi Arabia; (b) watershed on a rainfall map; (c) W. Fatima in Makkah region, western Saudi Arabia.
Sustainability 15 15629 g001
Figure 2. Data and methods.
Sustainability 15 15629 g002
Figure 3. (a) Geologic map of the studied Wadi Fatima; (b) simplified geologic map. The main stream appear in blue line.
Sustainability 15 15629 g003
Figure 4. (a) Elevation; (b) slope; (c) curvature; (d) TRI.
Sustainability 15 15629 g004
Figure 5. (a) Streams; (b) Dd; (c) TWI; (d) distance to river.
Sustainability 15 15629 g005
Figure 6. (a) NDVI; (b) rainfall; (c) soil; (d) lineament density.
Sustainability 15 15629 g006
Figure 7. Rainfall accumulation during the rainstorm (photos taken by Majed Aloufi); (a) water accumulation in the downstream; (b) water accumulation behind a dam.
Sustainability 15 15629 g007
Figure 8. Groundwater prospective zones.
Sustainability 15 15629 g008
Figure 9. AUCs of predicted GWPZ model (AUC: 0.73).
Sustainability 15 15629 g009
Figure 10. Excellent groundwater prospective zone in pink color overlain with main roads, streams, and watershed.
Sustainability 15 15629 g010
Figure 11. (a) Sentinel-2 12, 8, and 3 of the studied basin that is overlain with a watershed. Blue polygons explained in subfigures (b,d,f,h); (b,d,f,h) Sentinel-2 image subset; (c,e,g,i) in SAR CCD.
Sustainability 15 15629 g011
Table 1. Elements influencing the occurrence of groundwater and infiltration.
GeologyRankNormalized Weight %Area %
Alluvium70.3899.65
Flood basalt50.27816.42
Jaddah–Fatima Group40.22225.68
Granites–Gabbros20.11148.25
Elevation
1441–229020.0679.00
1097–144040.13316.58
756.1–109670.23323.00
369.1–75680.26720.97
0–36990.30030.45
Slope
0–4.34780.32046.19
4.348–10.1470.28022.73
10.15–17.1850.20016.29
17.19–25.6730.12010.31
25.68–52.7820.0804.48
Curvature
−5 to −0.38820.18214.01
040.36469.48
0.001 to 5.2150.45516.51
TRI
0.111–0.37960.35317.71
0.379–0.48350.29433.73
0.483–0.59040.23533.14
0.590–0.88820.11815.42
Dd
0.091–0.59420.09511.38
0.594–0.80840.19030.19
0.808–1.00670.33340
1.007–1.45680.38118.43
TWI
4.25–7.0220.1036.20
7.02–8.7240.2034.16
8.72–10.8560.3021.34
10.86–17.8380.408.29
Distance to River
0–281.680.5047.14
281.7–60960.3834.80
609.1–167020.1318.06
Rainfall
0.192–0.267710.07119.93
0.2678–0.365230.21415.18
0.3653–0.452740.28643.34
0.4528–0.620960.42921.55
NDVI
400–82020.11123
821–140030.16734.04
1400–180050.27819.43
1800–931580.44423.53
Soil
Loam 320.13381.26
Loam 230.20013.22
Loam 140.2673.16
Sandy loam60.4002.36
Lineaments
0–7.9520.07422.10
7.95–18.540.14826.04
18.76–29.8360.22224.30
29.84–42.3370.25920.09
42.34–72.4580.2967.47
Disclaimer/Publisher’s Note: The statements, opinions and data contained in all publications are solely those of the individual author(s) and contributor(s) and not of MDPI and/or the editor(s). MDPI and/or the editor(s) disclaim responsibility for any injury to people or property resulting from any ideas, methods, instructions or products referred to in the content.

