Article

The Dilemma of the European Integration Principle—Ensuring Energy Independence of the European Union

by
Adriana Veronica Litră
,
Eliza Nichifor
,
Ioana Bianca Chiţu
,
Alexandra Zamfirache
* and
Gabriel Brătucu
Faculty of Economic Sciences and Business Administration, Transilvania University of Brașov, 500068 Brașov, Romania
*
Author to whom correspondence should be addressed.
Sustainability 2023, 15(21), 15560; https://doi.org/10.3390/su152115560
Submission received: 6 September 2023 / Revised: 27 October 2023 / Accepted: 31 October 2023 / Published: 2 November 2023
(This article belongs to the Section Energy Sustainability)

Abstract

:
The European Union’s energy policy confronts the intricate challenge of achieving energy independence through integration and transition, necessitating a careful calibration of its implementation scale. Recognizing that the heightened energy dependence represents a threat to the economic convergence and cohesion of the member states, the authors adopted a comprehensive approach to scrutinizing the energy landscape. The study examines the orientation toward renewable energy sources, encompassing their utilization in both transportation and household electricity supply. Leveraging a combination of statistical and econometric methodologies, the researchers analyzed the EU’s energy composition, evaluating its far-reaching impact on both micro- and macroeconomic dimensions. Beginning with the central endogenous variable of the study, dependence on imports, the research extends to the assessment of gross available energy. Through rigorous examination, the authors underscored the pivotal role of renewable fuels in final energy consumption and demonstrated the influence of green energy sources on household consumption. This investigation, complemented by the section of the ARIMA model for electricity price modeling, not only elucidated the dilemma but also presented renewable energy sources as a viable solution to curtail the European Union’s dependence on energy imports, even in their current underutilized state.

1. Introduction

The change in the approach to energy sources as type and volume, as a result of the awareness of the climate emergency over the last decades, overlapped with the decline of economic activity starting in 2020. The current situation was determined by the restrictions imposed by the COVID-19 pandemic and the war in Ukraine, which interrupted the distribution in Europe of natural gas from Russia. All these events, cumulatively, determined the intensification of companies’ focus on the need to ensure continuity in the energy supply, concerns to guarantee accessibility, efficient management of limited resources, prioritization of distribution in relation to consumption needs, and accelerating the transition to green energy.
The year 2022 is defined as a “convergence year of crises”, which determined in an imperative way the solution of the trilemma: guarantee/equity/sustainability. The World Energy Council is a network of organizations from governments, public and private corporations, academia, NGOs, and other energy stakeholders, covering more than 80 countries, founded in 1923. The organization formulated the World Energy Trilemma Index as a combination of three essential targets: energy security—defined as a nation’s ability to meet energy demand, to adapt, and to recover from shocks with minimal disruption to the supply system; affordability—assessed as a country’s ability to provide universal access to energy at fair prices and in abundance; sustainability—reflects the transition of a country’s energy system toward avoiding and mitigating potential environmental damage and climate change [1].
At the height of the energy debate, discussions focus on replacing sources and technologies with new ones, aiming to move to a different dimension of clean and abundant energy. A paradigm shift toward sustainable energy sources becomes necessary [2] in order to meet sustainable development goals [3]. Limiting carbon dioxide emissions and reducing fossil fuel reserves will be achieved by gradually replacing conventional energy sources with renewable energy technologies. The paradigm shift is becoming evident: the future of energy supply systems will be dominated by nonconventional energy sources [4], for instance, Smart Grid-enabling technologies and applications that “will provide, in long term, economic benefits for authorities” [5] or “cloud-based environments” such as energy clouds, which offer more flexibility and autonomy to users [6]. An efficient dissemination program is needed besides R&D on energy sources [7].
However, the transition to new sustainable energy sources encounters barriers that can hinder and delay this process. Energies deemed to be sustainable, including solar and wind technologies, possess a drawback due to their reliance on atmospheric conditions, which limits their capacity to fully address the shift toward renewable energies [8]. The intermittent nature of these sources introduces volatility and, to a certain extent, unpredictability when it comes to forecasting [9]. Although energy from any source is vital in modern society and although access to it has considerably improved in recent decades, there are still about 3 billion people who have access to electricity (an essential form of energy) in a very small proportion compared with developed countries and more than 750 million people have no access to electricity at all [10]. Additionally, green energy sources like wind and solar necessitate exponentially larger land areas for the same capacity generation when compared with fossil fuels [11]. This places substantial pressure on land use, impacting agriculture, biodiversity conservation, residential zoning, topographical considerations, visual aesthetics, and more [12]. Another challenge raised by the transition to green energy sources consists of the raw materials used and the recycling of waste in the fields associated with it. Manufacturers of wind turbines, photovoltaic panels, electric batteries, etc., rely on inputs from natural resources, rather than those from waste recycling. The management of waste from renewable resources is also not sufficiently developed [13].
The objective of this study was to scrutinize the energy landscape through an examination of member states’ dependence on energy imports within the European Union (EU). This investigation encompassed the utilization of renewable energy sources, considering their application in both transportation and household electricity supply. Employing a combination of statistical and econometric methodologies, we conducted a comprehensive analysis of the EU’s energy composition, evaluating its impact on micro- and macroeconomic dimensions. In other words, the contribution of this research lies in explaining the macro and micro implications of the EU energy market and the opportunities for development (solar energy in transport and household consumption).
Taking into account the nominated premises, the authors structured the paper in four parts: the analysis of the specialized literature, the description of the research methodology, followed by the review of the results obtained and the complementary discussions, and the last part includes the conclusions and future research directions.

2. Review of the Scientific Literature

Energy markets have “an oligopolistic structure based on global geographic conditions, which necessitates the import of energy products.” The European Union is vulnerable from the point of view of energy due to its dependence on imports (such as from the Russian Federation) [14].
The EU aims to “create a European energy market” less dependent on imports and supports a more efficient use of existing resources and finding ways to “obtain energy from renewable resources” [15]. Studies show that the transition to green energy would be a step forward toward sustainable development, with a beneficial impact on the economic, social, and environmental components, and could generate approximately 1.5 million new jobs by the year 2050 [16].
A specialized analysis shows that the EU’s response to the COVID-19 crisis has created a powerful financial and political leverage to accelerate the green transition. However, “the EU’s energy transition is falling short in fully integrating biodiversity” [17].
Currently, the EU states must deal with major changes due to the multiple problems they face generated by the COVID-19 pandemic [18,19], rising energy prices, the depletion of resources, the war in Eastern Europe, and the challenges of Industry 5.0, with specialists emphasizing the important role of the authorities in educating consumers and companies [20]. At the same time, it is considered that sustainable practices should be encouraged, and irresponsible behaviors penalized, continuously monitoring and finding appropriate criteria for performance evaluation [21].
The specialized literature shows that replacing imports with internal sources of renewable energy produces additional positive effects in terms of energy independence and security and, also, in sustainable development [22].
At the same time, energy organizations also face a series of drastic environmental problems, heavily affected by the COVID-19 pandemic. The results of a study show that the key factors that help the sustainable organizational performance of energy companies are “implementation of knowledge management practices, policy changes” and decentralization [23].
Both the pandemic and the war appeared as opportunities for the energy transition by changing the behavior of the population [24] in a short period of time and creating the need to diversify energy sources, but experts draw attention to the fact that the measures to support the energy industry and the search for new sources of supply with fossil fuels to improve energy security may in the long term lead to the loss of the opportunity to transition to sustainable energy systems [18] because renewable energy sources cannot now “become the backbone of the energy generation system” [25].
The energy transition is a necessity, and this must be based on the use of renewable energy sources in the energy production process. However, to implement appropriate strategies, a series of analyses is needed. At first glance, in the EU, we are talking about a great diversity of countries (for example, countries have different levels of economic development, different numbers of inhabitants with major differences between populations, various cultures and customs, and geographical locations) [26]. A general policy is likely to become very difficult to be applied by all EU countries.
The main objective of the European Green Deal is for the EU to become a modern and resource-competitive economy by “reducing net greenhouse gas emissions to zero, delinking economic growth from resource use and no person and no place to be left behind” [27]. The war on the EU’s eastern border and “the use of gas resources as a means of political pressure have caused an unprecedented energy crisis in the EU”, which has forced new measures to reduce energy consumption [27]. Because of these aspects, the European Commission designed the REPower EU plan that aims to build a new infrastructure and a new independent energy system by 2030 by “saving energy, producing clean energy and diversifying energy sources” [28]. The implementation of this plan requires a combination of interconnected factors, namely technological development, political support, and population behavior [29].
Experts have concluded that the EU might not be able to secure sufficient gas reserves as proposed in REPower EU, but high gas prices will lead to accelerated decarbonization of the EU [30], although studies show that there is still potential for improvement in measures to boost the popularization of investments in renewable energy infrastructure [31]. Specialists believe that, at present, the main objectives at the EU level are the reduction of energy vulnerability and decarbonization, probably to the detriment of the establishment of an integrated energy market, and deep involvement of the European institutions because the problems require coordination and mobilization of all resources so that the EU can turn this crisis into an opportunity if it manages it correctly [32].
The idea that multiple concerns about the energy transition can be solved simultaneously is not viable, and a “smooth and painless transition to a zero-carbon European economy seems unlikely” [33]. Efforts toward energy transition aim at preventing energy poverty among the citizens of the EU and inside the economy, but there is still a risk of energy shortages in the case of an inadequate restraint on the energy market, with negative consequences for societies, economies, and the environment [34].
The measures proposed by the EU energy policy are effective; however, they are not sufficient for a real transition toward renewable resources [35].
The development of the energy transition requires actions not only on production but also on energy consumption habits [36]. Along with the green investments, economic openness and the efficiency of public governance proved to have a positive impact on the green economic growth of countries, which reflects the economic growth along with the reduction of pollution and a carbon-neutral economy [37]. The green transition to an environmentally friendly economy also includes implementing policies and practices that reduce greenhouse gas emissions, promote energy efficiency, increase the use of renewable energy sources, and reduce waste and pollution [38].
The EU’s energy policy based on integration and transition also requires establishing an appropriate scale for its implementation [39]—all the more as there are differences in attitude between EU member countries due to problems related to economic development (some regional electricity system infrastructures appear to be critical in achieving EU targets with low costs) [40], energy security [41], or simply in the access to some forms of renewable energy sources (countries in Southern Europe, such as Spain, Italy, and Greece, have a significant advantage having abundant sunlight most of the year, making solar photovoltaic installations productive and efficient compared with the Central Western European countries where the capacity of wind and solar PV productivity is lower; on the other hand, the more developed countries are more likely to invest in renewable energy infrastructure [42]). The need to limit gas consumption after the beginning of the war in Ukraine forced countries to rethink their transition paths; however, this did not always happen by investing in various new energy sources but by returning to the previous ones, which proved to be more polluting [43].

3. Research Methodology

This research adopts a cascading methodology, employing a range of statistical and econometric tools to address the dilemma surrounding the European Union’s integration principle and the imperative for the member states to achieve energy dependence. The heightened significance of energy dependence, particularly in the context of recent geopolitical disruptions, has prompted the European Commission’s proactive data collection on energy mix and import reliance. The database underpinning the study originates from the European Commission’s 2022 report on this critical subject [44]. Beginning with the central variable of import dependence, data collection extends to encompass gross available energy, elucidated through the lens of the energy mix.
Renewable energy sources in final energy consumption garnered particular attention, along with a close examination of electricity pricing across Europe. The pricing dynamics were explicated in relation to electricity production, energy flow, heating days, and the utilization of renewable energy. The selection of variables was steered by the formidable challenges the EU faces in the energy domain, including import dependence and the escalating trend of energy price volatility [45].
The database structure used in this study is organized to facilitate the analysis of energy-related parameters within the European Union. It encompasses several key tables, each containing specific attributes vital to the research objectives. These attributes include information on energy sources, consumption patterns, economic indicators, and other relevant variables. Its architecture allows for the systematic retrieval and manipulation of data to conduct comprehensive analyses. The central concern focuses on import dependence, serving as the primary endogenous variable of the study. This table includes entries related to net imports, gross available energy, and the derived indicator of energy dependence. Additionally, the dataset extends to incorporate detailed information on the energy mix, encompassing various fuel types, such as gas, oil, coal, nuclear, and renewable sources. These components collectively contribute to the overall energy landscape within the EU.
Renewable energy sources, a critical aspect of the study, receive special attention. The database includes attributes pertaining to their utilization in both transportation and household electricity consumption. Furthermore, emphasis is placed on understanding the pricing dynamics of electricity in the European context. This involves variables related to electricity production, energy flow, days requiring heating, and the use of renewable energy sources in the energy production process.
Thus, in the context in which the principle of an integrated EU energy market is wavering in the face of an uncertain future, the sustainability of the European energy system is called into question. In this context, a scientific concern arises, which the authors of the study tried to answer: is it possible to reduce the dependence on energy imports by capitalizing on renewable energy sources? Starting from this research topic, some micro- and macroeconomic implications that the EU energy policy entails have been addressed in a carefully explained manner in the following subsections, aiming to increase the awareness of final consumers and companies on the previously mentioned satellite dilemma and on the EU’s position toward the policy of promoting the sustainable future of Europeans.

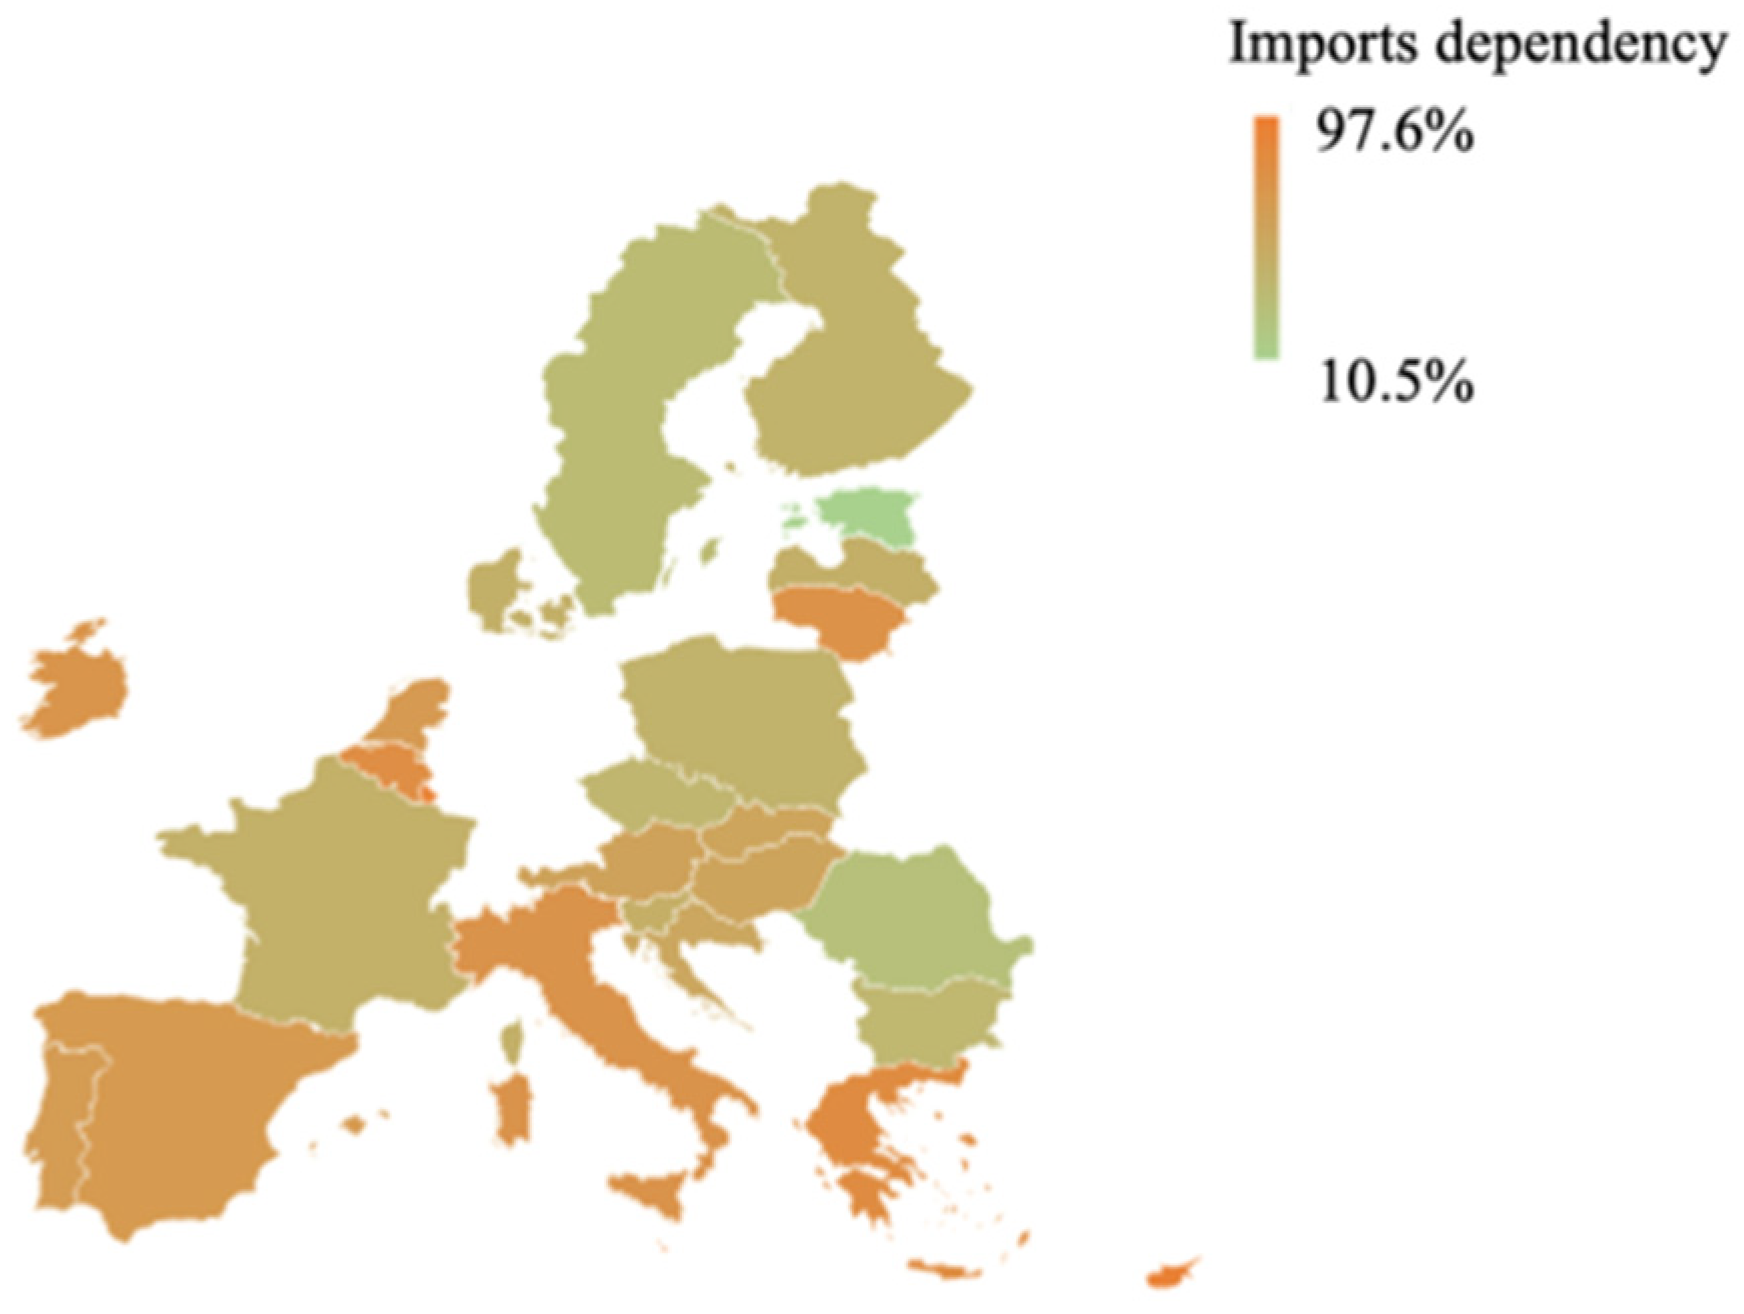
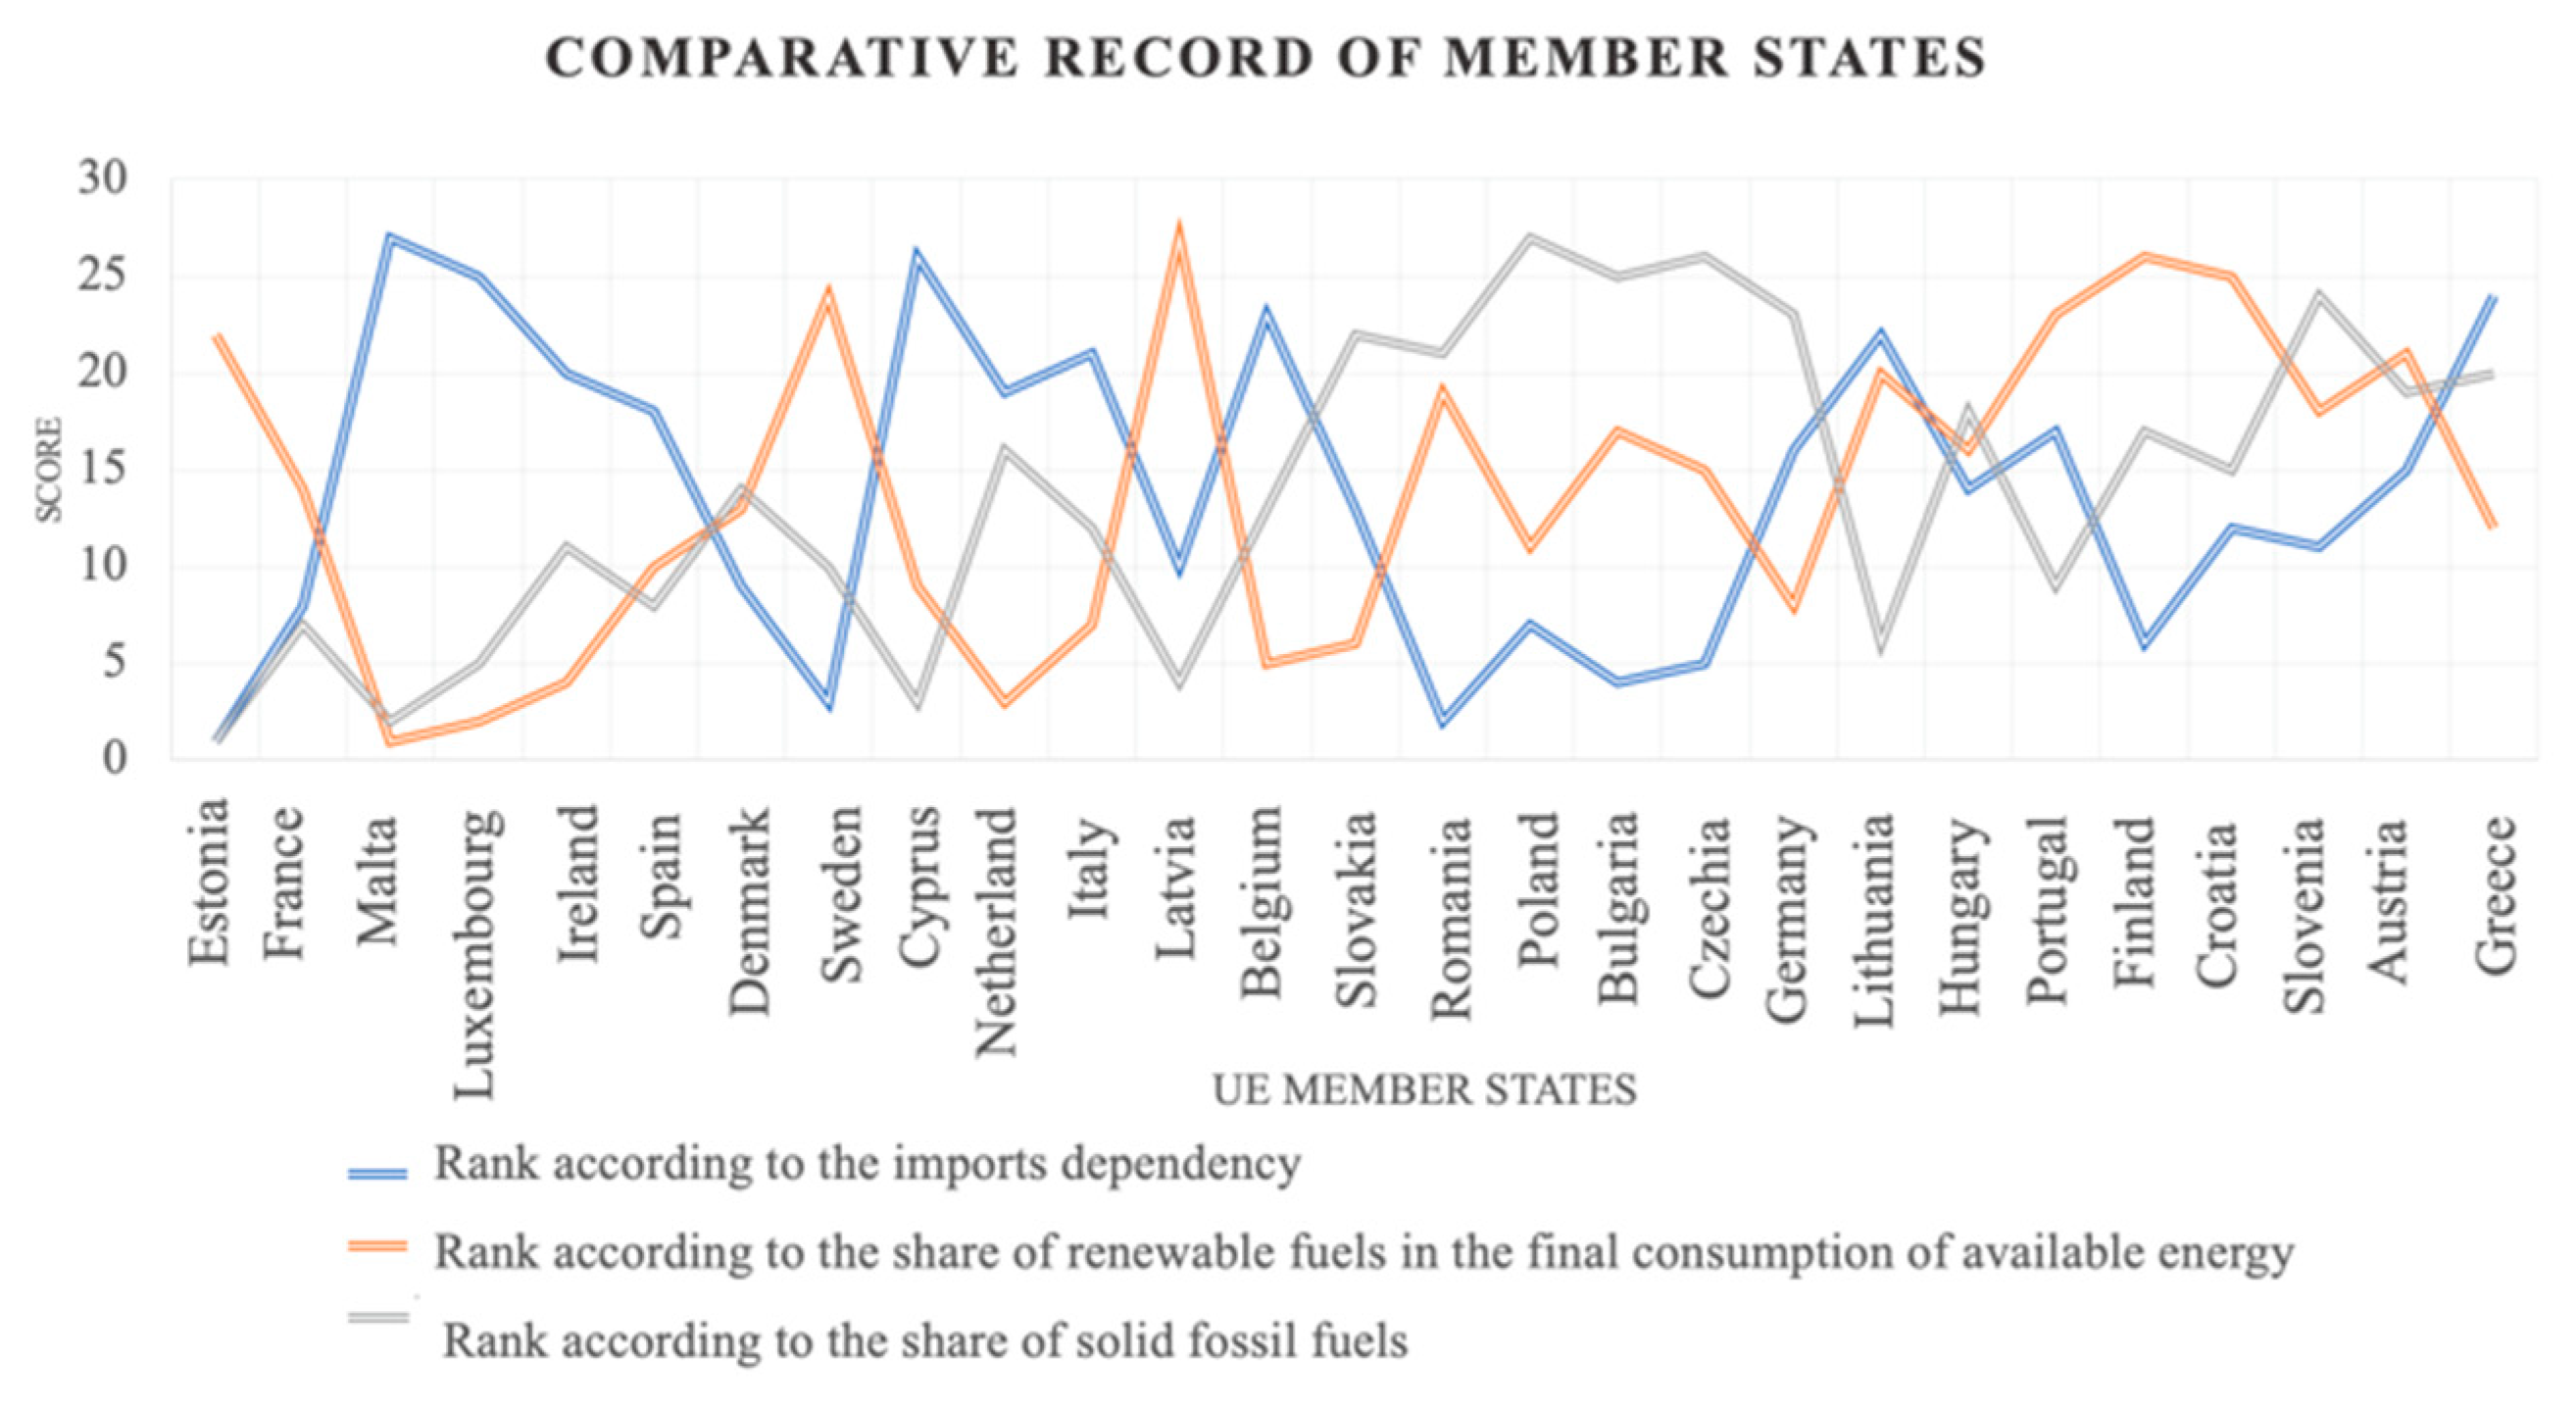
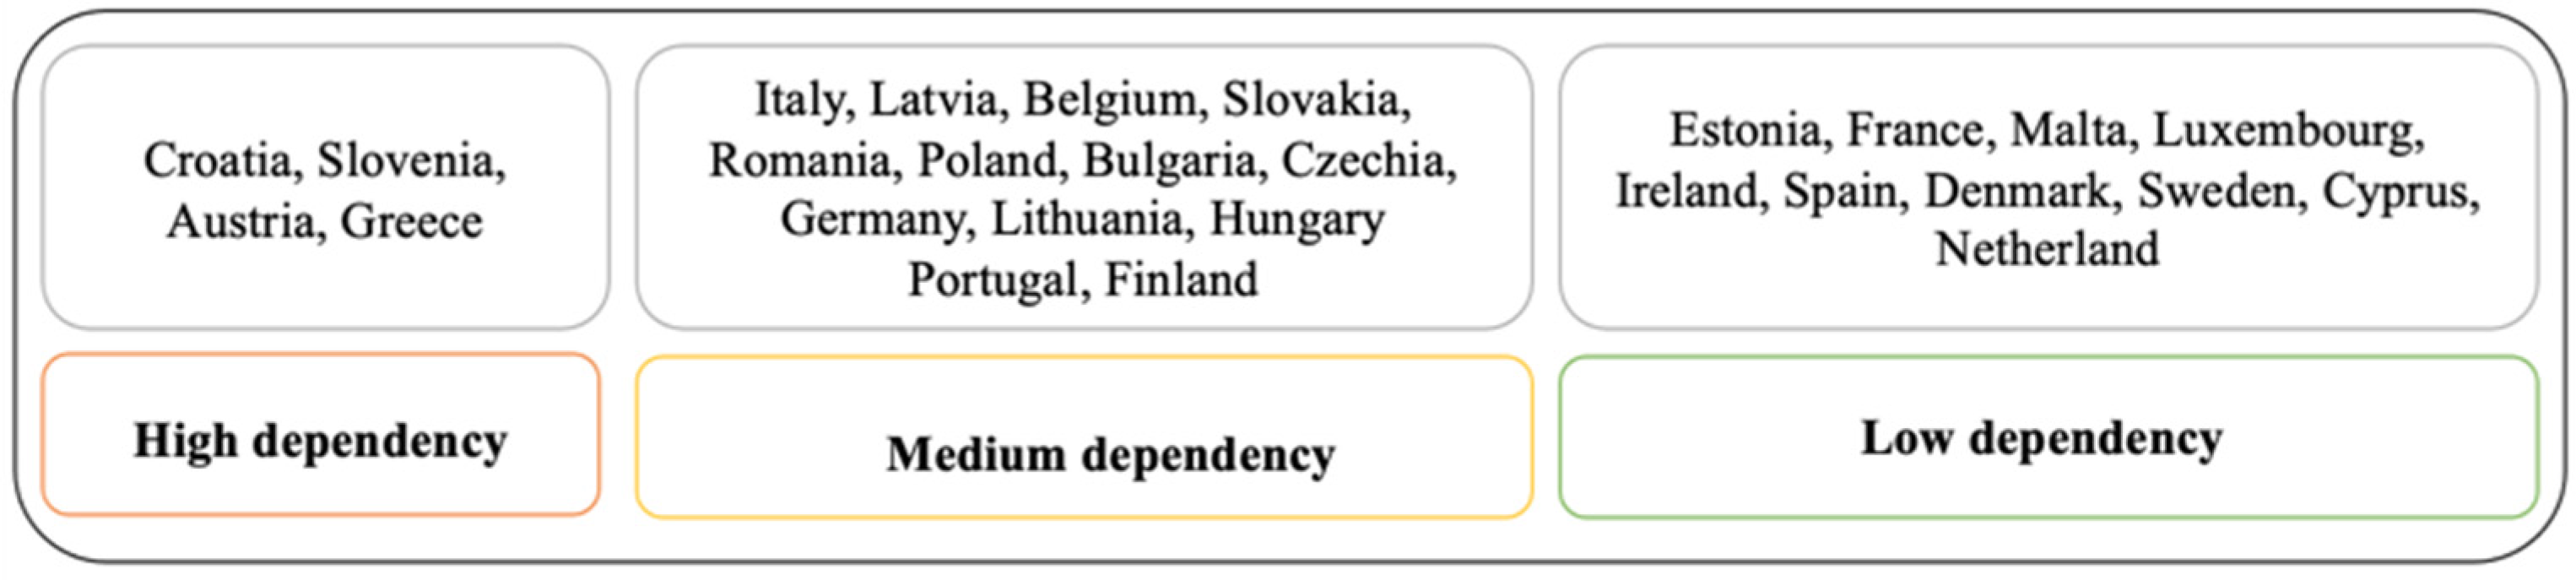
3.1. EU Dependence on Energy Imports

The indicator is described as the share of net imports in gross available energy, representing the extent to which the EU depends on imports from abroad. The negative share that some countries show for certain components of the energy mix indicates the status of an exporting country, such as the example of Norway for gas and oil. Showing a percentage above 100% shows fuel in stock, like Belgium’s oil and coal situation for instance. In the case of biofuels, the quantity is considered domestic production, regardless of the biomass feedstock used for production, imports, and exports—only biofuels in the form of real fuel are being considered [46]. For the analysis of this variable, the rank method was used, found in energy studies [47,48], the situation of the 27 member states being approached from the point of view of total imports as part of the first mathematical expression. Equation (1) plays a crucial role in assessing the extent to which the European Union relies on energy imports. It computes the energy dependence on imports by considering the total energy imports (Imports), subtracting the energy exports (Exports), and then dividing the result by the gross available energy (Gross available energy). This calculation yields a percentage that indicates the proportion of energy needs met through imports. This equation serves as a foundational metric for understanding the EU’s reliance on external energy sources, a pivotal factor in shaping energy policies and strategies.
E n e r g y   d e p e n d e n c e   o n   i m p o r t s = I m p o r t s E x p o r t s G r o s s   a v a i l a b l e   e n e r g y
The potential of balanced economic growth and upward economic convergence of the EU member countries was studied from the point of view of the dependence on energy imports, analyzed in the first stage from the perspective of possible inequalities addressed with the help of the Gini coefficient. Equation (2) introduces it as a fundamental tool for evaluating economic disparities in the context of energy dependence. The Gini coefficient measures the inequality among values in a given dataset, which, in this case, pertains to energy dependence. It considers observed values, calculates the absolute differences between them, and normalizes the result based on the mean value. The Gini coefficient thus provides valuable insights into the distribution of energy dependence across EU member states, shedding light on potential disparities that may warrant further examination.
G = i = 1 n j = 1 n x i x j 2 n 2 x ¯
in which
  • x —observed value,
  • n —number of observations,
  • x ¯ —mean value.
The collection of statistical data was carried out at the territorial level, based on the energy mix (the share of fuels in the gross available energy). The elements of the energy mix are represented by gas, oil, coal, nuclear, or renewable energy sources, others representing manufactured gas, peat, shale, and tar sands. The gross available energy is defined as the total energy supplied for all activities carried out in the territory. From the total energy mix, two explanatory variables were chosen for the dependence on imports, namely, renewable sources and biofuels and solid fossil fuels [49]. Based on the data, the method allowed for the calculation of final rank, median, and central tendency.
The energy dependence of EU member states was modeled with the help of predictors: renewable energy sources, as part of the total gross available energy, and fossil fuels, as part of a country’s energy mix, with the aim of identifying significant exogenous variables that could explain the dependent variable. In this sense, a linear regression was carried out, estimated by the ordinary least squares (OLS) method. The reason for deploying OLS was motivated by its suitability for the dataset, which exhibits linear relationships between the variables of interest. Additionally, OLS is a widely accepted and well-understood method for estimating linear models, making it an appropriate choice for research objectives. By utilizing OLS, the authors aim to provide robust and interpretable insights into the relationships between the independent and dependent variables. Thus, the linear model and the typical stochastic error term take the form:
Y i = β 0 + β 2 R E S i + β 3 F F i + ε i
in which
  • Y i —dependence on energy imports of country i ;
  • R E S i renewable energy and biofuel sources of country i;
  • F F i —solid fossil fuels from the gross available energy of country i .
The estimation was performed in EViews, the coefficients β ^ k , standard deviation, t test, F test, R 2 and R ¯ 2 , the goodness of fit indicators and Durbin–Watson for multivariate regression model were calculated:
Coefficients β :
β ^ 1 = ( y x 1 )   ( x 2 2 ) y x 2 ( x 1 x 2 ) x 1 2   x 2 2 ( x 1 x 2 ) 2
β ^ 2 = ( y x 2 )   ( x 1 2 ) y x 1 ( x 1 x 2 ) x 1 2   x 2 2 ( x 1 x 2 ) 2
β ^ 0 = Y ¯ β ^ 1 X ¯ 1 β ^ 2 X ¯ 2
Standard error:
S E E = t = 1 n ( Y t b ^ 0 b ^ 1 X 1 t b ^ 2 X 2 t b ^ k X k t ) 2 n ( k + 1 ) = t = 1 n ε ^ t 2 n ( k + 1 )
t test:
t = β k β k 0 s β k
F test
F = R S S k S S E n ( k + 1 ) = M S R M S E
The coefficient of determination:
R 2 = T S S S E E T S S
The coefficient of determination adjusted for degrees of freedom:
R ¯ 2 = 1 n 1 n k · 1 R 2
After the identification of the significant variable, the nonparametric method of measuring the relationship through the rank correlation method was applied. The calculated value of the Spearman coefficient was determined using the formula:
θ = 1 6 d 2 n ( n 2 1 )
in which
  • d 2 —the difference between ranks u i   a n d   w i ;
  • n —number of series terms.
Durbin–Watson value:
d = t = 2 T ( e t e t 1 ) 2 t = 1 T e t 2
in which
  • T —number of observations;
  • e t —residue.
The results of the estimation determined that the study should be continued by researching and identifying a new perspective to analyze the dependence on energy imports. After several attempts, the variable renewable energy used in transport at the member state level was initially analyzed descriptively, with a focus on solar energy. The information placed the researched variables in a relevant context for continuing the study, and a forecast was made using the average spore method to graphically represent the situation of energy from renewable sources until the year 2030.

3.2. Electricity Price for Household Consumers

To highlight the microeconomic impact of the EU’s energy and promotion policies on the sustainable behavior of Europeans, three explanatory variables were identified for the price of electricity for household consumers, namely, gross electricity production, EP (expressed in thousands of tons of oil equivalent), the flow of energy use at the country level, EF (thousand tons of oil equivalent), the number of days for which the use of energy for heating is required, Days, and the use of solar energy sources from the total consumption, SEU (terajoules). The collection of information was carried out in the form of evolution over time, for the period 2011–2020; the data were cleaned, organized, and imported into the EViews software 12 program for processing and use.
The first step involved using the mathematical operations of logarithm math and applying the first difference in EViews to the variables of the series ( x t x t 1 ) . Estimation of the logarithmic equation led to the generation of goodness-of-fit indicators, the Fischer test, and the Durbin–Watson value to determine the error autocorrelation. At the same time, for the autocorrelation of the errors, the correlogram was used, inspecting the size of the k-order correlation coefficient, calculated below. Equation (14) is employed to investigate autocorrelation within the dataset. Specifically, it computes the k-order correlation coefficient (ρ_k), a statistical measure that assesses the relationship between variables at different time points. In this context, it helps discern any patterns or dependencies in the energy-related data over time. The equation involves calculating the product of differences between values at specific time intervals and then normalizing the result based on the number of observations (n) and the mean of the series. By employing this equation, researchers can gain valuable insights into the temporal dynamics of energy-related variables, which is crucial for making informed policy recommendations.
ρ k = t = k + 1 n ( X t X ¯   ·   X t k X ¯ ) n k t = 1 n ( X t X ¯ ) 2 n
in which
  • ρ k —k-order correlation coefficient;
  • n —number of observations;
  • X ¯ —mean of the series.
The model is analyzed using a set of tests, explained, and interpreted in the next section for a more relevant review of the arguments and interpretation of the results.

4. Results and Discussions

Given the perspective of convergence and cohesion at the EU level, the analysis began with the calculation of the Gini coefficient to identify any possible inequalities between the member states. Its value G = 0.50941 shows that the EU member countries do not present large differences from the point of view of dependence on energy imports. However, the statistics relating to the data from 2020 show major differences between the member states through deviations from the mean (58%) which calls into question the potential of economic convergence in Europe (Figure 1).
As previously stated, the EU is a net importer of energy. Among European countries, the highest share of energy dependence is recorded by Malta with 97.5%, followed by Cyprus (93%), Luxembourg (92.4%), and Greece (81.4%). The central tendency is very clearly highlighted for Austria (58.3%), which is closest to the EU average (57.5%) [50]. On the other hand, the lowest percentages are recorded for Romania (28.2%) and Estonia (10.5%).

4.1. Modeling the Dependence on Energy Imports of the EU Member States

Taking into account the variables—dependence on energy imports, the use of renewable fuels in the final consumption of available energy, and fossil fuels in the energy mix of the member states—the rank method was applied, getting the scores for the three variables (Figure 2). The results allowed for the presentation of a comparative situation, a graphical illustration that indicates major differences between the EU member states.
On this basis, the EU member states could be classified into three categories, depending on the final score obtained considering the three variables (Figure 3).
Estonia has the highest score, justified by the lowest level of dependence on energy imports (10.5%). Estonia’s situation is equally motivated by the negative share of −38.5%, which shows that this EU member state is a net exporter of renewable energy sources and biofuels, in this respect surpassed only by Latvia, which presents a share of 41% of exports of energy sources of this type. It is observed that, by introducing the ranks, Romania is included in the category of countries with medium dependence versus the first explanation (Figure 2) regarding the geographical distribution of energy dependence in Europe (where Romania placed penultimate). It is concluded that the introduction of ranks had an important effect on the classification of European countries from the perspective of energy dependence, by highlighting the modeling of the dependence on energy import.
Through the regression equation to explain the energy dependence of the member states, the exogenous variable of renewable fuels from the final energy consumption was identified as significant ( R 2 = 0.59 , F s t a t i s t i c = 0.00029 < 0.005 , p - v a l u e = 0.0002, and D W = 2.02 ), which allowed to apply the nonparametric method of measuring the connection through the method of ranks correlation of the two variables. The calculated indicator, the Spearman coefficient, θ = 0.63 , shows an inverse correlation, considered strong between the two variables. Considering the importance of renewable fuels in the final consumption of available energy to reduce the dependence on energy imports, the renewable energy used in transport at the level of the EU states was descriptively analyzed. During the ten years, it can be observed that the share of energy from renewable sources in transport has increased slightly. The reference to renewable energy such as solar energy indicates a sustained growth over the last ten years in the EU area (Figure 4).
However, the issue of uniformity at the level of all countries raises questions because only a few countries use solar energy in the field of transport, for example. With an average of 97.2 days per year identified as necessary for heating using energy, the meteorological potential that can be exploited to the advantage of decreasing the dependence of energy on imports is mentioned. Greece and Spain used this type of renewable energy for transport purposes long before 2011; Belgium, Romania, and Italy started 11–15 years ago, and Belgium since 2012.
Solar energy produced to be used in transport is an example mentioned because it is part of the categories of renewable energy sources with micro- and macroeconomic impact on the EU member states, but for the deep approach to the energy used from renewable sources, a complex analysis was carried out by the average spore method. It revealed results that show a sustained increase until 2030 (Figure 5), expecting it to be used up to 18.61%, almost double, by reporting the share to the year 2020 (10.22%).

4.2. Modeling the Price of Electricity for Household Consumers at the EU Member State Level

Descriptive analysis at the time series level for electricity production, E P , shows an average of E P ¯ = 250,861.9 . The average price per KW-hour is EUR 0.125 at the European level with a standard deviation of 0.007. Using the database with information on the endogenous variable and the exogenous variables, the regression was estimated using the EViews 12 software program, and the following results were obtained:
Δ l n Y t = 4.709274 + 1.894556 l n E P t 1.619459 l n E F t 1 + 0.001509 l n D a y s t 2 + 0.120750 l n S E U t 3
The coefficient of determination, R 2 , and the adjusted coefficient of determination, R ¯ 2 , show that the model fits well; R 2 = 0.84 , its value determining that 84% of the variability of Y around its mean is explained by the exogenous variables. Noting the value of F statistic = 0.001 compared with the 5% significance level, it can be stated that the model is globally significant, so at least one of the four independent variables is statistically significant. In order to interpret the significance of the slope coefficients, the results regarding their sizes were centralized (Table 1).
According to the presented results, the EP, EF, and SEU variables are significant, and it is necessary to remove the Days variable from the model. The distribution of the time series is abnormal from the point of view of skewness and kurtosis, a result confirmed not only by the graphic illustration (Figure 6) but also by the Jarque–Bera test J P = 2.08 ;   p > 0.05 .
The Dickey–Fuller test run in the EViews 12 software program revealed the quality of the series to be nonstationary, although it was initially logarithmically transformed ( l n Y ) , the distribution being highlighted in Figure 7a,b. Even if the first-order differentiation was applied to the series d Y = d ( l o g Y ) , the DF test ( τ = 0.0512 > 0.05 ) indicated the rejection of the null hypothesis as there was no unit root. The analysis revealed constant year-over-year variations for 1% and 5% D F , and the time series was found to be stationary only at the 10% confidence level ( τ D F = 3.1309 < τ c r t = 2.7137 ) .
The value of DW = 1.0037 shows a serial correlation of the errors as it is far from the value 2. To present the result in a graphic form, the actual value of Y, the fitted value of Y, and the residual are highlighted (Figure 8).
Inspecting the errors by analyzing the correlogram, the autocorrelation of the errors was confirmed. Also, the phenomenon exists even if the sum of the squares of the errors is analyzed, which indicates the possibility of the existence of ARCH terms. Therefore, the authors tested heteroscedasticity using the hypotheses H 0 (constant variance) and H 1 (variance is not constant). The ARCH test generated the value p r o b . = 0.46 > 0.05 , a result which leads to the acceptance of the null hypothesis, there being a constant variance. Verification of the result was performed by consulting the histogram statistics information and identifying the mean as zero (0.0058).
Given this result, the analysis of model stability was pursued to determine whether changing the sample would change the value of the coefficients. Thus, the CUSUM test for errors and the sum of the squares of errors were applied, resulting in the existence of the stability of the coefficients for a significance level of 5% (Figure 9).
By conducting the Jarque-Bera tests and serial correlation LM for the analysis of the normal distribution of errors, the positive correlation of the errors was identified, at least at lag 1. By applying the first difference, the correlogram shows a rapid decrease in the autocorrelation coefficient values, ρ ^ 1 = 0.118 ,   ρ ^ 2 = 0.376 ,   ρ ^ 3 = 0.103 ,   ρ ^ 4 = 0.098 ,   ρ ^ 5 = 0.070 , which denotes the possibility of the existence of a first-order AR component ρ = 1 . Thus, the possible models are identified for explaining the price of energy for domestic consumers, the results being centralized (Table 2).
Table 2 presents the competing models; the choice is based on the classic criteria for fitting the econometric models ( R 2 ,   R ¯ 2 ,   F s t a t i s t i c ) and the Aikake and Schwartz criteria. Therefore, by integrating the three components, the ARIMA model provided the flexibility needed to model time series patterns. This approach was particularly apt for the research outcomes. Additionally, the interpretability of the ARIMA model was invaluable in conveying the findings effectively, ensuring clarity for the analysis. By deploying it, the authors captured autocorrelation patterns within the data, and its ability to handle nonstationarity through differencing proved crucial in achieving accurate predictions. The incorporation of moving average effects allowed to account for short-term fluctuations, leading to more robust forecasts. These results demonstrate the effectiveness of the ARIMA model in addressing the unique characteristics of time series data. However, it is important to acknowledge that the choice of ARIMA was contingent on the specific nature of the dataset, and researchers should consider alternative models in cases where complex nonlinear relationships or multiple interacting variables are present [51].
According to the data, ARIMA is a valid model that no longer presents autocorrelation and indicates homoscedasticity.
Thus, the forecast of the price of electricity for domestic consumers can be predicted for the researched context. Furthermore, it is important to note that the assumptions of OLS, such as linearity, independence of errors, and homoscedasticity, were carefully assessed and found to be reasonably met in the dataset. This further justifies the choice of OLS as the preferred method for regression analysis in this context [52,53].
The results after the forecast of the price of electricity for domestic consumers show that the adjustment is relevant for research because the value of the Theil coefficient (0.01) is placed in the range [0–1], being very close to 0, and the BIAS proportion indicator has a value below 1, which indicates a distance not very far from the average of the predicted and actual values, which gives it a representative character. Moreover, estimated values fall within the limits of standard deviation (Figure 10).
The result presents two specific components: modeling the dependence on the energy imports of the EU member states and modeling the price of electricity for domestic consumers at the level of the EU member states. Regarding the first component, by applying the rank method, it was possible to describe a comparative situation that indicates major differences between EU member states, presenting the example of Estonia and Latvia that are exporters of renewable energy sources and biofuels. Then, in order to present the connection between the energy dependence of the member states and renewable fuels from the final energy consumption, the method of rank correlation was used, concluding an inverse correlation, which is considered strong between the two variables. It was followed by the application of the average spore method where the results obtained within the article present an increase maintained by 2030 in the solar energy produced to be used in the transportation sector.
Within the second component, an econometric model regarding the price of electricity for domestic consumers at the level of the EU member states is generated. Thus, by applying all the methods presented, modeling the price of electricity for domestic consumers at the level of the EU member states has achieved its purpose because the validity of the model has been demonstrated. A series of analyses, methods, and adjustments of the model have been used, finally reaching the conclusion that the ARIMA model validated for explaining the price of energy for domestic consumers no longer presents autocorrelation and indicates homoscedasticity; based on it, the data forecast was made.

5. Conclusions

The manuscript provides a comprehensive analysis of the complexities surrounding the energy transition within the European Union. It underscores the multifaceted nature of this transition, emphasizing that achieving a seamless shift to a zero-carbon economy is likely unattainable. The authors aptly assert that energy transition efforts should focus not only on production but also on altering energy consumption habits, recognizing the risk of energy shortages if the energy market is not adequately regulated. This highlights the intricate balance required for a successful transition [34]. While the EU’s energy policy measures are acknowledged as effective, the authors astutely point out that they may not be entirely sufficient for a comprehensive shift toward renewable resources. They advocate for a holistic approach, emphasizing the need for changes in both production and consumption patterns. Furthermore, the study highlights the positive impact of green investments, economic openness, and efficient public governance on the green economic growth of nations. This reflects not only economic expansion but also a reduction in pollution and a move toward a carbon-neutral economy [36,37,38]. A critical aspect raised is the necessity of establishing an appropriate scale for implementing the EU’s energy policy based on integration and transition. The authors aptly acknowledge that differing attitudes among EU member countries, stemming from economic development discrepancies, may pose challenges. This is particularly evident in regional electricity infrastructure, which plays a critical role in achieving EU targets cost-effectively. Additionally, concerns regarding energy security and access to renewable energy sources underscore the nuanced approach required for a unified energy policy [39,40,41,42]. The study’s examination of energy dependence among EU member states provides valuable insights. It identifies Croatia, Slovenia, Austria, and Greece as having the highest levels of energy dependence, while Estonia, France, Malta, Luxembourg, Ireland, Spain, Denmark, Sweden, Cyprus, and the Netherlands exhibit the lowest levels. This geographic distribution underscores the need for tailored strategies to address specific challenges faced by individual member states [34].
The paper enriches the knowledge and explains the implications at the macro- but also microeconomic level of the energy market in the EU member countries. The model presented and proposed can be considered innovative due to the two mentioned components. It can also be considered an innovative approach to the presentation of solar energy used in transport and household consumption and as development opportunities in the future. Moreover, the use of solar energy in the field of transport is a determining factor for the dependence of the EU member states, in the opposite direction. The approach of the subject of energy dependence at the European level in relation to the principle of European integration, implies the location of the highly actual problem, the green energy, in a less favorable context at the 2030 horizon promoted by the EU. The real problems regarding the macroeconomic implications generated by the different dependence of the EU countries on the import of energy can affect the vision of “unity in diversity”, or even worse, cause disorders within the EU. Highlighting the dilemma presented at the beginning of the article offers the opportunity to look at renewable energy sources as one of the solutions to reduce the dependence on the energy imports of the EU member states, even if they are currently used to a very small extent.
From a managerial point of view, although numerous initiatives and directives of the European Commission are heading toward promoting sustainable behavior, it can be seen that the real reason for the adoption of green policies is to stimulate final consumers and companies to contribute to reducing dependence on imported energy. In the same context, the academic and pre-pre-university environment must get involved in the process of ecological education of the students, provided they have the appropriate infrastructure, program, and environment.
The main limitation of the present study is the possibility of omitting an important variable in the model. Taking into account the controversies regarding the durability and efficiency in time of lithium-ion batteries and the discussions about the necessary infrastructure and the change in the mentalities of the final consumers and the managers of companies, the energy issues strongly affect the sustainable future of Europe.
Also, the accuracy of data can be a potential limitation, even including research that employs data analysis and econometric methods. In many cases, data may be subject to measurement errors, missing values, or other sources of imperfection. These discrepancies can introduce uncertainties and affect the reliability of the results. Additionally, the assumptions underlying the econometric models used may not always align perfectly with the real-world data. This can potentially lead to discrepancies between the model’s predictions and actual outcomes. Therefore, it is crucial to acknowledge that while we have taken steps to ensure data quality and rigor in our analysis, there may still be inherent limitations related to data accuracy. These limitations should be considered when interpreting the findings of the study. First, while efforts were made to ensure data accuracy and reliability, inherent limitations or errors within the dataset may affect the validity of the findings. Second, econometric models rely on assumptions about the underlying data and relationships, potentially introducing uncertainty. Additionally, controlling for all possible variables that influence the outcome of interest is challenging, and omitted variables may introduce bias. Moreover, the sample used in the analysis may not fully represent the broader population, potentially limiting the generalizability of the conclusions. Finally, there is a risk of overfitting if models become overly complex, potentially leading to less reliable predictions for new data. However, one of the advantages of conducting research based on the methodology described is the ability to apply rigorous econometric techniques to analyze the data. This approach allows for a systematic and quantitative examination of relationships, providing a robust foundation for drawing meaningful conclusions. By employing established methods, the authors can uncover underlying patterns, test hypotheses, and generate empirical evidence with a high degree of precision. This methodology also facilitates the replication of the study, allowing for validation and further exploration of the research findings. Additionally, the use of econometric methods enabled us to quantify the magnitude and significance of various factors, enhancing the depth and clarity of our insights. Overall, this approach ensures a structured and evidence-based approach to addressing the research objectives, contributing to a comprehensive and reliable body of knowledge in the field. In the case of this study, the utilization of econometrics presents a distinct advantage. This methodological approach empowered the authors to systematically analyze the intricate dynamics of European energy independence within the framework of European integration. By employing rigorous econometric models, we can quantitatively examine the various factors influencing this crucial principle, offering a comprehensive understanding of its complexities. This meticulous approach not only advances the understanding of the energy independence dilemma but also enriches the discourse on European integration policies and strategies. Ultimately, the paper endeavors to provide valuable insights that can inform policy decisions and shape the future trajectory of European energy independence.
Finally, it becomes a necessity for future research to aim to design and implement studies that can help determine the behavior of organizations, as well as of the inhabitants of the EU member countries regarding the new ecological paradigm generated by the European Green Deal. Research can be followed by experimental studies so that the companies and individuals considered vulnerable in the process of major behavioral change generated by the new ecological paradigm should be helped by the EU states, from a financial point of view and by ensuring the appropriate logistics. Future directions offer a wide research space, within which it becomes necessary to carry out a detailed analysis of the behaviors that the final consumers will have.

Author Contributions

Conceptualization, A.V.L., E.N., I.B.C., A.Z. and G.B.; methodology, E.N.; software, E.N.; validation, E.N., A.Z. and G.B.; formal analysis, E.N.; investigation, A.V.L., E.N., I.B.C. and A.Z.; resources, I.B.C.; data curation, E.N.; writing—original draft preparation, A.V.L., I.B.C. and A.Z.; writing—review and editing, E.N. and I.B.C.; visualization, E.N.; supervision, G.B.; project administration, G.B.; funding acquisition, G.B. All authors have read and agreed to the published version of the manuscript.

Funding

The APC was funded by Transilvania University of Brașov.

Institutional Review Board Statement

Not applicable.

Informed Consent Statement

Not applicable.

Data Availability Statement

Data available on request.

Conflicts of Interest

The authors declare no conflict of interest.

References

  1. World Energy Council; Wyman, O. World Energy Trilemma Index 2022; World Energy Council: London, UK, 2022. [Google Scholar]
  2. Pandey, G.; Poothia, T.; Kumar, A. Hydrate Based Carbon Capture and Sequestration (HBCCS): An Innovative Approach towards Decarbonization. Appl. Energy 2022, 326, 119900. [Google Scholar] [CrossRef]
  3. United Nation. Goals 7—Ensure Access to Affordable, Reliable, Sustainable and Modern Energy for All. Available online: https://sdgs.un.org/goals/goal7 (accessed on 19 December 2022).
  4. Riquelme-Dominguez, J.M.; Riquelme, J.; Martinez, S. New Trends in the Control of Grid-Connected Photovoltaic Systems for the Provision of Ancillary Services. Energies 2022, 15, 7934. [Google Scholar] [CrossRef]
  5. Dileep, G. A Survey on Smart Grid Technologies and Applications. Renew. Energy 2020, 146, 2589–2625. [Google Scholar] [CrossRef]
  6. Schaefer, J.L.; Siluk, J.C.M.; de Carvalho, P.S. Critical Success Factors for the Implementation and Management of Energy Cloud Environments. Int. J. Energy Res. 2022, 46, 13752–13768. [Google Scholar] [CrossRef]
  7. Heo, E.; Kim, J.; Boo, K.-J. Analysis of the Assessment Factors for Renewable Energy Dissemination Program Evaluation Using Fuzzy AHP. Renew. Sustain. Energy Rev. 2010, 14, 2214–2220. [Google Scholar] [CrossRef]
  8. Mould, K.; Silva, F.; Knott, S.F.; O’Regan, B. A Comparative Analysis of Biogas and Hydrogen, and the Impact of the Certificates and Blockchain New Paradigms. Int. J. Hydrog. Energy 2022, 47, 39303–39318. [Google Scholar] [CrossRef]
  9. Mohandes, B.; El Moursi, M.S.; Hatziargyriou, N.; El Khatib, S. A Review of Power System Flexibility With High Penetration of Renewables. IEEE Trans. Power Syst. 2019, 34, 3140–3155. [Google Scholar] [CrossRef]
  10. Davies, A.; Simmons, M. The Role of Hydrocarbons in the Energy Transition. Available online: https://explorer.aapg.org/story/articleid/63781/the-role-of-hydrocarbons-in-the-energy-transition (accessed on 19 December 2022).
  11. Merrill, D. The U.S. Will Need a Lot of Land for a Zero-Carbon Economy. Available online: https://www.bloomberg.com/graphics/2021-energy-land-use-economy/?leadSource=uverify%20wall (accessed on 19 December 2022).
  12. van Zalk, J.; Behrens, P. The Spatial Extent of Renewable and Non-Renewable Power Generation: A Review and Meta-Analysis of Power Densities and Their Application in the U.S. Energy Policy 2018, 123, 83–91. [Google Scholar] [CrossRef]
  13. Mulvaney, D.; Richards, R.M.; Bazilian, M.D.; Hensley, E.; Clough, G.; Sridhar, S. Progress towards a Circular Economy in Materials to Decarbonize Electricity and Mobility. Renew. Sustain. Energy Rev. 2021, 137, 110604. [Google Scholar] [CrossRef]
  14. Elüstü, S. Avrupa Birliği’nin Enerji Güvenliği: Enerji İthalatı Bağımlılığı ve Ekonomik Büyüme İlişkisi. Istanb. J. Econ. İstanbul İktisat Dergisi 2021, 71, 133–162. [Google Scholar] [CrossRef]
  15. Comisia Europeană. Energie—Politici. Available online: https://commission.europa.eu/topics/energy_ro (accessed on 19 December 2022).
  16. Potrč, S.; Čuček, L.; Martin, M.; Kravanja, Z. Sustainable Renewable Energy Supply Networks Optimization—The Gradual Transition to a Renewable Energy System within the European Union by 2050. Renew. Sustain. Energy Rev. 2021, 146, 111186. [Google Scholar] [CrossRef]
  17. Crnčec, D.; Penca, J.; Lovec, M. The COVID-19 Pandemic and the EU: From a Sustainable Energy Transition to a Green Transition? Energy Policy 2023, 175, 113453. [Google Scholar] [CrossRef]
  18. Zakeri, B.; Paulavets, K.; Barreto-Gomez, L.; Echeverri, L.G.; Pachauri, S.; Boza-Kiss, B.; Zimm, C.; Rogelj, J.; Creutzig, F.; Ürge-Vorsatz, D.; et al. Pandemic, War, and Global Energy Transitions. Energies 2022, 15, 6114. [Google Scholar] [CrossRef]
  19. Colasante, A.; D’Adamo, I.; Morone, P. What Drives the Solar Energy Transition? The Effect of Policies, Incentives and Behavior in a Cross-Country Comparison. Energy Res. Soc. Sci. 2022, 85, 102405. [Google Scholar] [CrossRef]
  20. Popescu, C.; Panait, M.; Palazzo, M.; Siano, A. Energy Transition in European Union—Challenges and Opportunities. In Energy Transition. Industrial Ecology; Khan, S.A.R., Panait, M., Puime Guillen, F., Raimi, L., Eds.; Springer: Singapore, 2022; pp. 289–312. [Google Scholar]
  21. D’Adamo, I.; Gastaldi, M.; Rosa, P. Assessing Environmental and Energetic Indexes in 27 European Countries. Int. J. Energy Econ. Policy 2021, 11, 417–423. [Google Scholar] [CrossRef]
  22. Carfora, A.; Pansini, R.V.; Scandurra, G. Energy Dependence, Renewable Energy Generation and Import Demand: Are EU Countries Resilient? Renew. Energy 2022, 195, 1262–1274. [Google Scholar] [CrossRef]
  23. Rafiq, M.; Naz, S.; Martins, J.M.; Mata, M.N.; Mata, P.N.; Maqbool, S. A Study on Emerging Management Practices of Renewable Energy Companies after the Outbreak of COVID-19: Using an Interpretive Structural Modeling (ISM) Approach. Sustainability 2021, 13, 3420. [Google Scholar] [CrossRef]
  24. Panarello, D.; Gatto, A. Decarbonising Europe—EU Citizens’ Perception of Renewable Energy Transition amidst the European Green Deal. Energy Policy 2023, 172, 113272. [Google Scholar] [CrossRef]
  25. Gribkova, D.; Milshina, Y. Energy Transition as a Response to Energy Challenges in Post-Pandemic Reality. Energies 2022, 15, 812. [Google Scholar] [CrossRef]
  26. Brodny, J.; Tutak, M. Analyzing Similarities between the European Union Countries in Terms of the Structure and Volume of Energy Production from Renewable Energy Sources. Energies 2020, 13, 913. [Google Scholar] [CrossRef]
  27. Comisia Europeană. Pactul Verde European. Available online: https://commission.europa.eu/strategy-and-policy/priorities-2019-2024/european-green-deal_ro (accessed on 19 December 2022).
  28. Comisia Europeană. REPowerEU: Energie La Prețuri Accesibile, Sigură Și Durabilă Pentru Europa. Available online: https://ec.europa.eu/info/strategy/priorities-2019-2024/european-green-deal/repowereu-affordable-secure-and-sustainable-energy-europe_ro (accessed on 16 November 2022).
  29. Hainsch, K.; Löffler, K.; Burandt, T.; Auer, H.; Crespo del Granado, P.; Pisciella, P.; Zwickl-Bernhard, S. Energy Transition Scenarios: What Policies, Societal Attitudes, and Technology Developments Will Realize the EU Green Deal? Energy 2022, 239, 122067. [Google Scholar] [CrossRef]
  30. Lambert, L.A.; Tayah, J.; Lee-Schmid, C.; Abdalla, M.; Abdallah, I.; Ali, A.H.M.; Esmail, S.; Ahmed, W. The EU’s Natural Gas Cold War and Diversification Challenges. Energy Strategy Rev. 2022, 43, 100934. [Google Scholar] [CrossRef]
  31. Perez Villanueva, C.M. Analyzing the Transition of Electricity Generation in the European Electricity System until 2030. Master’s Thesis, Politecnico di Torino, Torino, Italy, 2022. [Google Scholar]
  32. Osička, J.; Černoch, F. European Energy Politics after Ukraine: The Road Ahead. Energy Res. Soc. Sci. 2022, 91, 102757. [Google Scholar] [CrossRef]
  33. Giampietro, M.; Bukkens, S.G.F. Knowledge Claims in European Union Energy Policies: Unknown Knowns and Uncomfortable Awareness. Energy Res. Soc. Sci. 2022, 91, 102739. [Google Scholar] [CrossRef]
  34. Tundys, B.; Bretyn, A. Energy Transition Scenarios for Energy Poverty Alleviation: Analysis of the Delphi Study. Energies 2023, 16, 1870. [Google Scholar] [CrossRef]
  35. Ślosarski, R. Clean Energy in the European Union: Transition or Evolution? Energy Environ. 2023, 34, 2163–2185. [Google Scholar] [CrossRef]
  36. Márquez-Sobrino, P.; Díaz-Cuevas, P.; Pérez-Pérez, B.; Gálvez-Ruiz, D. Twenty Years of Energy Policy in Europe: Achievement of Targets and Lessons for the Future. Clean Technol. Environ. Policy 2023, 25, 2511–2527. [Google Scholar] [CrossRef]
  37. Kwilinski, A.; Lyulyov, O.; Pimonenko, T. Greenfield Investment as a Catalyst of Green Economic Growth. Energies 2023, 16, 2372. [Google Scholar] [CrossRef]
  38. Nacu, T.; Jercan, E. Environmental Economy and Green Transition in the European Union: Two Complementary Concepts. Proc. Int. Conf. Bus. Excell. 2023, 17, 1497–1508. [Google Scholar] [CrossRef]
  39. Palle, A.; Richard, Y. Multilevel Governance or Scalar Clashes: Finding the Right Scale for EU Energy Policy. Tijdschrift Voor Economische En Sociale Geografie 2022, 113, 1–18. [Google Scholar] [CrossRef]
  40. Sasse, J.-P.; Trutnevyte, E. Cost-Effective Options and Regional Interdependencies of Reaching a Low-Carbon European Electricity System in 2035. Energy 2023, 282, 128774. [Google Scholar] [CrossRef]
  41. Weko, S. Communitarians, Cosmopolitans, and Climate Change: Why Identity Matters for EU Climate and Energy Policy. J. Eur. Public Policy 2022, 29, 1072–1091. [Google Scholar] [CrossRef]
  42. Dolge, K.; Blumberga, D. Transitioning to Clean Energy: A Comprehensive Analysis of Renewable Electricity Generation in the EU-27. Energies 2023, 16, 6415. [Google Scholar] [CrossRef]
  43. Urbano, E.M.; Kampouropoulos, K.; Romeral, L. Energy Crisis in Europe: The European Union’s Objectives and Countries’ Policy Trends—New Transition Paths? Energies 2023, 16, 5957. [Google Scholar] [CrossRef]
  44. Eurostat. EU Energy Mix and Import Dependency. Available online: https://ec.europa.eu/eurostat/statistics-explained/index.php?title=EU_energy_mix_and_import_dependency (accessed on 19 December 2022).
  45. Parlamentul European. Politica Energetică: Principii Generale. Available online: https://www.europarl.europa.eu/factsheets/ro/sheet/68/politica-energetica-principii-generale (accessed on 19 December 2022).
  46. Eurostat. Energy Imports Dependency. Available online: https://ec.europa.eu/eurostat/databrowser/view/nrg_ind_id/default/table?lang=en (accessed on 19 December 2022).
  47. Stein, E.W. A Comprehensive Multi-Criteria Model to Rank Electric Energy Production Technologies. Renew. Sustain. Energy Rev. 2013, 22, 640–654. [Google Scholar] [CrossRef]
  48. Yuan, J.; Nian, V.; Su, B.; Meng, Q. A Simultaneous Calibration and Parameter Ranking Method for Building Energy Models. Appl. Energy 2017, 206, 657–666. [Google Scholar] [CrossRef]
  49. Eurostat. SHARES (Renewables). Available online: https://ec.europa.eu/eurostat/web/energy/data/shares (accessed on 19 December 2022).
  50. Consiliul European Infografic—Cât de Dependente Sunt Statele Membre Ale UE de Importurile de Energie? Available online: https://www.consilium.europa.eu/ro/infographics/how-dependent-are-eu-member-states-on-energy-imports/ (accessed on 19 December 2022).
  51. Mahla, S.K.; Parmar, K.S.; Singh, J.; Dhir, A.; Sandhu, S.S.; Chauhan, B.S. Trend and Time Series Analysis by ARIMA Model to Predict the Emissions and Performance Characteristics of Biogas Fueled Compression Ignition Engine. Energy Sources Part A Recovery Util. Environ. Eff. 2023, 45, 4293–4304. [Google Scholar] [CrossRef]
  52. Bastardoz, N.; Matthews, M.J.; Sajons, G.B.; Ransom, T.; Kelemen, T.K.; Matthews, S.H. Instrumental Variables Estimation: Assumptions, Pitfalls, and Guidelines. Leadersh. Q. 2023, 34, 101673. [Google Scholar] [CrossRef]
  53. Halim, G.A.; Agustin, P.; Adiwijayanto, E.; Ohyver, M. Estimation of Cost of Living in a Particular City Using Multiple Regression Analysis and Correction of Residual Assumptions through Appropriate Methods. Procedia Comput. Sci. 2023, 216, 613–619. [Google Scholar] [CrossRef]
Figure 1. Geographical distribution of energy dependence in Europe.
Sustainability 15 15560 g001
Figure 2. The comparative record of the EU member states regarding the ranks received according to (blue line) dependence on imports, (orange line) the share of renewable fuels in the final consumption of available energy, and (grey line) the share of fossil fuels in the energy mix.
Sustainability 15 15560 g002
Figure 3. The energy dependence of the EU member states according to the obtained score.
Sustainability 15 15560 g003
Figure 4. Use of energy from renewable sources—solar energy.
Sustainability 15 15560 g004
Figure 5. Forecasting the use of energy from renewable sources in transport.
Sustainability 15 15560 g005
Figure 6. Histogram and descriptive analysis of the series for the price of electricity for household consumers (KWh, expressed in EUR).
Sustainability 15 15560 g006
Figure 7. Distribution of the series: (a) Quantiles for normal distribution (b) l n Y distribution.
Sustainability 15 15560 g007
Figure 8. Graph for the actual value, the fitted value of Y, and the residual.
Sustainability 15 15560 g008
Figure 9. CUSUM test results for model stability.
Sustainability 15 15560 g009
Figure 10. l n Y series forecast.
Sustainability 15 15560 g010
Table 1. Estimation of coefficients.
CoefficientThe Sign and the Value of Coeff.Standard Errort-StatisticProbability
β 0 4.709274 6.085400−0.7738640.4589
β E P 1.894556 0.7755342.4429060.0372
β E F 1.619459 0.656583−2.4698790.0356
β D a y s 0.001509 0.0486440.0310280.9759
β S E U 0.120750 0.0484102.4943240.0342
Table 2. Results of the models AR (1), MA (1), and ARIMA (1, 1, 1).
Model R 2 Aikake CriterionSchwartz Criterion
AR (1)0.78−3.91−3.77
MA (1)0.68−3.45−3.31
ARIMA (1, 1, 1)0.84−4.05−3.86
Disclaimer/Publisher’s Note: The statements, opinions and data contained in all publications are solely those of the individual author(s) and contributor(s) and not of MDPI and/or the editor(s). MDPI and/or the editor(s) disclaim responsibility for any injury to people or property resulting from any ideas, methods, instructions or products referred to in the content.

