1. Introduction
The commercial efficiency problem in water utilities (WU) is present everywhere, but is more pronounced in developing and especially small developing countries. Therefore, as a small developing country, Kosovo has serious problems in the level of commercial efficiency in its water sector. The “commercial efficiency” of the sector is informed by the high level of water losses and low debt collection rates.
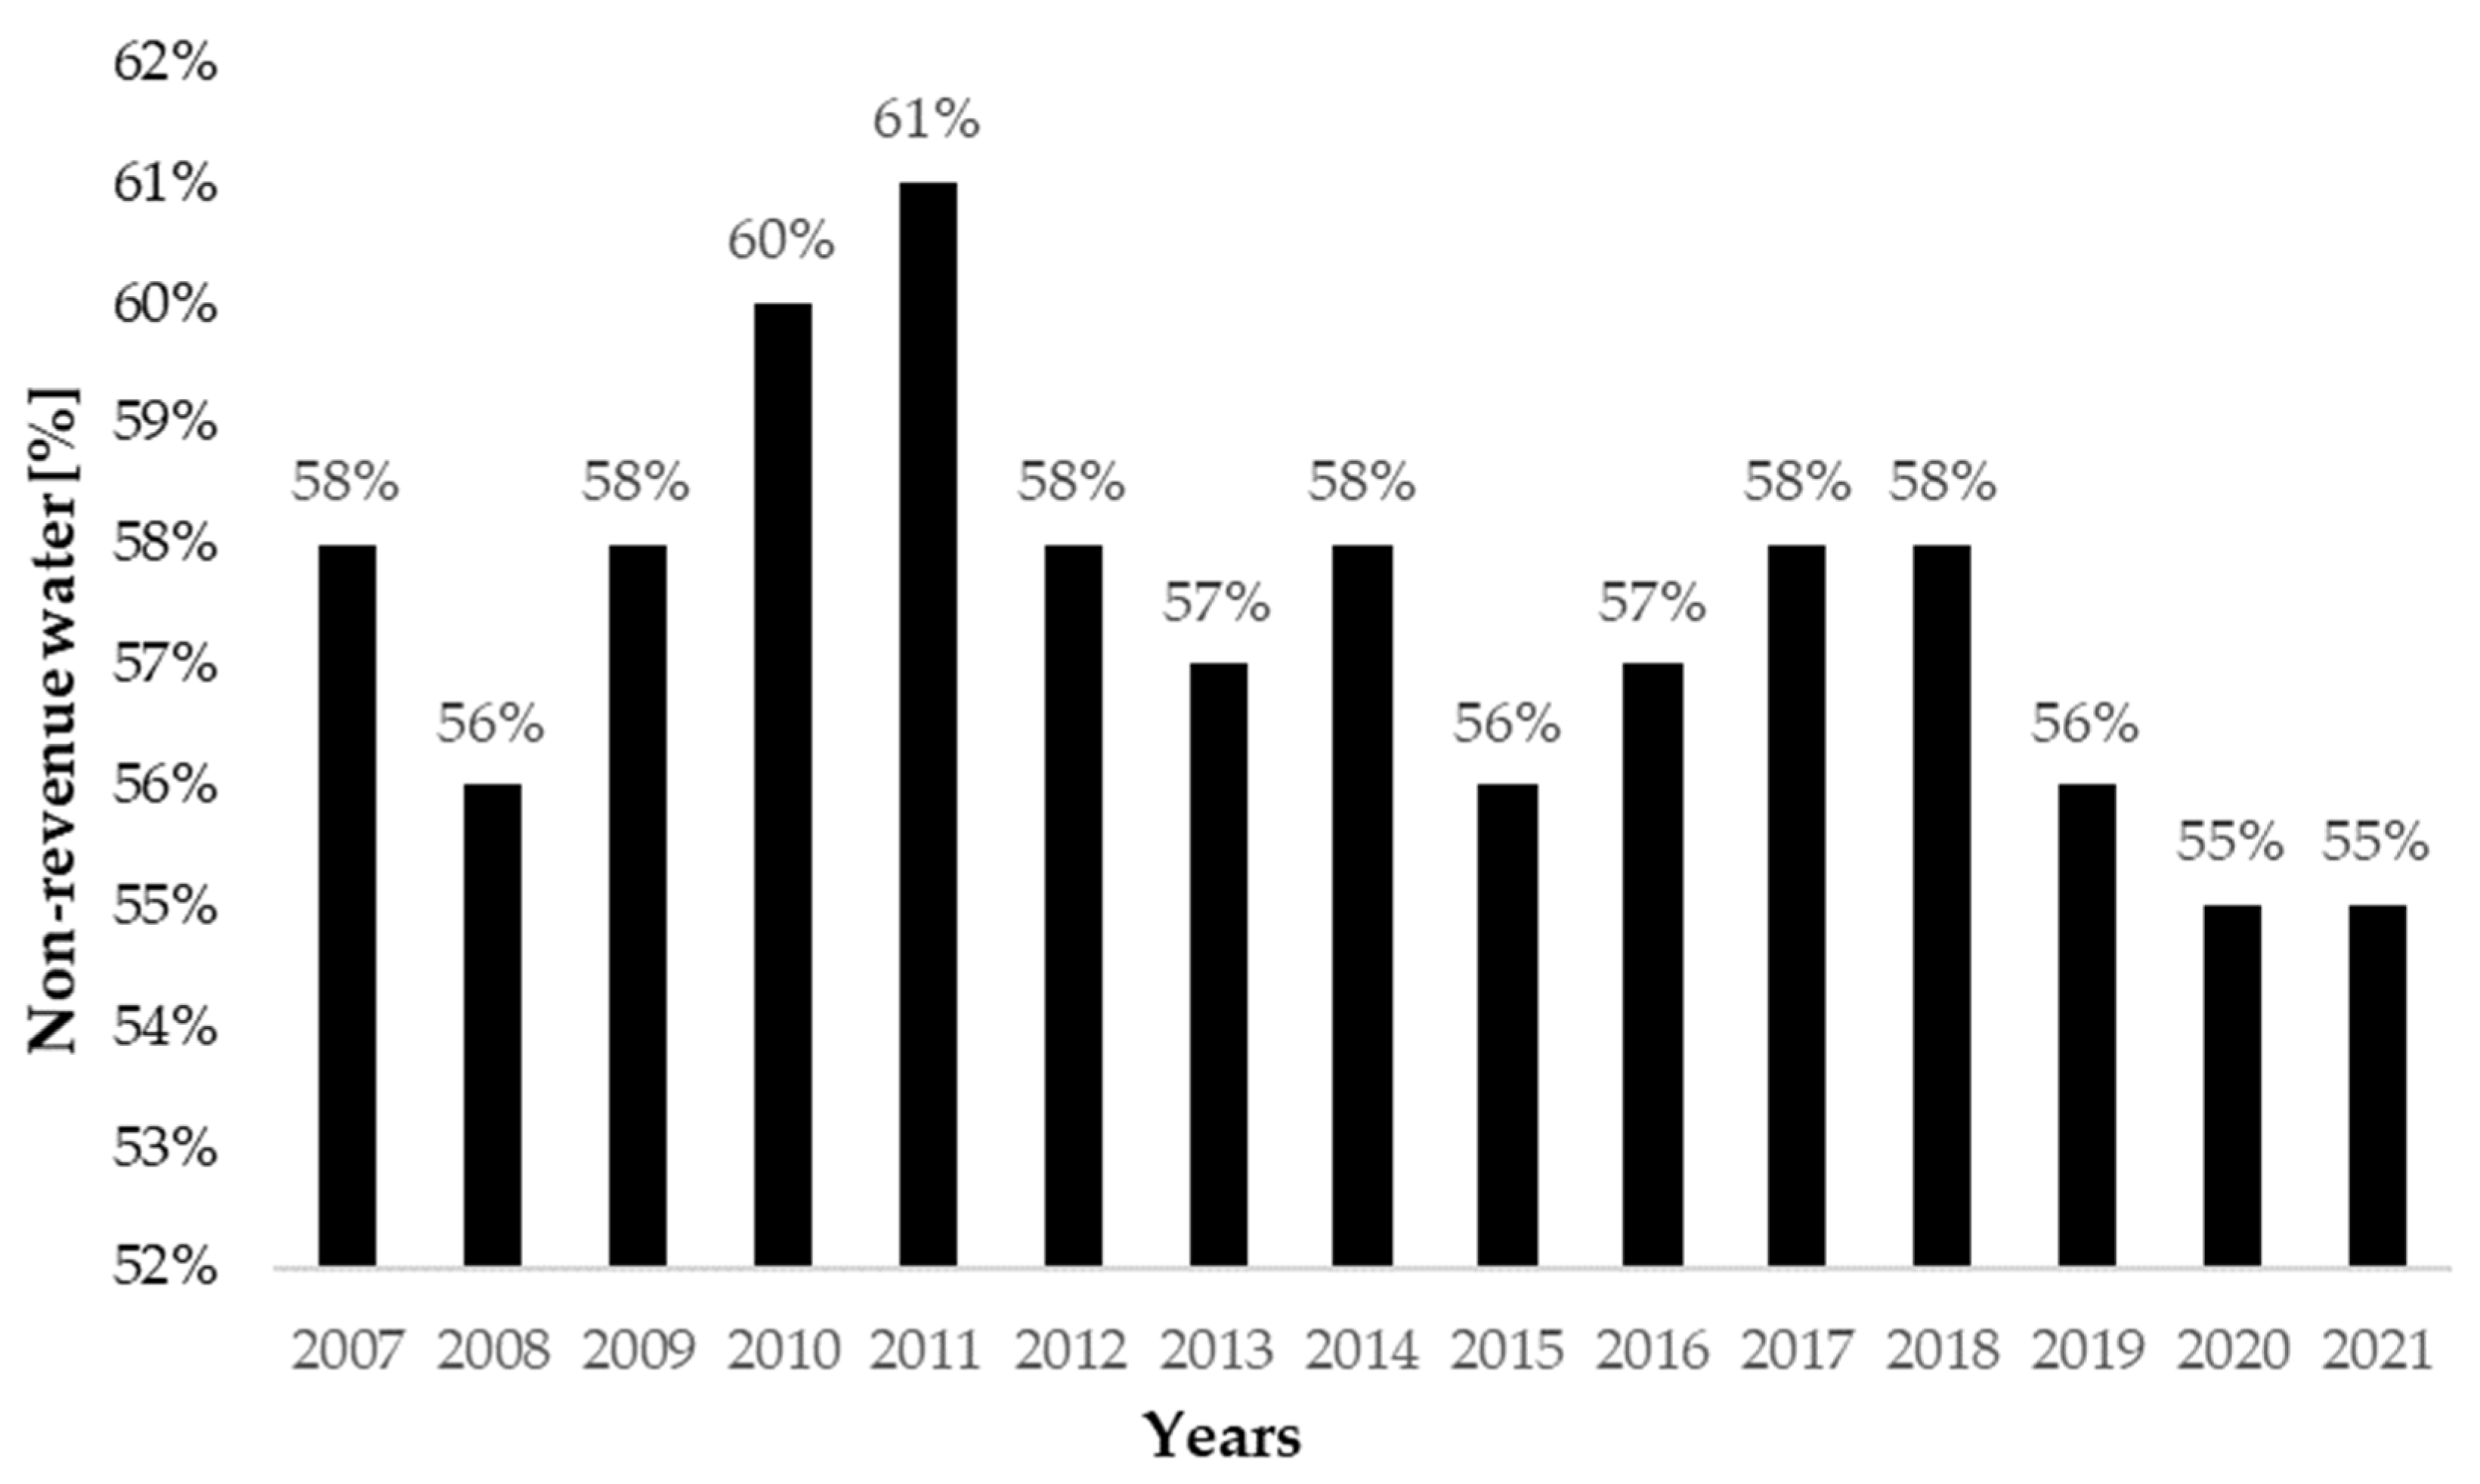
Water losses in the WUs of Kosovo are relatively high. The WUs, despite some of their commitments and limited support from projects financed by international donors, cannot solve the alarming water loss situation. On the contrary, the level of non-revenue water (NRW) has remained high. In some WUs, the situation has worsened, as shown in annual performance reports published by the Water Service Regulatory Authority [
1]. For 15 years, NRW, expressed as a percentage of the whole sector, has stayed almost unchanged. It is at 55 to 61%, with small decreases and increases from year to year (
Figure 1).
NRW arises for various reasons, such as leakage from old pipes, water theft, irrationally high pressure, errors in water meter readings, the low accuracy of water consumption measurements, etc. Almost all WUs in Kosovo have serious problems with collecting water bills, but last year’s situation showed a little improvement.
Considering the NRW and the low cashing rate (61%—2007 to 93%—2021 of issued invoices [
1]), it has been proven that only 33.55% to 56.73% of produced water generates income. The rest is calculated as technical and administrative losses. Water utilities burden end users with higher water tariffs to cover all operating and capital costs.
Therefore, the state of NRW during the last 15 years in the WUs of Kosovo has not changed much. Still, there has been significant improvement in the cashing rate in recent years, which gives hope that the funds collected may also be invested in reducing NRW (which at the moment is quite worrying).
Studies have shown that reducing water need by 20% also means a reduction in energy requirements of 20% [
2]. According to [
3], a decrease in water losses in the water supply increases energy efficiency by 30%. Water consumption rationalization is achieved by using water-saving taps and other water fittings that consume less water in the household during use, rationalizing consumption (using rainwater and already used water of good quality for watering), etc. [
4].
Since pressure is one of the largest water loss generators in the water supply system, great attention is dedicated to managing the pressure in the water supply systems by regulating water levels in the water tanks [
5].
Within the concept of (access) “Watergy” [
6], a methodology is presented that helps cities in terms of significant energy improvements, economic savings, and savings through technical and management improvements in water supply and sewage systems. Specifically, this concept has guidelines for improving the pumping system, reducing water losses, and automating the management and control of the system, with a strict system of measurement of extreme water consumption. As a result, efficiency increases, providing consumers a higher-quality service with lower water and energy requirements.
Efficiency in the water supply system also includes the ultimate use of water: effective toilets, low-spring showers, and finally, a reduction in water consumption, as well as the overall efficiency of water supply. According to the aforementioned concept, the most promising areas for action within water supply systems are improving the pumping systems, controlling leaks and overall water losses, implementing automation management systems, and regularly monitoring water consumption, preferably with precise measurement of extreme water consumption. There are methods/tools for possible solutions for increasing energy efficiency and reducing water losses in the water supply system, namely through applying hydraulic models for purposes of analysis of different structures of water supply networks and modes and the introduction of the management of system energy, including the water supply system. The fixed and variable area of discharges (FAVAD) method predicts the impact of pressure on leak area variations, and thus on the amount of water losses [
3]. Other authors, such as [
7], propose similar solutions and models. Numerous authors propose effective water use at the point of consumption [
8] and loss reduction, which is already a classic method of managing water needs. In contrast, the FAVAD has advantages and is often used in practice today.
At the same time, it should be kept in mind that reducing all components of water loss to zero is neither technically possible nor economically viable. The components of water loss should be accurately assessed and prioritized for reduction, most often done achieved using the International Water Association (IWA) standard water balance method. Based on this balance, best-practice water loss performance indicators can be calculated for water-loss-target monitoring and leakage benchmarking [
9].
An evaluation of the recent demand for an oversized water supply system and a preliminary technical analysis of the possibility of energy saving as a solution has resulted in improvements in energy management, which has contributed to increasing energy efficiency [
10]. Although the overall management of water losses should be based on an integral approach for NRW reduction in water distribution networks based on field activities, optimization, GIS applications, usage of different types of models and other digital technologies [
11,
12], and pressure management can be considered some of the key measures needed to achieve overall sustainability in the water supply system.
Water systems throughout the world are facing immense sustainability challenges such as water scarcity, climate change, and population growth, together with growing recognition of the limitations of centralized systems in meeting the demands of urban water services while addressing key sustainability objectives. Issues related to service quality are especially pronounced in developing countries, and although increasing the overall sustainability of WU operations is a complex and long-term process [
13], the management of NRW is certainly one of the first steps in this process. Reducing operating costs, increasing revenues, improving water resource efficiency, and expanding water supply are the main benefits of reducing NRW. Therefore, NRW presents a critical challenge globally, particularly in developing countries, because it affects water sustainability both in terms of water quality and quantity [
14,
15]. As such, the proposed strategies for reducing NRW should focus on addressing the significant causes and evaluating the advantages, disadvantages and limitations of each strategy to identify which are most appropriate. In the specific case dealt with in this paper, the challenges were primarily those of financial and time constraints; thus, it was necessary to propose measures that would give results in a relatively short time and with minimal investment.
To achieve the objectives of this research, it is necessary to measure the water flow and pressure in the area in which water losses are high. Then, through mathematical modeling, we expect to obtain satisfactory results in reducing NRW.
2. Managing Large Consumers
The five Kosovo WUs showed good awareness of the need to maintain water meters with better technical conditions. However, due to financial constraints, little or no investments have been made in commercial water meters with high precision. The billing systems of WUs offer monthly statistics on the volume of water billing to all their consumers, and all WUs provide good examples for very large industrial or institutional consumers, such as the Beer Factory in Peja, the military storage facility of KFOR in Prizren, administrative buildings, hotels in Prishtina, etc.
WUs have not devoted very much to prioritizing water consumption, or specifically how large consumers utilize water. As a result, some specific activities, which are easy to implement, are necessary. The reasons that attention should be paid to large consumers are as follows:
They are significant sources of income for WUs, and require special attention;
These consumers have huge consumption levels.;
The following are five simple steps to identify large consumers:
The first step is determining consumers with high levels of consumption, and creating a database for their water meters;
The second step is to identify water consumption prioritization;
The third step is a selection of water meters and their sizing, respectively;
The fourth step is to determine the frequency of water meter readings;
The fifth step is the periodical testing of water meters.
2.1. Determination of Large Consumers
There is no fixed division for “large” consumers, but good examples categorize consumers with 100, 500, and 1000 [m3/month], or at other suitable consumption limit values.
2.2. Customer Prioritization Based on Consumption
Customer prioritization based on consumption means taking water consumption curves at suitable time intervals.
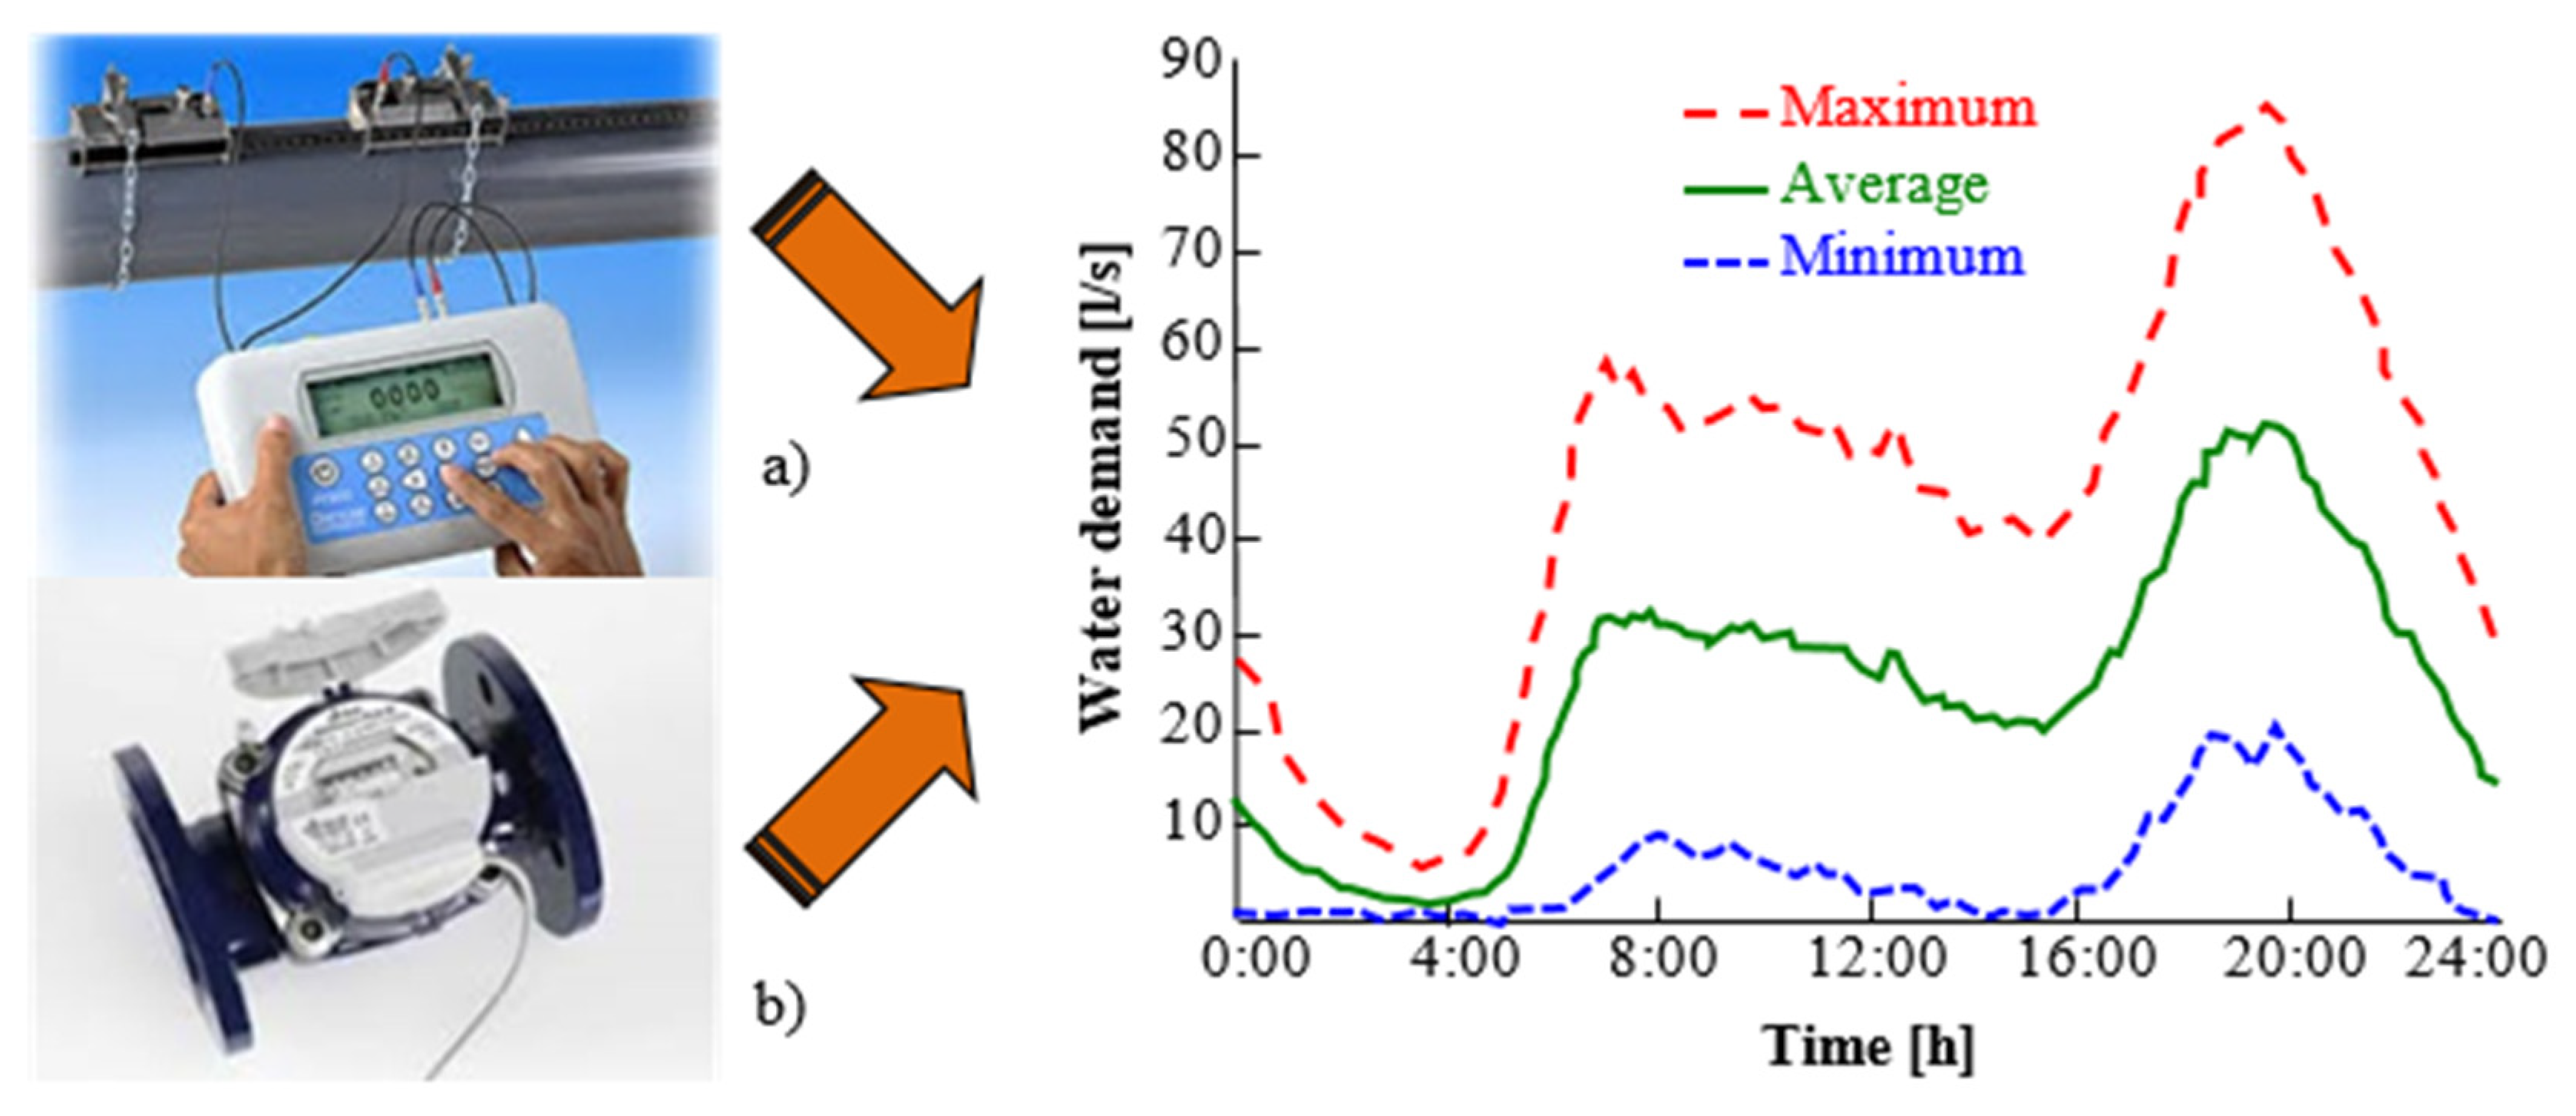
Two easy approaches for determining the profile of consumption are as follows (
Figure 2):
Installation of ultrasonic water meters on the outside wall of the pipes for measuring water consumption in a short time period, such as one week or longer;
Installation of data loggers in existing or new water meters, as one of the simpler and faster options.
The primary purpose of using these two methods is to obtain a spending curve for 24 h. In addition, some seasonal and weekly measurements should be considered as options.
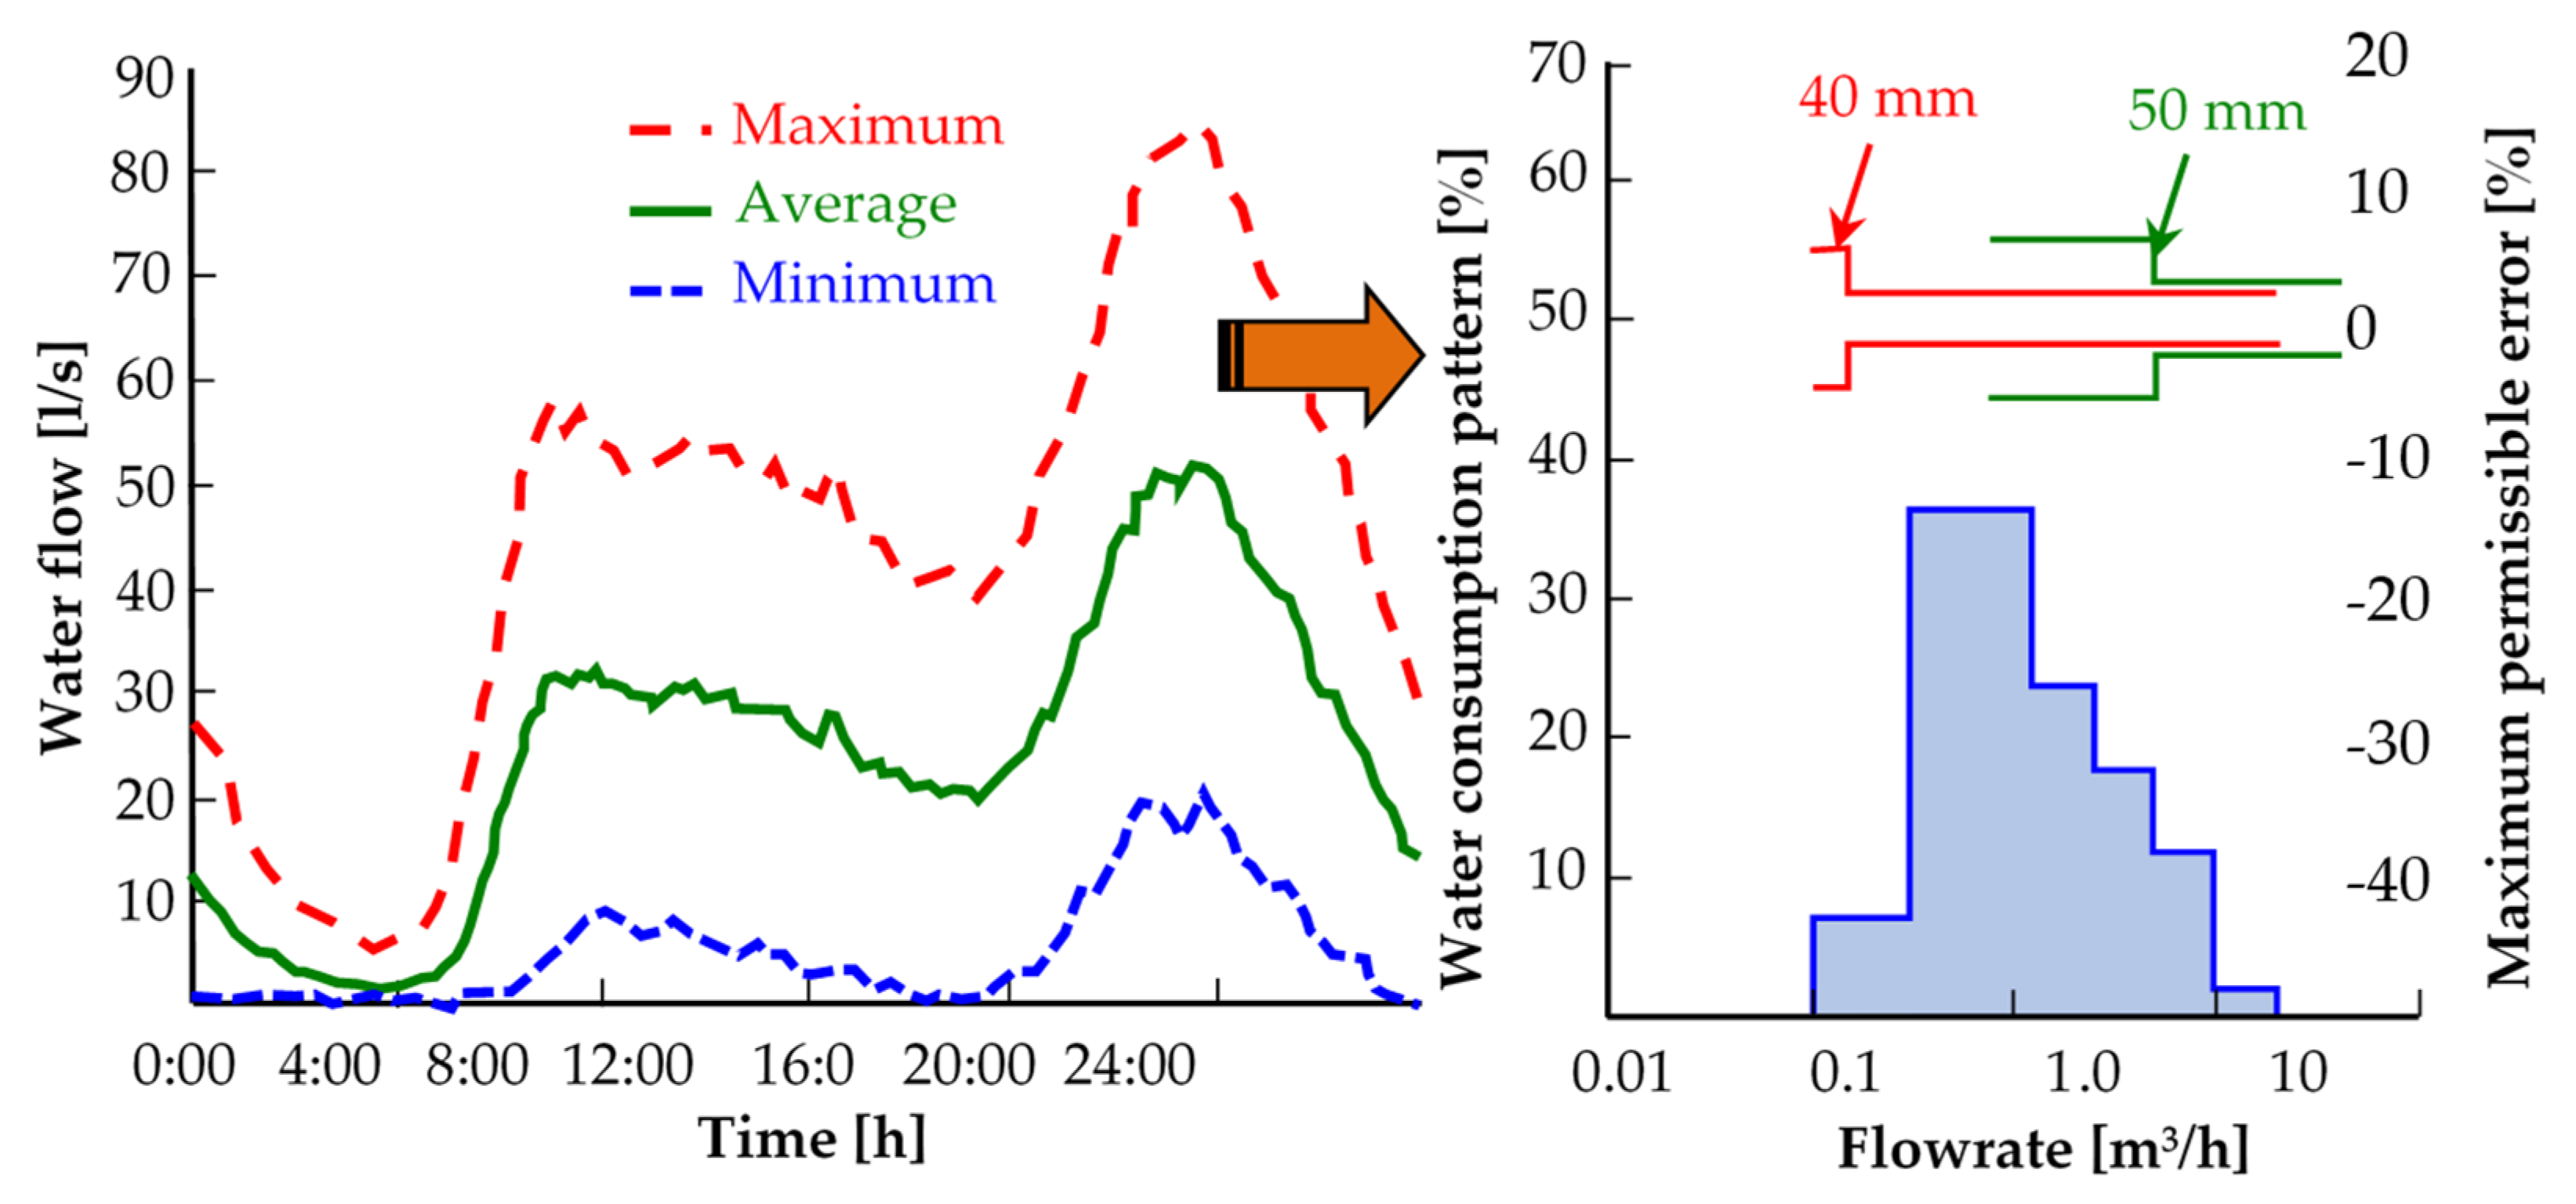
2.3. Selection of Water Meters
There are no universal and correct choices to select in terms of water meter size. Therefore, after determining the expenditure profile, the appropriate solution for measuring equipment can be chosen (using the most accurate water consumption measurement that cannot be recorded by standard water meters (
Figure 3)).
2.4. Frequency of Water Meter Readings
The reading intervals of water meters may be more frequent, especially for large consumers (for example, weekly). In addition, automatic meter reading (AMR) should be considered an option. Data loggers with a SIM card are also a suitable solution considering their cost efficiency. Installed equipment nearby could be fixed in a network for reading water meters online.
2.5. Water Meter Calibration
Testing the accuracy of measures from water meters is very important because a good percentage of water consumption is not registered. The testing should be carried out in accredited laboratories for water meter calibration (
Figure 4).
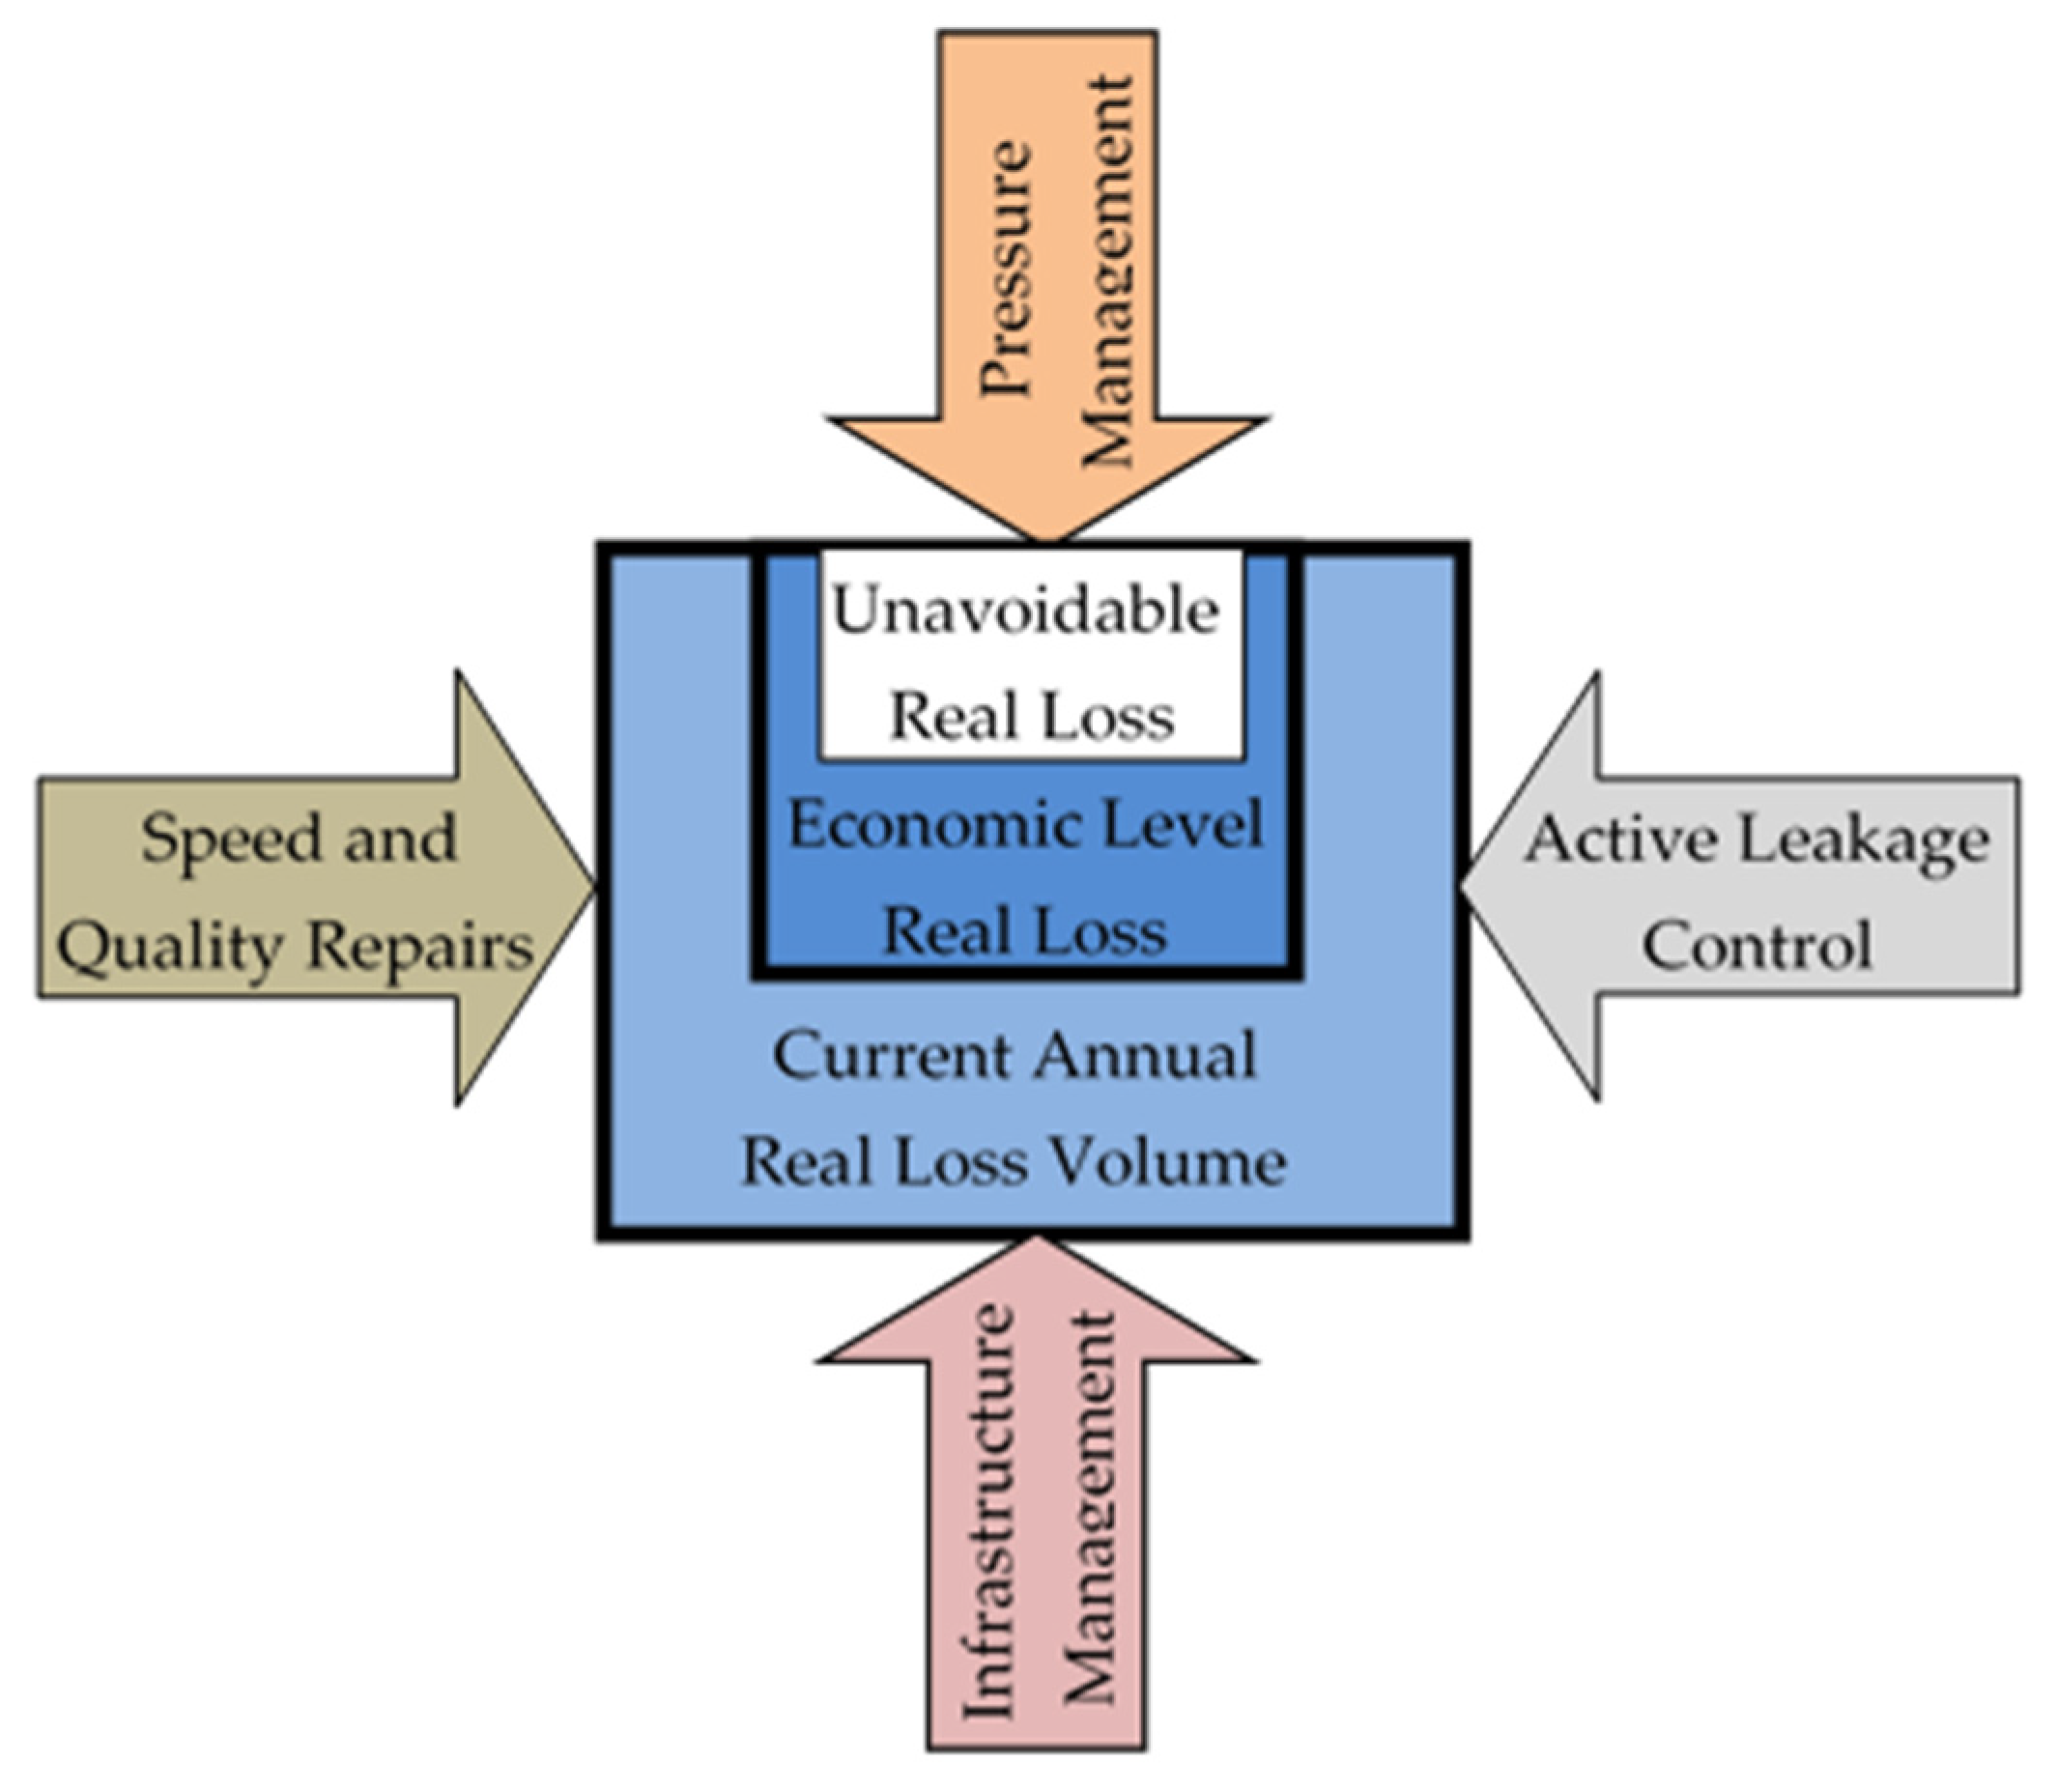
3. Managing Pressure in the Network
Pressure management is one of the quickest and most efficient ways to reduce physical water losses in high-pressure networks. It is one of four main methods to lessen physical water losses, as shown in
Figure 5 [
10]:
Pressure management is usually applied in networks with better zoning and in separate areas through zoned valves. Another prerequisite is good knowledge of pressure levels to identify critical points in the network pressure, flow recognition within 24 h, and pressure monitoring.
Reducing pressure in the network efficiently decreases the number of new bursts that occur in the water network, and is written as follows [
11,
12,
13,
14]:
where
Q0 [m3/day]—initial leak flow rate at pressure P0;
Q1 [m3/day]—leak flow rate at adjusted pressure P1;
P1 [bar]—adjusted average zone pressure;
P0 [bar]—initial average zone pressure;
N1 [-]—the leakage component, which depends on the type of material and infrastructure water index. For zones with higher background leakages,
N1 can be empirically calculated with the following equation:
ICF [-]—internal condition factor;
ILI [-]—infrastructure leakage index;
p [%]—detectable leakages.
Efficiently reducing pressure decreases the number of water leakages occurring from burst pipes and the water supply, as provided within existing reports [
16,
17,
18,
19]:
where
B0 [-]—initial burst rate at pressure P1;
B1 [-]—burst rate at adjusted pressure P1;
P1 [bar]—adjusted average zone pressure;
P0 [bar]—initial average zone pressure;
N2 [-]—index influenced by system age and conditions. Studies have proven that
N2 could range from 0.50 to 6.50. Based on practical experience, for large mains, N2 is accepted to be 2.47, and for distribution lines is 2.36.
Five actions that need to be undertaken for efficient pressure management are as follows:
The first step is a feasibility study of the network and evaluation of opportunities for pressure management based on the topography of the area and building;
The second step is measuring the flow and water pressure in the main network;
The third step is selecting the approach to pressure management;
The fourth step is evaluation of results expected from reducing pressure;
The fifth step is the system’s design, construction, and operational work.
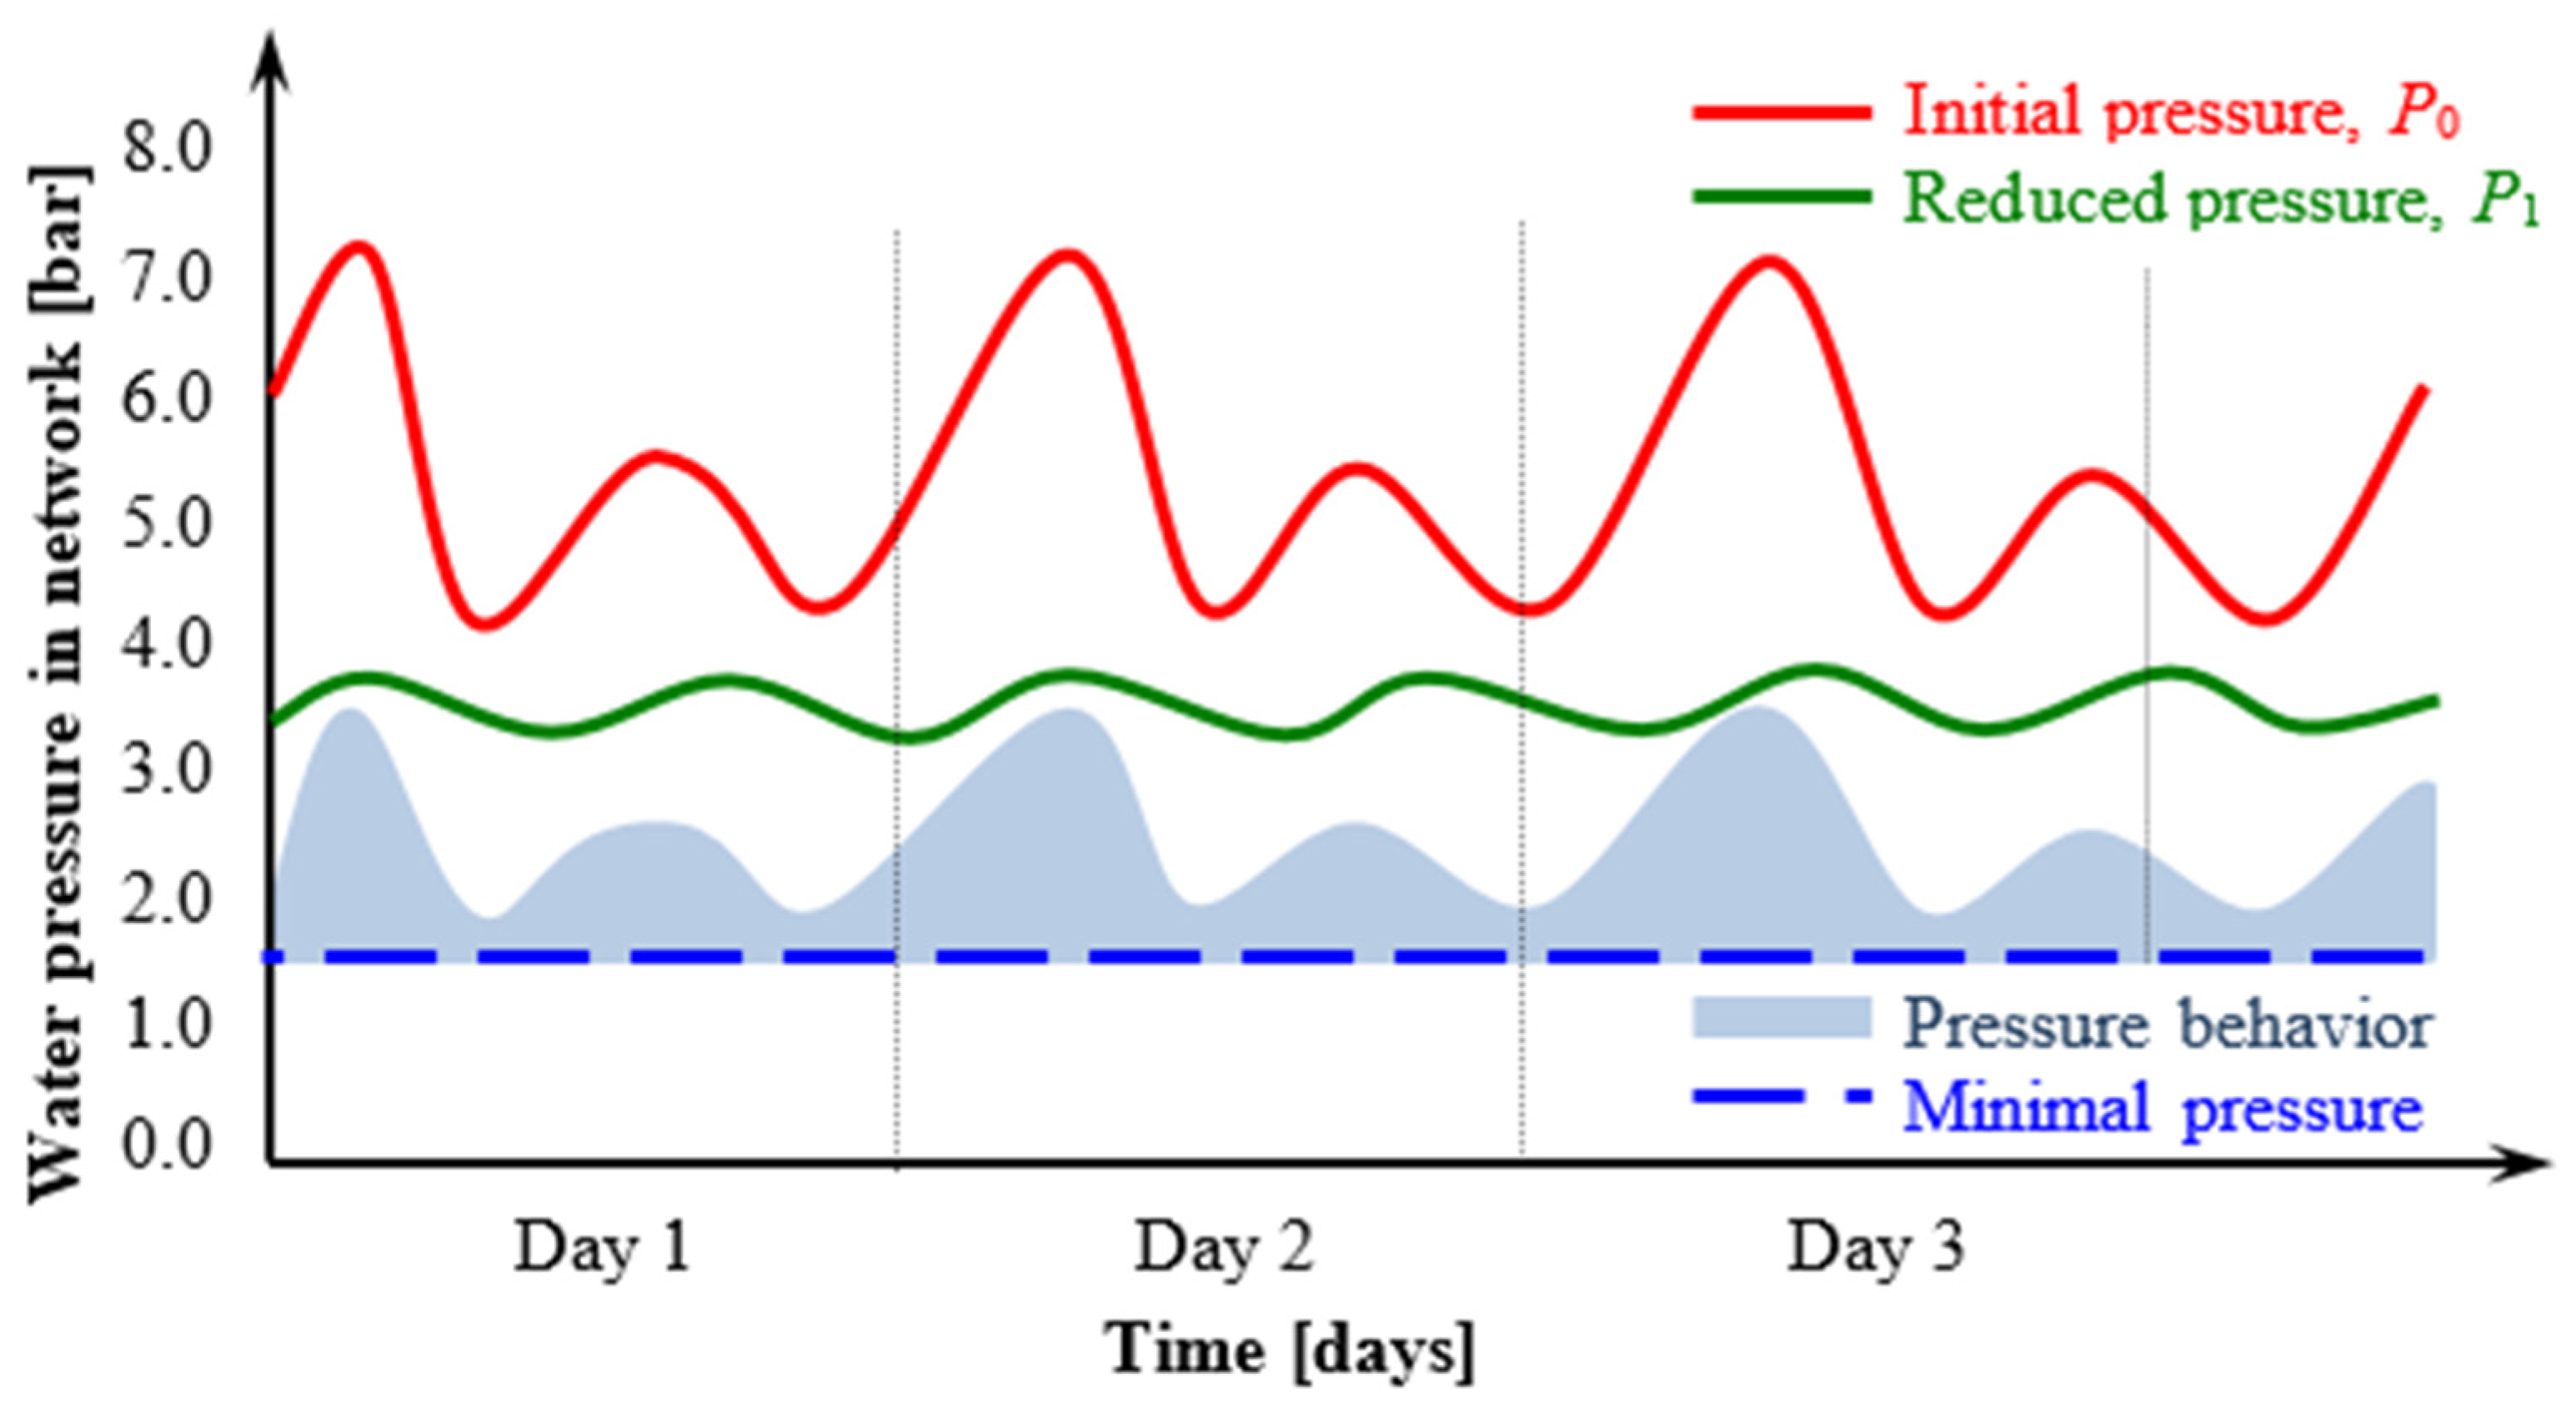
3.1. Managing Pressure Using Pressure-Reducing Valves (PRV) with Constant Outlet Pressure
Figure 6 represents the case in which the pressure in the network is always held at an adjusted level by PRVs at constant pressure.
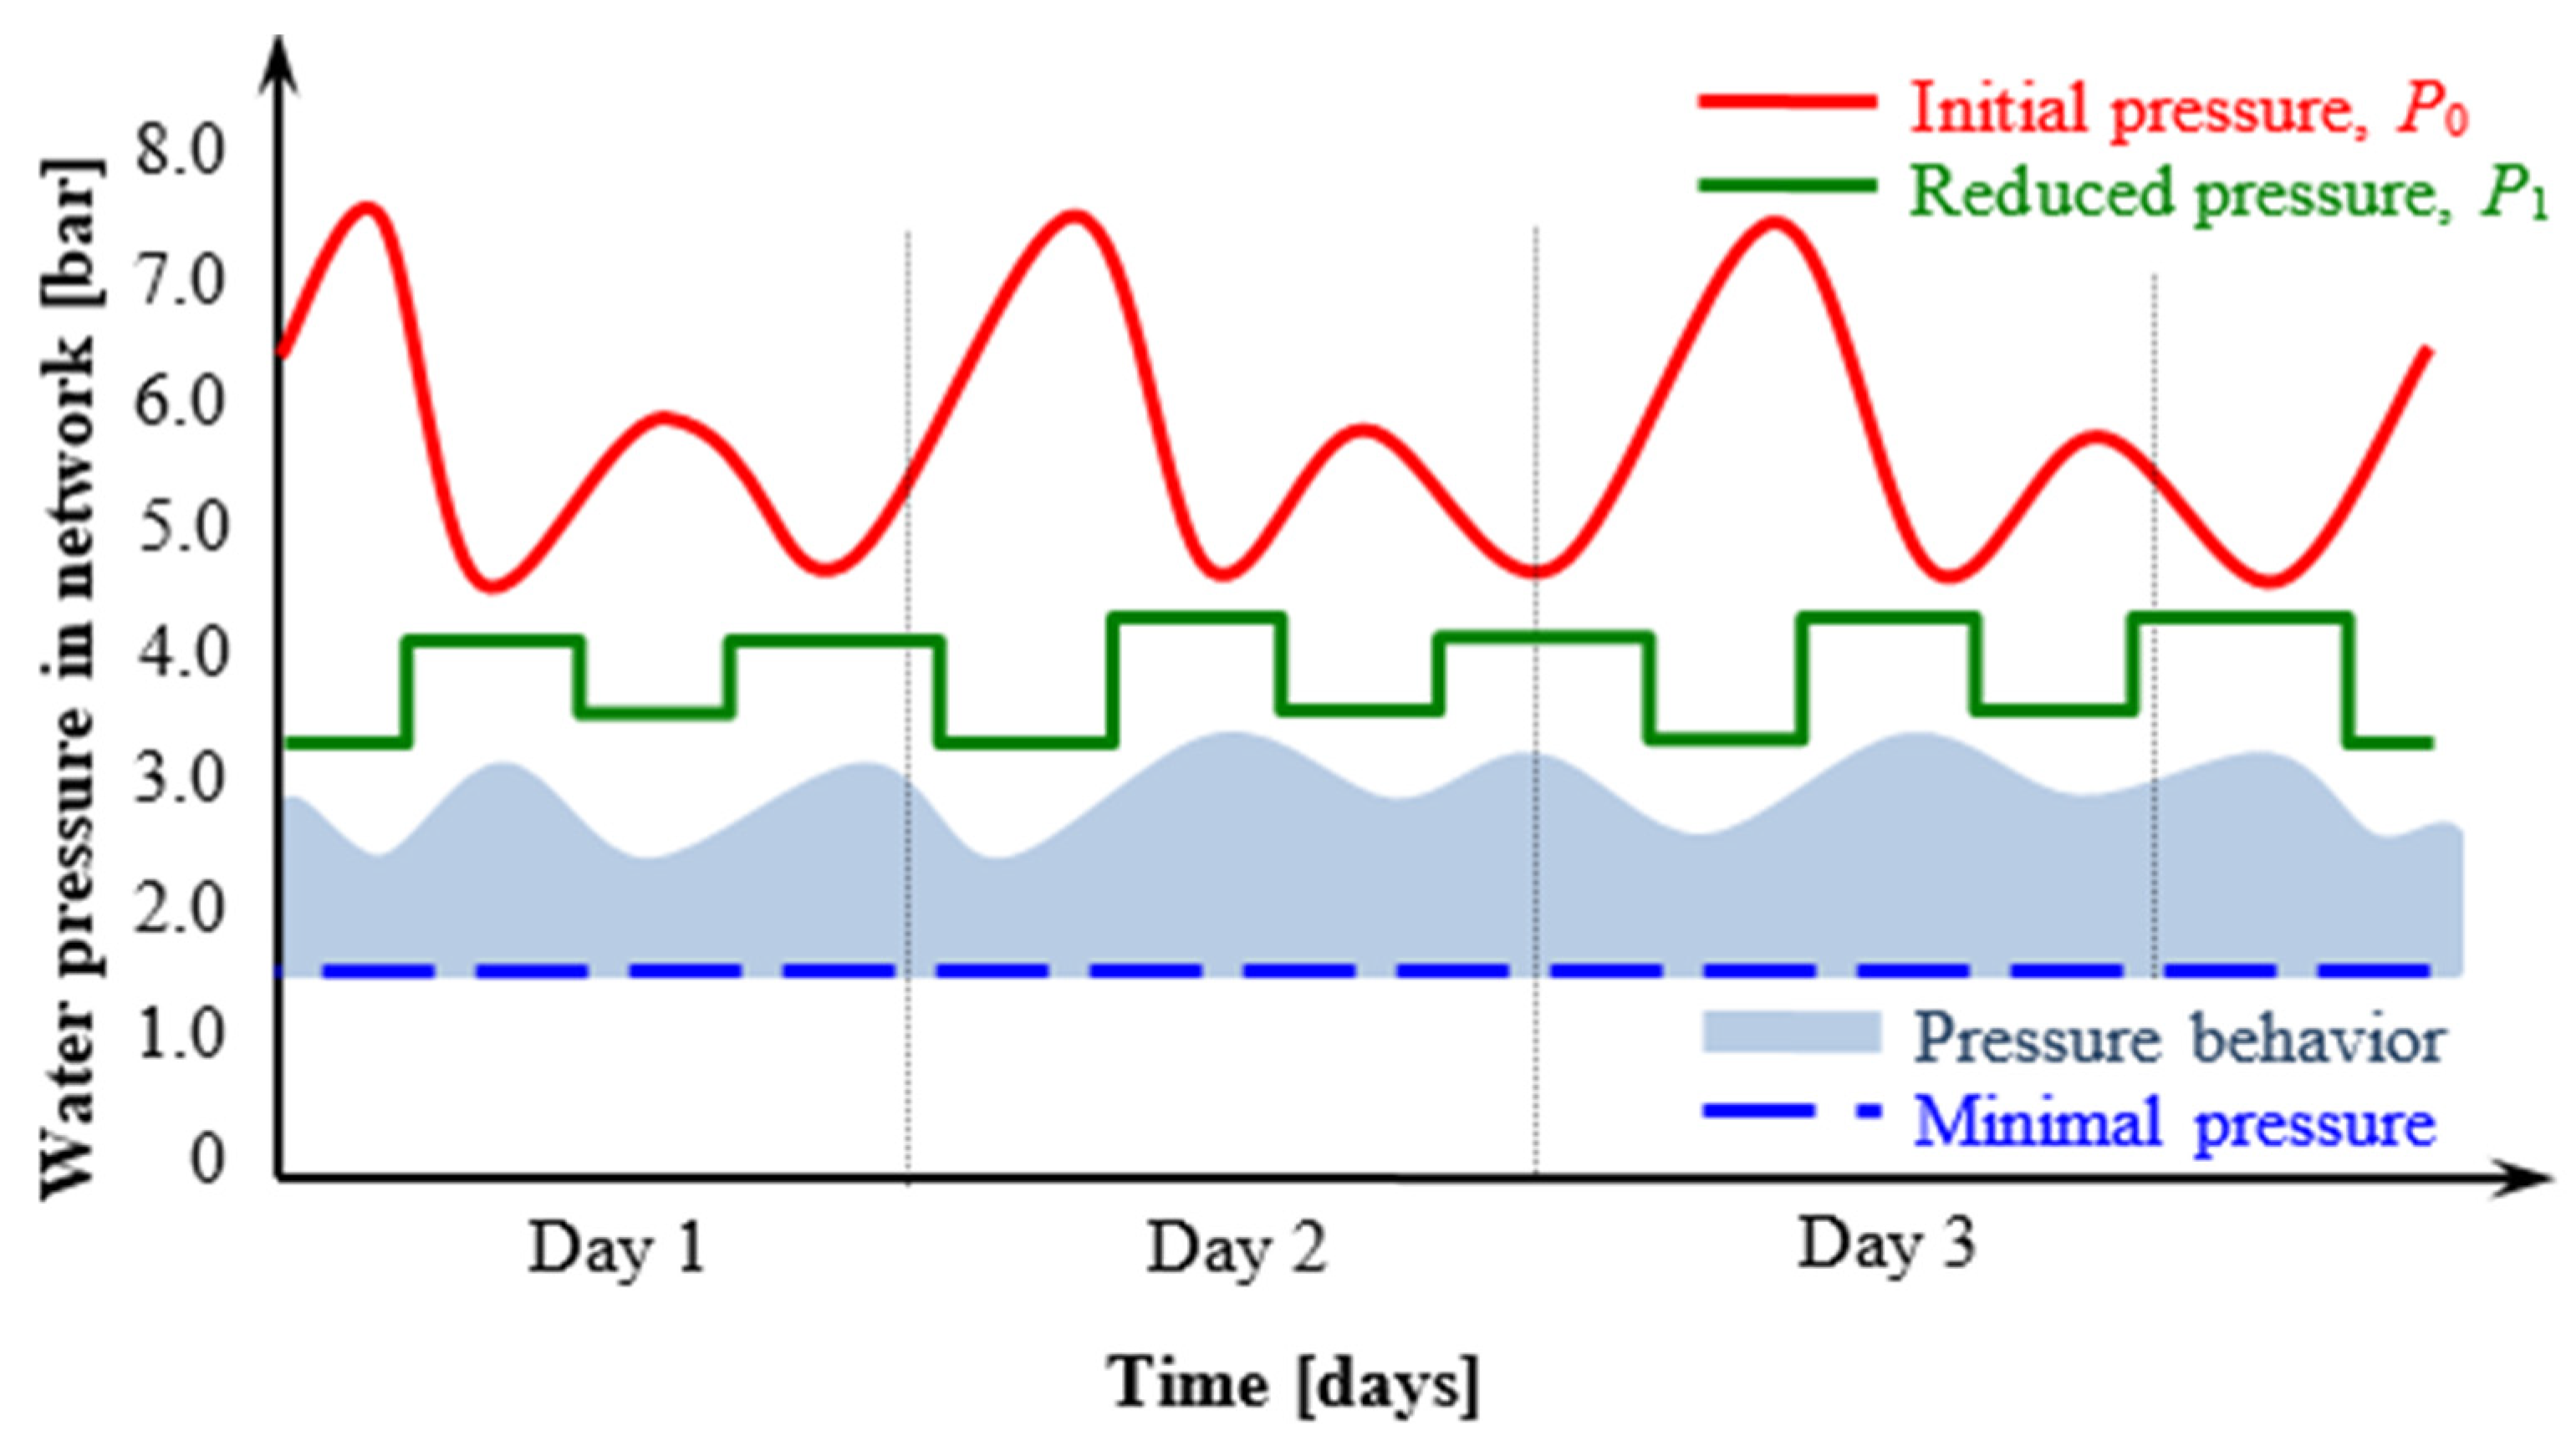
3.2. Managing Pressure Using PRVs with Time-Dependent Outlet Pressure
We also present a case in which the network pressure is held at a modular level, as previously defined, so that the reduced valve of pressure regulates the pressure at different time intervals.
This rule is necessary when the consumption varies with time; for example, when consumption is low (night periods), there is a greater reduction in pressure, and when consumption is high (during peaks), there is a lower reduction in pressure (
Figure 7).
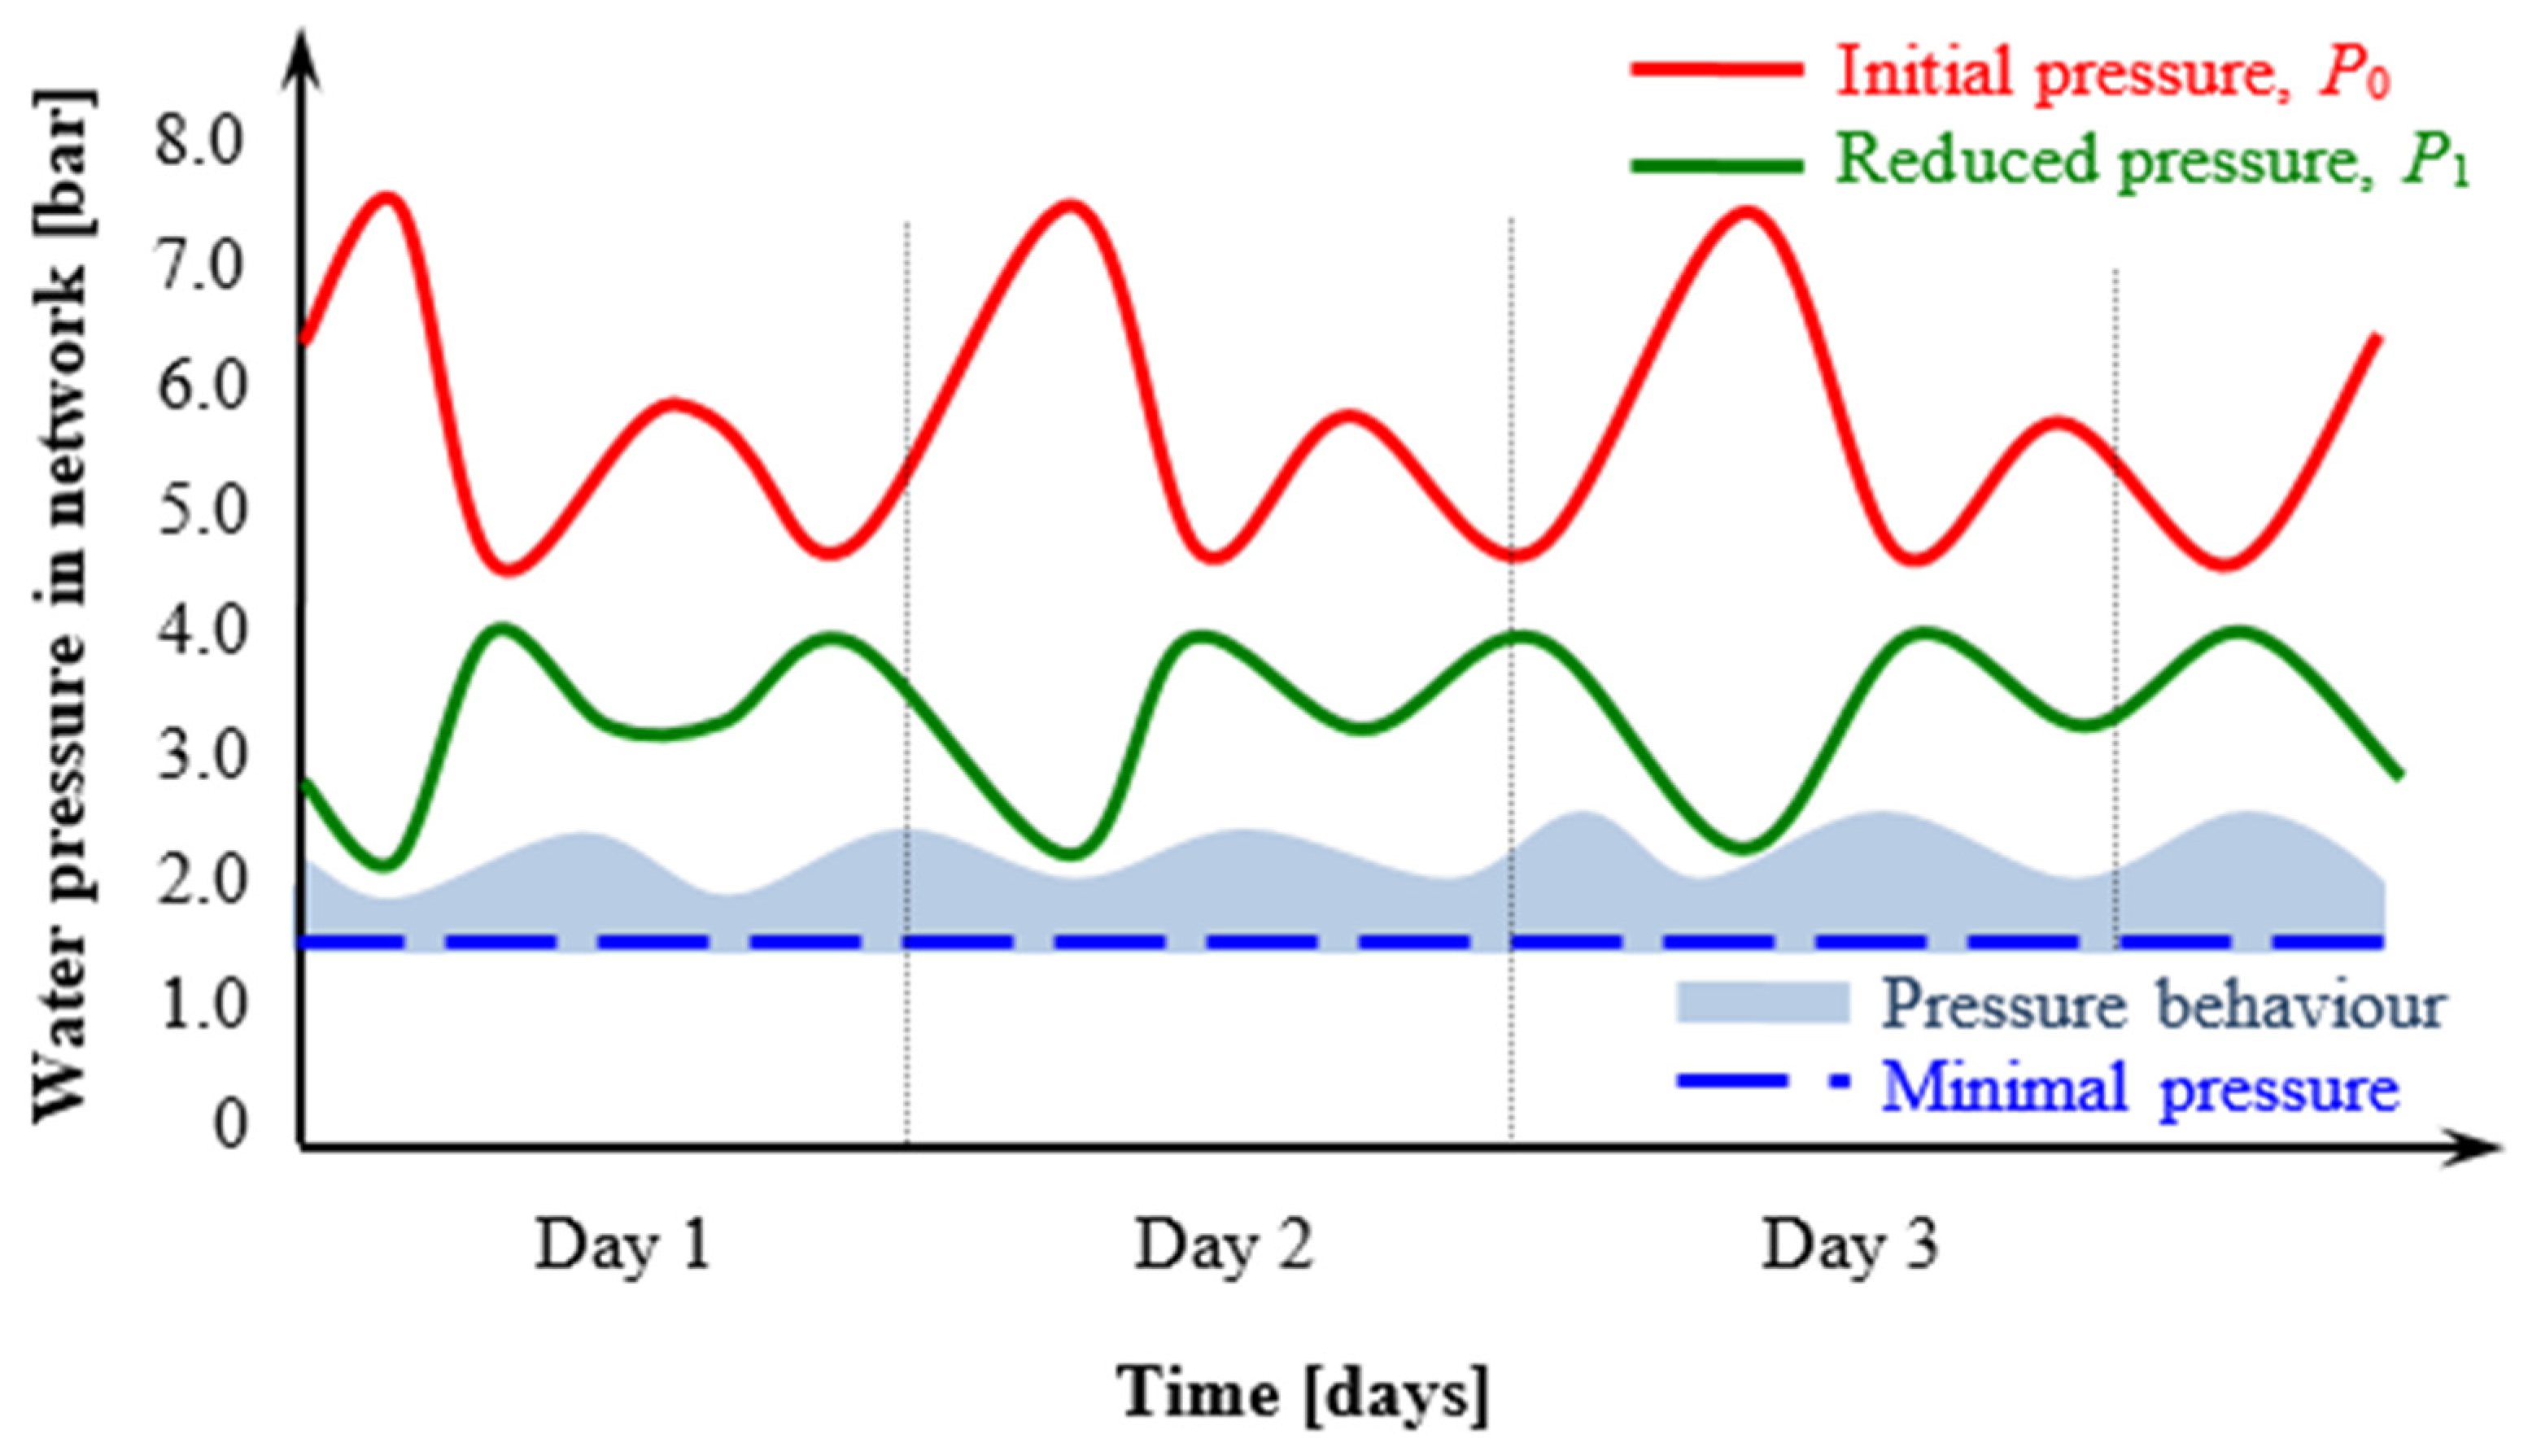
3.3. Managing the Pressure Using PRVs Controlled by Critical Pressure
This is a solution within which the pressure in the network is held at the proper level by a PRV, which is constantly controlled remotely, depending on the pressure at the critical point.
Adjustment is necessary, especially when the unit consumption changes at different time intervals (
Figure 8).
4. A Case Study of the Kosovo Water Utilities Network
Our analysis of Kosovo WUs shows that most companies focus better on water network zoning. However, the zoning network is not combined with pressure regulations. Cases wherein PRVs are applied are those in which the pressure at the outlet of the valve is (again) regulated pressure, which remains unchanged until the valve does not fail.
Therefore, below, we will apply the conclusions from previously analyzed water supply systems wherein the reduction of physical water losses is achieved mainly via pressure management as a good approach for the reduction of non-revenue water, while at the same time opening up the possibility of increasing the length of the water supply network and reducing operation and maintenance costs.
4.1. Pressure Management Program
The following phases should be followed for the completion of a pressure management program that covers the whole network of a water utility.
Feasibility study: this is the basis for defining the exact scope of work that needs to be carried out.
The initial network study includes reviewing all available information regarding the network, GIS, and related data on preliminary zoning.
Pressure management zoning of the network involves dividing the network into zones, which will facilitate further additional study of the network and the completion of real pressure management work. Zoning should be based on information from the WU and additional measures if needed.
Additional pressure and flow measurements involves decision-making according to zoning needs. The WU could carry out measurement work under the close supervision of a consultant. Alternatively, the consultant could perform the measurements with the support of the WU to prepare each measuring place for measurement (through uncovering the pipe, install tapping saddles, and installing a connection that will allow the insertion of a flow meter and pressure sensor).
Data analysis and technical proposal.
Data analysis is carried out on a zone-by-zone basis.
For each separate zone, an analysis will be developed. The technical proposal will provide the solution for optimizing the pressure in the zone, including the sizing of PRVs and a complete installation scheme.
Project design: based on the technical proposal for each zone, this entails a complete project design for the building and installation work, including chambers and equipment.
Procurement of equipment as specified in the project design—this may be included in a separate contract to procure PRVs and all other valves and necessary equipment. Alternatively, this could be part of the whole project.
Civil engineering works, which are the final phase of the project.
Commissioning, and a period of guarantee for the installed equipment.
4.2. Case Study of Pressure Management in the Water Supply Network
Gracanica is a city in central Kosovo, located 10 km east of Pristina, with a population of 4500. The potable water treatment plant (PWTP) Badovc provides the city’s water supply, which takes water from Badovc Lake (also known as Gracanica Lake). The water treatment plant and water sources are located two kilometers above the city, at 705 m. The total length of the water supply network in Gracanica is around 19.00 km consisting of the following pipe materials—asbestos 3.30 km (17.37%); galvanized 13.30 km (70.00%); polyethylene (PE) 2.40 km (12.63%) (
Figure 9).
The pumping station PS New Badovc (42.594642; 21.197129), which takes water directly from the city network and pumps it into Badovc Reservoir (42.582496; 21.214559), is located in Gracanica. This pumping station is used as an auxiliary water supply. It is exploited only during the summer when water consumption in Badovc is higher than the capacity of PS Kisnica (42.599999; 21.215543), the city’s primary water supplier.
4.2.1. Data Collection
Implementing the project, the team performed flow and pressure measurements at different points along the water distribution network of Gracanica [
18,
19],
Figure 9. During the measurements, the following equipment was used:
An insertion electromagnetic flow meter equipped with a data logger for flow and pressure measurement at a predefined period;
Two data loggers for pressure measurement at certain points in predefined periods.
Detailed information in tabular and graphical format about all the measurements performed is available and presented in the following sections.
4.2.2. Flow and Pressure Measurements at the Location before the City Entrance
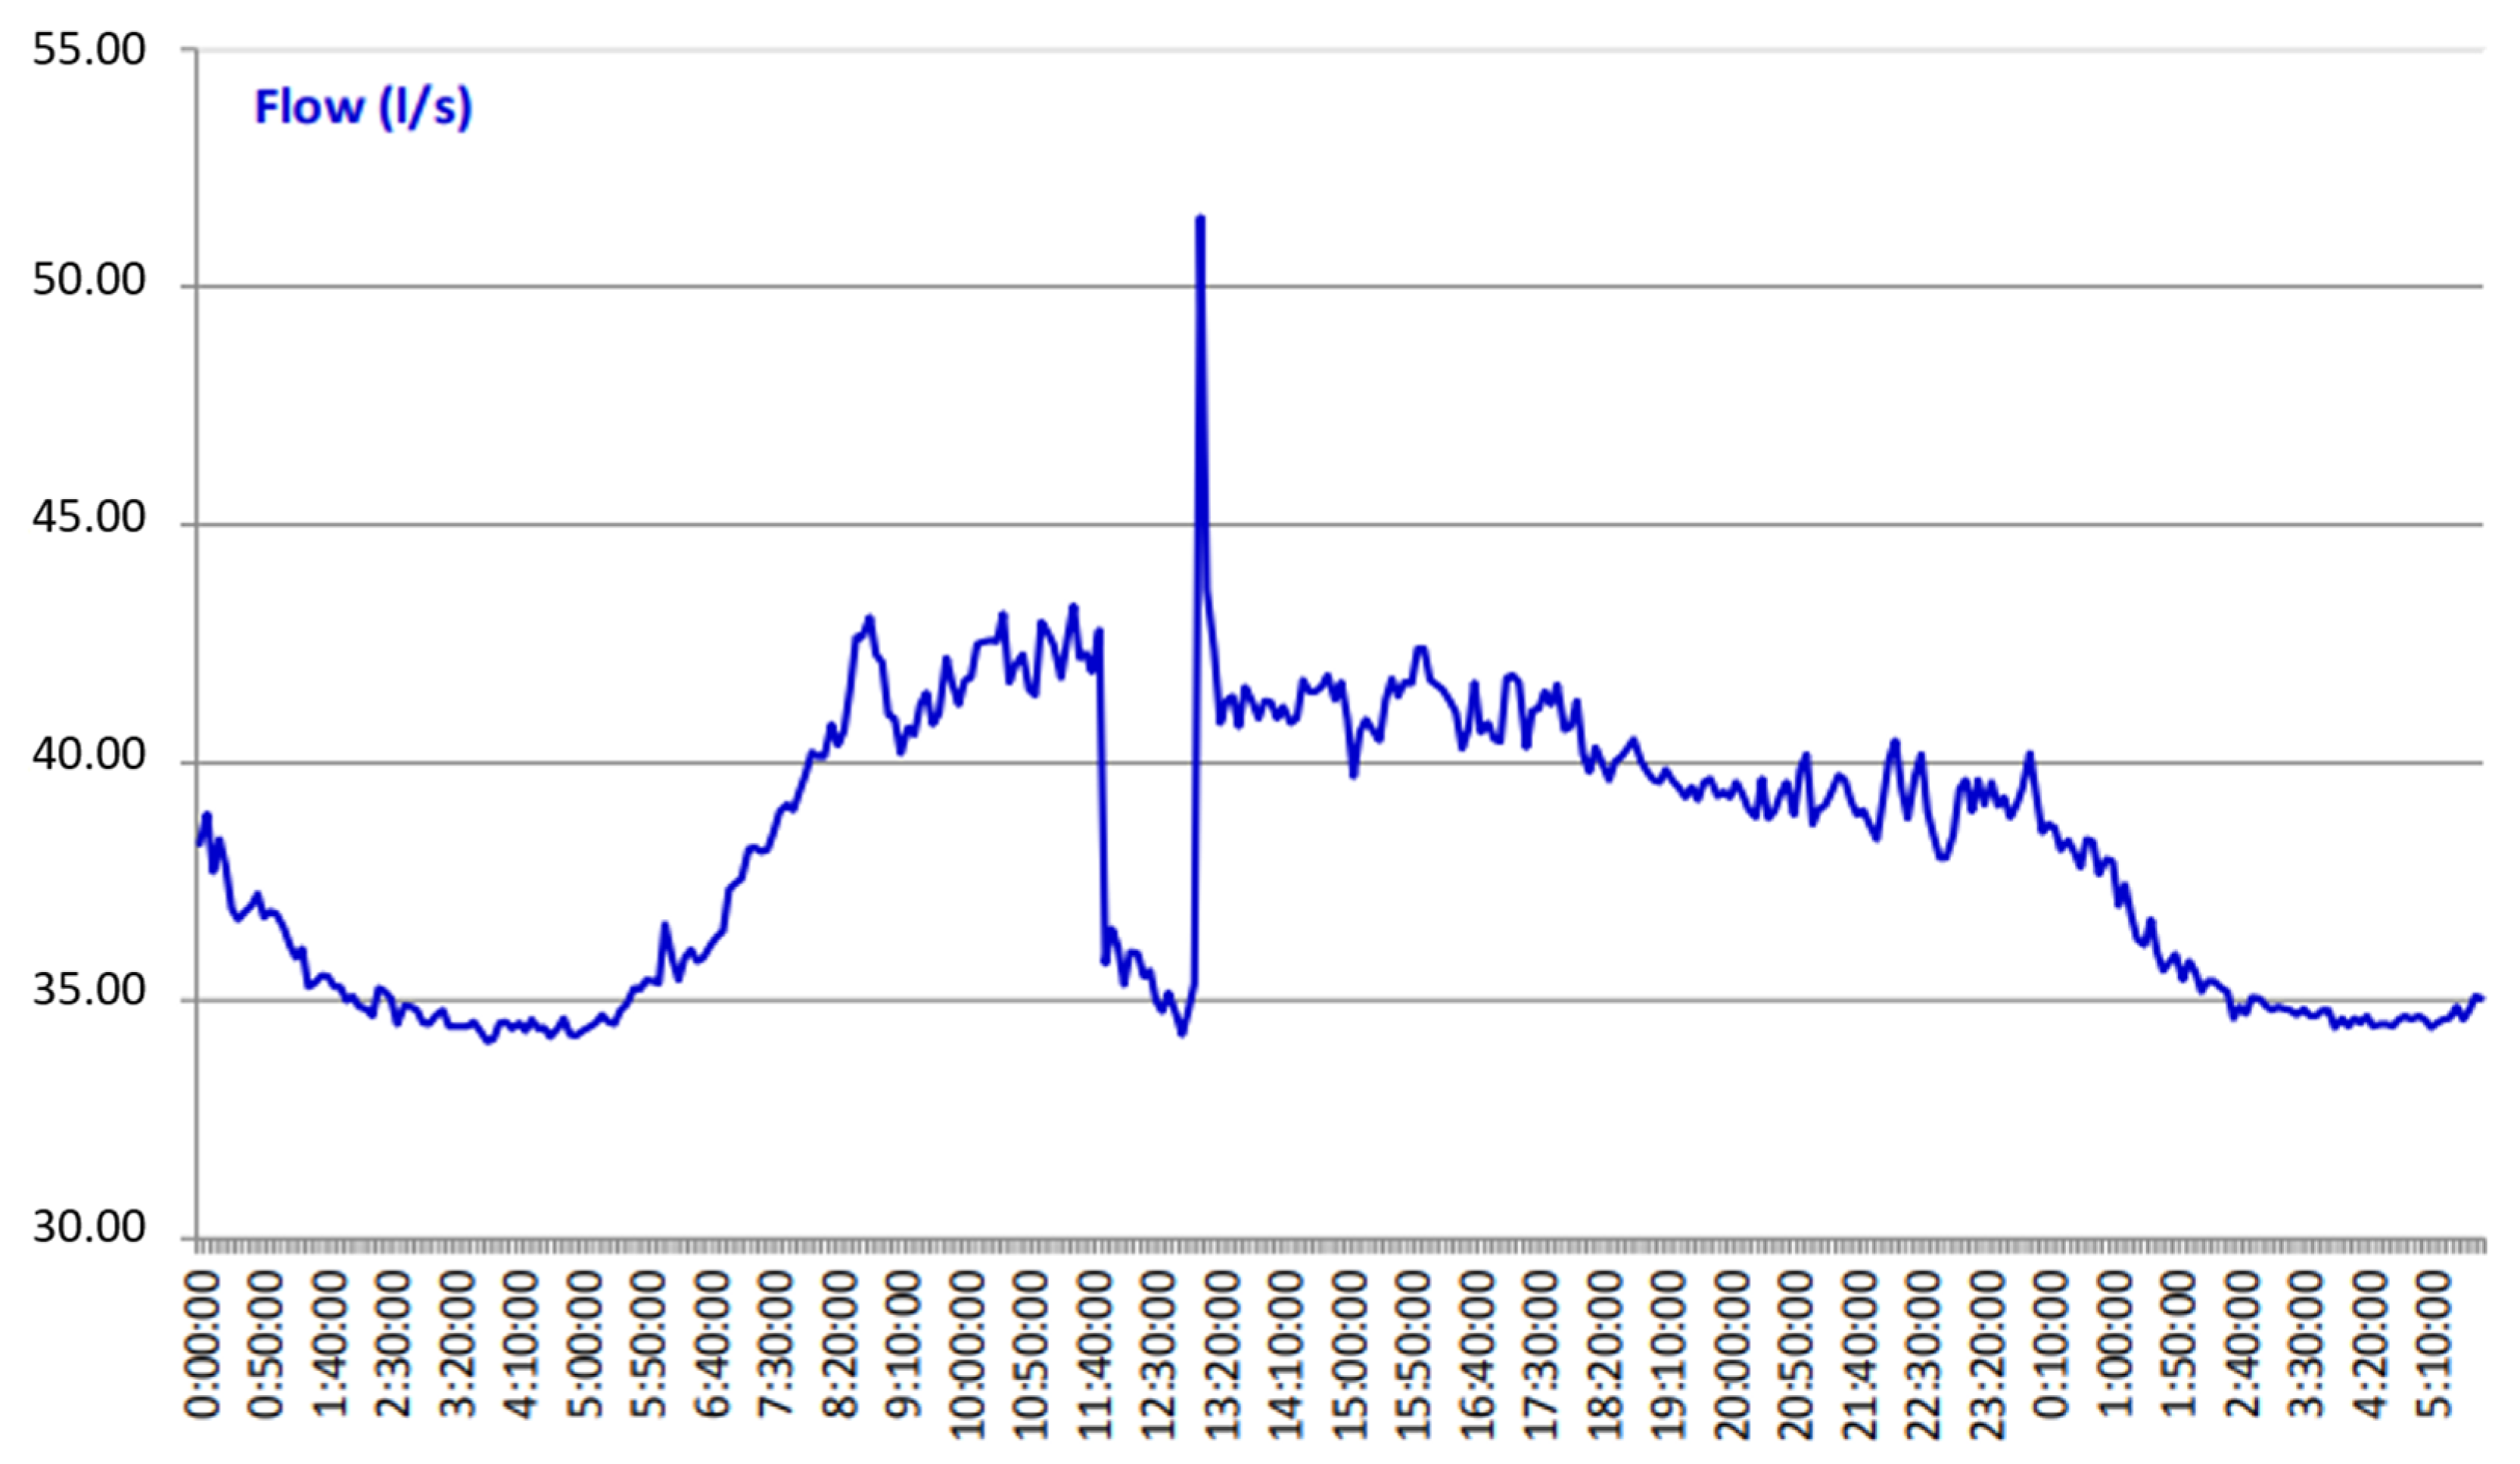
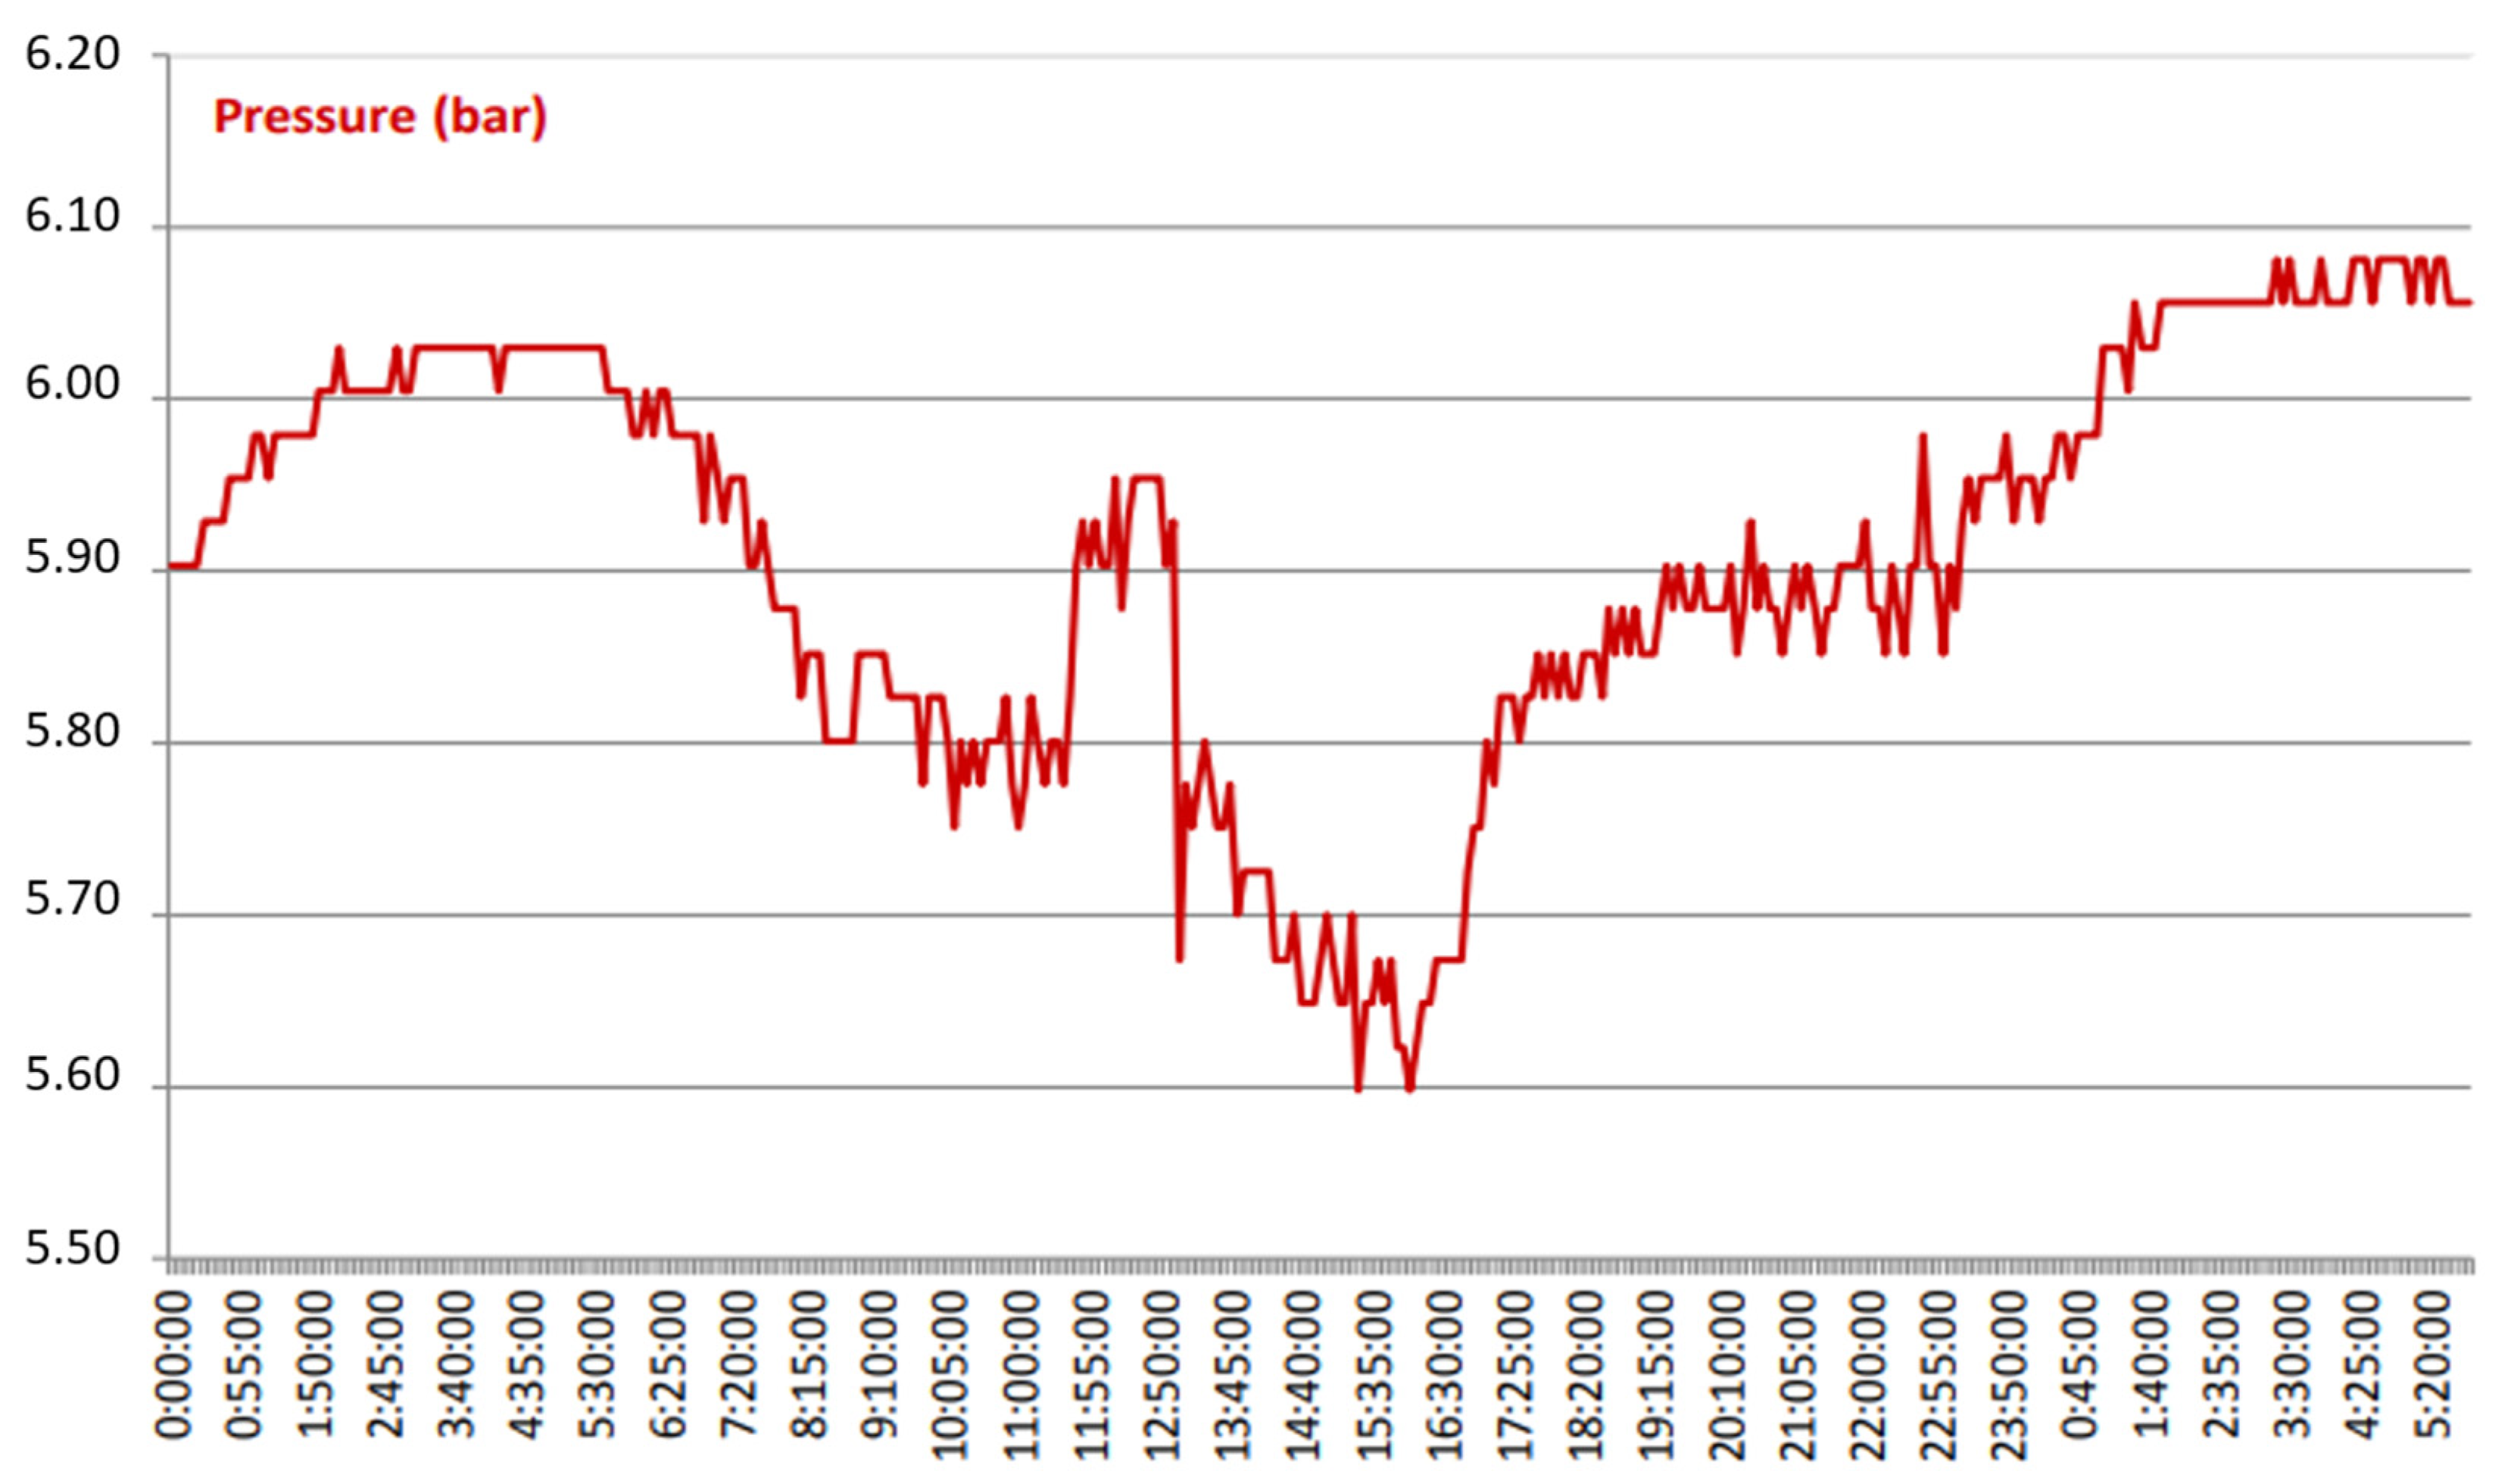
Figure 10 shows flow measurements from 00:00 on 26 November until 5:50 on 27 November at the location before the city entrance. Consumption decreases during the late night. This is when the highest water losses are expected, both in relative relation to the total consumption and in absolute amounts, due to smaller oscillations as a result of reduced consumption and consequently increased pressure in the system.
Figure 11 presents the pressure measurement from 00:00 on 26 November until 5:50 on 27 November at the location before the city entrance. Due to decreased consumption, pressure in the network is significantly increased late at night, which can also lead to a certain increase in the size of water losses in those periods.
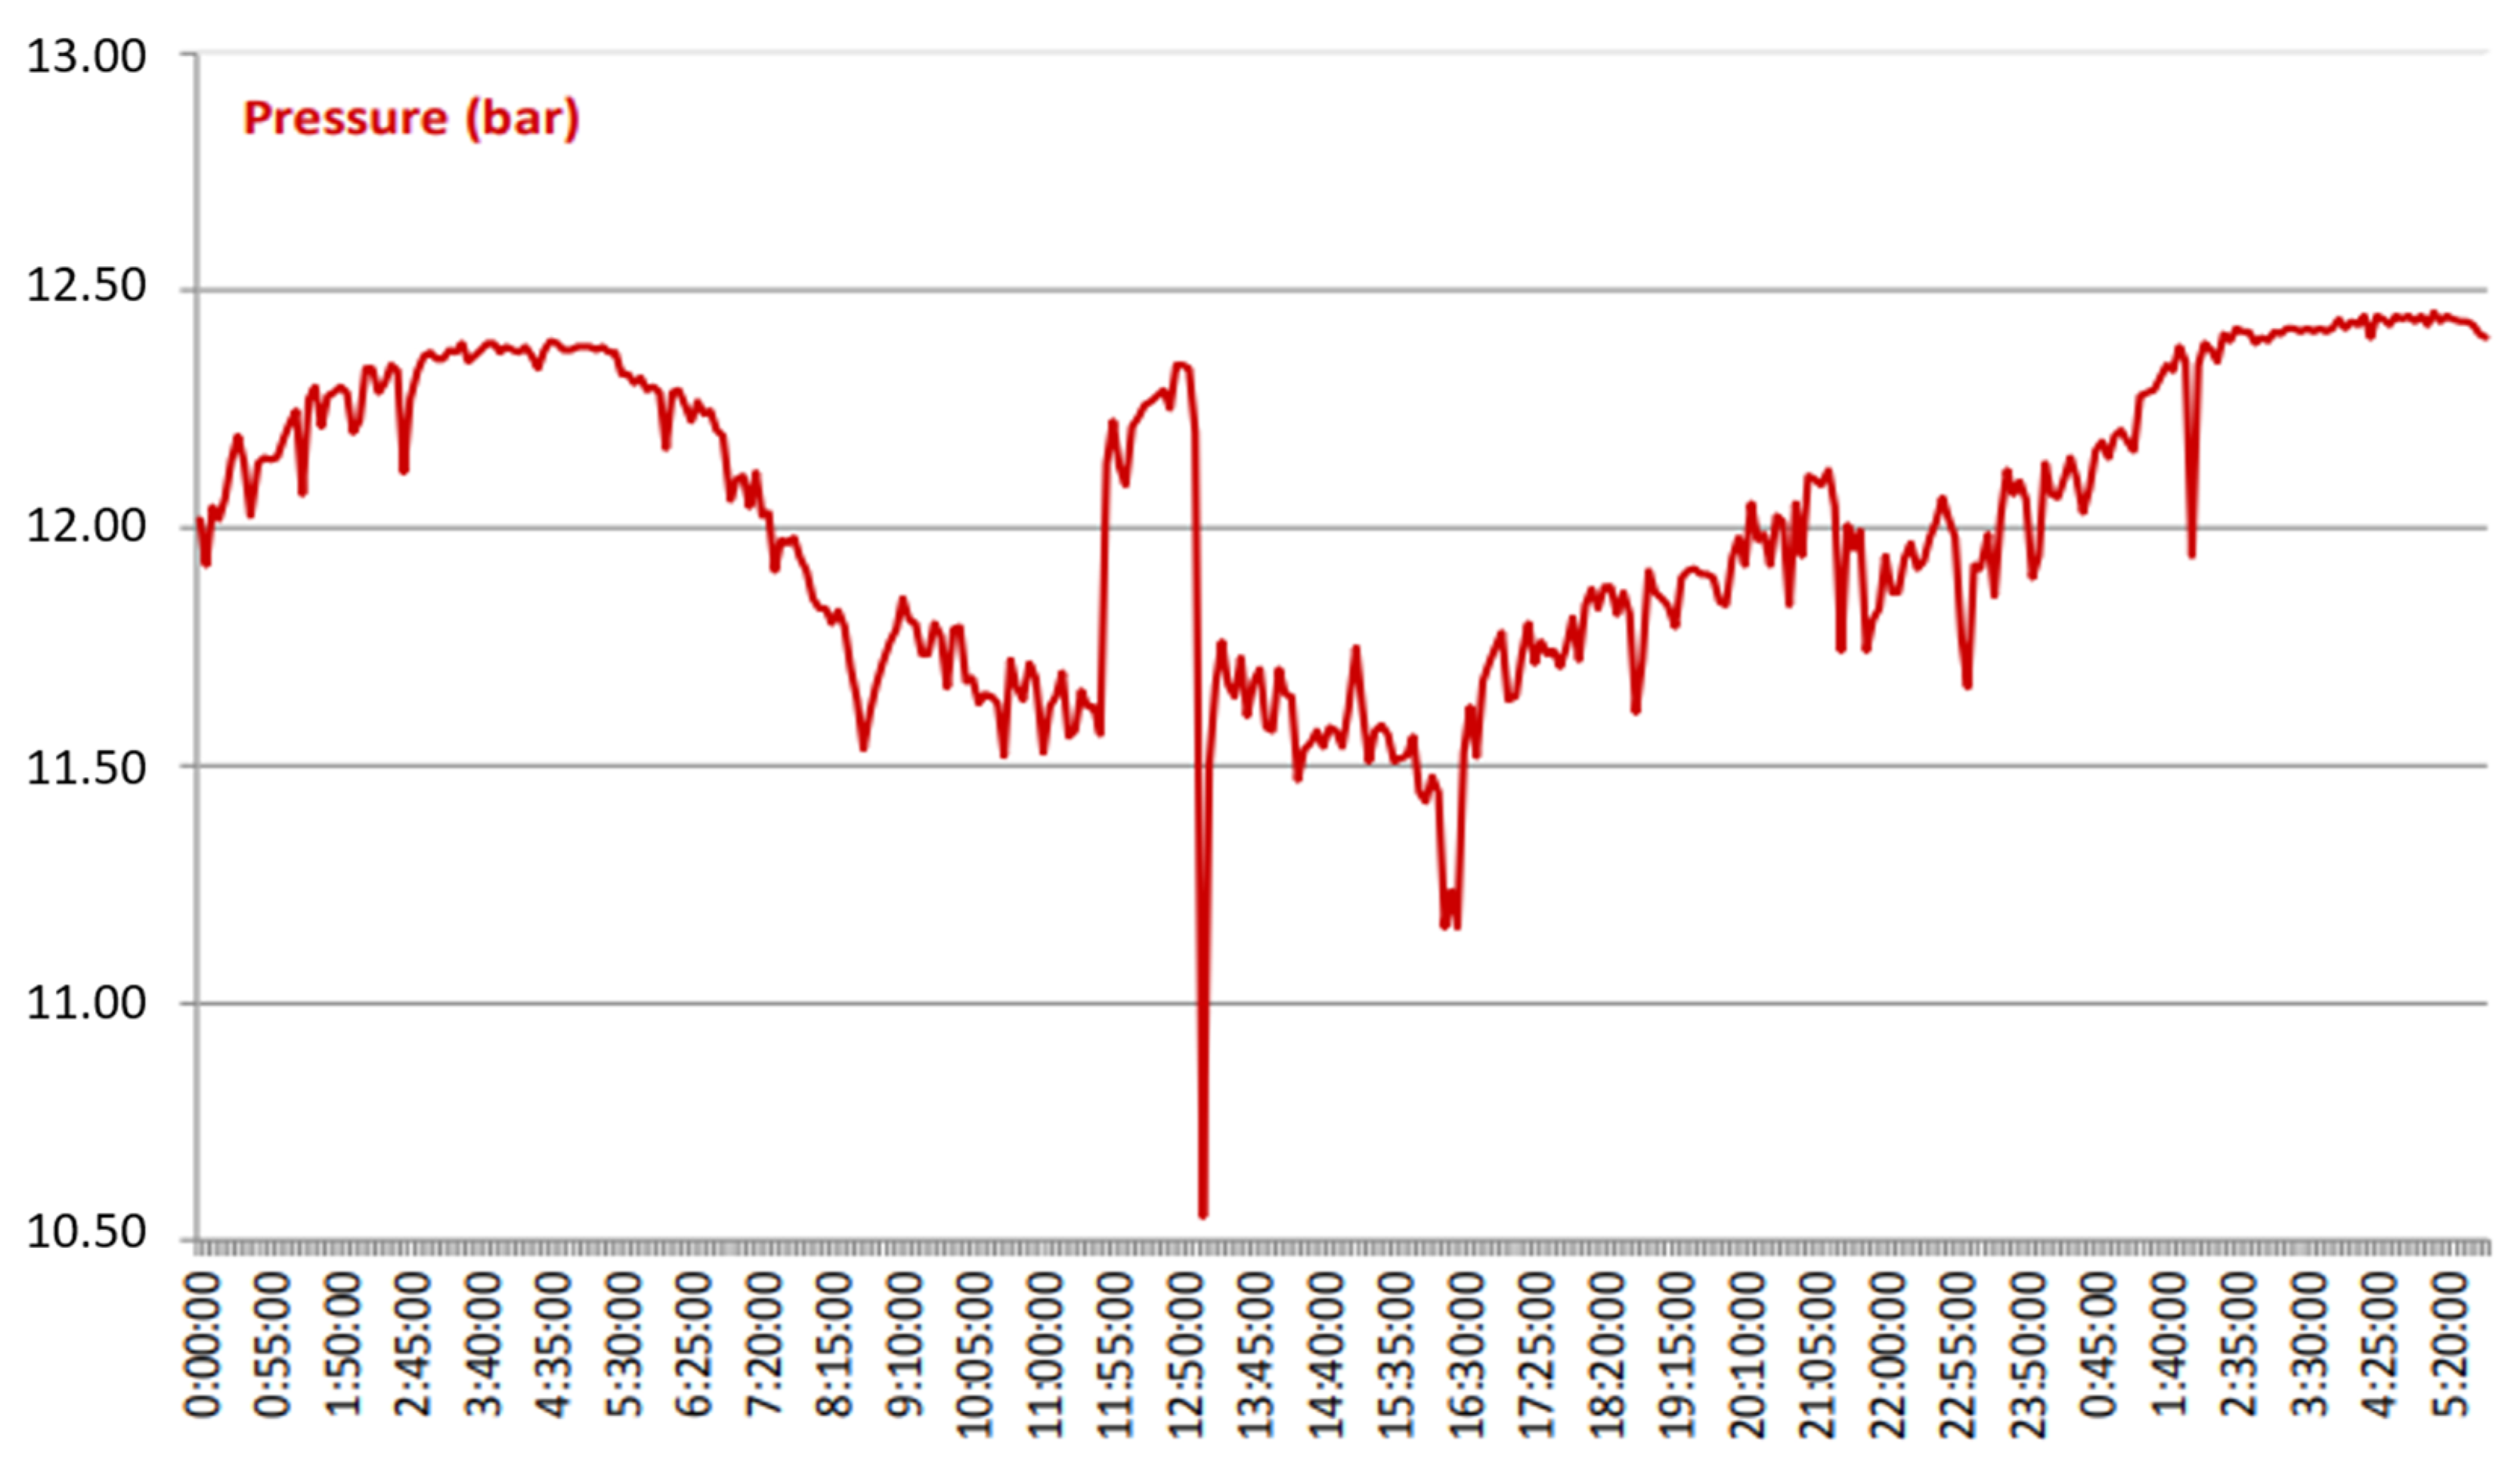
4.2.3. Pressure Measurement at the Lowest Point in the City
Figure 12 shows pressure measurement from 00:00 on 26 November until 5:50 on 27 November at the lowest point in the city. Pressure in the network is increased late at night, as a result of lower water consumption.
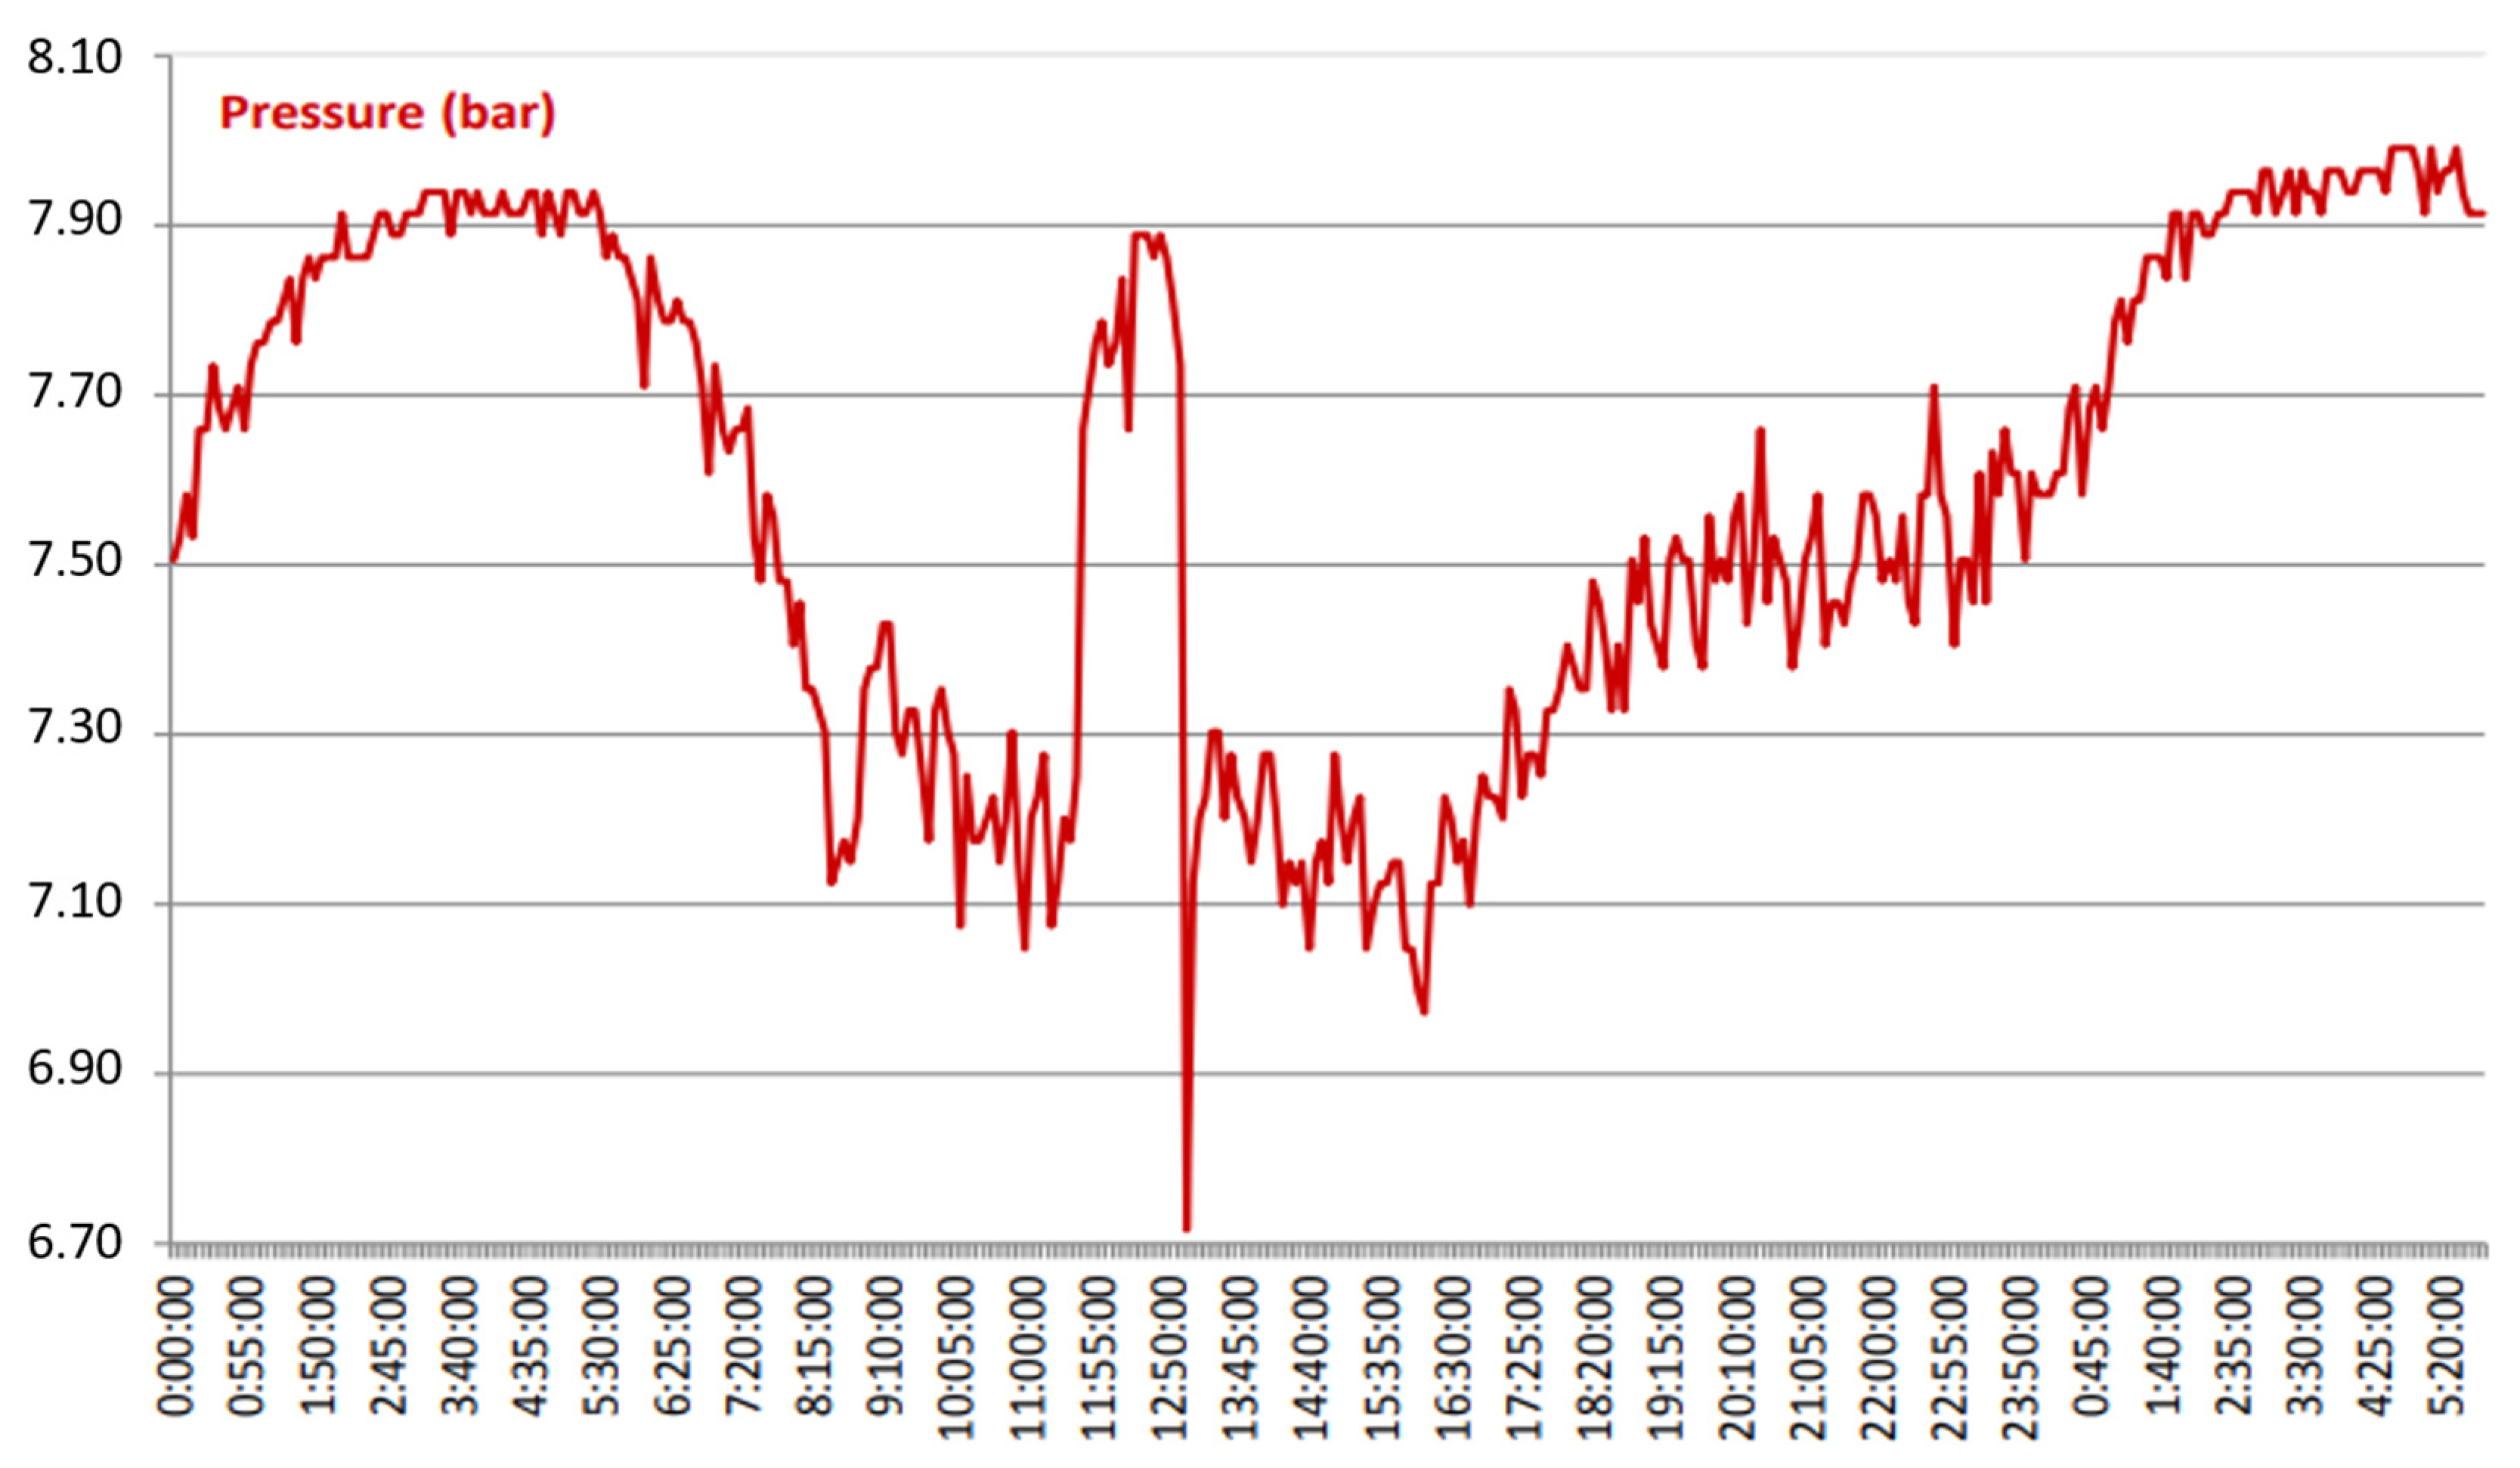
4.2.4. Pressure Measurement at the Suction Pipe of PS New Badovc
Figure 13 shows pressure measurement from 00:00 on 26 November until 5:50 on 27 November at the Suction Pipe of PS New Badovc. Pressure in the network is significantly increased during the late night as a result of lower water consumption.
Pressure measurement was performed at the suction pipe when the pump was running, showing that the pressure in the city network drops when PS New Badovc is in operation.
The registered values for the pressure in those 15 min are between 2.44 [bar] and 2.67 [bar], representing roughly a 4 [bar] pressure drop in the city network.
4.3. Conclusions Based on Measurement Results
4.3.1. Excessive Pressure at the Lowest Point
The measured pressure at the lowest point in Gracanica varies between 10.55 [bar] and 12.45 [bar]. At the same time, the city features low-rise buildings, mostly two and three-floor houses, and the pressure needed for efficient water supply and firefighting is about 2.00 [bar].
The system continuously functions under excessive pressure, even much higher than the maximum allowable pressure for water distribution networks. Excessive pressure in the whole network of Gracanica causes an increased flow rate in existing background leaks and bursts. At the same time, higher pressure directly leads to a shorter service life of assets, increasing the number of new bursts significantly.
In addition, these hydraulic conditions cause problems with customer plumbing and appliances.
4.3.2. High Rate of Physical Water Losses
In the absence of night consumers (examples of which are production facilities with night shifts, big hotels, and hospitals), in Gracanica, during the early hours of the morning (from 00:00 to 05:00), water consumption should be negligible. At the same time, the 24 h profile of flow, which was determined during the measurement campaign, is the opposite.
The minimum flow measured at 03:45 is Qmin = 34.13 [L/s]. The ratio between Qmax = 51.47 [L/s] and Qmin = 34.13 [L/s] is 1.50, and the recommended level for networks with acceptable physical water losses is around 5. Based on the collected flow data, it can be concluded that about 70% of the potable water pumped to Gracanica is lost in the form of physical water losses.
High levels of physical water losses bring direct economic losses due to exploitation costs for water treatment in PWTP Badovc. At the same time, the capacity of PTWP Badovc is not high enough to satisfy the city’s water supply needs, and the city of Gracanica, together with Llapnasello and Preoci, faces restrictions in water supply from 22:00 to 05:00 every night. In conclusion, the level of physical water losses is highly disturbing. Therefore, urgent measures to limit inefficiently used potable water need to be taken.
4.3.3. Reduction of Excessive Pressure
In the current conditions, introducing a pressure management program was selected as the most efficient method for reducing the flow rate of existing background leakages with minimum initial investment. In addition, reduced pressure will significantly reduce burst frequency, making the investment’s benefits even more attractive.
4.3.4. Pressure Management Approach
Steep terrain with a big difference in altitude between the highest and lowest point in the network requires consecutive pressure reduction at different points, following the slope of the terrain to achieve the best results. Taking into account all calculations and drawings, the current project covers the first pressure reduction at the location of the city entrance. Based on all measurements and the data for the terrain, a system with a fixed outlet was chosen. In this approach, the PRV’s outlet is maintained at a chosen minimum level to ensure sufficient water supply and achieve the highest results simultaneously. Initially, the pressure at the city entrance will be reduced from 5.90 [bar] to 2.50 [bar].
4.3.5. Sizing of the Valve
The flow profile established during measurements was used to conclude that the network in Gracanica functions in two regimes. A low-flow regime occurs from 00:00 to 07:55 and from 11:50 to 13:00, when the flow is lower than 40 [L/s] and varies in the range 34.13 [L/s]–39.77 [L/s] with Qaverage = 35.76 [L/s]. A high-flow regime occurs from 08:00 to 11:45 and from 13:05 to 23:50, when the flow is over 40 [L/s] and varies in the range 40.13 [L/s]–51.46 [L/s] with Qaverage = 41.26 [L/s].
Sizing in low-flow-regime conditions is presented in
Table 1, and that in high-flow-regime conditions is shown in
Table 2.
Based on all performed calculations and simulating all possible flow conditions, it was proven that a PRV DN150 would meet the current need for pressure reduction at the entrance of Gracanica.
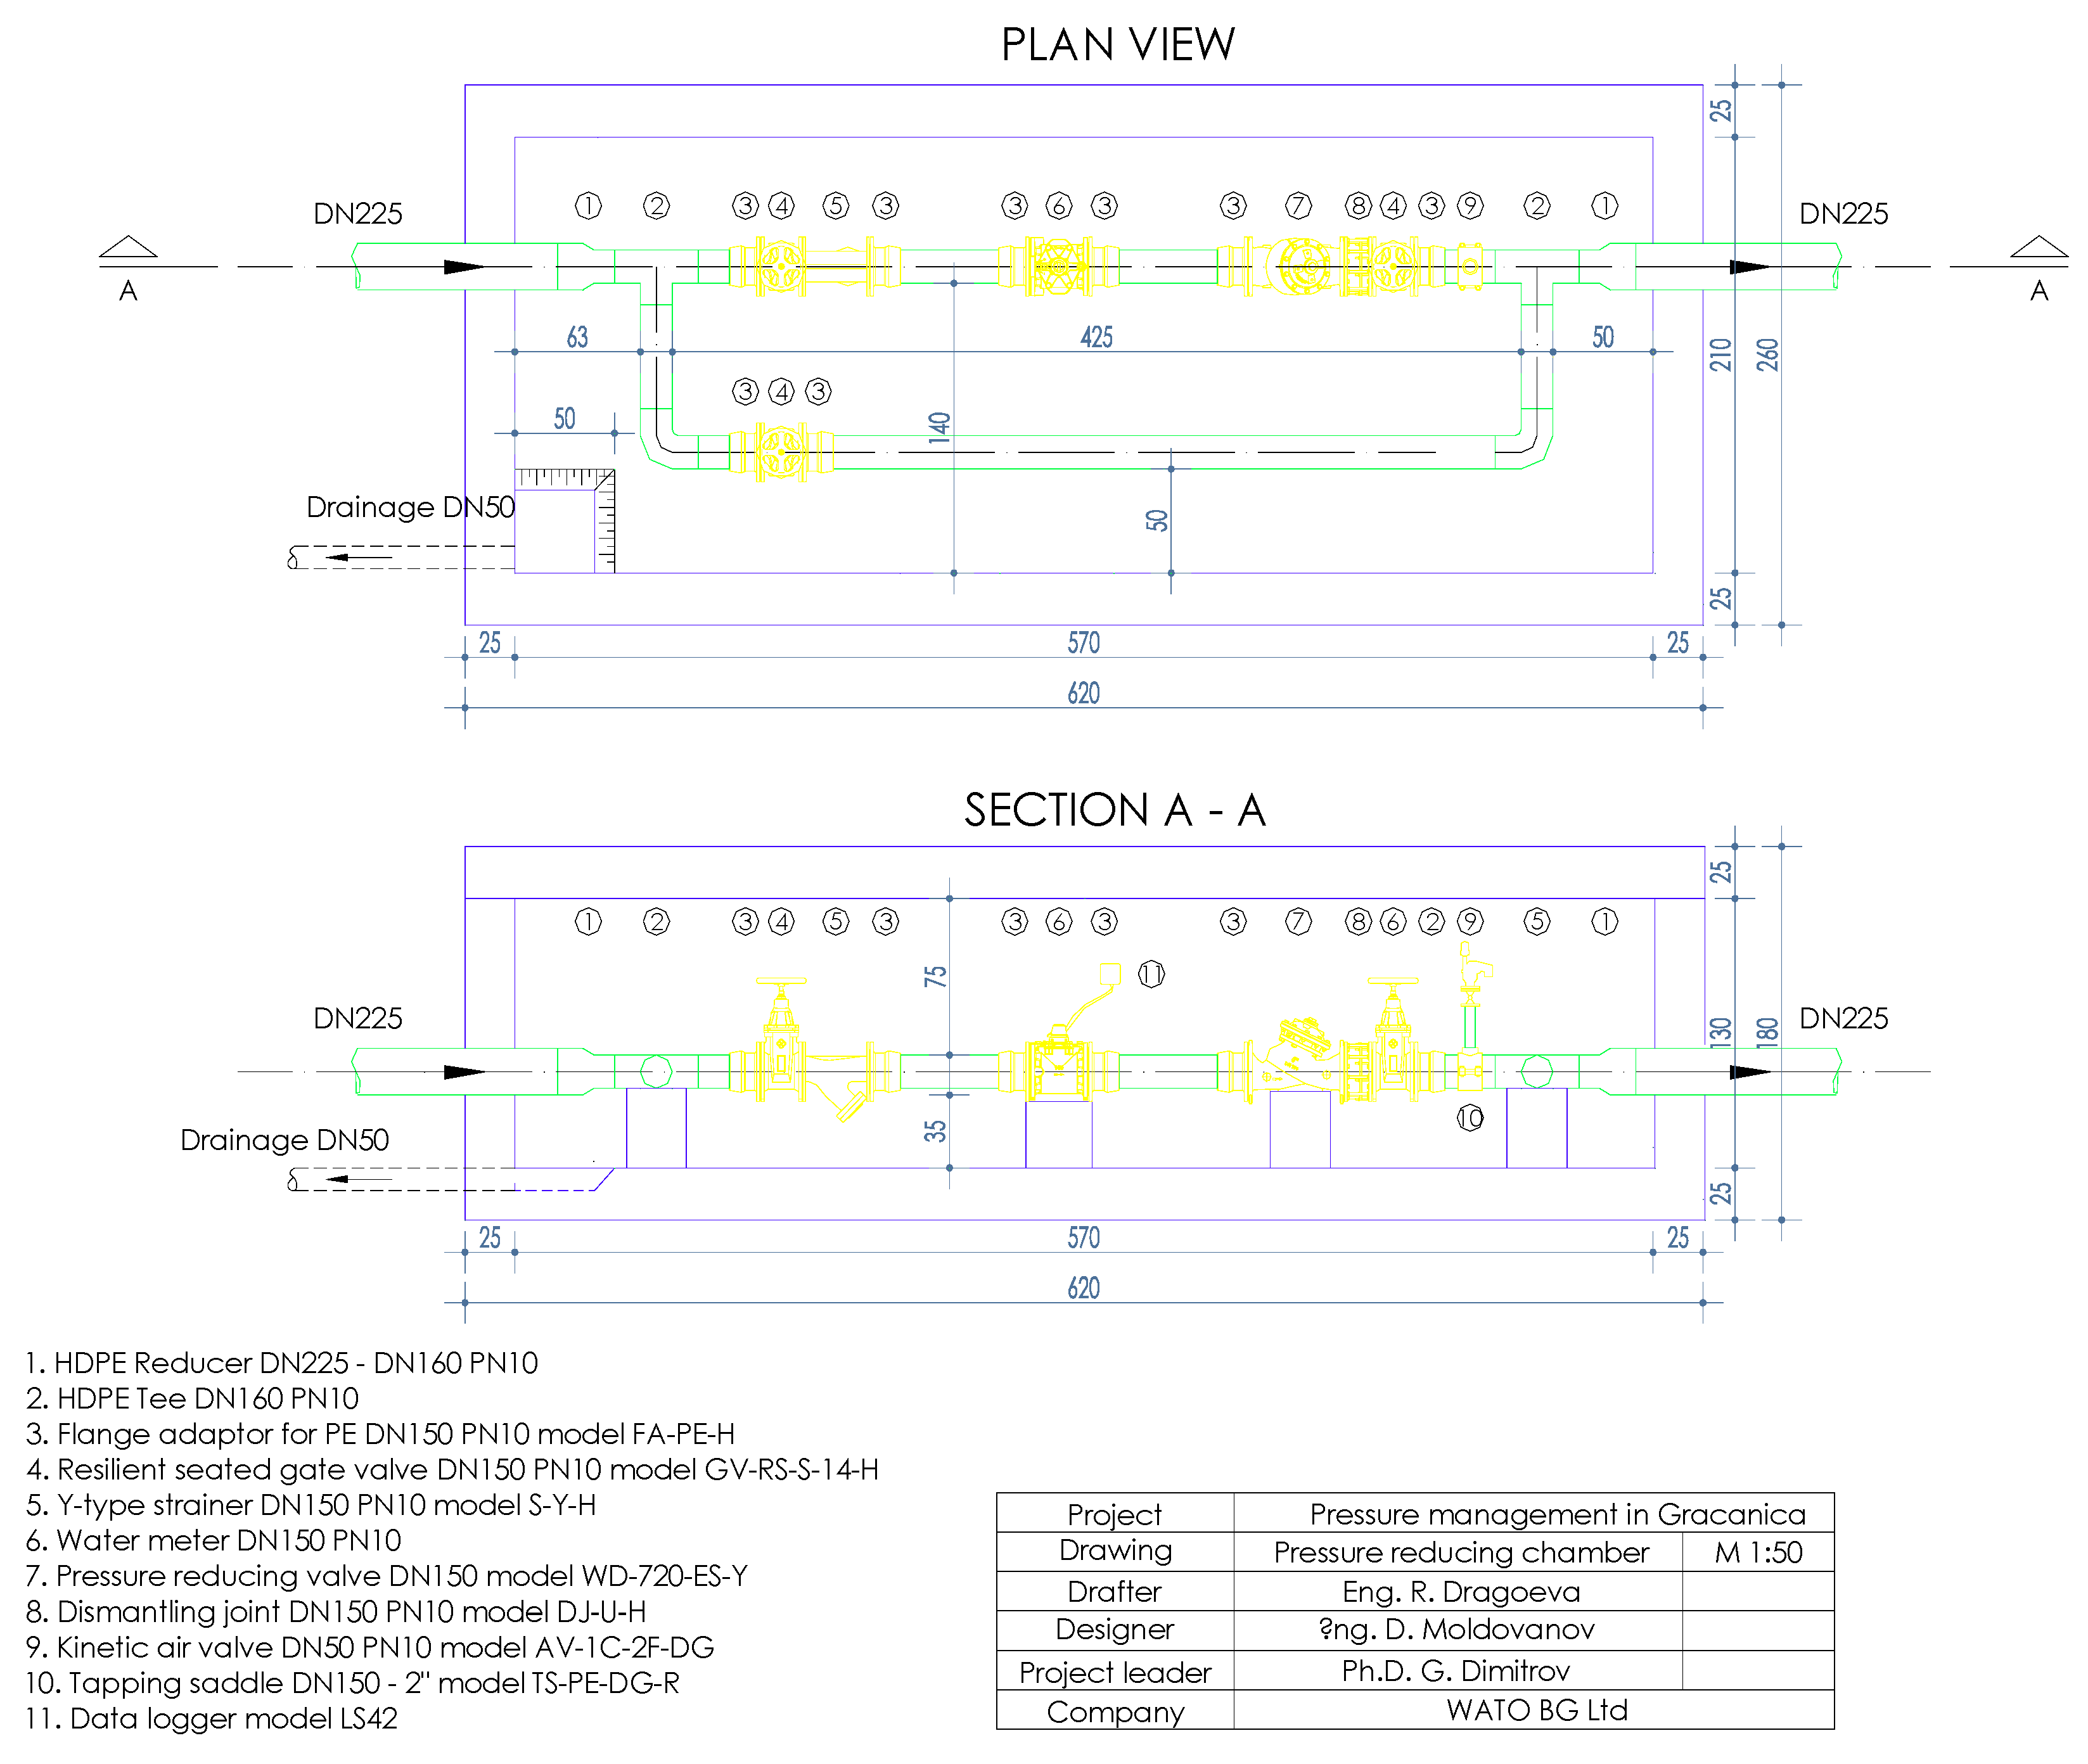
4.4. Design of the Installation
Based on the calculations performed for the research project, we chose a PRV DN150 with a Y-type body. The valve features a specific design, with the body and seat against cavitation; after PRV is provided, isolation-resilient seated gate valves are installed to ensure easy maintenance. after the reducing valve has been designed for the installation of a kinetic air valve, in order to protect the system from water column separation and vacuuming. Before PRV, a strainer and water meter are provided for installation. The water meter features a pulse output and is equipped with a data logger for the district monitoring of flow and pressure at the regulation point. Before subject PRV, the project design involves the construction of a bypass that will guarantee continuous water supply in case of valve maintenance. A detailed drawing of the installation scheme is shown in
Figure 14.
4.5. Expected Results of Pressure Management
4.5.1. Reduction in Physical Water Losses
Average zone pressure has a significant influence on leakage flow rate. After the substitution of measurement results values and other parameters in Equation (1), the following results presented in
Table 3 are obtained.
Physically, N1 can be calculated both from a step-test in the zone at night or from values delivered from different studies around the world that show that N1 usually varies between 0.50 and 1.50, with occasional values up to 2.50. For zones with mixed pipe materials wherein no specific evidence exists, as is the case for the explored system, a linear relationship (N1 = 1.00) is usually assumed.
Based on the calculations carried out, in case of reduction in pressure at the city entrance from 5.90 bar to 2.50 [bar], water losses will be reduced by an average of 640 [m3/day] (460 m3/day in case of a regime occurring in the water supply network from 22:00 to 05:00). Taking into consideration the regime operating in water supply in Gracanica from 22:00 to 05:00, saved water could be used for ensuring continuous water supply.
4.5.2. Reduction in Burst Frequency
The second correlation that can be found is between the system pressure and the burst frequency. After the substitution of the measurement results and other parameters in Equation (3), the following results presented in
Table 4 are obtained.
According to the calculation presented in
Table 4, in case of a reduction in pressure at the city entrance from 5.90 to 2.50 [bar], the burst frequency will be reduced by more than half burst.
4.6. Investment Return Time
The investment return period of the proposed pressure management measures in Gracanica is calculated based on expected savings, mainly from a reduction in water losses and resulting savings on PWTP Badovc and burst frequency.
4.6.1. Approximate Annual Savings after the Implementation of a Pressure Management Program
Savings on Reducing Water Losses
According to information from [
1], the current production and operation cost for 1 [m
3] of water in PWTP Badovc is 0.453 EUR. Based on the calculations performed, one of the expected results after the reduction of pressure along distribution network is a saving of 640 [m
3] of potable water delivered from PWTP Badovc (460 m
3/day in case of a regime in water supply occurring from 22:00 to 05:00). Converted to direct savings on the production costs of PWTP Badovc, this is around EUR 289.00 per day, or about EUR 105,485.00 per year.
Savings Due to Burst Frequency Reduction
According to information from WU of Pristina, the current cost for repairing an average burst is EUR 250. Based on the burst repaired in 2019, the annual cost is EUR 196 × 250 = EUR 49,000. At the same time, based on the calculation performed, the expected reduction in the annual number of bursts after pressure reduction along the distribution network is from 196 to 88. Converted into direct savings made from fewer required repairs, this makes EUR 27,000 per year.
4.6.2. Cost of Implementation of the Proposed Pressure Management Measures
According to the project design, the approximate cost of constructing a chamber and delivering and commissioning all provided valves, fittings, and measuring equipment will be about 15,000 EUR.
All calculations show that the expected annual savings after implementing the proposed pressure management measures, resulting from reducing potable water losses and burst frequency, will be EUR 132,485.00. At the same time, the investment cost is expected to be about EUR 15,000, which makes the investment return period less than 2 months.
5. Conclusions
The paper elaborates on different approaches that require small investments and give concrete and fast results in reducing technical and commercial water losses so that Kosovo’s water utilities can operate more efficiently. Efficient use of water resources and thus reducing water losses is a critical step in increasing the overall sustainability of public water supply management.
The chosen approach to managing large consumers, starting from profiling of water consumption, frequent calibration of water meters, installation of water measures with high precision, adequate sizing, and reading of measured data using mobile equipment or online, has a direct impact on improving the commercial efficiency that contributes to reducing non-revenue water.
Managing pressure is one of the best ways to reduce physical water losses while at the same time significantly increasing the network’s service life and reducing maintenance costs. Dynamic pressure management, which considers critical pressure at defined points as well as the implementation of pressure-reducing valves, changes the pressure, resulting in improved hydraulic drive flow conditions, offering end users a better (safer and more cost-effective) service. Reducing water losses through quick and cost-effective solutions like installing pressure-reducing valves has multiple sustainability benefits, both for the environment and water utilities; water conservation and energy savings lead to direct environmental benefits, cost efficiency, and the extended lifespan of infrastructure. Importantly, they also offer resilience in the face of climate change. Based on the demonstrated example of the city of Gracanica, it is evident that in installing only one pressure reduction valve, with a minimum investment of about EUR 15,000, it is possible to achieve annual savings of EUR 132.485, which means a return on the investment in less than 2 months.
Kosovo water utilities have not engendered any progress in reducing non-revenue water yet, and it is urgent to start thinking about this problem and implementing the discussed approaches.
Author Contributions
Conceptualization, S.L. and B.Ð.; methodology, S.L. and G.V.; software, S.L.; validation, S.L., B.Ð., G.V. and D.N.; formal analysis, S.L.; investigation, B.Ð.; resources, S.L. and D.N.; data curation, B.Ð. and D.N.; writing—original draft preparation, S.L. and G.V.; writing—review and editing, B.Ð. and D.N.; visualization, S.L. and B.Ð.; supervision, S.L.; project administration, B.Ð. and D.N.; funding acquisition, B.Ð. All authors have read and agreed to the published version of the manuscript.
Funding
This research received no external funding.
Institutional Review Board Statement
Not applicable.
Informed Consent Statement
Not applicable.
Data Availability Statement
All data available upon reasonable request from the corresponding authors.
Acknowledgments
The first author of this work is very thankful to IAWD (Viena), Valu Add (Tirana), and especially the experts from Bulgaria, Radoslav Russov and Dimitar Ivanov, for implementing the program for improving the commercial efficiency of five water companies in Kosovo.
Conflicts of Interest
The authors declare no conflict of interest.
References
- Annual Performance Report for Water Service Providers in Kosovo 2021, August 2022, Water Service Regulatory Authority. Available online: http://www.arru-rks.org/en/publikimet/414/raportet-e-performances/414 (accessed on 9 September 2023).
- Perrone, D.; Murphy, J.; Hornberger, G.M. Gaining Perspective on the Water−Energy Nexus at the Community Scale. Environ. Sci. Technol. 2011, 45, 4228–4234. [Google Scholar] [CrossRef] [PubMed]
- Feldman, M. Aspects of energy efficiency in water supply systems. In Proceedings of the 5th IWA Water Loss Reduction Specialist Conference 2009, Cape Town, South Africa, 26–30 April 2009. [Google Scholar]
- Margeta, J. Vodoopskrba Naselja: Planiranje, Projektiranje, Upravljanje, Obradavode, 1st ed.; Građevinsko-Arhitektonski Fakultet: Split, Hrvatska, 2010. [Google Scholar]
- Nazif, S.; Karamouz, M.; Tabesh, M.; Moridi, A. Pressure Management Model for Urban Water Distribution Networks. Water Resour. Manag. 2009, 24, 437–458. [Google Scholar] [CrossRef]
- Allianze to Save Energy. WATERGY: Energy and Water Efficiency in Municipal Water Supply and Wastewater Treatment, Cost-Effective Savings of Water and Energy; The Alliance to Save Energy: Washington, DC, USA, 2007. [Google Scholar]
- Coelho, B.; Andrade-Campos, A. Efficiency achievement in water supply systems—A review. Renew. Sustain. Energy Rev. 2014, 30, 59–84. [Google Scholar] [CrossRef]
- Vilanova, M.R.N.; Balestieri, J.A.P. Energy and hydraulic efficiency in conventional water supply systems. Renew. Sustain. Energy Rev. 2014, 30, 701–714. [Google Scholar] [CrossRef]
- Taha, A.W.; Sharma, S.; Lupoja, R.; Fadhl, A.N.; Haidera, M.; Kennedy, M. Assessment of water losses in distribution networks: Methods, applications, uncertainties, and implications in intermittent supply. Resour. Conserv. Recycl. 2020, 152, 104515. [Google Scholar]
- Zimoch, I.; Bartkiewicz, E.; Machnik-Slomka, J.; Klosok-Bazan, I.; Rak, A.; Rusek, S. Sustainable Water Supply Systems Management for Energy Efficiency: A Case Study. Energies 2021, 14, 5101. [Google Scholar] [CrossRef]
- Ayad, A.; Khalifa, A.; El Fawy, M.; Moawad, A. An integrated approach for non-revenue water reduction in water distribution networks based on field activities, optimisation, and GIS applications. Ain Shams Eng. J. 2021, 12, 3509–3520. [Google Scholar] [CrossRef]
- Ramos, H.M.; Morani, M.C.; Carravetta, A.; Fecarrotta, O.; Adeyeye, K.; López-Jiménez, P.A.; Pérez-Sánchez, M. New Challenges towards Smart Systems’ Efficiency by Digital Twin in Water Distribution Networks. Water 2022, 14, 1304. [Google Scholar] [CrossRef]
- Sousa-Zomer, T.T.; Miguel, P.A.C. Sustainable business models as an innovation strategy in the water sector: An empirical investigation of a sustainable product-service system. J. Clean. Prod. 2018, 171, S119–S129. [Google Scholar] [CrossRef]
- Farouk, A.M.; Rahman, R.A.; Romali, N.S. Non-revenue water reduction strategies: A systematic review. Smart Sustain. Built Environ. 2021, 12, 181–199. [Google Scholar] [CrossRef]
- Macias Avila, C.A.; Sanchez-Romero, F.-J.; Lopez-Jimenez, P.A.; Perez-Sanchez, M. Improve leakage management to reach sustainable water supply networks through by green energy systems. Optimized case study. Sustain. Cities Soc. 2022, 83, 103994. [Google Scholar] [CrossRef]
- Charalambous, B.; Foufeas, D.; Petroulias, N. Leak detection and water loss management. Water Util. J. 2014, 8, 25–30. [Google Scholar]
- Constantin, A.; Andrei, M.I. Water Loss in Urban Distribution Networks. Hydraulic simulation and experimental calibration. In Proceedings of the 15th International Multidisciplinary Scientific Geoconference SGEM 2015, Albena Resort, Bulgaria, 16–25 June 2015; Book 3. Volume 1, pp. 755–762. [Google Scholar]
- Levels Fantozzi, M.; Lambert, A. Including the Effects of Pressure Management in Calculations of Short-Run Economic Leakage. Available online: http://www.miya-water.com (accessed on 8 September 2023).
- Available online: https://www.wato.bg/pressure-management-9/ (accessed on 10 September 2023).
| Disclaimer/Publisher’s Note: The statements, opinions and data contained in all publications are solely those of the individual author(s) and contributor(s) and not of MDPI and/or the editor(s). MDPI and/or the editor(s) disclaim responsibility for any injury to people or property resulting from any ideas, methods, instructions or products referred to in the content. |
© 2023 by the authors. Licensee MDPI, Basel, Switzerland. This article is an open access article distributed under the terms and conditions of the Creative Commons Attribution (CC BY) license (https://creativecommons.org/licenses/by/4.0/).


