
Evaluation of Flooding Disaster Risks for Subway Stations Based on the PSR Cloud Model


Abstract
:1. Introduction
2. Literature Review
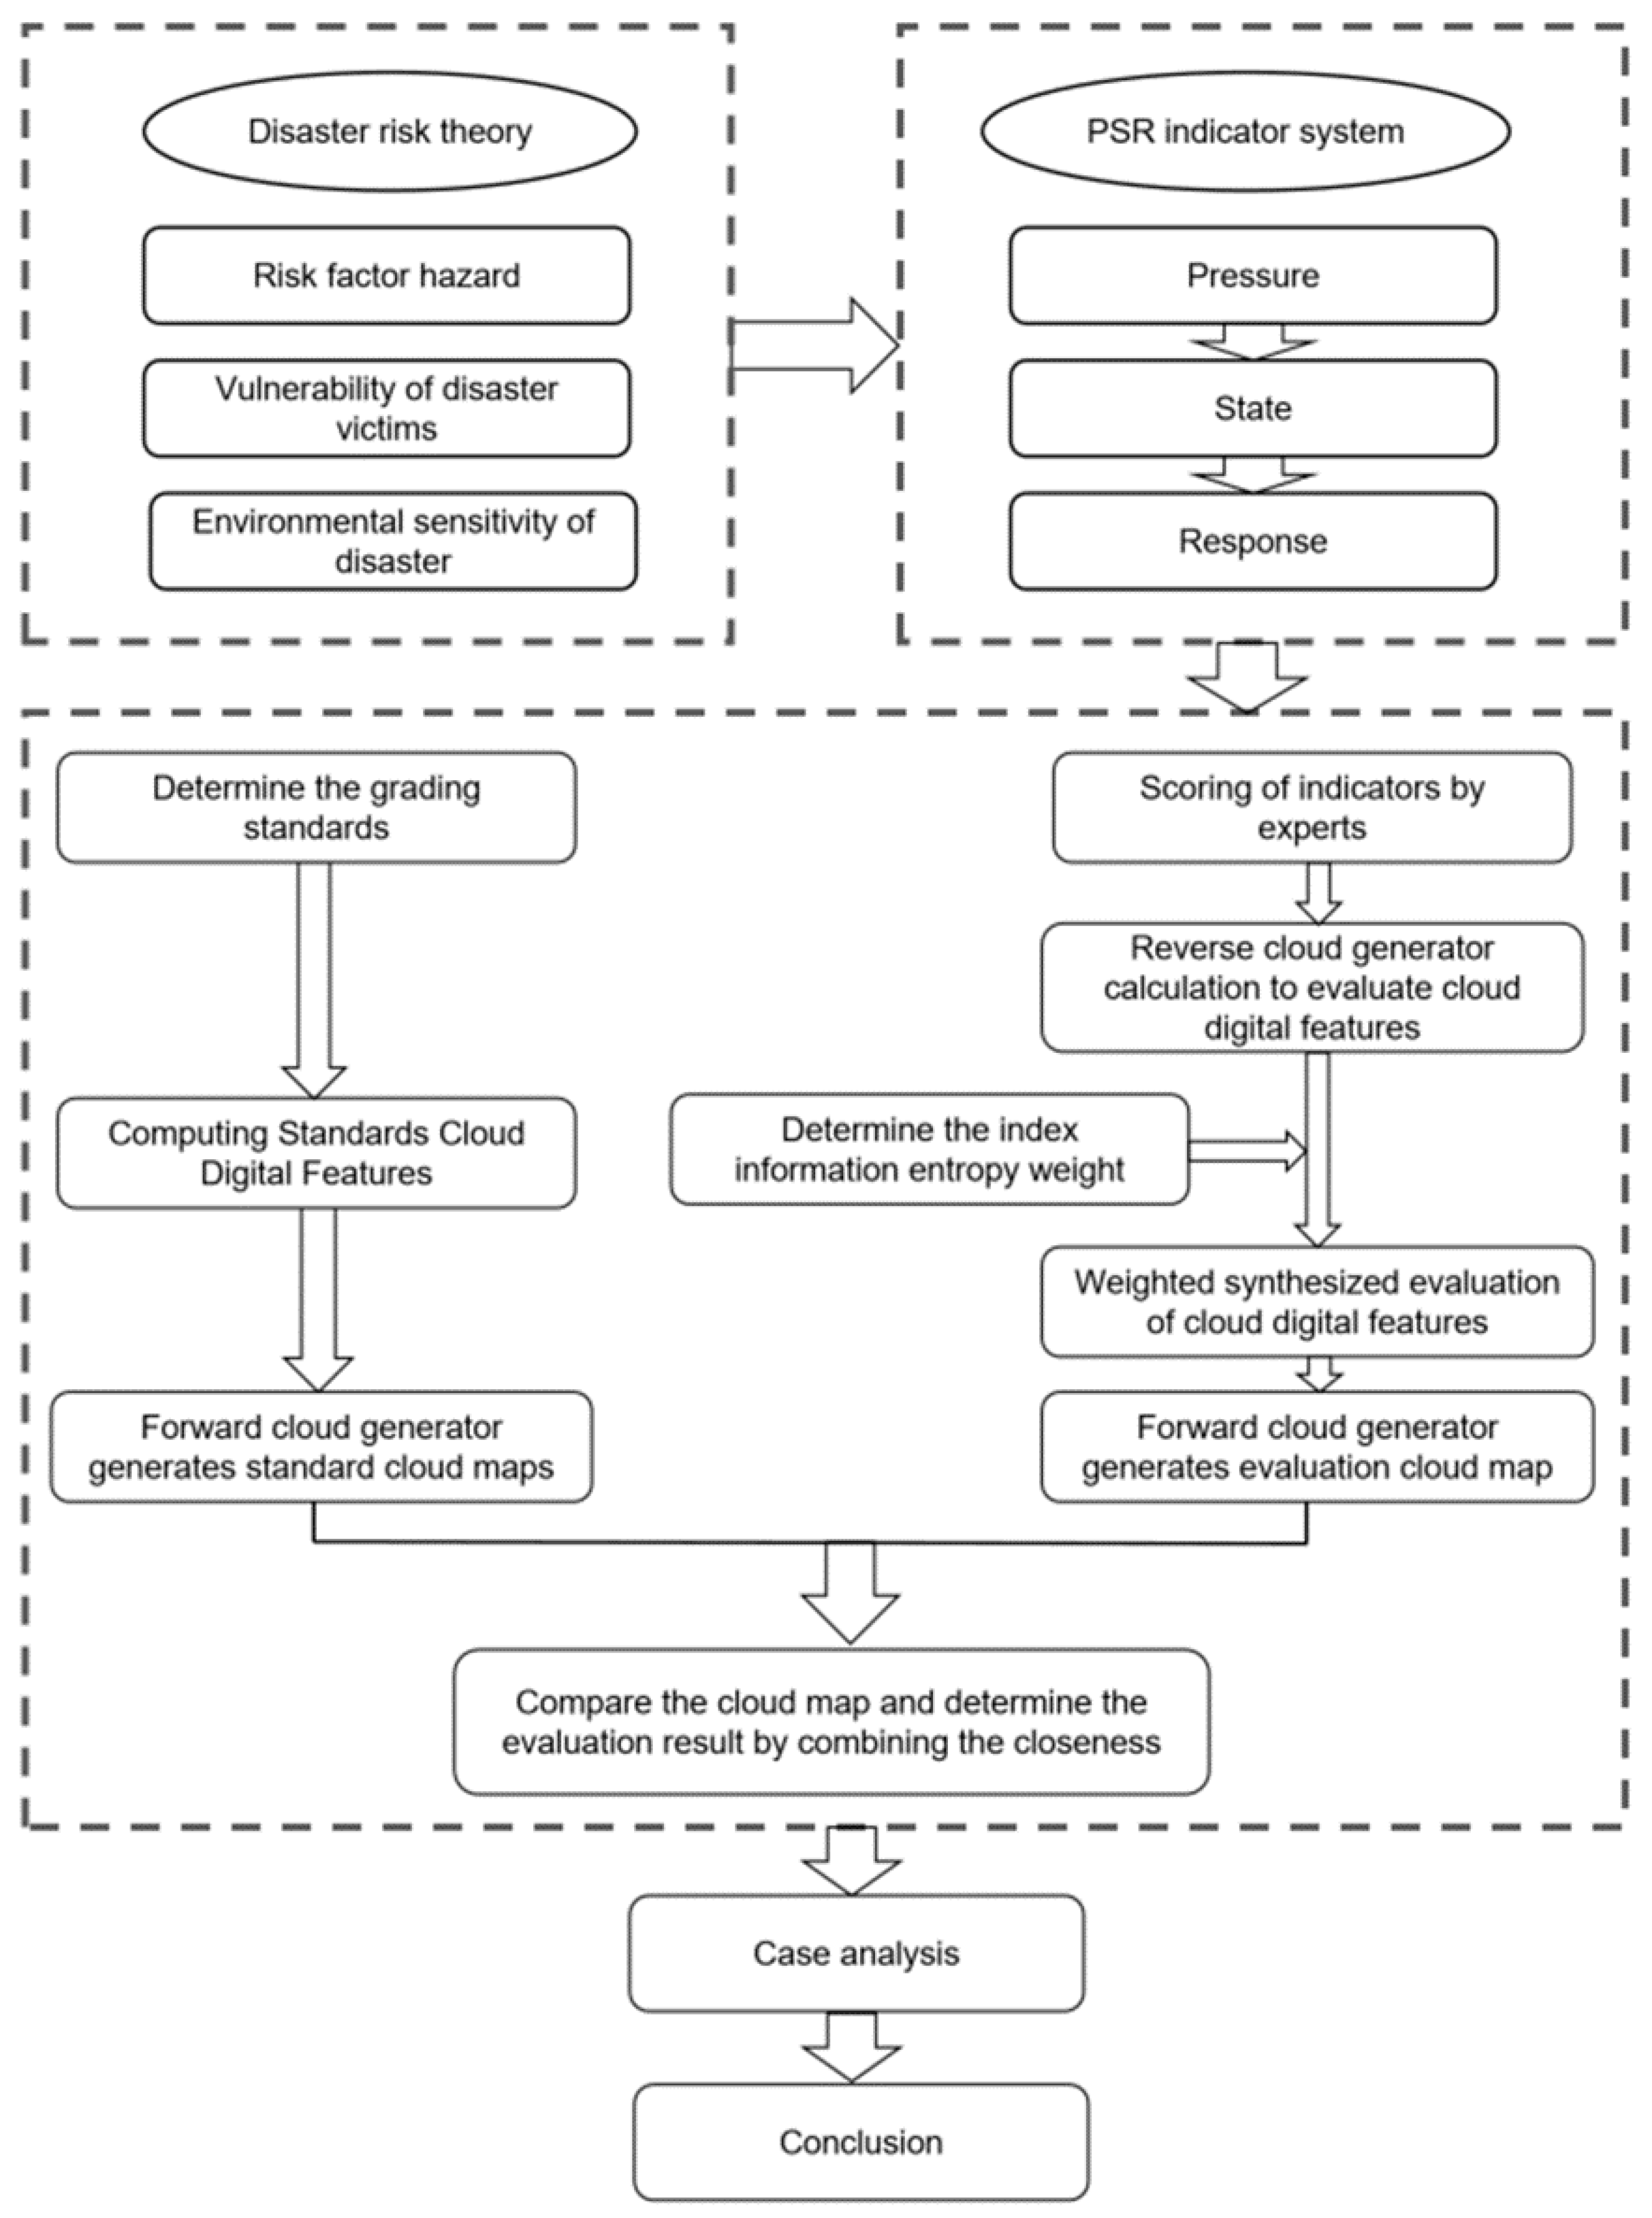
3. Research Methodology
3.1. Constructing an Indicator System Based on PSR
3.2. Defining the Standard Cloud
3.2.1. Cloud Digital Features and Cloud Diagrams
3.2.2. Computing Standards Cloud Digital Features
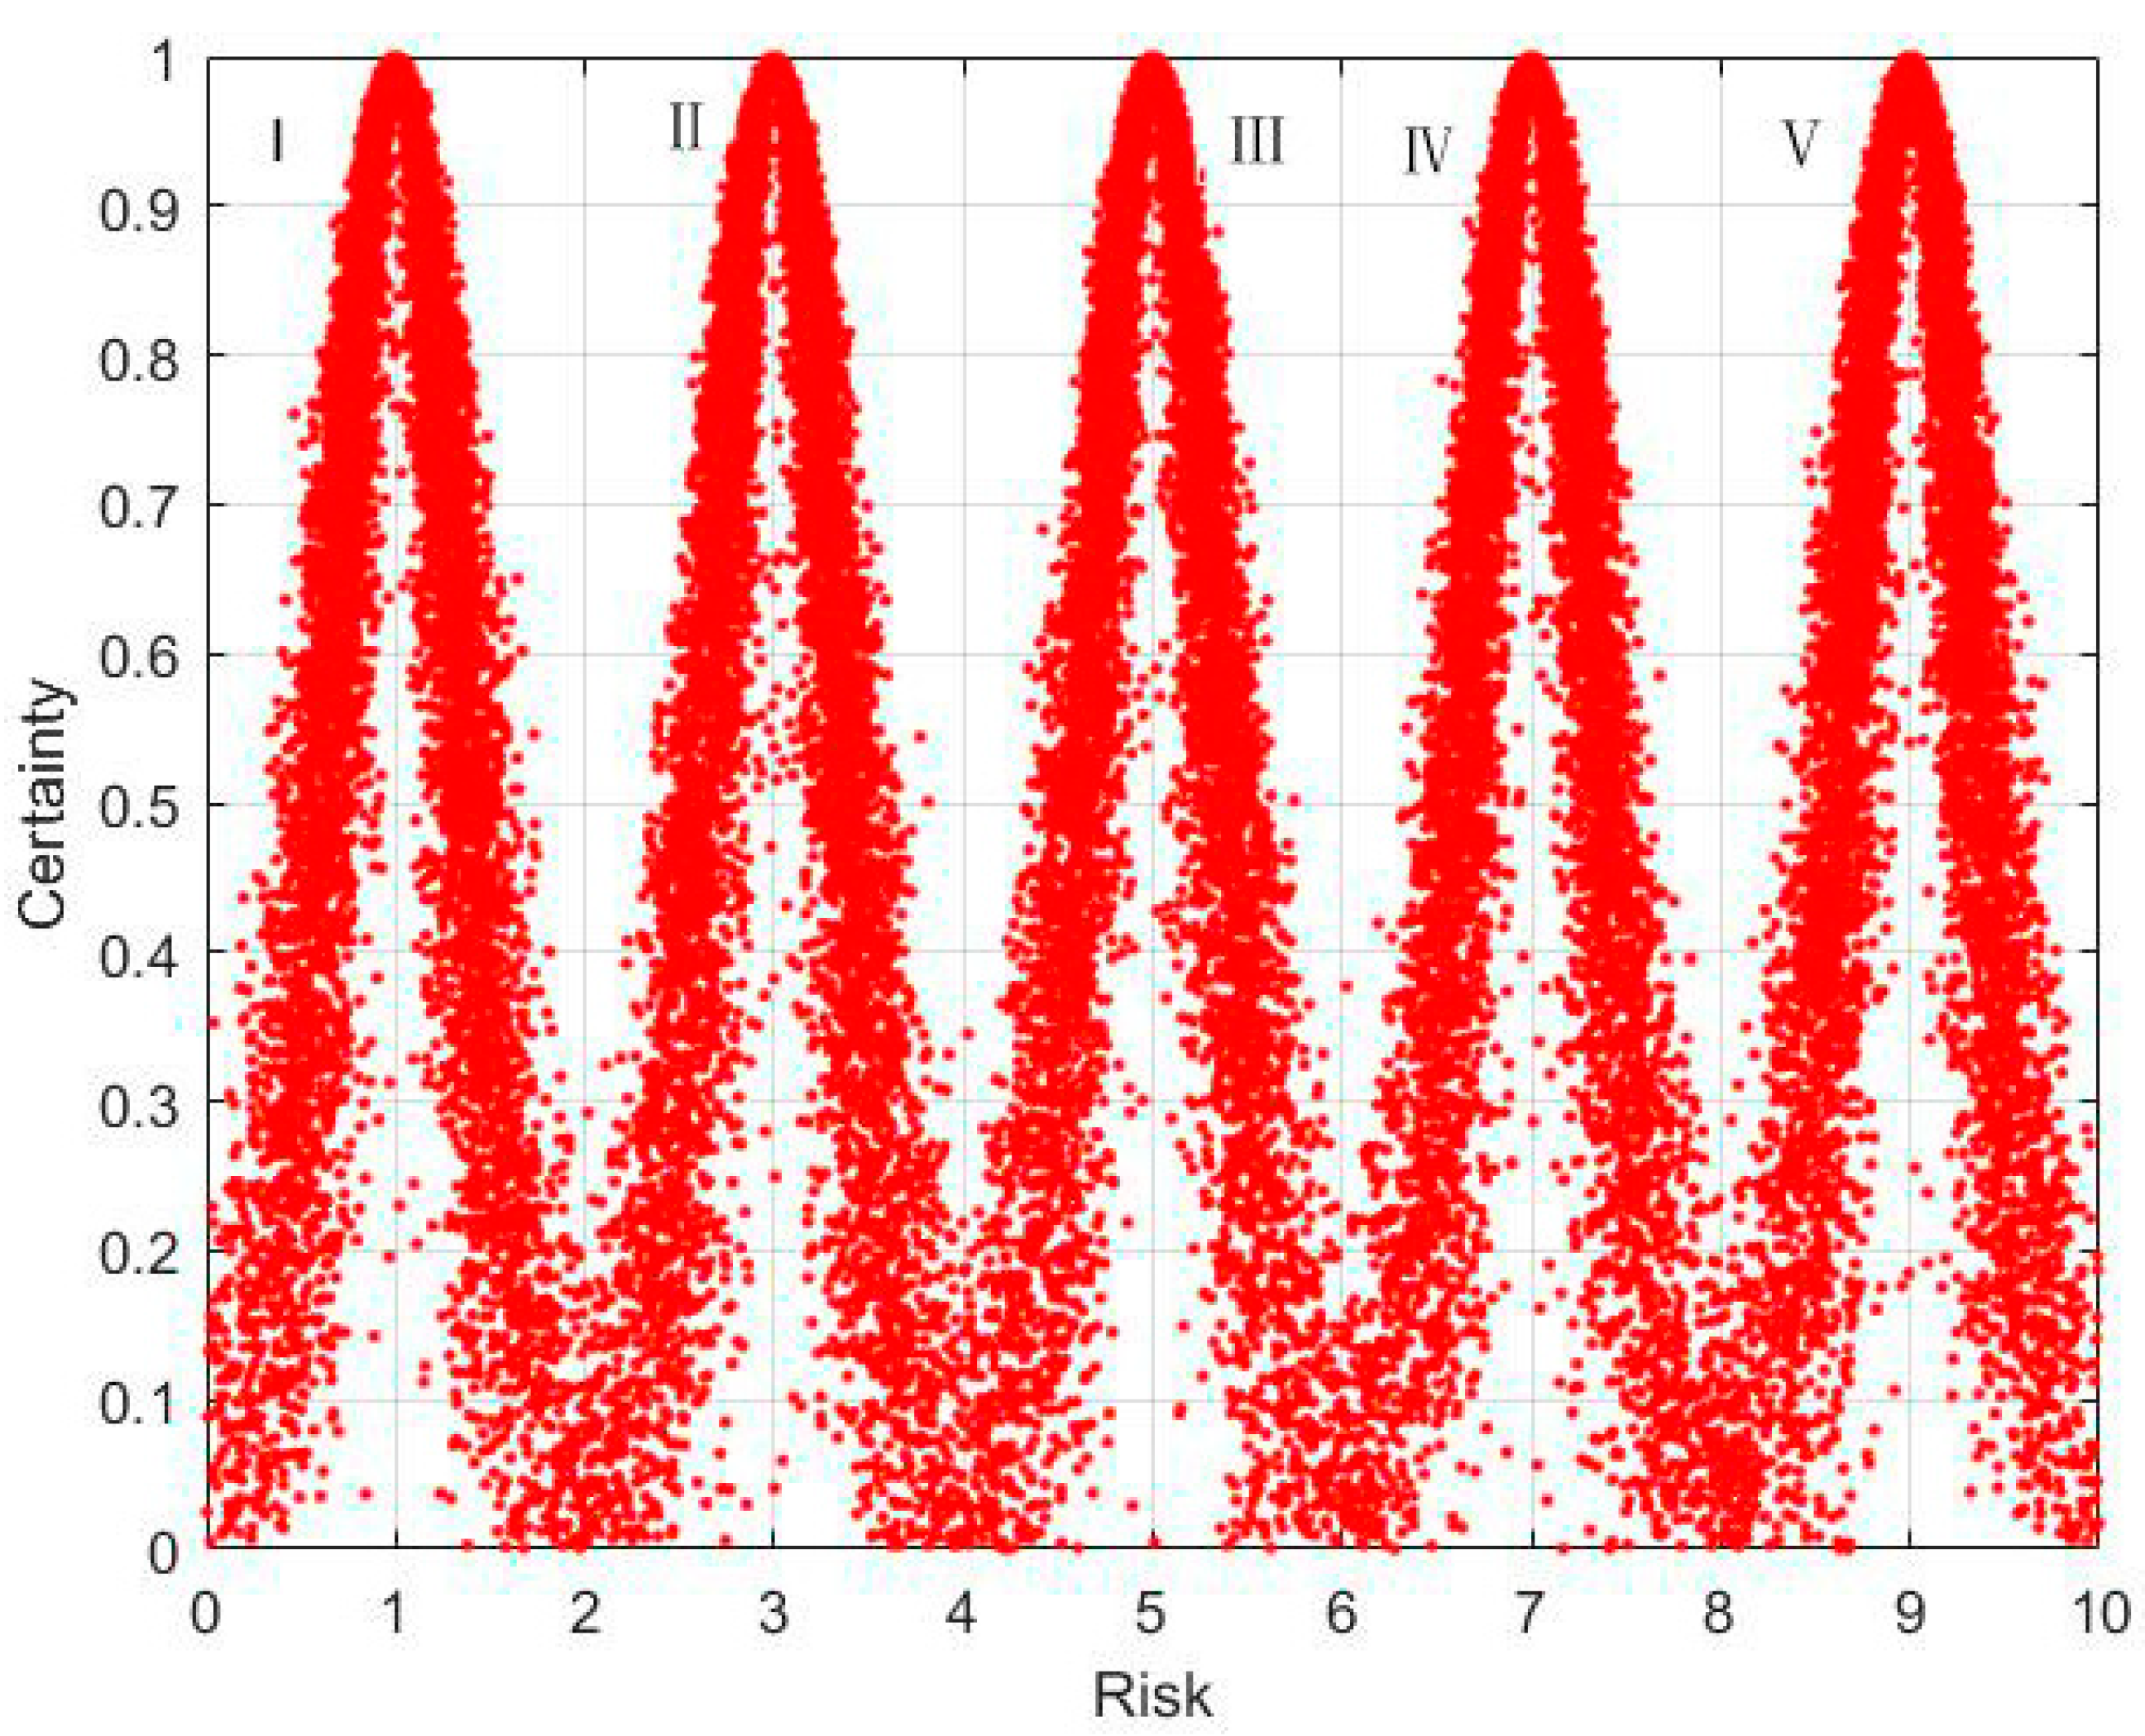
3.2.3. Generate a Standard Cloud Map
- Generate a normal random number with as the expected value and as the variance, denoted ;
- Generate a normal random number X with as the expected value and as the variance, denoted as ;
- Calculate the affiliation of a cloud droplet ;
- Generate as a cloud droplet in the domain of the theory;
- Repeat steps 1 to 4 until the desired number of cloud droplets are generated.
3.3. Identify the Evaluation Cloud
3.3.1. Calculate Metrics to Evaluate Cloud Digital Features
- Calculate the mean :
- Calculate the variance :
- Calculate entropy:
- Calculate hyper entropy:
- Output cloud digital features .
3.3.2. Determine the Entropy Weight of the Metric Information
3.3.3. Determine the Weighted Evaluation of Cloud Digital Characteristics
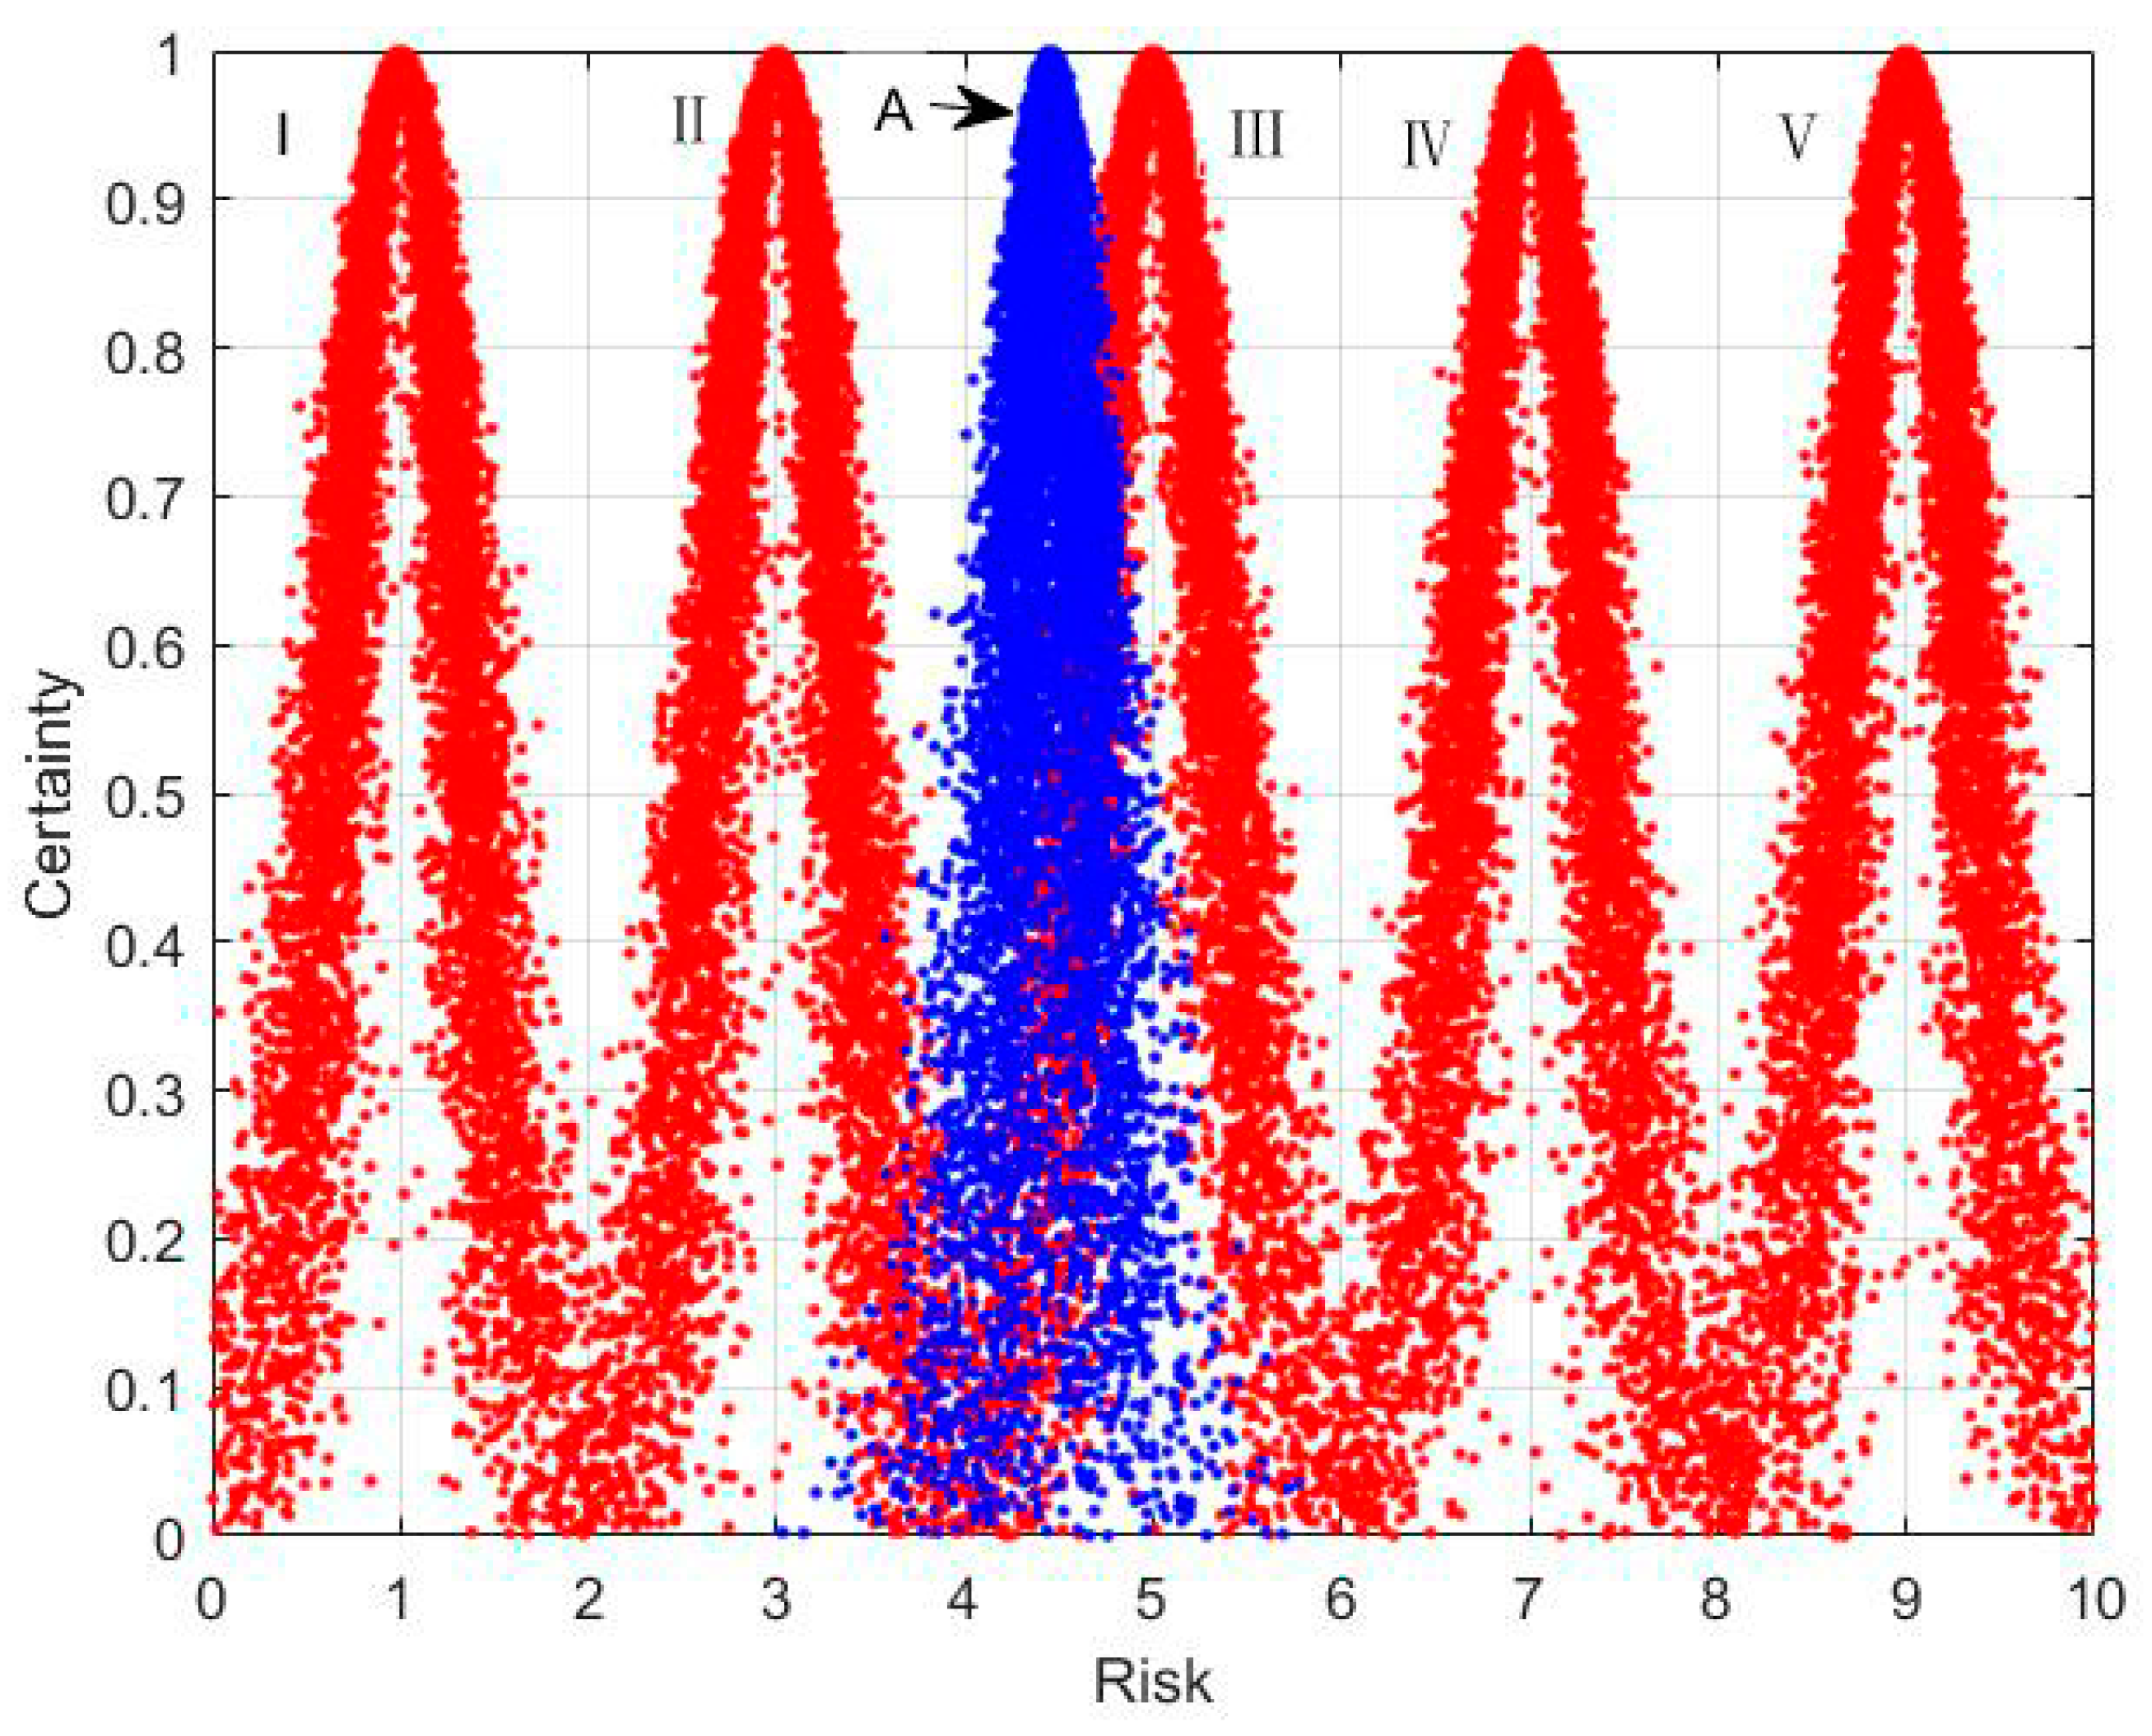
3.3.4. Generate an Evaluation Cloud Map
3.4. Compare the Cloud Graph Judgment Results
4. Case Analysis
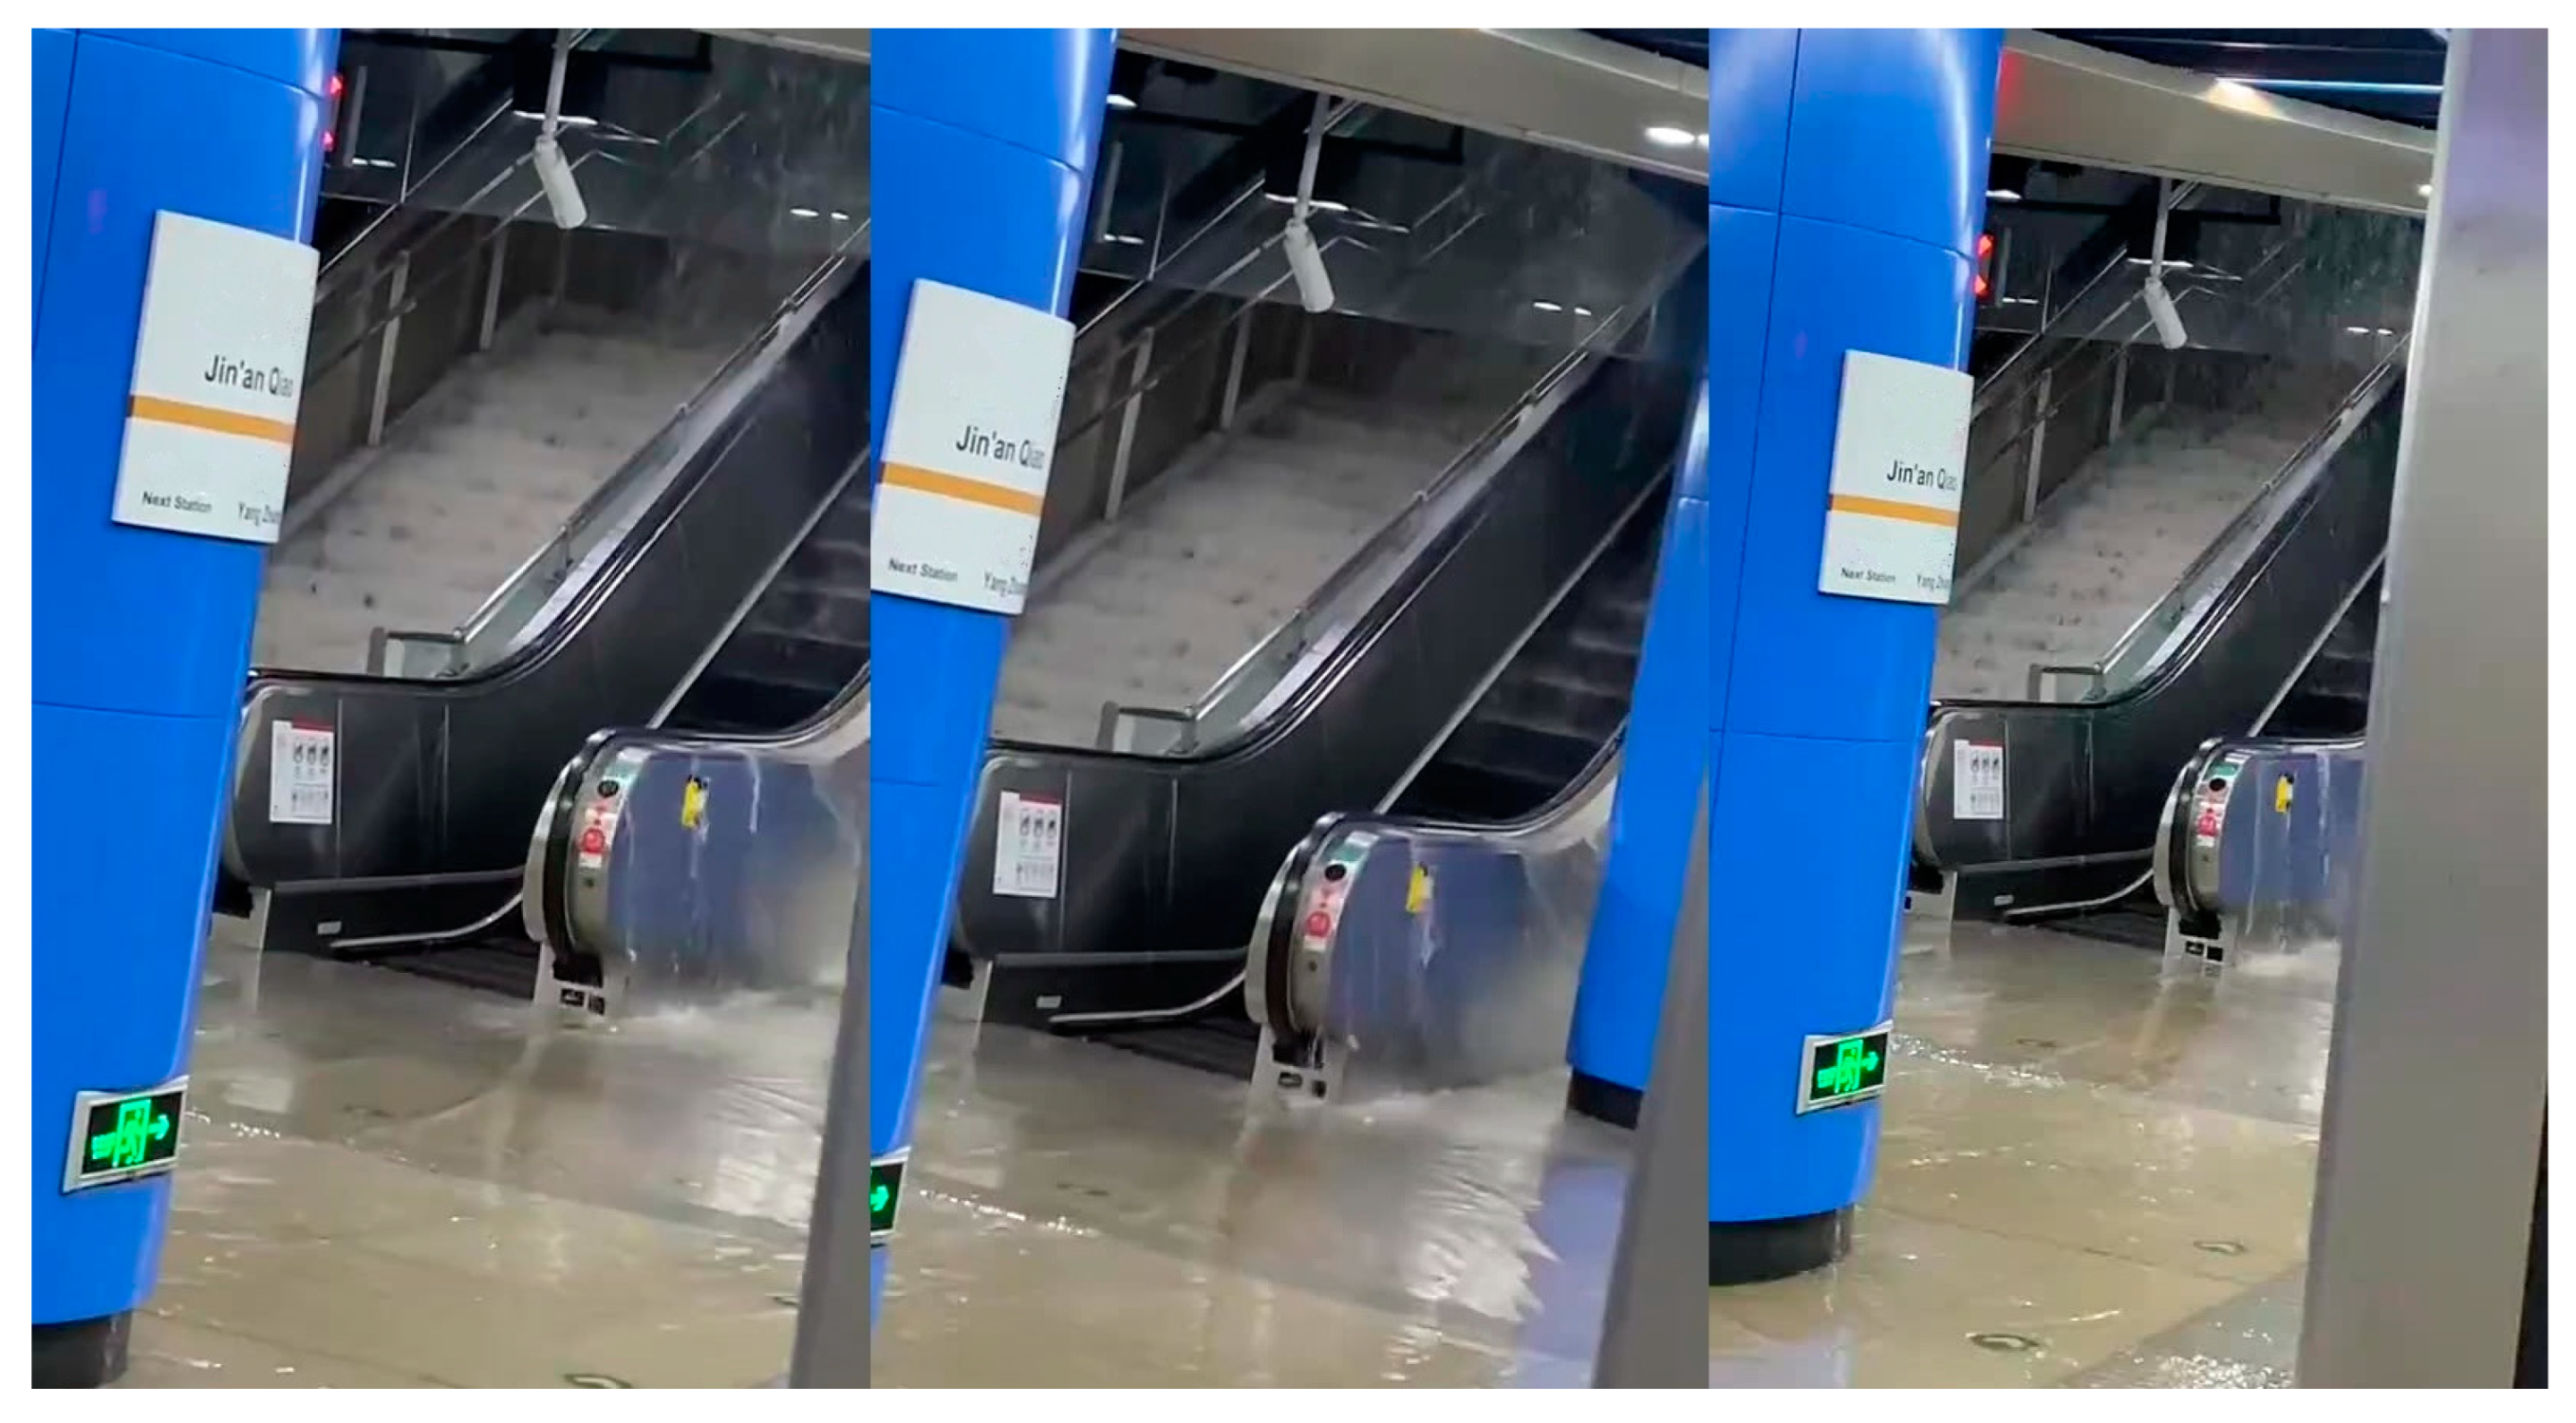
4.1. Introduction to the Study Object
4.2. Identify the Evaluation Cloud
4.3. Comparison of Cloud Diagrams to Determine the Results
4.4. Result Analysis
5. Conclusions
- By combining disaster risk theory with the PSR model, this study establishes a risk assessment index system for rainstorm waterlogging disasters in subway stations. This approach provides new ideas and methods to scientifically assess the risk of such disasters. The integration of disaster-causing factors, the vulnerability of disaster-bearing bodies, and the sensitivity of disaster-prone environments into the evaluation index allows for the greater comprehensive evaluation of the risk level of rainstorm waterlogging disasters in subway stations. This theoretical support contributes to disaster prevention and reduction efforts in subway stations.
- The entropy weight method is utilized to determine the weight of indicators, ensuring that subjective factors do not influence the evaluation results and improve the accuracy of the assessment. The use of cloud model algorithms to generate risk assessment cloud maps provides intuitive displays of evaluation results, making them easily understandable and operable. The evaluation method combining the entropy weight method and cloud model algorithm can more accurately and comprehensively evaluate the risk level of subway flood disasters, providing a scientific basis for disaster prevention and the reduction work of the subway system. This approach has the potential for application in other disaster risk assessments, offering universality and promotional value.
- Through an empirical analysis of the Jin’anqiao subway station in Beijing, this study presents a novel idea and method for evaluating rainstorm waterlogging disasters in subway stations. The findings can serve as a reference for evaluating such disasters in other subway stations and can contribute to enhancing the overall safety and disaster resilience of subway systems.
- However, it is important to note that the risk factors of rainstorm waterlogging disasters in subway stations are complex. In this study, the correlation between risk indicators was not investigated. Additionally, due to limitations in data collection, only Beijing Subway’s Jin’anqiao Subway Station was selected as the research object, which limits the generalizability of these results.
Author Contributions
Funding
Institutional Review Board Statement
Informed Consent Statement
Data Availability Statement
Conflicts of Interest
References
- Lyu, H.-M.; Zhou, W.-H.; Shen, S.-L.; Zhou, A.-N. Inundation risk assessment of metro system using AHP and TFN-AHP in Shenzhen. Sustain. Cities Soc. 2020, 56, 102103. [Google Scholar] [CrossRef]
- Wang, G.; Liu, Y.; Hu, Z.; Zhang, G.; Liu, J.; Lyu, Y.; Gu, Y.; Huang, X.; Zhang, Q.; Liu, L. Flood Risk Assessment of Subway Systems in Metropolitan Areas under Land Subsidence Scenario: A Case Study of Beijing. Remote Sens. 2021, 13, 637. [Google Scholar] [CrossRef]
- Aoki, Y.; Yoshizawa, A.; Taminato, T. Anti-inundation Measures for Underground Stations of Tokyo Metro. Procedia Eng. 2016, 165, 2–10. [Google Scholar] [CrossRef]
- Wang, J.M.; Wang, S.X.; Wang, F.T. Flood Inundation Region Extraction Method Based on Sentinel-1 SAR Data. J. Catastrophol. 2021, 36, 214–220. [Google Scholar] [CrossRef]
- Liang, J.; Liu, D. A local thresholding approach to flood water delineation using Sentinel-1 SAR imagery. ISPRS J. Photogramm. Remote Sens. 2020, 159, 53–62. [Google Scholar] [CrossRef]
- Forero-Ortiz, E.; Martínez-Gomariz, E.; Porcuna, M.C.; Locatelli, L.; Russo, B. Flood Risk Assessment in an Underground Railway System under the Impact of Climate Change—A Case Study of the Barcelona Metro. Sustainability 2020, 12, 5291. [Google Scholar] [CrossRef]
- Wu, J.; Fang, W.; Hu, Z.; Hong, B. Application of Bayesian Approach to Dynamic Assessment of Flood in Urban Underground Spaces. Water 2018, 10, 1112. [Google Scholar] [CrossRef]
- Edwar, F.O.; Eduardo, M.G.; Manuel, C.P. A review of flood impact assessment approaches for underground infrastructures in urban areas: A focus on transport systems. Hydrol. Sci. J. 2020, 65, 1943–1955. [Google Scholar]
- Liu, J.Y.; Chen, J.; Tian, J.; Zhao, L.Q. Risk early warning of subway fire disaster under the concept of resilience based on 2-dimensional cloud model. J. Catastrophol. 2023, 38, 43–47+74. [Google Scholar]
- Lin, Z.; Hu, S.; Zhou, T.; Zhong, Y.; Zhu, Y.; Shi, L.; Lin, H. Numerical Simulation of Flood Intrusion Process under Malfunction of Flood Retaining Facilities in Complex Subway Stations. Buildings 2022, 12, 853. [Google Scholar] [CrossRef]
- Colombo, L.; Gattinoni, P.; Scesi, L. Stochastic modelling of groundwater flow for hazard assessment along the underground infrastructures in Milan (northern Italy). Tunn. Undergr. Space Technol. Inc. Trenchless Technol. Res. 2018, 79, 110–120. [Google Scholar] [CrossRef]
- Lyu, H.-M.; Shen, S.-L.; Yang, J.; Yin, Z.-Y. Inundation analysis of metro systems with the storm water management model incorporated into a geographical information system: A case study in Shanghai. Hydrol. Earth Syst. Sci. 2019, 23, 4293–4307. [Google Scholar] [CrossRef]
- Zhou, Y.; Li, Z.; Meng, Y.; Li, Z.; Zhong, M. Analyzing spatio-temporal impacts of extreme rainfall events on metro ridership characteristics. Phys. A Stat. Mech. Its Appl. 2021, 577, 126053. [Google Scholar] [CrossRef]
- Sun, D.; Wang, H.; Lall, U.; Huang, J.; Liu, G. Subway travel risk evaluation during flood events based on smart card data. Geomat. Nat. Hazards Risk 2022, 13, 2796–2818. [Google Scholar] [CrossRef]
- Han, Y.-S.; Shin, E.T.; Eum, T.S.; Song, C.G. Inundation Risk Assessment of Underground Space Using Consequence-Probability Matrix. Appl. Sci. 2019, 9, 1196. [Google Scholar] [CrossRef]
- Yu, H.; Liang, C.; Li, P.; Niu, K.; Du, F.; Shao, J.; Liu, Y. Evaluation of waterlogging risk in an urban subway station. Adv. Civ. Eng. 2019, 2019, 5393171. [Google Scholar] [CrossRef]
- Lyu, H.-M.; Shen, S.-L.; Zhou, A.; Zhou, W.-H. Data in flood risk assessment of metro systems in a subsiding environment using the interval FAHP–FCA approach. Data Brief 2019, 26, 104468. [Google Scholar] [CrossRef]
- Wang, G.; Liu, L.; Shi, P.; Zhang, G.; Liu, J. Flood Risk Assessment of Metro System Using Improved Trapezoidal Fuzzy AHP: A Case Study of Guangzhou. Remote Sens. 2021, 13, 5154. [Google Scholar] [CrossRef]
- Wu, H.; Wang, J.; Liu, S.; Yang, T. Research on decision-making of emergency plan for waterlogging disaster in subway station project based on linguistic intuitionistic fuzzy set and TOPSIS. Math. Biosci. Eng. 2020, 17, 4825–4851. [Google Scholar] [CrossRef]
- Galkina, A.; Grafeeva, N. Machine learning methods for earthquake prediction: A survey. In Proceedings of the Fourth Conference on Software Engineering and Information Management (SEIM-2019), Saint Petersburg, Russia, 13 April 2019; p. 25. [Google Scholar]
- Cheng, S.; Jin, Y.; Harrison, S.; Quilodrán-Casas, C.; Prentice, I.; Guo, Y. Parameter flexible wildfire prediction using machine learning techniques: Forward and inverse modelling. Remote Sens. 2022, 14, 3228. [Google Scholar] [CrossRef]
- Zhong, C.; Cheng, S.; Kasoar, M.; Arcucci, R. Reduced-order digital twin and latent data assimilation for global wildfire prediction. Nat. Hazards Earth Syst. Sci. 2023, 23, 1755–1768. [Google Scholar] [CrossRef]
- Wang, J.W.; Wu, H.; Yang, T.Y. Vulnerability assessment of rainfall and waterlogging in subway stations based on projection pursuit model. China Saf. Sci. J. 2019, 29, 1–7. [Google Scholar] [CrossRef]
- Wang, J.W.; Tian, M.Y.; Pan, Z.Y.; Liu, S.; Wang, X.N. Study on input strategy of emergency response to rainstorm and waterlogging in subway stations. J. Saf. Sci. Technol. 2022, 18, 11–17. [Google Scholar]
- Bai, L.; Liu, P. Research on flooding prediction in subway station based on RF-RFE algorithm. Railw. Stand. Des. 2022, 68, 1–8. [Google Scholar] [CrossRef]
- Liu, L.; Wu, H.; Wang, J.; Yang, T. Research on the evaluation of the resilience of subway station projects to waterlogging disasters based on the projection pursuit model. Math. Biosci. Eng. 2020, 17, 7302–7331. [Google Scholar] [CrossRef]
- Wu, H.-W.; Zhen, J.; Zhang, J. Urban rail transit operation safety evaluation based on an improved CRITIC method and cloud model. J. Rail Transp. Plan. Manag. 2020, 16, 100206. [Google Scholar] [CrossRef]
- Shao, L.; He, J.; Zeng, X.; Hu, H.; Yang, W.; Peng, Y. Fire risk assessment of airborne lithium battery based on entropy weight improved cloud model. Aircr. Eng. Aerosp. Technol. 2023, 95, 869–877. [Google Scholar] [CrossRef]
- Cao, W.; Deng, J.; Yang, Y.; Zeng, Y.; Liu, L. Water Carrying Capacity Evaluation Method Based on Cloud Model Theory and an Evidential Reasoning Approach. Mathematics 2022, 10, 266. [Google Scholar] [CrossRef]
- He, G.; Ruan, J. Study on ecological security evaluation of Anhui Province based on normal cloud model. Environ. Sci. Pollut. Res. Int. 2021, 29, 16549–16562. [Google Scholar] [CrossRef]
- Wang, L.; Guo, Q.; Yu, X. Stability-Level Evaluation of the Construction Site above the Goaf Based on Combination Weighting and Cloud Model. Sustainability 2023, 15, 7222. [Google Scholar] [CrossRef]
- Liu, J.Y.; Zhao, L.Q.; Tian, J. Safety risk assessment of urban rail transit project based on two-dimensional cloud model. J. Inst. Disaster Prev. 2022, 24, 50–56. [Google Scholar]
- Li, Q.; Guo, L.; Zhou, H. Construction Quality Evaluation of Large-Scale Concrete Canal Lining Based on Statistical Analysis, FAHM, and Cloud Model. Sustainability 2022, 14, 7663. [Google Scholar] [CrossRef]
- He, R.; Zhang, L.; Tiong, R.L. Flood risk assessment and mitigation for metro stations: An evidential-reasoning-based optimality approach considering uncertainty of subjective parameters. Reliab. Eng. Syst. Saf. 2023, 238, 109453. [Google Scholar] [CrossRef]
- Tu, Y.; Shi, H.; Zhou, X.; Liu, L.; Lev, B. Flood risk assessment of metro stations based on the SMAA-2-FFS-H method: A case study of the “7· 20” rainstorm in Zhengzhou, China. Stoch. Environ. Res. Risk Assess. 2023, 37, 2849–2868. [Google Scholar] [CrossRef]
- Yang, K.; Huang, G.Z.; Zhang, L.; Song, Z.; Li, H.X.; Gao, X.H. Analysis of influencing factors of subway system vulnerability under rainstorm conditions based on DEMATEL-AHDT. Water Resour. Hydropower Eng. 2023, 54, 22–33. [Google Scholar] [CrossRef]
- Li, H.S.; Bai, L.; Liu, P. Research on subway flood disaster assessment based on DNN neural network. Railw. Stand. Des. 2022, 66, 131–136. [Google Scholar] [CrossRef]
- Yan, X.X.; Wang, J.L.; Fan, L.; Li, W.C. Research on subway flood disaster from the perspective of resilient city—Based on Bow-Tie-Bayesian network model. J. Catastrophol. 2022, 37, 36–43. [Google Scholar]
- Zhao, L.W.; Wang, Q.E. FCM-based vulnerability evolution analysis of metro systems disturbances. China Saf. Sci. J. 2022, 32, 186–192. [Google Scholar] [CrossRef]
- Zhao, L.W.; Wang, Q.E. Study on vulnerability formation mechanism of metro system under storm disturbance. China Saf. Sci. J. 2022, 32, 193–199. [Google Scholar] [CrossRef]
- Liu, H.; Liu, F.; Zheng, L.; Chen, X.L. Research on flood disasters in northern cities combining risk analysis and loss assessment: Taking the heavy rainstorm and flood disaster in Zhengzhou City in July 2021 as an example. J. Cent. China Norm. Univ. (Nat. Sci.) 2023, 57, 59–68. [Google Scholar] [CrossRef]
- Zhang, R.; Wang, C.; Xiong, Y. Ecological security assessment of China based on the Pressure-State-Response framework. Ecol. Indic. 2023, 154, 110647. [Google Scholar] [CrossRef]
- Wang, Y.; Wu, Z.; Yan, B.; Li, K.; Huang, F. Research on ecological environment impact assessment based on PSR and cloud theory in Dari county, source of the Yellow River. Water Supply 2020, 21, 1050–1060. [Google Scholar]
- Zhu, M.; Li, B.; Liu, G. Groundwater risk assessment of abandoned mines based on pressure-state-response—The example of an abandoned mine in southwest China. Energy Rep. 2022, 8, 10728–10740. [Google Scholar] [CrossRef]
- Gayen, J.; Datta, D. Application of pressure–state–response approach for developing criteria and indicators of ecological health assessment of wetlands: A multi-temporal study in Ichhamati floodplains, India. Ecol. Process. 2023, 12, 34. [Google Scholar] [CrossRef]
- Ashraf, A.; Haroon, M.A.; Ahmad, S.; Abowarda, A.S.; Wei, C.; Liu, X. Use of remote sensing-based pressure-state-response framework for the spatial ecosystem health assessment in Langfang, China. Environ. Sci. Pollut. Res. Int. 2023, 30, 89395–89414. [Google Scholar] [CrossRef]
- Xie, X.; Zhou, G.; Yu, S. Study on Rural Ecological Resilience Measurement and Optimization Strategy Based on PSR-“Taking Weiyuan in Gansu Province as an Example”. Sustainability 2023, 15, 5462. [Google Scholar] [CrossRef]
- Li, R.; Huang, S.; Bai, Y.; Li, Y.; Cao, Y.; Liu, Y. Assessment of Sustainable Water Utilization Based on the Pressure–State–Response Model: A Case Study of the Yellow River Basin in China. Sustainability 2022, 14, 14820. [Google Scholar] [CrossRef]
- Fu, L.; Ding, M.; Zhang, Q. Flood risk assessment of urban cultural heritage based on PSR conceptual model with game theory and cloud model—A case study of Nanjing. J. Cult. Herit. 2022, 58, 1–11. [Google Scholar] [CrossRef]
- Chen, J.; Liu, J.Y.; Deng, X. Vulnerability assessment of heavy rainfall and waterlogging in subway stations based on IOWA-VAC. Water Resour. Power 2023, 41, 60, 88–91. [Google Scholar] [CrossRef]
- Li, H.; Ou-Yang, Z.; Jiang, J.; Yang, Q.; Liu, B.; Xi, Y. Urban Rail Transit Disaster Chain Evolution Network Model and Its Risk Analysis—Taking Subway Flood as an Example. Railw. Stn. Des. 2020, 64, 153–157. [Google Scholar] [CrossRef]

| Valuation Indicators | Very Low-Risk Level I [0, 2] | Low Risk Level II (2, 4] | Medium Risk Level III (4, 6] | High Risk Level IV (6, 8] | Very HighRisk Level V (8, 10] | |
|---|---|---|---|---|---|---|
| A1 | A11 Rainstorm frequency/event [23] | [0, 2) | [2, 4) | [4, 5) | [5, 7) | [7, 26] |
| A12 Rainstorm duration/h [50] | [0, 1) | [1, 1.5) | [1.5, 3) | [3, 8) | [8, 10] | |
| A13 24 h maximum rainfall/mm [23] | [0, 50) | [25, 50) | [50, 100) | [100, 200) | [200, 2000) | |
| A14 Adverse geological conditions [23] | Not have | Lesser | General | More | Much | |
| A15 Adverse neighborhood elements [23] | Not have | Lesser | General | More | Much | |
| A16 Runoff coefficient [23] | [0.1, 0.2) | [0.2, 0.3) | [0.3, 0.45) | [0.45, 0.6) | [0.6, 0.85] | |
| A2 | A21 Retaining wall height/m [23] | [1.5, 3.0] | [1.0, 1.5) | [0.5, 1.0) | [0.3, 0.5) | [0, 0.3) |
| A22 Flood control barrier height/m [51] | [1.5, 1.8) | [1.2, 1.5) | [1.0, 1.2) | [0.8, 1.0) | [0.5, 0.8) | |
| A23 Terrain around entrances and exits [38] | Higher | High | General | Low | Lower | |
| A24 Drainage capacity factor for drains [23] | [1.5, 100] | [1.25, 1.5) | [1.0, 1.25) | [0.75, 1] | [0, 0.75) | |
| A25 Drainage network density/(km·km−2) [23] | [3.17, 10] | [2.78, 3.17) | [2.39, 2.78) | [2, 2.39) | [0, 2) | |
| A26 Standing water detection alarm system [50] | Very sensitive | Sensitive | General | Insensitive | Defunct | |
| A27 Surveillance equipment [24] | Very complete | Complete | General | Incomplete | Not have | |
| A3 | A31 Number of safety inspections (times/month) [23] | [8, 30] | [6, 8) | [4, 6) | [1, 4) | [0, 1) |
| A32 Flood control emergency preparedness [23] | Vigorous | Strong | General | Weaker | Weak | |
| A33 Flood emergency drills (times/month) [23] | [4, 12] | [3, 4) | [2, 3) | [1, 2) | [0, 1) | |
| A34 Timeliness and accuracy of flood information [24] | Very complete | Complete | General | Incomplete | Not have | |
| A35 Proportion of professional rescuers/% [23] | [30, 100] | [20, 30) | [10, 20) | [5, 10) | [0, 5) | |
| A36 Traveling command and dispatch level [24] | Excellent | Good | General | Poor | Worse | |
| A37 Stockpiling of rescue materials [23] | Very complete | Complete | General | Incomplete | Not have | |
| Level | Interval | Standard Cloud Digital Features | Description |
|---|---|---|---|
| Level I | [0, 2] | (1, 0.33, 0.1) | Very low risk |
| Level II | (2, 4] | (3, 0.33, 0.1) | Low risk |
| Level III | (4, 6] | (5, 0.33, 0.1) | Medium risk |
| Level IV | (6, 8] | (7, 0.33, 0.1) | High risk |
| Level V | (8, 10] | (9, 0.33, 0.1) | Very high risk |
| Objective Layer | Cloud Digital Features | Criteria Layer | Weights | Cloud Digital Features | Indicator Layer | Weights | Cloud Digital Features |
|---|---|---|---|---|---|---|---|
| A | (4.4548, 0.1947, 0.1237) | A1 | 0.316 | (4.61, 0.21, 0.13) | A11 | 0.170 | (4.66, 0.20, 0.11) |
| A12 | 0.180 | (4.92, 0.27, 0.17) | |||||
| A13 | 0.129 | (3.54, 0.26, 0.14) | |||||
| A14 | 0.171 | (4.68, 0.18, 0.11) | |||||
| A15 | 0.164 | (4.48, 0.11, 0.10) | |||||
| A16 | 0.186 | (5.08, 0.23, 0.13) | |||||
| A2 | 0.307 | (4.04, 0.18, 0.13) | A21 | 0.170 | (4.52, 0.23, 0.11) | ||
| A22 | 0.135 | (3.58, 0.15, 0.14) | |||||
| A23 | 0.178 | (4.74, 0.24, 0.17) | |||||
| A24 | 0.170 | (4.50, 0.15, 0.12) | |||||
| A25 | 0.168 | (4.48, 0.11, 0.10) | |||||
| A26 | 0.094 | (2.52, 0.20, 0.19) | |||||
| A27 | 0.084 | (2.24, 0.20, 0.11) | |||||
| A3 | 0.377 | (4.66, 0.19, 0.11) | A31 | 0.148 | (4.80, 0.25, 0.13) | ||
| A32 | 0.139 | (4.52, 0.08, 0.11) | |||||
| A33 | 0.144 | (4.70, 0.25, 0.11) | |||||
| A34 | 0.150 | (4.88, 0.11, 0.07) | |||||
| A35 | 0.138 | (4.05, 0.25, 0.13) | |||||
| A36 | 0.139 | (4.52, 0.27, 0.12) | |||||
| A37 | 0.143 | (4.66, 0.15, 0.09) |
Disclaimer/Publisher’s Note: The statements, opinions and data contained in all publications are solely those of the individual author(s) and contributor(s) and not of MDPI and/or the editor(s). MDPI and/or the editor(s) disclaim responsibility for any injury to people or property resulting from any ideas, methods, instructions or products referred to in the content. |
© 2023 by the authors. Licensee MDPI, Basel, Switzerland. This article is an open access article distributed under the terms and conditions of the Creative Commons Attribution (CC BY) license (https://creativecommons.org/licenses/by/4.0/).
Share and Cite
Liu, J.; Zheng, W.; Li, H.; Chen, J. Evaluation of Flooding Disaster Risks for Subway Stations Based on the PSR Cloud Model. Sustainability 2023, 15, 15552. https://doi.org/10.3390/su152115552
Liu J, Zheng W, Li H, Chen J. Evaluation of Flooding Disaster Risks for Subway Stations Based on the PSR Cloud Model. Sustainability. 2023; 15(21):15552. https://doi.org/10.3390/su152115552
Chicago/Turabian StyleLiu, Jingyan, Wenwen Zheng, Huimin Li, and Jia Chen. 2023. "Evaluation of Flooding Disaster Risks for Subway Stations Based on the PSR Cloud Model" Sustainability 15, no. 21: 15552. https://doi.org/10.3390/su152115552
APA StyleLiu, J., Zheng, W., Li, H., & Chen, J. (2023). Evaluation of Flooding Disaster Risks for Subway Stations Based on the PSR Cloud Model. Sustainability, 15(21), 15552. https://doi.org/10.3390/su152115552