Abstract
The rapid proliferation of electric vehicle adoption has brought about significant changes in energy consumption patterns, but improper disposal of retired batteries poses new challenges to the environment. In order to promote the sustainable development of the industry using retired batteries, this paper focuses on the research on retired battery appearance detection, sorting, and regrouping technologies. Firstly, the standards for retired battery appearance detection are analyzed, and a method of acquiring battery appearance features through two-stage image acquisition is proposed. Machine vision is employed to achieve the appearance filtering of retired batteries, overcoming the shortcomings of manual screening. For the filtered batteries, capacity, internal resistance, and open-circuit voltage are determined as indicators. Analytic hierarchy process and Gray relation analysis are employed for classification based on four application scenarios. Additionally, an improved Gaussian mixture model clustering algorithm is proposed. In the recombination process, the algorithm parameters are adaptively adjusted for each battery category. Experimental results demonstrate that the accuracy of battery appearance filtering exceeds 97%, and the improved algorithm effectively enhances the consistency among batteries. Compared to the baseline algorithm, the performance consistency of regrouping batteries is increased by more than 5%.
1. Introduction
The rapid development of electric vehicles has provided humans with a clean and efficient way to travel, and their market share is gradually increasing [1,2]. Along with the booming development of electric vehicles, the production of power batteries has also shown growth [3,4,5]. Lithium-ion batteries are widely used in electric vehicles due to their high energy density and long cycle life [6]. With the operation of electric vehicles, lithium-ion battery life will decay, and the inconsistency between the batteries will increase; in order to ensure the safe operation of electric vehicles, the battery needs to be replaced [7], but the retired batteries can be utilized for secondary use in circumstances where the battery performance requirements are lower [8]. In the whole life cycle of the power battery, its utilization mainly includes four stages [9], as shown in Figure 1. Firstly, the new battery will be applied to electric vehicles and can be applied in other scenarios when its lifespan decreases to a certain extent. Batteries with better performance can be applied in scenarios such as low-speed electric bicycles, mobile power, etc. Batteries with poorer performance are generally applied in places such as energy storage power stations. Batteries with capacities lower than 30% or 20% [10] will be dismantled and recycled.
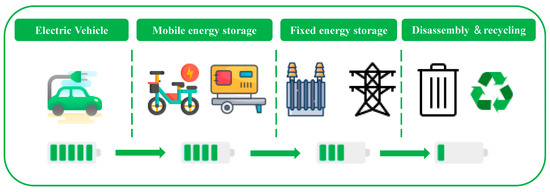
Figure 1.
Full life cycle application stages of power battery.
In order to ensure the safety of the echelon utilization of retired batteries, it is necessary to carry out appearance detection of batteries before utilization, eliminating batteries with bulging packs, liquid leakage, and case deformation [11]. At the same time, due to the different degrees of aging of batteries, the internal indicators have a large difference. If not sorted and regrouped, the inconsistency between batteries will lead to excessive aging of the batteries and the risk of thermal runaway. Therefore, appearance detection, sorting, and regrouping of batteries are necessary for echelon utilization.
Since the echelon utilization of retired batteries is still in its infancy, appearance filtering standards are not perfect. The appearance filtering of retired batteries remains at the stage of manual filtering [12], mainly through visual observation, eliminating bulging, leaking, and deformed batteries, but manual observation depends on the professional ability and quality of the staff. At the same time, leaking and bulging batteries also have certain safety hazards, and the direct contact of manpower will have a certain degree of risk. Zhou et al. [13] detected the location and status of retired batteries through machine vision and proposed a combination of manual and robotic methods for the echelon utilization of retired batteries. In the stage of the new battery leaving the factory, the appearance detection of the battery is mainly realized by machine vision. Zhang et al. [14] proposed a method based on machine vision to realize the scratch detection of the battery appearance, which overcomes the disadvantages of manual detection. Machine vision greatly improves the speed and accuracy of appearance detection. In the stage of filtering the appearance of retired batteries, there are few studies that utilize machine vision for filtering. On the one hand, due to the diverse appearance of retired batteries, it is necessary to simultaneously detect features such as bulging, leakage, and deformation. On the other hand, the construction of a retired batteries appearance dataset is also more difficult.
Sorting of retired batteries is intended to classify batteries with similar performance, while the purpose of regrouping is to recombine similar batteries for secondary utilization [15]. The consistency of retired batteries varies widely due to differences in battery usage environments, operating conditions, and even driving habits [16], and these differences are mainly reflected in parameters such as capacity and internal resistance. Jiang et al. [17] evaluated the consistency of retired batteries in terms of both capacity and internal resistance and analyzed the correlation between them. Lai et al. [18] analyzed the relationship between the charging curve and the available capacity, combined with the scenario of echelon utilization of retired batteries, and proposed an improved K-means algorithm for regrouping. Wang et al. [19] introduced a clustering methodology that combines density-based spatial clustering of applications with noise (DBSCAN) with K-means, resulting in improved accuracy in the regrouping process. In previous studies, numerous researchers [20,21] have concentrated on assessing the influence of battery capacity and internal resistance on echelon utilization. Nevertheless, during battery regrouping, disparities in open-circuit voltage can result in internal charging between modules, thereby compromising the safety of echelon utilization. Additionally, initial parameters, such as the number of clusters in various clustering algorithms, wield significant influence on the regrouping process. Current clustering methods, including K-means and Gaussian mixture model (GMM), often necessitate manual selection of the cluster count [22], rendering them unsuitable for the extensive clustering and regrouping requirements of retired batteries.
Based on the above analysis, the limitations of the existing technology of echelon use mainly include:
- (1)
- The appearance filtering of retired batteries has an important impact on their safe application, but the existing program mainly carries out manual observation filtering, the filtering accuracy is not guaranteed, and the manual filtering also has safety risks.
- (2)
- A large number of studies have taken battery capacity and internal resistance as sorting indicators, ignoring the influence of open-circuit voltage on the echelon utilization of the battery, while the binary evaluation indicators make it difficult to comprehensively assess the state of the battery.
- (3)
- Existing regrouping algorithms are mainly aimed at evaluating the advantages and disadvantages of a certain batch of batteries, without taking into account the actual scenario of echelon utilization, and at the same time, the algorithm parameters are often chosen artificially in regrouping.
In order to fill these research gaps, this paper delves into research on technology for the detection, sorting, and regrouping of retired batteries. The main structure of the article is shown in Figure 2, which mainly contains the following contributions:
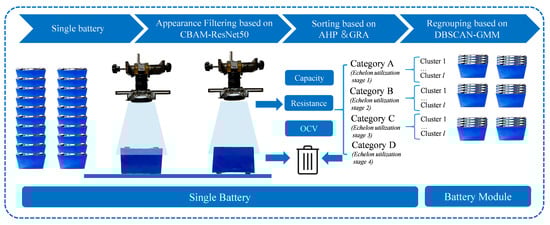
Figure 2.
Structure and main content of the article.
- (1)
- The paper examines the criteria for screening the appearance of retired batteries and introduces a method for capturing appearance features through dual-image acquisition. Subsequently, retired battery appearance screening is achieved using the machine learning method.
- (2)
- Retired batteries are sorted according to different application scenarios through the analytic hierarchy process (AHP) and Gray relation analysis (GRA), laying the foundation for subsequent high-precision battery regrouping.
- (3)
- A hybrid DBSCAN-GMM algorithm is proposed, which can adaptively adjust the number of clustering clusters and related parameters. This algorithm aims to minimize disparities among batteries within the same group, ultimately enhancing regrouping accuracy.
2. Construction of Retired Battery Appearance Dataset
In this section, the appearance filtering criteria of retired batteries are analyzed, and a method for acquiring the appearance characteristics of retired batteries by two image acquisitions is proposed.
2.1. Criteria for Appearance Filtering of Retired Batteries
The retired battery analyzed in this paper is a square 20 Ah lithium iron phosphate power battery, a battery widely used by electric vehicles, and its main performance parameters are shown in Table 1.

Table 1.
Main parameters of the battery.
During the electric vehicle usage phase, various operating conditions lead to defects like bulging, liquid leakage, and deformation in the batteries. Therefore, in the echelon utilization of retired batteries, the first step for disassembled single batteries is appearance filtering. Only the batteries meeting the appearance filtering standards are permitted to proceed to the echelon utilization stage [23]. Generally speaking, the appearance filtering of single batteries is mainly from the lugs as well as the case to check the appearance status of the battery. The desirable condition of the lugs and the case are illustrated in Figure 3a,d.
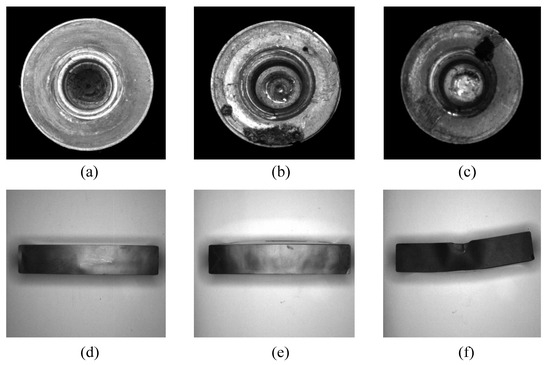
Figure 3.
Appearance forms of several retired batteries. (a) Desirable lug; (b) Stained lug; (c) Broken lug; (d) Desirable case; (e) Bulging case; (f) Deformed case.
- (1)
- Single battery lugs are stained and broken in appearance, as shown in Figure 3b,c. This is mainly due to improper operation of the battery in the electric vehicle use and battery pack disassembly stage, and this type of retired battery is not suitable for echelon utilization.
- (2)
- The cases of single batteries are bulging and deformed as shown in Figure 3e,f. This is mainly due to the battery production stage process that is poor or in the electric vehicle application stage of over-charging, over-discharging. Consequently, batteries of this nature should be deemed unfit for use and should undergo scrapping and dismantling.
2.2. Image Acquisition Platform Construction for Retired Batteries
The retired battery image acquisition platform is mainly composed of industrial cameras, lenses, and light sources.
2.2.1. Image Acquisition Platform Program Design
In the process of image acquisition, due to the diversity of appearance defects in retired batteries, it is not possible to capture all features in a single acquisition. However, collecting data too frequently decreases the system efficiency. To strike a balance between sampling accuracy and efficiency, this paper proposes a method of detecting the appearance features of retired batteries by two image acquisitions, and the main process is shown in Figure 4. Firstly, the battery is loaded through the machine with the lugs facing upwards, and the industrial camera captures the battery lug features. Followed by battery flipping, the industrial camera captures the lower battery features.
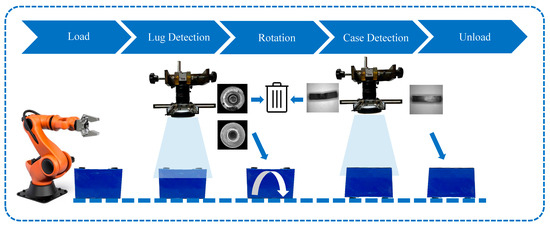
Figure 4.
Image acquisition platform scheme.
In the first image acquisition, the main focus is on the features of the two lugs of the square battery, and the stains and damages to the lugs are recognized. In the second shooting, the lower part of the battery is selected for the purpose of acquiring features such as bulging and deformation of the battery case in one shot. Because the deformation and bulging of the battery cannot be fully captured from a single side view, employing multiple side views would complicate the system. However, the lower part of the battery is relatively flat, without lugs, pressured relief holes, or other features that might obstruct the view of the battery case’s bulging and deformation. This approach allows for the comprehensive capture of all appearance characteristics of square batteries, ensuring accurate identification while enhancing system efficiency.
2.2.2. Selection of Industrial Cameras, Lenses, and Light Sources
In image acquisition, the camera is used to collect the characteristics of retired batteries, and the camera performance directly affects the quality of the image. To enhance the precision of appearance filtering while ensuring the system’s reliability, an OSG130-210UM industrial camera was selected in this study. In the image acquisition system, an industrial camera is paired with a lens to facilitate image acquisition. The lens modulates light, transmitting the target imaging information to the camera’s image sensor. Considering factors such as focal length, aperture, and depth of field, this paper opted for the VM04018MPIR lens. Light sources are another important part of the image acquisition platform. Although the choice of the light source should not only take into account the final image of the imaging conditions, ensuring that the characteristics of the retired batteries can be completely presented, this paper chose a JS-RL-90-60 white ring light source. The main parameters of the industrial camera, lens, and light source are shown in Table 2.
Table 2.
Basic Parameters of Camera, Lens, and Light Source.
2.3. Construction and Enhancement of Retired Battery Dataset
On the image acquisition platform, image acquisition of retired batteries acquired from factories is carried out to obtain the original images of retired batteries, and the acquired lugs and case images are classified as defective or good, respectively. The images acquired are often interfered with by the complex external environment, and it is necessary to pre-process the images in order to improve the image quality. The original image has a resolution of 1280 × 1024. After removing the background and cropping in a way that the target subject occupies the majority of the image, all the images are uniformly resized to 224 × 224.
The image data augmentation primarily involves random flipping, random mirroring, and proportional scaling. The augmented lug dataset comprises a total of 800 images, consisting of 500 good and 300 defective images. Similarly, the case dataset comprises 500 images, with 300 good and 200 defective images.
3. Machine Learning-Based Appearance Filtering of Retired Batteries
This section provides an overview of the architectures of ResNet and the convolutional block attention module (CBAM), analyzes the results of CBAM-ResNet50 for appearance filtering of retired batteries, and compares and analyzes them with VGG16 [24] and AlexNet [25].
3.1. CBAM-ResNet50 Network Model Structure
With the development of convolutional neural networks, it has been found that the depth of the network model is critical to its own performance. Theoretically, the more layers the network model has, the better its performance, but experiments have demonstrated that as the neural network structure continues to deepen, the order of magnitude of the gradient changes dramatically after a number of layers of iterative operations, which may lead to gradient explosion and gradient vanishing problems [26]. To address this phenomenon, He et al. [27] introduced the concept of residual block, as shown in Figure 5. is the input to the residual structure, is the output of the first residual block before the function activation of the second layer, and denote the weights of the first and second residual block, and is the final output of the second residual block. The residual block solves the problem of gradient explosion and gradient vanishing in neural network training through shortcut connection, of which ResNet50 is one of the ResNet series models, and thanks to its excellent performance, ResNet50 is widely used in tasks such as image classification and target detection.
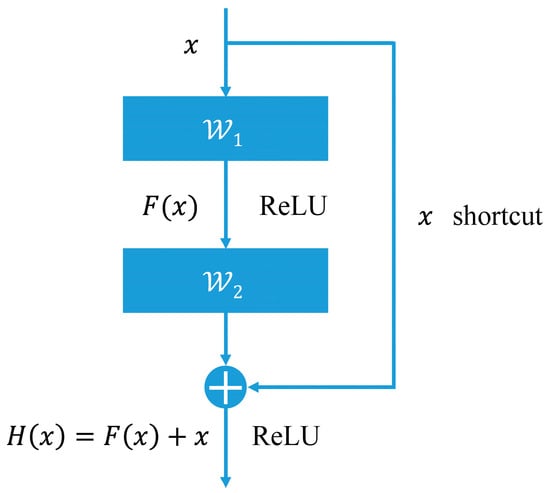
Figure 5.
Residual structure.
A single convolutional neural network has a limited ability to distinguish appearance defects of similar retired batteries, and the addition of a convolutional block attention module is a common approach to improve the accuracy of detection. CBAM is a lightweight, generalized attention mechanism for enhancing convolutional neural networks [28], as shown in Figure 6, which strengthens useful feature channels and spatial locations by learning the importance weights of the channels and spatial locations. Embedding the CBAM into a convolutional neural network improves the performance and generalization of the network.
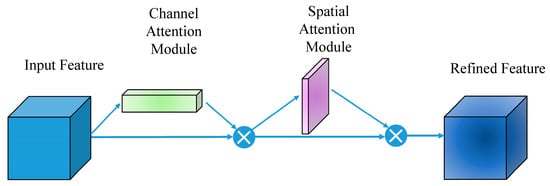
Figure 6.
CBAM module structure.
3.2. Experimental Configuration and Evaluation Metrics
This experiment is based on the Pytorch environment of Python under the Windows 10 system, and the graphics processing unit hardware used is a GeForce GTX 1050 Ti. In this experiment, accuracy, precision, recall, and F1 score are selected as the evaluation indexes of the CBAM-ResNet50 model for the appearance filtering results of retired batteries, and the specific formulas are as follows:
where , , , are the recognition results of the neural network, where is True Positive, indicating the number of positive batteries predicted to be positive, is False Positive, indicating the number of negative batteries predicted to be positive, is True Negative, indicating the number of negative batteries predicted to be negative, and is False Negative, indicating the number of positive batteries predicted to be negative.
3.3. Results and Analysis of Appearance Filtering Experiments
In order to verify the effectiveness of CBAM-ResNet50 on appearance filtering of retired batteries, VGG16 and AlexNet were constructed for comparison, and the model parameters’ batch size was set to 48, epoch to 100, and learning rate to 0.0001, with Adam optimizer and cross-entropy loss function. Table 3 shows the results of several methods of retired battery lug and case detection.
Table 3.
Results of the different methods of appearance detection.
In retired battery lug detection, due to the insertion of CBAM, the accuracy, precision, recall, and F1 score of the CBAM-ResNet50 model reached more than 96%, which was significantly improved compared to ResNet50. In case detection, the F1 score of the CBAM-ResNet50 model reaches 98.3%, which is significantly better than the other models due to the obvious shape characteristics of the case. The experimental results show that the CBAM-ResNet50 model has good accuracy in the appearance filtering of retired batteries, demonstrates high application value, and provides a good foundation for the next step of sorting and regrouping retired batteries.
4. Sorting Retired Batteries based on AHP and GRA
This section mainly introduces the indicators of retired batteries, selects capacity, internal resistance, and open-circuit voltage as the basis of sorting, and completes the sorting of retired batteries through AHP and GRA.
4.1. Selection of Evaluation Indicators of Retired Battery Performance
Due to different manufacturing processes and operating conditions, the internal parameters of retired batteries show inconsistency [29], and the impact of this inconsistency on echelon utilization is mainly reflected in the following three aspects:
- (1)
- Inconsistency of capacity parameters: inconsistent capacity of single batteries used in groups; when the lower capacity of one battery is fully charged, the others are still charging. It results in over-charging or over-discharging, which reduces the life of the battery pack.
- (2)
- Inconsistency of the internal resistance of the battery: the internal resistance of the battery leads to a large thermal loss, which deteriorates the battery’s performance in use. After the batteries are used in groups, it leads to a decline in the overall battery pack performance and causes safety problems.
- (3)
- Inconsistency of open-circuit voltage: the inconsistency of battery voltage leads to the charging of single batteries in the battery pack, and batteries with higher voltage charge batteries with lower voltage, which accelerates the degradation of the battery performance and depletion of the energy of the whole battery pack.
In order to improve the consistency of the batteries after regrouping, three indicators, namely, capacity, internal resistance, and open-circuit voltage, are chosen to evaluate, sort, and regroup the single batteries.
4.2. Analytic Hierarchy Process
AHP [30] is a multi-criteria decision-making method that combines qualitative and quantitative analysis. In this paper, the target layer is determined to be the performance of retired batteries, the guidelines layer is the battery performance, which contains security, energy conversion efficiency, and degradation rate, and the program layer is the battery indicator, which contains capacity, internal resistance, and open-circuit voltage, and the hierarchical analysis structure is shown in Figure 7.
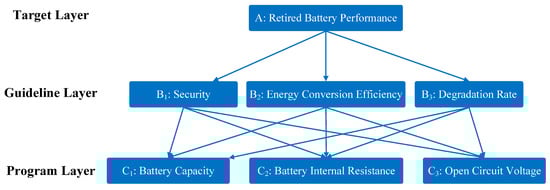
Figure 7.
Hierarchical structure of performance evaluation of retired batteries.
The AHP method constructs a judgment matrix by comparing the importance of two indicators with each other. Matrix A is the judgment matrix of the target layer and the guideline layer, where the element in matrix A represents the importance of i to j, which needs to meet the conditions of Equation (5). Table 4 shows the criteria assignments for dividing the importance level.
Table 4.
Distribution of importance among elements in a judgment matrix.
Based on the degree of influence between performances, five experts discussed and discussed the scores of each group of performances, and ultimately obtained the judgment matrix A as follows:
By analogy, the judgment matrices for the guideline layer are as follows, and is the degree of importance between indicators.
To ensure the reliability of the results, a consistency test of each judgment matrix is required:
where is the consistency index, is the consistency rate; is the maximum eigenvalue of the judgment matrix; is the order of the judgment matrix (the number of elements of the program layer), and is the degree of freedom index, taking the value of 0.58. When < 0.1, it is considered that the judgment matrix meets the consistency requirements. Table 5 shows the calculation results of the judgment matrix; the consistency rate of each judgment matrix is less than 0.1, which meets the consistency test standard.
Table 5.
Calculation results of judgment matrix.
After completing the construction and inspection of the judgment matrix, the weights of the target layer and the program layer can be calculated by weighting each layer, as shown in Table 6. The weights of battery capacity, internal resistance, and open-circuit voltage for battery performance are 0.3176, 0.4548, and 0.2276, respectively.
Table 6.
Weights of each performance indicator for retired batteries.
4.3. Gray Relation Analysis
GRA can quantitatively describe the degree of relative change between objects [31]; the basic idea is to set a set of optimal performance indicators of retired batteries as a reference sequence, with the measured value of the current battery performance as a comparative sequence, calculate the correlation between the comparative sequence and the reference sequence, and then classify the retired batteries according to the size of the correlation, and the correlation calculation steps are as follows:
- (1)
- Determine the optimal indicator values
Set the optimal values of capacity, internal resistance, and open-circuit voltage as 20 Ah, 1.5 mΩ, and 3.2 V, and form the optimal indicators set .
- (2)
- Dimensionless
Since the capacity and open-circuit voltage are gradually decreasing while the internal resistance is gradually increasing during the aging process of the battery, Equation (9) is used for dimensionless quantization of the capacity and open-circuit voltage indicators, and Equation (10) is used for dimensionless quantization of the internal resistance.
where represents the dimensionless value of the r-th indicator for the s-th battery. is the raw value of the r-th indicator for the s-th battery. represents the minimum value of performance for the r-th indicator in the original data, while represents the maximum value of performance for the r-th indicator, n represents the dimension of the indicator, value is 3, and m represents the number of batteries.
- (3)
- Calculation of correlation coefficient and correlation degree
The correlation coefficient between each indicator of the target to be evaluated and its corresponding optimal indicators is as follows:
where is the correlation coefficient between the r-th indicator of the s-th battery to be evaluated and its optimal indicator, is the optimal indicator value from vector , and takes the value of 0.5.
Therefore, the correlation coefficient between the s-th battery to be evaluated and the optimal indicator set is noted with and calculated as follows:
where is the number of evaluation indicators, value is 3; is the weight of the r-th indicator, and the results are shown in Table 6. The larger the correlation , the closer the indicators of the battery are to the optimal indicators, indicating better performance.
The correlation coefficients of 335 retired batteries are calculated according to the set of optimal indicators, and the results are shown in Table 7.
Table 7.
Correlation coefficients of retired batteries.
4.4. Sorting of Retired Batteries
Considering the actual application scenarios of retired batteries [9,10], the battery data are categorized into four categories based on the different correlations between retired batteries and new batteries, as shown in Table 8.
Table 8.
Classification levels of retired batteries based on the correlation degree.
Based on the correlation of the batteries, 335 retired batteries were categorized according to the criteria in Table 8, and the number of batteries belonging to categories A, B, C, and D were 21, 219, 88, and 7, respectively.
5. Regrouping of Retired Batteries Based on DBSCAN-GMM
After AHP and GRA, retired batteries are classified into four categories, A, B, C, and D. However, there are still large differences in each category, so the first three categories need to be regrouped into different clusters. To enhance the consistency of batteries after grouping, a clustering algorithm is utilized for batteries in Category A, Category B, and Category C. This algorithm groups individual batteries with similar characteristics into distinct clusters within each category, enabling subsequent series and parallel connections within a battery module or pack.
5.1. DBSCAN Algorithm and Gaussian Mixture Model
5.1.1. DBSCAN Algorithm
The DBSCAN algorithm is mainly based on density [32] without determining the number of clusters and recognizes outliers as noise. The main algorithm steps are as follows:
- (1)
- Input battery feature vectors set, which contains n-dimensional vectors of m batteries, and input the density threshold and the maximum radius .
- (2)
- Find the subset of neighborhood of all batteries; if the number of batteries in the subset is greater than or equal to , the battery is added to the core battery set; if it is not satisfied, the battery is marked as a noise point.
- (3)
- In the core battery collection, randomly select a battery, create a new set, add all batteries in its neighborhood to the cluster, and repeat the check of all batteries in the neighborhood of the battery in the cluster.
- (4)
- Randomly select an unselected battery in the updated core battery set, repeat step (3) until all batteries are selected, and output the segmentation results.
Although DBSCAN does not need to determine the number of clusters, it is less effective when the density of data clusters is not uniform [33].
5.1.2. Gaussian Mixture Model
GMM is a probabilistic-based clustering method [34], which is computed by iterative optimization using the expectation maximization (EM) algorithm [35]. The EM algorithm is an iterative approach to solving a special maximum likelihood problem. It aims to discover the maximum likelihood solution by introducing hidden variables and establishing the distribution of these hidden variables as a posterior distribution, conditioned on the observed variables.
In applying the GMM, it is assumed that the battery characteristic indicator has n features, which obey the Gaussian distribution of Equation (13):
where is the number of Gaussian models, which is the number of clusters determined by the DBSCAN algorithm, represents the weight coefficient of the i-th mixed model, and is the probability density distribution function, which is expressed as:
where parameter is the mean vector and is the covariance matrix, and Equation (19) gives its expression.
For the convenience of calculation, the hidden variable is introduced. When Equation (15) is satisfied, battery xj belongs to the i-th Gaussian distribution.
Taking the logarithm of the maximum likelihood function for the dataset when the hidden variables are known yields the log-likelihood function as shown in Equation (16):
5.2. DBSCAN-GMM Algorithm
The GMM algorithm requires prior knowledge of the number of clusters, and it introduces randomness during the selection of initial points. The algorithm’s iterative process can become complex and uncertain, with the EM algorithm being sensitive to initial parameters, potentially leading to local optima. In response to these challenges, this paper introduces a novel approach called the DBSCAN-GMM algorithm. It begins by utilizing the DBSCAN algorithm for initialization, followed by employing the EM algorithm for Gaussian model clustering once the centroids and model parameters have been established. The primary steps of this algorithm are illustrated in Figure 8, and its algorithmic procedure is as follows:
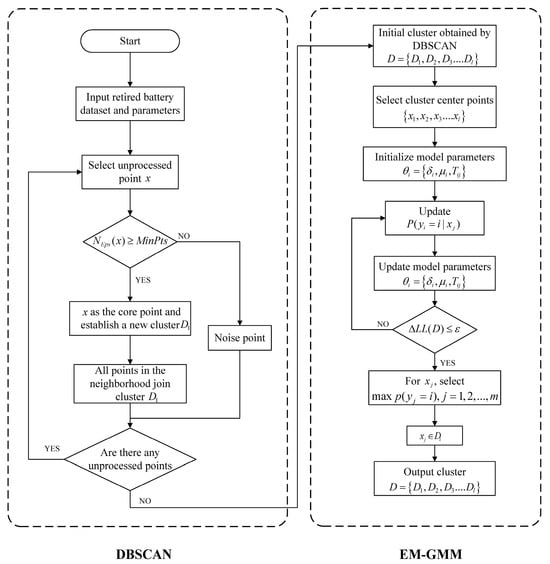
Figure 8.
Flowchart of DNSCAN-GMM algorithm.
- (1)
- Input battery feature vector date set and parameters , .
- (2)
- Based on the DBSCAN algorithm, the initial clustering cluster is obtained. By computing the mean vectors for cluster , the data vector closest to is selected as the center of the i-th cluster, resulting in cluster centers . The parameters’ set of the GMM model is then initialized with this information.
- (3)
- Substitute the retired battery dataset into the initialized model, and calculate the 1st to k-th Gaussian distribution probabilities for each battery in the dataset:
- (4)
- The retired battery dataset data points are weighted with the probabilities from step (3) and the parameters of each Gaussian model are calculated and updated:
- (5)
- Update the parameters of the GMM algorithm and then proceed to the next iteration, given a sufficiently small threshold , and after several repeated iterations, when the conditions of Equation (21) are satisfied, exit the loop iteration to obtain the final converged model parameters, is the change rate of the log-likelihood function, calculated using Equation (16).
- (6)
- For , select the largest , assign the batteries to their respective cluster , and finally get l clusters, the division of clusters for .
5.3. Evaluation Metrics and Clustering Results
Common clustering evaluation indexes include the silhouette index (SI), Davies–Bouldin index (DBI), and Krzanowski–Lai index (KLI) [36]. In order to verify the effectiveness and accuracy of the proposed algorithm, two indicators, SI and DBI, are chosen in this paper.
SI describes the compactness within clusters and the separateness between clusters; the larger SI is, the better the clustering effect, denoted as:
where is the average distance from battery to other batteries in the cluster, and is the minimum value of the average distance from battery to batteries in other clusters.
DBI represents the correlation between clusters by describing the spacing between the intra-cluster scatter of the batteries and the clustering centers, and the smaller the DBI, the better the clustering results, which is expressed as:
where is the number of clusters, denotes the average distance of all batteries in cluster to its clustering center, denotes the average distance of all battery points in cluster to its clustering center, and is the distance in clusters and .
The DBSCAN-GMM clustering algorithm was used to group similar batteries based on the three indicators of battery capacity, internal resistance, and open-circuit voltage; 21 retired batteries in Category A were divided into 2 groups; 219 retired batteries in Category B were divided into 5 groups; 88 retired batteries in Category C were divided into 5 groups, and the results of the grouping are shown in Figure 9.
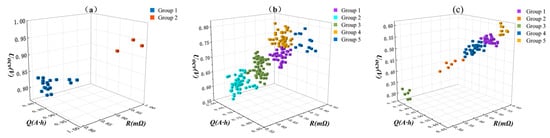
Figure 9.
Results of clustering and grouping of three types of batteries: (a) Category A batteries, (b) Category B batteries, (c) Category C batteries.
Table 9 shows the clustering results of different algorithms. For Category A, the SI of the proposed algorithm is 0.796, which is 34% and 28% higher than the two benchmark algorithms, and the DBI is 0.247, which is 41% and 38% lower than the two benchmark algorithms, respectively; in Category B and C batteries, the SI and DBI of the proposed algorithm are also better than the two benchmark algorithms, which show a higher accuracy and better clustering results.
Table 9.
Comparison of clustering results of different algorithms.
In order to judge the consistency between the batteries after clustering by different clustering algorithms, the maximum indicator difference of the batteries after clustering is calculated separately for each category of batteries, as shown in Table 10. The maximum capacity difference of the proposed algorithm is 1.89 Ah, the maximum internal resistance difference is 0.2 mΩ, and the maximum open-circuit voltage difference is 0.04 V after clustering of the batteries in Category A. Compared with the DBSCAN algorithm, the consistency of the capacity, the internal resistance, and the open-circuit voltage are improved by 10.8%, 9%, and 33%, respectively, and the consistency of the proposed algorithm is increased by 5.9%, 9%, and 20% compared to the GMM algorithm, respectively. The proposed algorithm also improves the inter-battery consistency to a different extent compared to the two benchmark algorithms grouped together in Category B and Category C.
Table 10.
Maximum indicator difference of battery module after clustering by different clustering algorithms.
6. Conclusions
In this study, an investigation was undertaken to explore techniques for appearance filtering, sorting, and regrouping of batteries in echelon utilization. The efficacy of the proposed scheme was substantiated through rigorous experimental validation, culminating in the following refined conclusions:
- (1)
- This research encompasses the broad spectrum of appearance filtering, sorting, and regrouping within the echelon utilization of retired batteries. By offering a solution that spans individual monomers to integrated modules, the study holds substantial practical value, underscoring its applicability across various domains.
- (2)
- The adoption of the CBAM-ResNet50 algorithm for appearance detection proved to be a pivotal advancement, surmounting the limitations of manual filtering. Notably, this approach facilitates simultaneous defect detection through dual imaging of retired batteries, addressing the imperative need for efficient appearance detection in large-scale scenarios.
- (3)
- Leveraging capacity, internal resistance, and open-circuit voltage as performance benchmarks, this study undertook the nuanced classification of retired batteries based on diverse application scenarios. The integration of AHP and GRA enabled a comprehensive and systematic classification approach.
- (4)
- The introduction of a novel hybrid clustering algorithm marked a significant breakthrough. Initialized by DBSCAN for classified batteries, this algorithm dynamically adjusts the number of clusters. Subsequently, it seamlessly integrates with the GMM, thereby elevating both clustering accuracy and algorithmic adaptability.
The echelon utilization scheme constructed in this paper is from the battery monomer level, and based on economic considerations, future research should focus on appearance filtering and sorting for module-level batteries.
Author Contributions
Conceptualization, F.L. and J.C.; formal analysis, F.L.; methodology, F.L.; project administration, D.Q. and T.W.; supervision, J.C.; validation, T.W.; writing—original draft, F.L.; writing—review and editing, F.L. and J.C. All authors have read and agreed to the published version of the manuscript.
Funding
This work was supported by the National Key R&D Program “New Energy Vehicles” of China (Project No.: 2018YFB0106204).
Data Availability Statement
Not applicable.
Conflicts of Interest
The authors declare no conflict of interest.
References
- Leijon, J.; Bostrom, C. Charging Electric Vehicles Today and in the Future. World Electr. Veh. J. 2022, 13, 139. [Google Scholar] [CrossRef]
- Guo, F.; Wu, X.; Liu, L.; Ye, J.; Wang, T.; Fu, L.; Wu, Y. Prediction of remaining useful life and state of health of lithium batteries based on time series feature and Savitzky-Golay filter combined with gated recurrent unit neural network. Energy 2023, 270, 126880. [Google Scholar] [CrossRef]
- Li, G.; Guo, S.; Xiang, B.; Mei, S.; Zheng, Y.; Zhang, X.; Gao, B.; Chu, P.K.; Huo, K. Recent advances and perspectives of microsized alloying-type porous anode materials in high- performance Li- and Na-ion batteries. Energy Mater. 2022, 2, 200020. [Google Scholar] [CrossRef]
- Ren, Y.; Fan, J.S.; Fu, Y.Z. Recent strategies for improving the performances of rechargeable lithium batteries with sulfur- and oxygen-based conversion cathodes. Energy Mater. 2022, 2, 300015. [Google Scholar] [CrossRef]
- Zhang, C.; Wei, Y.L.; Cao, P.F.; Lin, M.C. Energy storage system: Current studies on batteries and power condition system. Renew. Sustain. Energy Rev. 2018, 82, 3091–3106. [Google Scholar] [CrossRef]
- Kulova, T.L.; Fateev, V.N.; Seregina, E.A.; Grigoriev, A.S. A Brief Review of Post-Lithium-Ion Batteries. Int. J. Electrochem. Sci. 2020, 15, 7242–7259. [Google Scholar] [CrossRef]
- Sharma, P.; Naidu, R.C. Optimization techniques for grid-connected PV with retired EV batteries in centralized charging station with challenges and future possibilities: A review. Ain Shams Eng. J. 2023, 14, 101985. [Google Scholar] [CrossRef]
- Hu, X.; Deng, X.; Wang, F.; Deng, Z.; Lin, X.; Teodorescu, R.; Pecht, M.G. A Review of Second-Life Lithium-Ion Batteries for Stationary Energy Storage Applications. Proc. IEEE 2022, 110, 735–753. [Google Scholar] [CrossRef]
- Wang, N.; Garg, A.; Su, S.; Mou, J.; Gao, L.; Li, W. Echelon Utilization of Retired Power Lithium-Ion Batteries: Challenges and Prospects. Batteries 2022, 8, 96. [Google Scholar] [CrossRef]
- Akram, M.N.; Abdul-Kader, W. Sustainable Development Goals and End-of-Life Electric Vehicle Battery: Literature Review. Batteries 2023, 9, 353. [Google Scholar] [CrossRef]
- Schneider, E.L.; Kindlein Jr, W.; Souza, S.; Malfatti, C.F. Assessment and reuse of secondary batteries cells. J. Power Sources 2009, 189, 1264–1269. [Google Scholar] [CrossRef]
- Tian, G.; Yuan, G.; Aleksandrov, A.; Zhang, T.; Li, Z.; Fathollahi-Fard, A.M.; Ivanov, M. Recycling of spent Lithium-ion Batteries: A comprehensive review for identification of main challenges and future research trends. Sustain. Energy Technol. Assess. 2022, 53, 102447. [Google Scholar] [CrossRef]
- Zhou, L.; Garg, A.; Zheng, J.; Gao, L.; Oh, K.Y. Battery pack recycling challenges for the year 2030: Recommended solutions based on intelligent robotics for safe and efficient disassembly, residual energy detection, and secondary utilization. Energy Storage 2021, 3, e190. [Google Scholar] [CrossRef]
- Zhang, S.Z.; Tang, G.Z. Detection of The Wounds of The Battery Cathode Based on Machine Vision. In Proceedings of the 7th International Symposium on Computational Intelligence and Design (ISCID), Hangzhou, China, 13–14 December 2014. [Google Scholar]
- Lai, X.; Huang, Y.; Deng, C.; Gu, H.; Han, X.; Zheng, Y.; Ouyang, M. Sorting, regrouping, and echelon utilization of the large-scale retired lithium batteries: A critical review. Renew. Sustain. Energy Rev. 2021, 146, 111162. [Google Scholar] [CrossRef]
- Xiao, J.H.; Jiang, C.R.; Wang, B. A Review on Dynamic Recycling of Electric Vehicle Battery: Disassembly and Echelon Utilization. Batteries 2023, 9, 57. [Google Scholar] [CrossRef]
- Jiang, Y.; Jiang, J.; Zhang, C.; Zhang, W.; Gao, Y.; Guo, Q. Recognition of battery aging variations for LiFePO4 batteries in 2nd use applications combining incremental capacity analysis and statistical approaches. J. Power Sources 2017, 360, 180–188. [Google Scholar] [CrossRef]
- Lai, X.; Deng, C.; Li, J.; Zhu, Z.; Han, X.; Zheng, Y. Rapid Sorting and Regrouping of Retired Lithium-Ion Battery Modules for Echelon Utilization Based on Partial Charging Curves. IEEE Trans. Veh. Technol. 2021, 70, 1246–1254. [Google Scholar] [CrossRef]
- Wang, Y.; Liu, Z.; Ditta, A. Lithium-Ion Battery Screening by K-Means with DBSCAN for Denoising. CMC-Comput. Mater. Contin. 2020, 65, 2111–2122. [Google Scholar] [CrossRef]
- Jiang, Y.; Jiang, J.; Zhang, C.; Zhang, W.; Gao, Y.; Li, N. State of health estimation of second-life LiFePO4 batteries for energy storage applications. J. Clean. Prod. 2018, 205, 754–762. [Google Scholar] [CrossRef]
- Rohr, S.; Müller, S.; Baumann, M.; Kerler, M.; Ebert, F.; Kaden, D.; Lienkamp, M. Quantifying Uncertainties in Reusing Lithium-Ion Batteries from Electric Vehicles. In Proceedings of the 14th Global Conference on Sustainable Manufacturing (GCSM), Stellenbosch, South Africa, 3–5 October 2016; pp. 603–610. [Google Scholar]
- Chen, Z.; Deng, Y.; Li, H.; Liu, W.W. A sorting method of retired lithium-ion batteries using the improved k-means algorithm based on the incremental capacity curve. In Proceedings of the IEEE Vehicle Power and Propulsion Conference (VPPC), Merced, CA, USA, 1–4 November 2022. [Google Scholar]
- Liao, Q.; Mu, M.; Zhao, S.; Zhang, L.; Jiang, T.; Ye, J.; Shen, X.; Zhou, G. Performance assessment and classification of retired, lithium ion battery from electric vehicles for energy storage. Int. J. Hydrogen Energy 2017, 42, 18817–18823. [Google Scholar] [CrossRef]
- Simonyan, K.; Zisserman, A. Very Deep Convolutional Networks for Large-Scale Image Recognition. arXiv 2015, arXiv:1409.1556. [Google Scholar]
- Krizhevsky, A.; Sutskever, I.; Hinton, G.E. Imagenet classification with deep convolutional neural networks. In Advances in Neural Information Processing Systems; 2012; pp. 1097–1105. Available online: https://proceedings.neurips.cc/paper_files/paper/2012/file/c399862d3b9d6b76c8436e924a68c45b-Paper.pdf (accessed on 23 September 2023).
- Zhang, M.; Su, Y.; Hu, X. Small target detection based on faster R-CNN. Proc. SPIE 2023, 21, 5103. [Google Scholar] [CrossRef]
- He, K.; Zhang, X.; Ren, S.; Sun, J. Deep residual learning for image recognition. In Proceedings of the 2016 IEEE Conference on Computer Vision and Pattern Recognition, Las Vegas, NV, USA, 27–30 June 2016; IEEE: Piscataway, NJ, USA, 2016; pp. 770–778. [Google Scholar]
- Woo, S.; Park, J.; Lee, J.Y.; Kweon, I.S. CBAM: Convolutional block attention module. In Proceedings of the European Conference on Computer Vision(ECCV), Munich, Germany, 8–14 September 2018; pp. 3–19. [Google Scholar]
- Garg, A.; Yun, L.; Gao, L.; Putungan, D.B. Development of recycling strategy for large stacked systems: Experimental and machine learning approach to form reuse battery packs for secondary applications. J. Clean. Prod. 2020, 275, 124152. [Google Scholar] [CrossRef]
- Lee, S. Determination of Priority Weights under Multiattribute Decision-Making Situations: AHP versus Fuzzy AHP. J. Constr. Eng. Manag. 2015, 141, 05014015. [Google Scholar] [CrossRef]
- Kolhapure, R.; Shinde, V.; Kamble, V. Geometrical optimization of strain gauge force transducer using GRA method. Measurement 2017, 101, 111–117. [Google Scholar] [CrossRef]
- Lujun, W.; Jinyang, K.; Min, Z.; Aina, T.; Tiezhou, W.; Xiaoxing, Z.; Jiuchun, J. Efficient and Fast Active Equalization Method for Retired Battery Pack Using Wide Voltage Range Bidirectional Converter and DBSCAN Clustering Algorithm. IEEE Trans. Power Electron. 2022, 37, 13824–13833. [Google Scholar] [CrossRef]
- Yin, H.; Li, Y.; Kang, Y.; Zhang, C. A two-stage sorting method combining static and dynamic characteristics for retired lithium-ion battery echelon utilization. J. Energy Storage 2023, 64, 107178. [Google Scholar] [CrossRef]
- Hwang, J.B. Simple and trustworthy cluster-robust GMM inference. J. Econom. 2021, 222, 993–1023. [Google Scholar] [CrossRef]
- Barzycka, B.; Grabiec, M.; Jania, J.; Błaszczyk, M.; Pálsson, F.; Laska, M.; Ignatiuk, D.; Aðalgeirsdóttir, G. Comparison of Three Methods for Distinguishing Glacier Zones Using Satellite SAR Data. Remote Sens. 2023, 15, 690. [Google Scholar] [CrossRef]
- Jha, P.; Tiwari, A.; Bharill, N.; Ratnaparkhe, M.; Patel, O.P.; Harshith, N.; Solasa, S.L. A Novel Scalable Feature Extraction Approach for COVID-19 Protein Sequences and their Cluster Analysis with Kernelized Fuzzy Algorithm. In Proceedings of the IEEE International Conference on Big Data and Smart Computing (BigComp), Daegu, Republic of Korea, 17–20 January 2022; pp. 56–59. [Google Scholar]
Disclaimer/Publisher’s Note: The statements, opinions and data contained in all publications are solely those of the individual author(s) and contributor(s) and not of MDPI and/or the editor(s). MDPI and/or the editor(s) disclaim responsibility for any injury to people or property resulting from any ideas, methods, instructions or products referred to in the content. |
© 2023 by the authors. Licensee MDPI, Basel, Switzerland. This article is an open access article distributed under the terms and conditions of the Creative Commons Attribution (CC BY) license (https://creativecommons.org/licenses/by/4.0/).