Article

Digital Technology, Factor Allocation and Environmental Efficiency of Dairy Farms in China: Based on Carbon Emission Constraint Perspective

1
College of Economics and Management, Northeast Agricultural University, Harbin 150030, China
2
School of Economics and Management, Southeast University, Nanjing 211189, China
*
Author to whom correspondence should be addressed.
Sustainability 2023, 15(21), 15455; https://doi.org/10.3390/su152115455
Submission received: 27 September 2023 / Revised: 27 October 2023 / Accepted: 27 October 2023 / Published: 30 October 2023

Abstract

:
The emission of carbon pollutants stemming from dairy farms has emerged as a significant obstacle in mitigating the effects of global warming. China, being a prominent nation in the field of dairy farming, encounters significant challenges related to excessive component input and elevated environmental pollution. Digital technology presents an opportunity to enhance the factor allocation of dairy farms and thus increase their environmental efficiency. This study utilizes survey data from 278 dairy farms in China to examine the effect of digital technology on the allocation of land, labor, and capital variables in dairy farms. The IV-Probit model, IV-Tobit model, treatment effect model, and two-stage least square technique are employed to empirically analyze these impacts. Simultaneously, the intermediate effect model was employed to examine the mediating function of factor allocation in the effect of digital technology on environmental efficiency. The findings indicate that digital technology has the potential to greatly enhance land transfer and land utilization rates in dairy farms. Additionally, it has been observed that digital technology may lead to a decrease in both the proportion and time of labor input. Furthermore, digital technology has the potential to decrease short-term productive input while simultaneously enhancing long-term productive input within dairy farming operations. Digital technology has been found to have an indirect yet beneficial influence on environmental efficiency. This is mostly achieved through the facilitation of resource allocation, specifically in terms of land, labor, and capital aspects. The article presents a set of policy recommendations, including the promotion of extensive integration of digital technology within dairy farms, the facilitation of optimal allocation of production factors in dairy farms, and the implementation of specialized training programs focused on digital technology.

1. Introduction

The dairy farming industry is recognized as a significant contributor to environmental pollution in agriculture, hence impeding the progress of global low-carbon green development [1,2]. It is observed that approximately 15% of carbon emissions can be attributed to animal husbandry. Within the domain of animal husbandry, dairy farming specifically contributes to 20% of the total emissions [3]. China holds the distinction of being the foremost global contributor to carbon dioxide emissions [4], while also maintaining a significant presence in the realm of dairy farming on a global scale. According to recent data, it is projected that China’s dairy herd has reached 10.943 million head in 2021. Additionally, the milk output reached 36.827 million tons during the same period, reflecting year-on-year growth rates of 4.9% and 7.1%, respectively [5]. Nevertheless, the escalating issue of environmental pollution resulting from the emissions of cow dung and urine, as well as carbon dioxide emissions from intestinal fermentation, has grown more apparent. This has significantly intensified the challenges faced by China in its efforts to reduce carbon emissions in the agricultural sector [6,7]. The Chinese government formally announced the objective of attaining the apex of carbon dioxide emission before 2030 and accomplishing carbon neutrality by 2060, referred to as the “double carbon” aim [8,9]. “The Opinions on Promoting High-quality Development of Animal Husbandry”, issued by The General Office of the State Council, emphasizes the importance of fostering a new model of high-quality development in China’s animal husbandry sector. This model should prioritize efficient output, resource conservation, and environmental sustainability. “The Implementation Plan for Carbon Emission Reduction and Sequestration in Agriculture and Rural Areas” explicitly emphasizes the need to enhance the per unit yield of livestock and poultry, while concurrently mitigating greenhouse gas pollution emissions, such as those arising from the intestinal tract and fecal methane emissions of ruminants. Given the “double carbon” objective and the escalating pollution caused by cattle and poultry, it has become imperative to enhance environmental efficiency as a means of aligning dairy farming with environmental preservation [10]. The concept of environmental efficiency involves maximizing production while minimizing both factor input and environmental degradation. Within the confines of the “double carbon” objective, enhancing the environmental efficiency of dairy farms entails optimizing the production efficiency of such farms, therefore minimizing carbon emissions and maximizing output [11].
The inherent conflict between economic development and the availability of resources and preservation of the environment is primarily determined by how different production elements are allocated, combined, and utilized efficiently [12]. The dairy farming model in China always experiences instances of over-input and under-input of production parameters within dairy farms [13]. The low production efficiency and significant environmental pollution in Chinese dairy farms can be attributed to inadequate factor allocation [14]. Hence, the allocation of factors has emerged as a crucial determinant impacting environmental efficiency. The method of factor allocation aims to optimize resource use and increase the utility of resource allocation when faced with limited resources [15]. Factor allocation in dairy farms pertains to the precise allocation and efficient usage of capital, land, and labor, intending to optimize resource utilization and enhance the welfare of dairy farmers. The optimization of component allocation in dairy farms has the potential to achieve Pareto optimization by effectively combining production factors, leading to a reduction in excessive carbon pollution. This is a crucial aspect of enhancing environmental efficiency [16].
The constraints posed by limited dairy farming resources in China, coupled with regional disparities in factor endowments, necessitate a multifaceted approach to the development of dairy farms. Relying solely on resource factors for input is insufficient, thus highlighting the need for the advancement of novel technologies that enhance production efficiency and environmental sustainability [17]. Digital technology has the potential to facilitate the greening of resource utilization within the agricultural factor allocation system [18]. This can be achieved by reducing resource waste, enhancing output efficiency, and mitigating non-essential carbon source pollution [19]. Consequently, the adoption of digital technology in factor allocation can contribute to the improvement of environmental efficiency [20]. In 2022, the State Council released “The 14th Five-Year Plan for the Advancement of the Digital Economy”, emphasizing the need for extensive and profound integration of digital technologies across economic, social, and industrial sectors. Additionally, the plan highlights the imperative to significantly enhance the level of digitalization in the agricultural domain. “The 14th Five-Year Plan for National Agricultural Green Development” was released. It outlines the objective of advancing the digitalization of agricultural production and achieving a thorough transition towards environmentally sustainable agriculture. Digital technology has emerged as a significant strategy for addressing the disparity in agricultural variables, enhancing productivity, and mitigating carbon emissions and pollution [21,22,23]. Dairy farms can leverage digital technology to facilitate the digital processing of data and information about production factors at each stage. This enables a gradual understanding of the underlying relationships between production factors, milk yield, and carbon emission pollution in dairy farms. Such insights are beneficial for dairy farmers as they can enhance the input structure of production factors. The allocation of production components will progressively shift from production linkages with lower marginal benefits to those with higher marginal benefits. This will lead to greater optimization of the resource allocation and energy utilization structure. The reduction in environmental pollution resulting from the inequitable distribution of resources will lead to a substantial improvement in environmental efficiency.
Theoretical analyses have been conducted by several researchers to examine the effect of digital technology on component allocation and the environment [24,25,26,
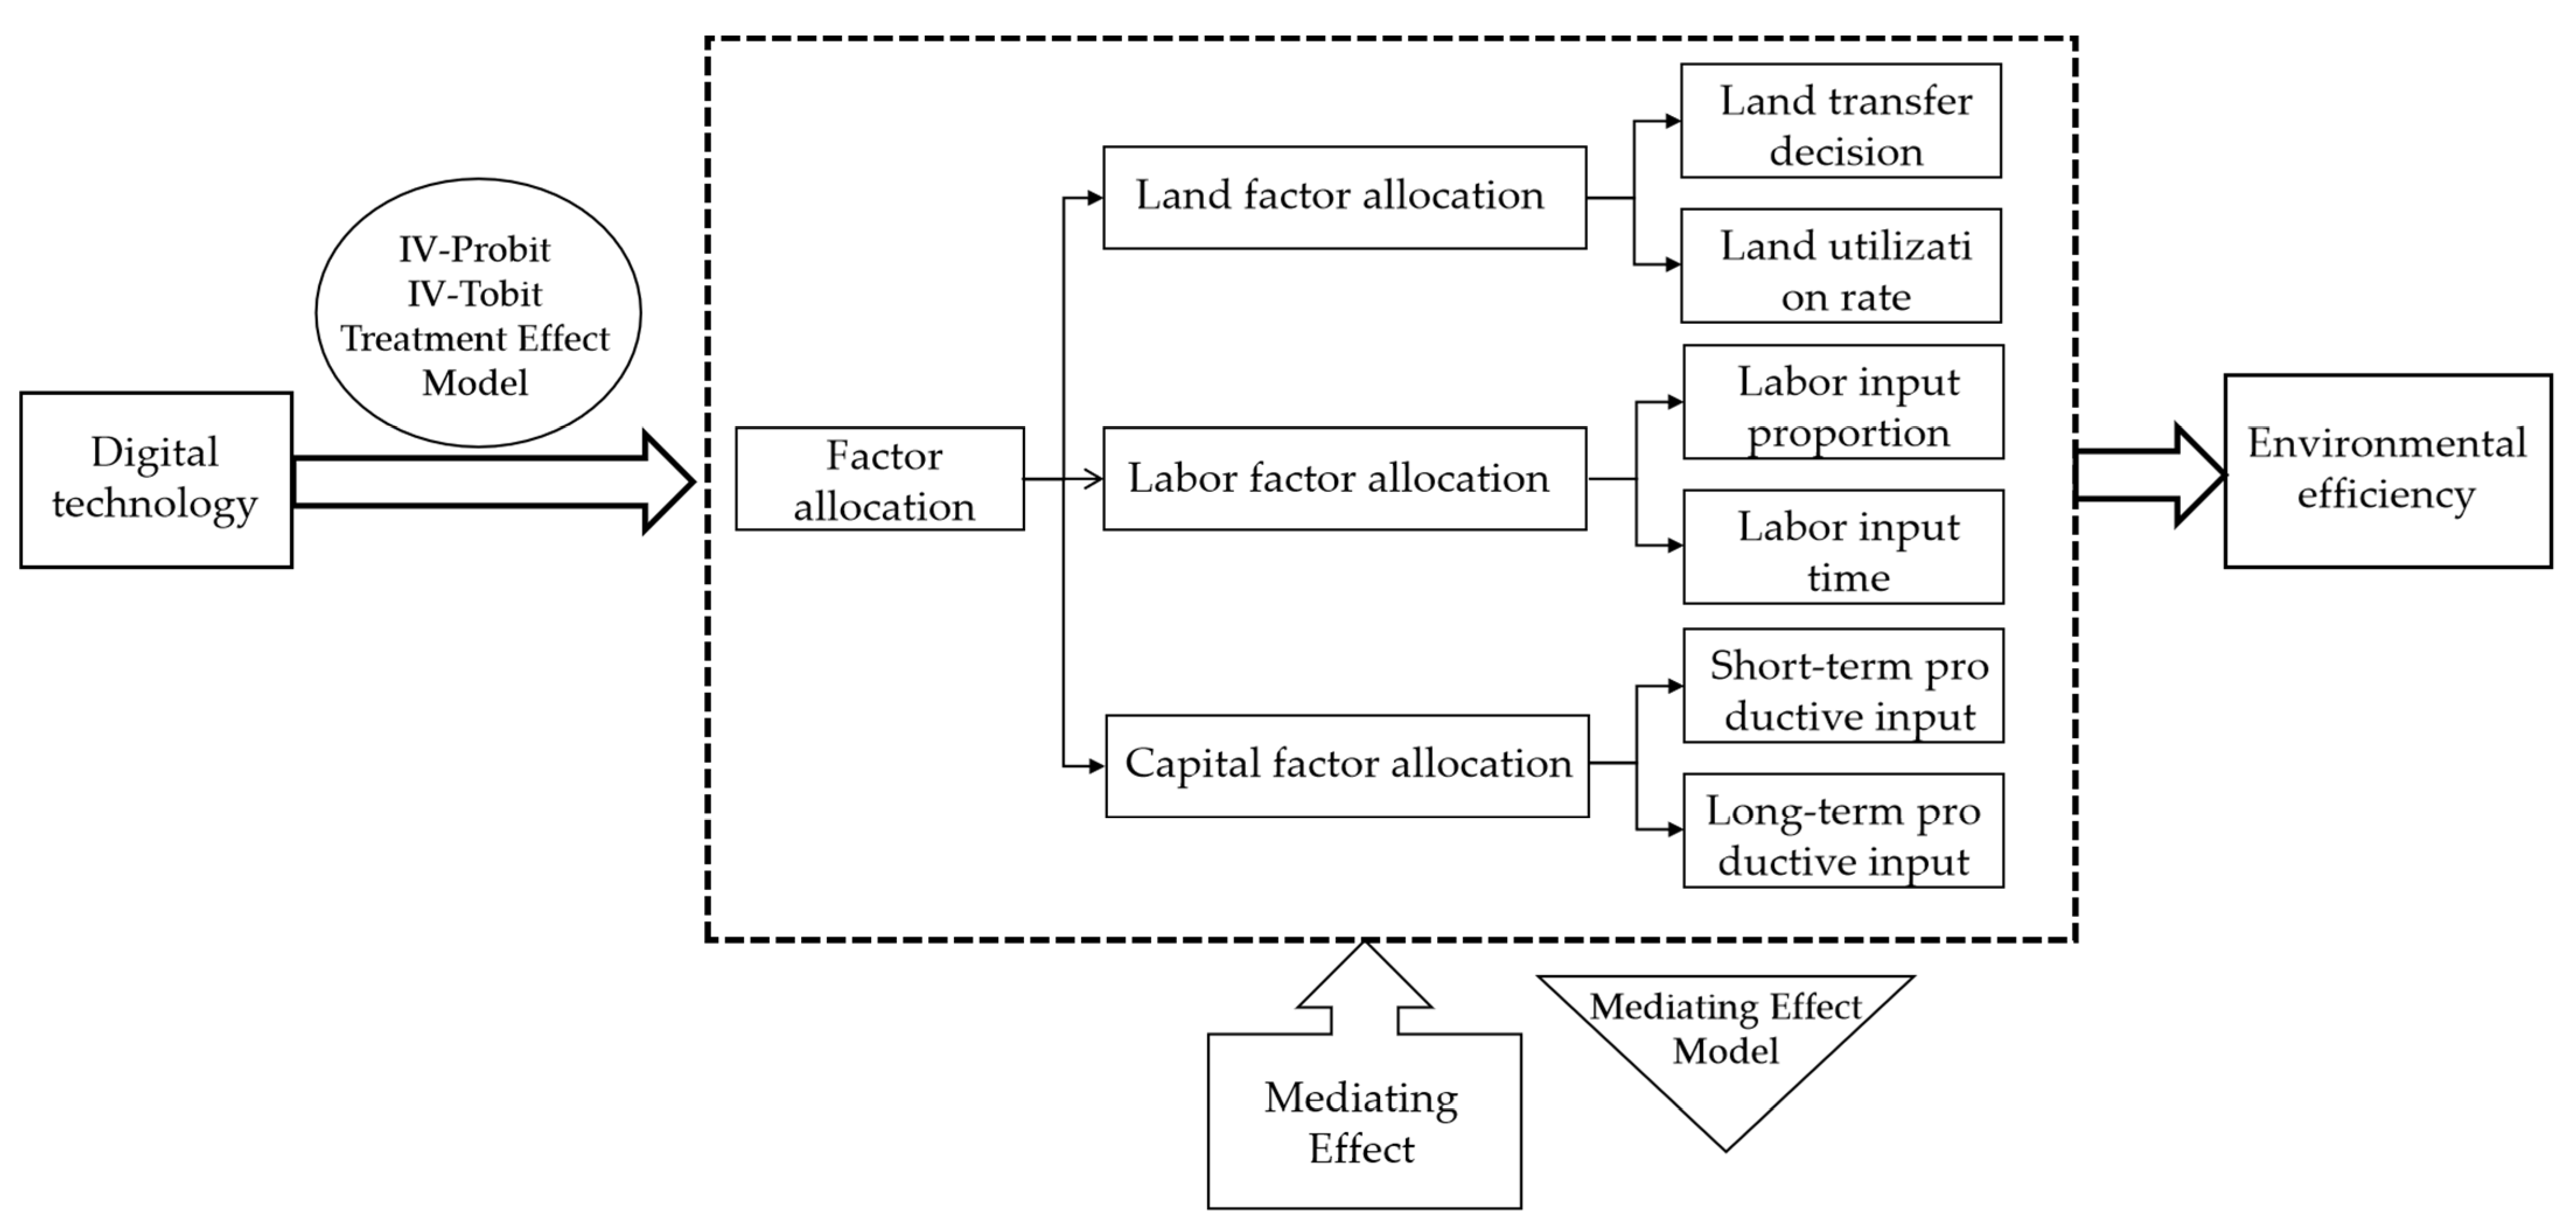
27]. However, there is a scarcity of empirical studies that investigate the specific action channel and transmission mechanism via which digital technology influences environmental efficiency. The effect of digital technology on factor allocation, particularly, is of significant importance. The effect of factor allocation on the environmental efficiency of dairy farms in relation to digital technology is a significant aspect to consider. This research aims to experimentally evaluate the dynamic interaction between digital technology, factor allocation, and environmental efficiency as a means to address the aforementioned issues. The study used the IV-Probit model, the IV-Tobit model, and the treatment effect model to assess the effect of digital technology on the allocation of resources. Furthermore, a theoretical framework was developed to examine the effect route of “digital technology-factor allocation-environmental efficiency”. The study employed the intermediate effect model to examine the effect of digital technology on factor allocation. Additionally, the intermediary effect model was utilized to empirically assess the function of factor allocation in the relationship between digital technology and environmental efficiency. The subsequent sections of this work are organized as follows. The subsequent section presents the theoretical framework and research hypothesis. The third section of the paper provides an introduction to the data source, outlines the process of variable selection, and establishes the model configuration. The fourth section of the paper presents the empirical findings and subsequent analysis. The fifth section of the study presents the research findings and offers policy recommendations.

2. Theoretical Basis and Research Hypothesis

The factor allocation of a dairy farm primarily entails the efficient allocation of three key production elements, namely land, labor, and capital. Digital technology in dairy farms, as a kind of agricultural technological advancement, has the potential to enhance regional production scale [28] and facilitate the commensurate increase in land allocation. Digital technology enables dairy farmers to effectively manage their dairy cows, while the strategic allocation of land in dairy farms may enhance the stocking density of dairy cows per unit area. Taking into account the postulation of the “rational economic man” theory [29], it can be inferred that dairy producers would progressively increase the magnitude of dairy farming operations until the land’s carrying capacity hits its maximum limit. In order to achieve the most effective distribution and productive exploitation of land resources in dairy farms, and to facilitate the enhancement of dairy farm production efficiency [30]. To enhance breeding income, dairy farmers should expand the land area of dairy farms to accommodate the growing number of dairy farms until they reach the maximum limit of land carrying capacity. This expansion facilitates the gradual formation of agglomeration effect and scale efficiency within dairy farms, resulting in reduced unit input costs for production factors and a significant decrease in pollution emissions. The factor that promotes the enhancement of both production efficiency and environmental efficiency has been identified [31].
Therefore, the paper suggests hypotheses as follows:
Hypothesis 1.
Digital technology has the potential to enhance decision-making processes for land transfer in dairy farms, leading to improved efficiency in land usage and facilitating the allocation of land elements.
Hypothesis 2.
The distribution of land factors serves as an intermediary mechanism in the effect of digital technology on environmental efficiency.
Digital technology has the potential to enhance the efficiency of labor capital allocation on dairy farms by mitigating temporal and spatial constraints, hence expanding employment and career opportunities for employees [32]. Digital technology could enhance the intelligence and modernization of dairy farming. It can also lead to a substantial substitution effect on the labor input [33], resulting in a reduction in labor requirements. Additionally, digital technology establishes a highly effective medium for communication among dairy farm workers. This serves to diminish the obstacles associated with disseminating contemporary agricultural knowledge and the intangible expenses related to exchanging information. Moreover, it facilitates the transmission of farming knowledge and encourages the sharing of information. Consequently, it enables swift enhancements in the labor skills and proficiency of dairy farm workers, thereby maximizing the inherent benefits of a skilled workforce. Dairy farms have recognized the shift in labor capital from a focus on quantity expansion to an emphasis on enhancing quality. This transition has facilitated the ongoing enhancement of labor efficiency [34], resulting in reduced labor requirements and overall labor duration within dairy farms. Consequently, this reduction in labor input costs has led to improved production efficiency and, correspondingly, enhanced environmental efficiency in dairy farming operations.
Therefore, the paper suggests hypotheses as follows:
Hypothesis 3.
Digital technology in dairy farms has the potential to decrease the proportion and duration of labor required, hence facilitating the efficient allocation of labor resources.
Hypothesis 4.
The allocation of labor factors serves as an intermediary mechanism in the effect of digital technology on environmental efficiency.
Digital technology, as a kind of technical advancement, has the potential to facilitate the efficient allocation of capital components, such as feed and energy, inside dairy farms. In the immediate term, the implementation of precise feed input and energy management in dairy farms can lead to cost savings in capital investment for dairy farming. Additionally, it can effectively mitigate excessive carbon emissions, thereby facilitating a mutually beneficial outcome of intensified dairy production and carbon emission reduction. The implementation of efficient resource allocation strategies, particularly in relation to feed and energy, can lead to substantial reductions in short-term agricultural production costs, specifically in terms of feed and energy expenses, within dairy farms. This, in turn, incentivizes farmers to decrease their short-term agricultural production investments. Additionally, such optimized resource allocation practices help mitigate the environmental effect of excessive factor input, specifically by reducing carbon emissions resulting from cow rumination and energy consumption. There is potential for enhancing both production efficiency and environmental efficiency [35]. Digital technology has the capacity to enhance the profitability and production efficiency of agricultural operations [36]. Simultaneously, it may effectively mitigate the financial limitations faced by farmers and establish favorable circumstances for productive investments. In contrast to conventional farming practices, digital technology enables the rational allocation of production factors. Additionally, it generates a labor substitution effect, leading to a gradual reduction in the long-term average cost of dairy farming. Consequently, this enhances production efficiency and profitability [37]. Dairy farmers, being rational economic actors, may choose to allocate the earnings generated from dairy farming towards the development of dairy farm infrastructure. This strategic reinvestment aims to facilitate the expansion of dairy farming operations and ultimately provide greater financial gains. To effectively address the demands posed by the extensive expansion of dairy farms, it is imperative to enhance the long-term productive investment in these farms. Concurrently, efforts should be made to gradually decrease the long-term average cost associated with dairy farming. One primary factor is the introduction of long-term productive investment, which establishes the fundamental prerequisites for the emergence of the “scale effect” and “agglomeration effect” within dairy farms. This leads to a reduction in the unit cost associated with dairy farming. Simultaneously, the steady enhancement of contemporary infrastructure and digital technological equipment in dairy farms is facilitated by sustained productive investment. The initial investment required for digital technology is substantial; however, it has the potential to consistently decrease the additional cost of production for producers [38]. This can facilitate the enhancement of production efficiency and the implementation of measures to control carbon emission pollution in dairy farms over an extended period. Consequently, it can drive the long-term improvement of environmental efficiency in dairy farms. The process flow chart is shown in Figure 1.
Therefore, the paper suggests hypotheses as follows:
Hypothesis 5.
Digital technology in dairy farms has the potential to decrease short-term productive input while simultaneously enhancing long-term productive input. This integration of technology enables the efficient allocation of capital components.
Hypothesis 6.
The allocation of capital factors serves as an intermediary mechanism in determining the effect of digital technology on environmental efficiency.

3. Methods and Data

3.1. Model Selection

3.1.1. IV-Probit and IV-Tobit Model

This study assesses the effect of digital technology on the allocation of land factors with the IV-Probit model and IV-Tobit model, specifically focusing on land transfer decisions and land utilization rates within these farms. The utilization of the ordinary least square approach in estimating the impact connection may introduce potential bias. The land transfer decision is a binary discrete variable, so the probit model was constructed to analyze the land transfer decision on dairy farms. The formula may be expressed in the following:
Y * = α 0 + β 1 D T i + β i X i + ε Y = 1 , Y * > 0 0 , Y * 0
Y* and Y represent the latent variables of land transfer decisions and actual behavior in dairy farms, respectively. a0 indicates a constant term. DTi represents the core explanatory variable of digital technology. Xi represents the control variable. ε indicates the residual of the model. The issue of endogeneity is a significant factor contributing to bias in estimates derived from models. Endogeneity of models can arise due to bidirectional causation, measurement error, selection bias, and the presence of missing variables. This research posits the existence of a bidirectional causal link between the utilization of digital technology and the decision-making process pertaining to land transfer. One potential benefit of incorporating digital technology in dairy farms is its potential to enhance decision-making processes related to land transfer. On the contrary, the conversion of dairy farm land may also enable the utilization of digital technologies for efficient land management and utilization. Hence, the primary explanatory factor examined in this study, digital technology, might potentially be an endogenous variable. To address the issue of endogeneity, this study introduced the variable “digital technology adoption ratio of other dairy farms in the same region” as an instrumental variable for digital technology. Subsequently, an IV-Probit model was constructed to estimate the effect of digital technology on land transfer decisions.
The values of land utilization rate fall between the range of 0 and 1, so classifying them as “restricted dependent variables”. To address the issue of limited dependent variables, the Tobit model is an appropriate method for resolution. This study employs the Tobit model to construct an empirical analytic framework examining the effect of digital technology on the land utilization rate. The formula may be expressed in the following:
Y = β 0 + i = 1 n β i X i + ε i , 0 Y 1 0 , Y < 0 o r Y > 1
Y indicates the land utilization rate in a dairy farm. The regression coefficient, denoted as βi, represents the relationship between the explanatory variable Xi and the error term, denoted as εi, which follows a normal distribution. To address the issue of endogeneity, this study still applied the variable “digital technology adoption ratio of other dairy farms in the same region” as an instrumental variable for digital technology. IV-Tobit model was constructed to estimate the effect of digital technology on land utilization rate. The formula may be expressed as follows:
Y i * = β x i + θ D T i + μ i D T i = ρ O D T i + γ x i + ε i Y i * = Y i , Y i * > 0 Y i * = 0 , Y i * < 0
Yi denotes the land utilization rate in dairy farms, while the variable DTi serves as the primary explanatory factor for digital technology. Additionally, the variable ODTi represents the application of digital technology in dairy farms within the same area and serves as the instrumental variable for this study. The symbol μi denotes the error term associated with digital technology, whereas ε indicates the error term associated with the deployment of digital technology within an identical geographical area. The IV-Tobit model presents an appropriate approach to address the issue of endogeneity when estimating the effect of digital technology on the land utilization rate.

3.1.2. Treatment Effect Model

This study used the treatment effect model to assess the effect of digital technology on the distribution of labor and capital resources within dairy farms. The propensity score matching (PSM) method is commonly employed as a means to address the issue of selectivity bias in the model. Nevertheless, the PSM method is limited to addressing the effect of visible elements inside the model, neglecting the influence of unobservable factors. The allocation of labor and capital in dairy farms is influenced by a combination of observable and unobservable variables, which introduces bias in the estimation findings derived by the propensity score matching approach. This study utilizes scholarly research to construct a treatment effect model [39]. The treatment effect model assesses the effect of digital technology on the allocation of labor and capital elements in dairy farms, taking into account both observable and unobservable factors. It examines the marginal effect and average treatment effect of digital technology. In contrast to the propensity score matching technique, the treatment effect model offers a more comprehensive estimation of the association between digital technology and the allocation of labor and capital factors.
The treatment effect model may be delineated into two distinct components. The initial phase involves formulating a selection equation to estimate the elements that influence the application of digital technology in this context. The selection equation formula may be expressed in the following manner:
D T i = 1 , D T i * > 0 0 , D T i * 0 D T i * = Z i β + μ i
The primary explanatory variable of dairy farm digital technology is denoted as DTi, while the latent variable utilized by dairy farm digital technology is represented as DTi*. The coefficient vector to be estimated is denoted as β, and the error term is denoted as μi. The second phase involves the establishment of an outcome equation to assess the influence of digital technologies on the allocation of labor and capital elements within dairy farms. The outcome formula may be expressed as follows:
Y i = X i β + D T i γ + ε i
The variable Yi denotes the dependent variables related to the allocation of labor and capital elements in dairy farms. Xi represents each independent control variable, while γ represents the vector of coefficients that are to be estimated. Lastly, εi represents the random error term. The treatment effect model necessitates the establishment of an instrumental variable that only impacts the utilization of digital technology within dairy farms while not influencing the allocation of labor and capital resources. In the present study, the variable denoting the percentage of other dairy farms within the same geographical region that employ digital technology continues to serve as the instrumental variable in assessing the effect of digital technology. The treatment effect model provides a clear means of demonstrating the marginal effect of digital technology on the distribution of labor and capital resources within dairy farms. To comprehensively assess the effect of digital technology on the allocation of labor and capital factors in dairy farms, it is imperative to compute the average treatment effect by estimating the treatment effect model. The formula is as follows:
A T E = E ( Y i D T i = 1 ) E ( Y i D T i = 0 )
This study examines the distribution of labor and capital factors that apply digital technology, as well as those that do not apply such technology. The utilization of the average processing impact serves to mitigate the bias arising from both observable and unobservable components. Consequently, this approach enhances the accuracy of digital technology in estimating the allocation of elements within dairy farms.

3.1.3. Mediating Effect Model

This research applies the concept of factor allocation as a mediating mechanism in examining the effect of digital technology on environmental efficiency. Digital technology is anticipated to alter the distribution of resources within dairy farms. This factor allocation, in turn, has the potential to influence the environmental efficiency of these farms. It can be inferred that digital technology may contribute to an enhancement in environmental efficiency by means of intermediary factor allocation. The mediating effect model is applied to examine the mediating effect of digital technology on environmental efficiency. The model is constructed as follows:
Y i = a 0 + a 1 D T i + a 2 X i + ε 1 Z i = b 0 + b 1 D T i + b 2 X i + ε 2 Y i = c 0 + c 1 D T i + c 2 Z i + c 3 X i + ε 3
In Equation (7), Yi indicates the environmental efficiency, DTi indicates the value of digital technology, Zi represents the factor allocation of the dairy farm, and Xi represents additional control factors such as dairy farm scale and breeding experience. The constant variables in the equation are denoted as a0, b0, and c0. The coefficients to be estimated are represented as a1, a2, b1, b2, c1, c2 and c3. The error terms are shown as ε1, ε2 and ε3. a1 represents the overall effect of digital technology on the enhancement of environmental efficiency. b1 denotes the influence of digital technology on the allocation of factors. c1 signifies the direct effect of digital technology on environmental efficiency while considering the variables related to factor allocation. The intermediary effect is calculated as the multiplication of coefficients b1c2, representing the indirect effect of digital technology on environmental efficiency through factor allocation. c2 represents the effect of factor allocation on environmental efficiency while controlling for digital technology. This study employed the sequential test analysis method of stepwise regression and the bootstrap method to assess the statistical significance of the intermediate effect.

3.2. Data Source

The results were obtained from a micro survey conducted by our study group on dairy farms in Heilongjiang Province between January and July 2023. The chosen regions encompassed the primary distribution zones of dairy farms within Heilongjiang Province, serving as representative indicators of the broader dairy farm production landscape. Stratified and random sampling methods were used to select dairy farms for the survey, which included three types of dairy farms: small-scale, medium-scale, and large-scale. Therefore, dairy farms surveyed in this paper can basically represent the overall situation of dairy farms in China. The samples were delivered to various cities like Suihua City, Harbin City, Qiqihar City, Heihe City, Daqing City, Jiamusi City, Jixi City, Hegang City, Mudanjiang City, and so on. The dairy farms surveyed were mainly located in village and township areas far from the main urban areas, where the farmland, grassland, and construction land are vast and cheap. The structure of agricultural products is mainly composed of soya beans, wheat, maize, and rice in the survey area, which provide abundant feed and raw materials for dairy farming. A total of 291 questionnaires were gathered through the utilization of scientific random sampling and multi-layer sampling techniques. After excluding samples containing outliers and incomplete data, a total of 278 valid samples remained. The location and scope of the survey area are shown in Figure 2.

3.3. Variable Selection

(1)
Explained variable: The environmental efficiency of dairy farms. This paper draws on scholarly research [17] to examine various input variables in dairy farms, including roughage input, concentrate feed input, fixed asset input cost, water and electricity fuel cost, and medical and epidemic prevention cost. The expected output is milk production, while the non-expected output is carbon emissions. The environmental efficiency of dairy farms may be conducted using the Undesirable Outputs-SBM model.
(2)
Explanatory variable: Digital technology refers to the use of electronic devices and systems that operate on binary code, enabling the processing, storage, and transmission of This study assesses the digital technology based on the criterion of whether or not dairy farms utilize such technology. A binary value of 1 is allocated to signify the utilization of digital technology in a dairy farm, whereas a binary value of 0 is assigned to indicate the absence of such technology.
(3)
Intermediary variable: The concept of factor allocation refers to the process of distributing resources or inputs among different factors of production in order to maximize efficiency and productivity. In the realm of agriculture, factors of production encompass the fundamental material resources that are necessary for sustaining agricultural progress. These factors typically encompass three key components: labor, land, and capital. In the context of dairy cow farms, the allocation of factors is primarily categorized into three components: land factor allocation, labor factor allocation, and capital factor allocation. The analysis of land factor allocation encompasses two key dimensions: the land transfer decision and the land utilization rate. Land transfer decision refers to the behavior of dairy farmers to transfer land to expand the scale of their farms. The land transfer decision is the basis for further expansion of dairy farms, and it can make full use of the unused land resources around dairy farms to achieve a rational allocation of land elements. The decision of land transfer is assessed based on the expansion of the dairy farm’s land scale, while the land utilization rate is evaluated by the proportion of the dairy farm’s land area to the overall land area. The analysis of labor factor allocation was conducted considering two dimensions: the labor input proportion and the labor input time. These dimensions were assessed by examining the ratio of individuals involved in dairy farming to the overall labor force within a household, as well as the average amount of time dedicated to labor input per cow. The allocation of capital factors in dairy farms primarily encompasses the allocation of short-term productive inputs and long-term productive inputs. The former is measured by the production and operational inputs of dairy farms, while the latter pertains to the inclination to invest in fixed assets, such as large-scale breeding machinery, in the future.
(4)
Control variables: This work provides a summary of the control factors categorized into three groups: household head characteristics, family characteristics, and organizational characteristics, as identified by researchers [40,41,42]. The attributes associated with the head of home encompass several factors such as educational attainment, age, village cadres, breeding experience, risk perception, and technical training of dairy farmers. Household characteristics encompass several factors such as the household registration type, the composition of income, and the endowment of household labor. Organizational aspects pertain to the dairy farm’s involvement in a cooperative.
(5)
Instrumental variables: This article has chosen the “digital technology adoption ratio of other dairy farms in the same region” as the instrumental variable, based on scholarly research [43,44]. In the same geographical area, the adoption of digital technology by a particular dairy farmer might influence other dairy farmers to also embrace digital technology for their production processes. Consequently, the use of digital technology by other dairy farmers is associated with explanatory factors. Furthermore, the utilization of digital technology by fellow dairy farmers does not have a direct impact on the environmental efficiency of the specific dairy farmer in question, hence adhering to the requirement of exclusivity in instrumental variables. Hence, the utilization of digital technology inside dairy farms in the aforementioned area might be considered a viable instrumental variable. Table 1 presents the depiction and statistical summary of each variable.

4. Results and Discussions

4.1. Multicollinearity Test

To mitigate the issue of multicollinearity across variables, this study used the variance inflation factor (VIF) approach to perform a multicollinearity test. The test results are presented in Table 2. The expansion factor of each variable in the regression equation is found to be less than 10, suggesting the absence of multicollinearity among the variables.

4.2. Effect of Digital Technology on Factor Allocation in Dairy Farm

4.2.1. Effect of Digital Technology on Land Factor Allocation in Dairy Farm

This article used the IV-Probit model and IV-Tobit model to assess the effect of digital technology on the allocation of land resources in dairy farms. The estimated outcomes are presented in Table 3. The regression findings indicate a statistically significant and favorable relationship between digital technology and land transfer choice as well as land utilization rate in dairy farms.
The regression coefficient for digital technology in the Probit model is estimated to be 0.6644, with a statistically significant level of 1%. This suggests that as the application level of digital technology increases by 1%, the chance of land transfer is expected to increase by 0.6644%. Nevertheless, it is important to acknowledge that the Probit model is susceptible to endogeneity issues arising from sample selection bias, which can potentially introduce bias into the estimated findings of the model. Hence, the IV-Probit model is proposed in this study as a means to address the issue of endogeneity. The findings from the IV-Probit model indicate that the regression coefficient representing the effect of digital technology on the choice to transfer land in dairy farming is estimated to be 0.8912. This coefficient is somewhat greater than the coefficient obtained from the Tobit model and is statistically significant at the 1% level. This suggests that the adoption of digital technology inside dairy farms might effectively facilitate land transfer, therefore establishing a basis for farmers to attain economies of scale. The land transfer choice of dairy farms is positively influenced by control factors such as technical training, cooperative participation, and family labor endowment. There is a positive correlation between the size of dairy farmers’ families and the likelihood of engaging in land transfer activities to expand their agricultural operations and enhance their revenue levels increases accordingly. The technical proficiency of dairy farmers has been significantly enhanced by their engagement in technical training programs and cooperatives. Consequently, they are more motivated to transition their operations to larger land areas in order to accommodate the demands of large-scale dairy farming.
The regression coefficients for digital technology in the Tobit model and IV-Tobit model are 0.1762 and 0.1985, respectively. Both values are statistically significant at the 1% level. This finding suggests that the implementation of digital technology inside dairy farms has the potential to greatly enhance the efficiency of land utilization and facilitate the optimal exploitation of land resources in such farms. Regarding the effect of control factors, the IV-Tobit model revealed that variables such as education attainment, age, breeding experience, technical training, cooperatives, and household registration types had a statistically significant positive effect on land usage rate at a significance level of 1%. The age and experience of dairy farmers positively correlate with their ability to optimize land resources for dairy farming, resulting in a notable increase in land usage efficiency on dairy farms. The positive correlation observed between household registration type and land utilization rate of dairy farms may be attributed to the advantageous circumstances experienced by dairy farmers residing in urban areas. These circumstances include enhanced accessibility to contemporary breeding information and knowledge, which in turn facilitates the expansion of breeding scale and improvement of land utilization rate within dairy farms. Hypothesis 1 has been confirmed.

4.2.2. The Effect of Digital Technology on Labor Factor Allocation in Dairy Farms

This study employs the treatment effect model to assess the effect of digital technology on the allocation of labor factors. The estimated outcomes are presented in Table 4. The findings indicate that digital technology in dairy farms has a notable adverse effect on both the proportion and duration of labor input. The output equation reveals that the regression coefficient of digital technology on the proportion of labor input is −0.2622, indicating statistical significance at the 1% level. This finding suggests that the utilization of digital technology in dairy farms is associated with a reduced proportion of labor input compared to dairy farms that do not employ digital technology. A positive correlation exists between the application of digital technology in dairy farms and the corresponding decrease in the proportion of labor input in these farms, with a fall of 0.2622% seen for every 1% rise in digital technology usage. This study examines the influence of digital technology on the number of worker input hours. The regression coefficient for the effect of digital technology on labor input time in dairy farming is estimated to be −0.0344, indicating a statistically significant relationship at the 1% level. This finding suggests that digital technology within dairy farms has the potential to substantially reduce the amount of time required for manual input. One potential explanation for this phenomenon is that digital technology has resulted in the displacement of a portion of the workforce and the subsequent reduction in labor hours required. Hypothesis 3 has been confirmed.

4.2.3. Effect of Digital Technology on Capital Factor Allocation in Dairy Farms

Table 5 displays the projected outcomes pertaining to the influence of digital technology on the distribution of capital factors. The regression coefficients for the effect of digital technology on the short-term and long-term productive input of dairy farms are −0.0524 and 0.4484, respectively. Both values are statistically significant at the 1% level. This finding suggests that the adoption of digital technology has the potential to decrease immediate input requirements while simultaneously enhancing long-term productivity in dairy farming operations. The potential factors may be attributed to the fact that the employment of digital technology in dairy farms enables precise and efficient resource management, leading to a reduction in immediate input requirements for dairy farming. In contrast, digital technology has been found to facilitate the enhancement of breeding income and breeding scale. This, in turn, encourages farmers to acquire large-scale breeding equipment to fulfill the enduring production requirements of dairy farms, thereby resulting in a notable augmentation of long-term productive input in such establishments. Hypothesis 5 has been confirmed.

4.3. The Effect of Digital Technology on the Environmental Efficiency in Dairy Farms under the Mediation of Factor Allocation

4.3.1. The Effect of Digital Technology on Environmental Efficiency in Dairy Farms under the Intermediary Role of Land Factor Allocation

This study used the stepwise regression technique to examine the mediating role of land factor allocation in the relationship between digital technology and environmental efficiency. The estimated outcomes of this analysis are presented in Table 6. The results demonstrate a statistically significant positive relationship between digital technologies and the environmental efficiency of dairy farms. In the context of regression analysis, it is seen that the regression coefficients associated with digital technology and land transfer decisions are both statistically significant and positive. This suggests that the land transfer decision acts as an intermediary factor in the relationship between digital technology and environmental efficiency. In the regression analysis conducted in regressions (5) and (6), it was seen that the regression coefficients associated with digital technology and land use rate exhibited a statistically significant positive relationship at a significance level of 1%. This suggests that land utilization rate played an intermediate role in the relationship being examined. Based on the stepwise method test process, the regression analysis reveals that variables a1, b1, c1, and c2 exhibit statistical significance. Furthermore, the positive relationship between b1c2 and c1 is found to be statistically significant. These findings suggest that the allocation of land factors partially mediates the influence of digital technology on environmental efficiency. Digital technology not only exhibits a direct influence on environmental efficiency but also yields a favorable impact on land utilization rate. Furthermore, it may be argued that this phenomenon also yields an indirect beneficial influence on environmental efficiency through the facilitation of land transfer and enhancement of land usage rates. The coefficients associated with the land transfer decision and the land utilization rate intermediate path are 0.0117 and 0.1109, respectively. Hypothesis 2 has been confirmed.

4.3.2. The Effect of Digital Technology on Environmental Efficiency in Dairy Farms under the Intermediary Role of Labor Factor Allocation

Table 7 displays the projected outcomes pertaining to the effect of digital technology on environmental efficiency, taking into account the intermediate function played by labor factor allocation. The regression results indicate that in regression (8) and regression (11), the regression coefficients associated with digital technology exhibit a statistically significant negative relationship at the 1% level. Conversely, in regression (9) and regression (12), the regression coefficients of digital technology demonstrate a statistically significant positive relationship. Additionally, both b1c2 and c1 exhibit statistically significant positive relationships. This finding suggests that the distribution of labor factors has a mediating role in the relationship between digital technology and environmental efficiency. Digital technology has led to enhanced environmental efficiency through the reduction in labor input in terms of both percentage and time. The labor input ratio coefficient was determined to be 0.1715, while the labor input duration coefficient was found to be 0.1243. Hypothesis 4 has been confirmed.

4.3.3. The Effect of Digital Technology on Environmental Efficiency in Dairy Farms under the Intermediary Role of Capital Factor Allocation

Table 8 displays the projected outcomes pertaining to the effect of digital technology and capital factor allocation on environmental efficiency. The estimated regression coefficient for the effect of digital technology on the short-term productive input of a dairy farm is −0.0363 in regression (14). This coefficient is found to be statistically significant at the 1% level of significance. This suggests that digital technology has the potential to considerably decrease short-term productive input in dairy farms, potentially due to its ability to facilitate precise feeding practices and lower input expenses like as feed and gasoline. In regression (15), the regression coefficients for digital technology and short-term productive input were determined to be 0.1223 and −0.2806, respectively. It is worth noting that both coefficients were found to be statistically significant at a significance level of 1%. This suggests that digital technology has the potential to enhance environmental efficiency through the reduction in short-term productive input. In other words, short-term productive input serves as an intermediary factor in the relationship between digital technology and the environmental efficiency of dairy farms. Regression (17) and regression (18) revealed a statistically significant positive relationship between digital technology and long-term productive input. This suggests that digital technology has the potential to enhance environmental efficiency by increasing long-term productive input. To clarify, the long-term productive inputs serve as a mediating factor in the effect of digital technology on environmental efficiency. The coefficients of intermediation for short-term productive input and long-term productive input were 0.0102 and 0.0122, respectively. Hypothesis 6 has been confirmed.

4.4. Robustness Test

4.4.1. Two-Stage Least Squares Test

This study used the two-stage least squares (2SLS) approach to examine the robustness of the effect of digital technology on the allocation of factors in dairy farms. The estimated outcomes are presented in Table 9. Digital technology has been shown to have a favorable influence on land transfer decisions, land utilization rates, and long-term productive input. Conversely, it has been observed to have a notable negative impact on the proportion of labor input, labor input time, and short-term productive input in dairy farms. The projected findings demonstrate a high degree of consistency with the prior research. The result validates Hypothesis 1, 3, and 5 again.

4.4.2. Bootstrap Mediation Effect Test

To examine the robustness of the mediating effect of factor allocation, the study employed the Bootstrap technique. This approach was utilized to assess the mediating effect of factor allocation on the effect of digital technology on environmental efficiency. The regression results are presented in Table 10. The 95% confidence interval for the direct effect coefficient of digital technology on environmental efficiency does not include zero. Similarly, the 95% confidence interval for the path coefficients of land factor allocation, labor factor allocation, and capital factor allocation in the indirect effect also does not include zero. These findings suggest that the direct effect of digital technology on environmental efficiency is statistically significant. The significance of the three distinct intermediate effects, namely land factor allocation, labor factor allocation, and capital factor allocation, cannot be understated. In summary, the findings yielded by the Bootstrap intermediary effect test approach align with those obtained by the aforementioned stepwise regression method, further confirming the mediating influence of factor allocation in digital technology on environmental efficiency. Hypotheses 2, 4, and 6 were reconfirmed.

5. Conclusions and Recommendations

5.1. Conclusions

This study utilizes survey data collected from Chinese dairy farms between January and July 2023. It employs several econometric models, including the IV-Probit model, IV-Tobit model, treatment effect model, and two-stage least square technique, to conduct a complete empirical analysis of the effect of digital technology on factor allocation. The study employed the stepwise regression approach and Bootstrap method to develop an intermediate effect model, aiming to examine the mediating function of factor allocation in the relationship between digital technology and environmental efficiency. The primary findings may be summarized as follows: digital technology exerts a substantial influence on factor allocation. Digital technology has been found to have a statistically significant beneficial influence on land transfer and land use in dairy farms, as determined by a significance threshold of 1%. Digital technology exhibits a noteworthy inverse relationship with the allocation of labor factors, specifically in terms of the proportion of labor input and labor input time. The application of digital technology in the allocation of capital factors can provide dairy farms with the opportunity to reduce short-term production inputs while also facilitating the expansion of long-term production inputs, hence enabling the achievement of economies of scale. Factor allocation plays a vital role in mediating the effect of digital technology on environmental efficiency. Digital technology indirectly contributes to enhancing environmental efficiency through the facilitation of optimal allocation of land, labor, and capital factors. The coefficients associated with the incorporation of land transfer decision and the mediating path of land utilization rate are 0.0117 and 0.1109, respectively. The mediating coefficients for the labor input proportion and labor input time are 0.1715 and 0.1243, respectively. The intermediation coefficients for short-term and long-term productive inputs are 0.0102 and 0.0122, respectively.

5.2. Policy Recommendations

Based on the research findings, this report presents three policy recommendations. First and foremost, it is imperative to place significant emphasis on the advancement of digital technology and facilitate the profound integration of digital technology into dairy farms. In 2020, the European Union implemented the “Farm to Table” strategy, which places a high priority on the application of digital technologies in the agricultural sector. It has already achieved success in the dairy farms. Germany has created digital dairy farming monitoring technology, which can monitor the information of cows’ conception and send the monitoring information to farmers. The Netherlands has developed a computerized feeding management system based on the automatic identification of individual cow numbers, which enables the automatic feeding of cows. The promotion of digital technology should be prioritized by the government as a development strategy in China. This entails a constant reduction in pollution-type factor input within these farms, as well as an enhancement of the factor input structure to its fullest potential. The government may further facilitate the sustainable growth of dairy farms. Furthermore, it is essential to fully use the synergistic potential of digital technology in conjunction with land, labor, and capital within dairy farms, hence facilitating the best allocation of production components in such agricultural settings. Digital technology has the potential to address the resource disparity prevalent in dairy farms, therefore, enhancing the environmental efficacy of such establishments. The agriculture sector must enhance its backing for the use of digital technology inside dairy farms, provide preferential support policies for dairy farms that refrain from utilizing digital technology, and actively encourage the digitalization process within dairy farms. Furthermore, it is imperative to provide specialized training programs focused on the utilization of digital technologies within dairy farming operations. In order to enhance the proficiency and efficacy of dairy farmers in utilizing digital technology, it is proposed to conduct digital technology training, with a specific focus on augmenting the digital skills training of large-scale dairy farms. Additionally, the establishment of digital technology resource-sharing platforms for dairy farms needs to be promoted. This initiative aims to leverage the application of digital technology in dairy farms and facilitate the overall development of the sector.

Author Contributions

Conceptualization, C.L. (Chenyang Liu) and X.S.; Methodology, C.L. (Chenyang Liu) and X.S.; Software, X.S.; Validation, C.L. (Chenyang Liu); Formal Analysis, X.S.; Resources, C.L. (Cuixia Li); Data Curation, C.L. (Chenyang Liu) and X.S.; Writing—Original Draft Preparation, C.L. (Chenyang Liu); Writing—Review and Editing, X.S.; Funding Acquisition, C.L. (Cuixia Li). All authors have read and agreed to the published version of the manuscript.

Funding

This research was funded by the National Natural Science Foundation of China (grant number 71673042), Propaganda Department of CCCPC (Central Committee of the Communist Party of China) “The Four Kinds of ‘The First Batch’” Talent Foundation (grant number 201801).

Institutional Review Board Statement

Not applicable.

Informed Consent Statement

Not applicable.

Data Availability Statement

All data generated or analyzed during this study are included in this published article.

Conflicts of Interest

The authors declare no conflict of interest.

References

  1. Brasileiro-Assing, A.C.B.; Kades, J.; de Almeida Sinisgalli, P.A.; Farley, J.; Schmitt-Filho, A. Performance Analysis of Dairy Farms Transitioning to Environmentally Friendly Grazing Practices: The Case Study of Santa Catarina, Brazil. Land 2022, 11, 294. [Google Scholar] [CrossRef]
  2. Wang, M.; McCarl, B.A. Impacts of Climate Change on Livestock Location in the US: A Statistical Analysis. Land 2021, 10, 1260. [Google Scholar] [CrossRef]
  3. Food and Agriculture Organization of the United Nations. Available online: https://www.fao.org/china/en/ (accessed on 12 September 2023).
  4. Yang, X.; Su, X.; Ran, Q.; Ren, S.; Chen, B.; Wang, W.; Wang, J. Assessing the impact of energy internet and energy misallocation on carbon emissions: New insights from China. Environ. Sci. Pollut. Res. 2022, 29, 23436–23460. [Google Scholar] [CrossRef]
  5. National Bureau of Statistics. Available online: http://www.stats.gov.cn/sj/ (accessed on 12 September 2023).
  6. Xu, J.; Wang, J.; Wang, T.; Li, C. Impact of industrial agglomeration on carbon emissions from dairy farming—Empirical analysis based on life cycle assessmsent method and spatial durbin model. J. Clean. Prod. 2023, 406, 137081. [Google Scholar] [CrossRef]
  7. Du, X.; Wang, Q.; Zheng, Y.; Gui, J.; Du, S.; Shi, Z. Sustainable Planning Strategy of Dairy Farming in China Based on Carbon Emission from Direct Energy Consumption. Agriculture 2023, 13, 963. [Google Scholar] [CrossRef]
  8. You, M.; Liu, P. The carbon reduction puzzle in stock market: Evidence from China’s “Dual-Carbon Target”. Appl. Econ. Lett. 2023, 2023, 2209354. [Google Scholar] [CrossRef]
  9. Zhao, S.; Cao, Y.; Hunjra, A.I.; Tan, Y. How does environmentally induced R&D affect carbon productivity? A government support perspective. Int. Rev. Econ. Finance 2023, 88, 942–961. [Google Scholar]
  10. Xu, J.; Wang, J.; Wang, H.; Li, C. Evolution trend and promotion potential of environmental efficiency of dairy farming in China from the perspective of “club convergence”. Front. Environ. Sci. 2022, 10, 1386. [Google Scholar] [CrossRef]
  11. Galloway, C.; Conradie, B.; Prozesky, H.; Esler, K. Opportunities to improve sustainability on commercial pasture-based dairy farms by assessing environmental impact. Agric. Syst. 2018, 166, 1–9. [Google Scholar] [CrossRef]
  12. Yao, Y.; Hu, D.; Yang, C.; Tan, Y. The impact and mechanism of fintech on green total factor productivity. Green Financ. 2021, 3, 198–221. [Google Scholar] [CrossRef]
  13. Yu, Z.; Liu, H.; Peng, H.; Xia, Q.; Dong, X. Production Efficiency of Raw Milk and Its Determinants: Application of Combining Data Envelopment Analysis and Stochastic Frontier Analysis. Agriculture 2023, 13, 370. [Google Scholar] [CrossRef]
  14. Ledgard, S.F.; Wei, S.; Wang, X.; Falconer, S.; Zhang, N.; Zhang, X.; Ma, L. Nitrogen and carbon footprints of dairy farm systems in China and New Zealand, as influenced by productivity, feed sources and mitigations. Agric. Water Manag. 2019, 213, 155–163. [Google Scholar] [CrossRef]
  15. Wang, G.; Zhang, L.; Sun, Y.; Yang, Y.; Han, C. Evaluation on the allocative efficiency of agricultural factors in the five Central Asian countries. J. Geogr. Sci. 2020, 30, 1896–1908. [Google Scholar] [CrossRef]
  16. Ma, W.; Renwick, A.; Bicknell, K. Higher Intensity, Higher Profit? Empirical Evidence from Dairy Farming in New Zealand. J. Agric. Econ. 2018, 69, 739–755. [Google Scholar] [CrossRef]
  17. Liu, C.; Wang, X.; Bai, Z.; Wang, H.; Li, C. Does Digital Technology Application Promote Carbon Emission Efficiency in Dairy Farms? Evidence from China. Agriculture 2023, 13, 904. [Google Scholar] [CrossRef]
  18. Huang, L.; Peng, J. Research on technical countermeasures of smart agriculture development based on digital ecological environment. Fresenius Environ. Bull. 2022, 31, 11244–11251. [Google Scholar]
  19. Rose, D.C.; Wheeler, R.; Winter, M.; Lobley, M.; Chivers, C.-A. Agriculture 4.0: Making it work for people, production, and the planet. Land Use Policy 2021, 100, 104933. [Google Scholar] [CrossRef]
  20. Cui, H.; Cao, Y.; Zhang, C. Assessing the digital economy and its effect on carbon performance: The case of China. Environ. Sci. Pollut. Res. 2023, 30, 73299–73320. [Google Scholar] [CrossRef] [PubMed]
  21. Satpathy, B. Digital transformation for sustainable agriculture: A progressive method for smallholder farmers. Curr. Sci. 2022, 123, 1436–1440. [Google Scholar] [CrossRef]
  22. Khanna, M.; Atallah, S.S.; Kar, S.; Sharma, B.; Wu, L.; Yu, C.; Chowdhary, G.; Soman, C.; Guan, K. Digital transformation for a sustainable agriculture in the United States: Opportunities and challenges. Agric. Econ. 2022, 53, 924–937. [Google Scholar] [CrossRef]
  23. Duncan, E.; Rotz, S.; Magnan, A.; Bronson, K. Disciplining land through data: The role of agricultural technologies in farmland assetisation. Sociol. Rural. 2022, 62, 231–249. [Google Scholar] [CrossRef]
  24. Li, H.; Jian, Z. Research on the resource allocation effect of digital economy development on technology enterprises. Stud. Sci. Sci. 2022, 40, 1390–1400. [Google Scholar]
  25. Yuan, S.; Pan, X. Inherent mechanism of digital technology application empowered corporate green innovation: Based on resource allocation perspective. J. Environ. Manag. 2023, 345, 118841. [Google Scholar] [CrossRef] [PubMed]
  26. Li, H.Y.; Liu, Q.; Ye, H.Z. Digital Development Influencing Mechanism on Green Innovation Performance: A Perspective of Green Innovation Network. IEEE Access 2023, 11, 22490–22504. [Google Scholar] [CrossRef]
  27. Hu, Y.; Dai, X.; Zhao, L. Digital Finance, Environmental Regulation, and Green Technology Innovation: An Empirical Study of 278 Cities in China. Sustainability 2022, 14, 8652. [Google Scholar] [CrossRef]
  28. Xie, N.-Y.; Zhang, Y. The Impact of Digital Economy on Industrial Carbon Emission Efficiency: Evidence from Chinese Provincial Data. Math. Probl. Eng. 2022, 2022, 6583809. [Google Scholar] [CrossRef]
  29. Shang, X.; Guo, Q. Analysis of Behaviors of Part-Time Peasant Household Based on Rational Economic Man Hypothesis. J. Jilin Agric. Univ. 2010, 32, 597–602. [Google Scholar]
  30. Milne, G.; Byrne, A.W.; Campbell, E.; Graham, J.; McGrath, J.; Kirke, R.; McMaster, W.; Zimmermann, J.; Adenuga, A.H. Quantifying Land Fragmentation in Northern Irish Cattle Enterprises. Land 2022, 11, 402. [Google Scholar] [CrossRef]
  31. Galloway, C.; Conradie, B.; Prozesky, H.; Esler, K. Are private and social goals aligned in pasture-based dairy production? J. Clean. Prod. 2018, 175, 402–408. [Google Scholar] [CrossRef]
  32. Acemoglu, D.; Restrepo, P. The Race between Man and Machine: Implications of Technology for Growth, Factor Shares, and Employment. Am. Econ. Rev. 2018, 108, 1488–1542. [Google Scholar] [CrossRef]
  33. Qi, Y.; Han, J.; Shadbolt, N.M.; Zhang, Q. Can the use of digital technology improve the cow milk productivity in large dairy herds? Evidence from China’s Shandong Province. Front. Sustain. Food Syst. 2022, 6, 1083906. [Google Scholar] [CrossRef]
  34. Benhai, X.N.; Qingyao, L.U.; Jianqiang, L.U.; Liang, Y. Study of Digital Management System of Milking Process on Intensive Dairy Cattle Farm. Sci. Agric. Sin. 2008, 41, 1179–1185. [Google Scholar]
  35. Groher, T.; Heitkaemper, K.; Umstaetter, C. Digital technology adoption in livestock production with a special focus on ruminant farming. Animal 2020, 14, 2404–2413. [Google Scholar] [CrossRef] [PubMed]
  36. Cette, G.; Nevoux, S.; Py, L. The impact of ICTs and digitalization on productivity and labor share: Evidence from French firms. Econ. Innov. New Technol. 2022, 31, 669–692. [Google Scholar] [CrossRef]
  37. Carillo, F.; Abeni, F. An Estimate of the Effects from Precision Livestock Farming on a Productivity Index at Farm Level. Some Evidences from a Dairy Farms’ Sample of Lombardy. Animals 2020, 10, 1781. [Google Scholar] [CrossRef] [PubMed]
  38. Gabriel, A.; Gandorfer, M. Adoption of digital technologies in agriculture-an inventory in a European small-scale farming region. Precis. Agric. 2023, 24, 68–91. [Google Scholar] [CrossRef]
  39. Gao, Y.; Niu, Z.; Yang, H.; Yu, L. Impact of green control techniques on family farms’ welfare. Ecol. Econ. 2019, 161, 91–99. [Google Scholar] [CrossRef]
  40. Chang, H.H.; Mishra, A.K. Does the Milk Income Loss Contract program improve the technical efficiency of US dairy farms? J. Dairy Sci. 2011, 94, 2945–2951. [Google Scholar] [CrossRef]
  41. Mochizuki, M.; Osada, M.; Ishioka, K.; Matsubara, T.; Momota, Y.; Yumoto, N.; Sako, T.; Kamiya, S.; Yoshimura, I. Is experience on a farm an effective approach to understanding animal products and the management of dairy farming? Anim. Sci. J. 2014, 85, 323–329. [Google Scholar] [CrossRef]
  42. Walsh, J.; Parsons, R.; Wang, Q.; Conner, D. What Makes an Organic Dairy Farm Profitable in the United States? Evidence from 10 Years of Farm Level Data in Vermont. Agriculture 2020, 10, 17. [Google Scholar] [CrossRef]
  43. Lu, C. Does household laborer migration promote farmland abandonment in China? Growth Chang. 2020, 51, 1804–1836. [Google Scholar] [CrossRef]
  44. Xu, D.; Deng, X.; Guo, S.; Liu, S. Labor migration and farmland abandonment in rural China: Empirical results and policy implications. J. Environ. Manag. 2019, 232, 738–750. [Google Scholar] [CrossRef] [PubMed]
Figure 1. Process flow chart.
Sustainability 15 15455 g001
Figure 2. Location and scope of the survey area.
Sustainability 15 15455 g002
Table 1. Variable selection and descriptive statistics.
Variable TypesVariable NameVariable Meaning and AssignmentMeanStandard Deviation
Explained variableEnvironmental efficiencyThe results were calculated based on the Undesirable Outputs-SBM model0.6222 0.1130
Core explanatory variablesDigital technologyWhether the dairy farm uses digital technology (no = 0, using 1 or more digital technologies is assigned a value of 1)0.36690.4828
Mediating variablesLand factor allocation: land transfer decisionWhether the dairy farm expands the land scale (no = 0, yes = 1)0.35970.4808
Land factor allocation: land utilization rateThe ratio of utilized land area to total land area in dairy farms0.64610.1443
Labor factor allocation: labor input proportionThe number of people engaged in dairy farming as a share of the total labor force in a household0.55500.1716
Labor factor allocation: labor input timeThe logarithm of labor input time (days/head)1.46630.0250
Capital factor allocation: short-term productive inputThe logarithm of production and operation input of dairy farm (yuan/head)9.35710.0531
Factor allocation of capital: long-term productive inputsThe willingness to invest in fixed assets such as large-scale breeding machinery in the future2.55011.2464
Control variablesEducational attainmentYears of schooling for dairy farmers9.72301.2854
AgeThe age of the dairy farmer46.60077.2288
Village cadreIs the dairy farmer a village cadre? Yes = 1, no = 00.06830.2528
Breeding experienceThe number of years a dairy farming household owner has kept cows16.68359.8318
Risk perceptionAre you concerned about the risks of dairy farming? Very not worried = 1, not worried = 2, generally = 3, worried = 4, very worried = 54.55400.6264
Technical TrainingDo dairy farmers participate in technical training? Yes = 1, no = 00.37050.4838
CooperativesDoes the dairy farm participate in a dairy farming Cooperative economic organization? Yes = 1, no = 00.41370.4934
Household registration typeRural registration = 0, urban registration = 10.33450.4727
Composition of incomeIncome from dairy farming as a share of total household income78.345321.1483
Household labor endowmentNumber of household members available for dairy farming3.87051.3666
Instrumental variablesDigital technology adoption ratio of other dairy farms in the same regionThe proportion of other dairy farms in the same region utilizing digital technology0.22120.3279
Table 2. Results of multicollinearity test.
VariablesVIFVariablesVIF
Land transfer decision1.88Village cadre1.59
Land utilization rate1.71Breeding experience1.58
Labor input proportion1.74Risk perception2.23
Labor input time1.65Technical training2.02
Short-term productive inputs1.33Cooperatives1.42
Long-term productive inputs1.87Household registration type2.29
Digital technology1.21Composition of income1.85
Education attainment0.75Household labor endowment1.91
Age1.21
Table 3. Estimated results of the effect of digital technology on land factor allocation in dairy farms.
VariablesProbitIV-ProbitTobitIV-Tobit
Land Transfer DecisionLand Transfer DecisionLand Utilization RateLand Utilization Rate
Digital Technology0.6644 ***0.8912 ***0.1762 ***0.1985 ***
(0.0485)(0.0610)(0.0155)(0.0181)
Education attainment0.0527 **0.02060.0346 ***0.0313 ***
(0.0225)(0.0244)(0.0074)(0.0074)
Age−0.0022−0.00040.0023 **0.0025 ***
(0.0030)(0.0032)(0.0010)(0.0009)
Village Cadre0.08830.07710.03580.0347
(0.0736)(0.0782)(0.0240)(0.0236)
Breeding experience0.0035 *0.00300.0031 ***0.0031 ***
(0.0019)(0.0020)(0.0006)(0.0006)
Risk perception−0.1091 ***−0.0932 ***0.00140.0031
(0.0310)(0.0330)(0.0100)(0.0099)
Technical training0.2017 ***0.1956 ***0.0548 ***0.0542 ***
(0.0440)(0.0467)(0.0142)(0.0140)
Cooperatives0.1086 **0.1756 ***0.0441 **0.0504 ***
(0.0532)(0.0572)(0.0172)(0.0171)
Household registration type0.03400.02190.0388 ***0.0376 ***
(0.0451)(0.0479)(0.0144)(0.0142)
Composition of income0.00040.00010.0005 *0.0005
(0.0009)(0.0010)(0.0003)(0.0003)
Household labor endowment0.0403 ***0.0358 **0.00240.0021
(0.0140)(0.0149)(0.0046)(0.0045)
Constant term−0.08530.03950.01280.0257
(0.3408)(0.3622)(0.1110)(0.1092)
N278278278278
Prob > chi20.00000.00000.00000.0000
Note: *, **, and *** indicate significance at the 10%, 5%, and 1% levels, respectively. The values in parentheses represent standard deviations.
Table 4. Estimated results of the effect of digital technology on labor factor allocation in dairy farms.
VariablesSelection EquationOutput EquationSelection EquationOutput Equation
Proportion of Labor InputProportion of Labor InputLabor Input TimeLabor Input Time
Digital technology −0.2622 *** −0.0344 ***
(0.0182) (0.0024)
Education attainment0.0666 ***−0.0307 ***0.0666 ***−0.0073 ***
(0.0169)(0.0074)(0.0169)(0.0010)
Age−0.0006−0.0033 ***−0.0006−0.0007 ***
(0.0020)(0.0009)(0.0020)(0.0001)
Village Cadre−0.0305−0.1129 ***−0.0305−0.0149 ***
(0.0504)(0.0236)(0.0504)(0.0031)
Breeding experience0.0003−0.00090.00030.0000
(0.0013)(0.0006)(0.0013)(0.0001)
Risk perception−0.01750.0461 ***−0.01750.0088 ***
(0.0210)(0.0099)(0.0210)(0.0013)
Technical training0.0677 **−0.00600.0677 **−0.0043 **
(0.0300)(0.0140)(0.0300)(0.0018)
Cooperatives0.2243 ***−0.0682 ***0.2243 ***−0.0084 ***
(0.0350)(0.0172)(0.0350)(0.0023)
Household registration type0.0922 ***−0.02030.0922 ***−0.0019
(0.0308)(0.0142)(0.0308)(0.0019)
Composition of income0.00070.00040.00070.0002 ***
(0.0006)(0.0003)(0.0006)(0.0000)
Household labor endowment−0.0504 ***0.0128 ***−0.0504 ***0.0012 **
(0.0099)(0.0045)(0.0099)(0.0006)
Application of digital technology in dairy farms in the same region1.4085 *** 1.4085 ***
(0.0545) (0.0545)
Constant term0.9069 ***0.8182 ***0.9069 ***1.5341 ***
(0.2390)(0.1094)(0.2390)(0.0144)
Log likelihood341.2348930.2690
Residual covariance0.02050.3881 ***
Wald value653.65980.18
N278278
Note: ** and *** indicate significance at the 5% and 1% levels, respectively. The values in parentheses represent standard deviations.
Table 5. Estimated results of the effect of digital technology on capital factor allocation in dairy farms.
VariablesSelection EquationOutput EquationSelection EquationOutput Equation
Short-Term Productive InputsShort-Term Productive InputLong-Term Productive InputsLong-Term Productive Input
Digital technology −0.0524 *** 0.4484 ***
(0.0078) (0.1450)
Education attainment0.0666 ***0.00020.0666 ***0.3553 ***
(0.0169)(0.0032)(0.0169)(0.0590)
Age−0.0006−0.0024 ***−0.0006−0.0483 ***
(0.0020)(0.0004)(0.0020)(0.0076)
Village Cadre−0.03050.0079−0.03050.6623 ***
(0.0504)(0.0101)(0.0504)(0.1884)
Breeding experience0.0003−0.00010.00030.0189 ***
(0.0013)(0.0003)(0.0013)(0.0048)
Risk perception−0.01750.0182 ***−0.01750.1160
(0.0210)(0.0042)(0.0210)(0.0788)
Technical training0.0677 **−0.0230 ***0.0677 **0.2450 **
(0.0300)(0.0060)(0.0300)(0.1115)
Cooperatives0.2243 ***−0.0587 ***0.2243 ***0.6274 ***
(0.0350)(0.0073)(0.0350)(0.1370)
Household registration type0.0922 ***0.0438 ***0.0922 ***0.9121 ***
(0.0308)(0.0061)(0.0308)(0.1135)
Composition of income0.00070.0007 ***0.00070.0028
(0.0006)(0.0001)(0.0006)(0.0023)
Household labor endowment−0.0504 ***0.0073 ***−0.0504 ***0.1256 ***
(0.0099)(0.0019)(0.0099)(0.0360)
Application of digital technology in dairy farms in the same region1.4085 *** 1.4085 ***
(0.0545) (0.0545)
Constant term0.9069 ***9.2889 ***0.9069 ***−4.3277 ***
(0.2390)(0.0467)(0.2390)(0.8728)
Log likelihood588.90809 −202.84611
Residual covariance0.2730 ***0.4609 ***
Wald value274.97526.76
N278278
Note: ** and *** indicate significance at the 5% and 1% levels, respectively. The values in parentheses represent standard deviations.
Table 6. Estimated results of the effect of digital technology on the environmental efficiency of dairy farms under the mediation of land factor allocation.
VariablesRegression (1)Regression (2)Regression (3)Regression (4)Regression (5)Regression (6)
Environmental EfficiencyLand Transfer DecisionEnvironmental EfficiencyEnvironmental EfficiencyLand Utilization RateEnvironmental Efficiency
Digital technology0.1324 ***0.6472 ***0.1207 ***0.1324 ***0.1762 ***0.0215 ***
(0.0117)(0.0404)(0.0164)(0.0117)(0.0155)(0.0078)
Education attainment0.0258 ***0.0803 ***0.0244 ***0.0258 ***0.0346 ***0.0040
(0.0055)(0.0192)(0.0057)(0.0055)(0.0074)(0.0032)
Age0.0004−0.00280.00050.00040.0023 **0.0010 **
(0.0007)(0.0025)(0.0007)(0.0007)(0.0010)(0.0004)
Village Cadre0.0761 ***0.06110.0750 ***0.0761 ***0.03580.0536 ***
(0.0181)(0.0625)(0.0181)(0.0181)(0.0240)(0.0100)
Breeding experience0.0008 *0.00210.0008 *0.0008 *0.0031 ***0.0012 ***
(0.0005)(0.0016)(0.0005)(0.0005)(0.0006)(0.0003)
Risk perception−0.0322 ***−0.0893 ***−0.0306 ***−0.0322 ***0.0014−0.0331 ***
(0.0075)(0.0261)(0.0077)(0.0075)(0.0100)(0.0041)
Technical training0.0248 **0.1992 ***0.0212 *0.0248 **0.0548 ***−0.0097
(0.0107)(0.0370)(0.0113)(0.0107)(0.0142)(0.0060)
Cooperatives0.0334 **0.1452 ***−0.0308 **0.0334 **0.0441 **−0.0056
(0.0130)(0.0449)(0.0132)(0.0130)(0.0172)(0.0072)
Household registration type0.00480.05940.00370.00480.0388 ***0.0196 ***
(0.0109)(0.0376)(0.0109)(0.0109)(0.0144)(0.0061)
Composition of income−0.0004 *0.0001−0.0004 *−0.0004 *0.0005 *−0.0007 ***
(0.0002)(0.0008)(0.0002)(0.0002)(0.0003)(0.0001)
Household labor endowment0.00520.0360 ***0.00450.00520.00240.0037 *
(0.0034)(0.0119)(0.0035)(0.0034)(0.0046)(0.0019)
Land transfer decision 0.0181 **
(0.0077)
Land utilization rate 0.6295 ***
(0.0253)
Constant term0.3510 ***−0.34080.3571 ***0.3510 ***0.01280.3429 ***
(0.0835)(0.2891)(0.0838)(0.0835)(0.1110)(0.0459)
N278278278278278278
R20.64570.75240.65100.64570.61630.8935
adj. R20.63110.74220.63520.63110.60040.8887
Note: *, **, and *** indicate significance at the 10%, 5%, and 1% levels, respectively. The values in parentheses represent standard deviations.
Table 7. Estimated results of the effect of digital technology on the environmental efficiency of dairy farms under the mediation of labor factor allocation.
VariablesRegression (7)Regression (8)Regression (9)Regression (10)Regression (11)Regression (12)
Environmental EfficiencyLabor Input ProportionEnvironmental EfficiencyEnvironmental EfficiencyLabor Input TimeEnvironmental Efficiency
Digital technology0.1324 ***−0.2594 ***0.0391 ***0.1324 ***−0.0270 ***0.0080 *
(0.0117)(0.0156)(0.0078)(0.0117)(0.0020)(0.0043)
Education attainment0.0258 ***−0.0311 ***0.0052 *0.0258 ***−0.0084 ***0.0130 ***
(0.0055)(0.0074)(0.0027)(0.0055)(0.0010)(0.0039)
Age0.0004−0.0032 ***0.00030.0004−0.0006 ***−0.0004
(0.0007)(0.0010)(0.0003)(0.0007)(0.0001)(0.0005)
Village Cadre0.0761 ***−0.1131 ***0.00140.0761 ***−0.0152 ***0.0059
(0.0181)(0.0241)(0.0088)(0.0181)(0.0031)(0.0116)
Breeding experience0.0008 *−0.00090.00020.0008 *−0.00000.0007 **
(0.0005)(0.0006)(0.0002)(0.0005)(0.0001)(0.0003)
Risk perception−0.0322 ***0.0463 ***−0.0016−0.0322 ***0.0094 ***−0.0109 **
(0.0075)(0.0101)(0.0037)(0.0075)(0.0013)(0.0051)
Technical training0.0248 **−0.00610.0208 ***0.0248 **−0.0045 **0.0040
(0.0107)(0.0143)(0.0050)(0.0107)(0.0018)(0.0066)
Cooperatives0.0334 **−0.0674 ***0.0112 *0.0334 **−0.0063 ***−0.0044
(0.0130)(0.0173)(0.0062)(0.0130)(0.0022)(0.0081)
Household registration type0.0048−0.02040.0087 *0.0048−0.0024−0.0060
(0.0109)(0.0145)(0.0051)(0.0109)(0.0019)(0.0067)
Composition of income−0.0004 *0.0003−0.0002−0.0004 *0.0002 ***0.0003 **
(0.0002)(0.0003)(0.0001)(0.0002)(0.0000)(0.0001)
Household labor endowment0.00520.0128 ***0.0136 ***0.00520.0013 **−0.0008
(0.0034)(0.0046)(0.0016)(0.0034)(0.0006)(0.0021)
Labor input proportion −0.6611 ***
(0.0215)
Labor input time −4.6043 ***
(0.2198)
Constant term0.3510 ***0.8198 ***0.8930 ***0.3510 ***1.5383 ***7.4339 ***
(0.0835)(0.1117)(0.0429)(0.0835)(0.0143)(0.3420)
N278278278278278278
R20.64570.72530.92260.64570.78780.8666
Adj. R20.63110.71400.91900.63110.77900.8606
Note: *, **, and *** indicate significance at the 10%, 5%, and 1% levels, respectively. The values in parentheses represent standard deviations.
Table 8. Estimated results of the effect of digital technology on the environmental efficiency of dairy farms under the mediation of capital factor allocation.
VariablesRegression (13)Regression (14)Regression (15)Regression (16)Regression (17)Regression (18)
Environmental EfficiencyShort-Term Productive InputsEnvironmental EfficiencyEnvironmental EfficiencyLong-Term Productive InputsEnvironmental Efficiency
Digital technology0.1324 ***−0.0363 ***0.1223 ***0.1324 ***0.9562 ***0.1202 ***
(0.0117)(0.0066)(0.0122)(0.0117)(0.1206)(0.0129)
Education attainment0.0258 ***−0.00220.0252 ***0.0258 ***0.2806 ***0.0222 ***
(0.0055)(0.0031)(0.0055)(0.0055)(0.0573)(0.0058)
Age0.0004−0.0022 ***0.00110.00040.00350.0012
(0.0007)(0.0004)(0.0008)(0.0007)(0.0074)(0.0008)
Village Cadre0.0761 ***0.00710.0781 ***0.0761 ***0.6360 ***0.0680 ***
(0.0181)(0.0102)(0.0179)(0.0181)(0.1864)(0.0183)
Breeding experience0.0008 *−0.00010.0008 *0.0008 *−0.0200 ***0.0011 **
(0.0005)(0.0003)(0.0005)(0.0005)(0.0047)(0.0005)
Risk perception−0.0322 ***0.0195 ***−0.0268 ***−0.0322 ***0.1556 **−0.0342 ***
(0.0075)(0.0042)(0.0077)(0.0075)(0.0778)(0.0075)
Technical training0.0248 **−0.0235 ***0.0182 *0.0248 **0.2297 **0.0219 **
(0.0107)(0.0060)(0.0109)(0.0107)(0.1103)(0.0107)
Cooperatives0.0334 **−0.0542 ***−0.01820.0334 **0.4851 ***0.0396 ***
(0.0130)(0.0073)(0.0141)(0.0130)(0.1338)(0.0132)
Household registration type0.00480.0429 ***0.01690.0048−0.9408 ***0.0168
(0.0109)(0.0061)(0.0117)(0.0109)(0.1123)(0.0121)
Composition of income−0.0004 *0.0007 ***−0.0002−0.0004 *0.0021−0.0004 *
(0.0002)(0.0001)(0.0002)(0.0002)(0.0023)(0.0002)
Household labor endowment0.00520.0071 ***0.0072 **0.00520.1184 ***0.0037
(0.0034)(0.0019)(0.0035)(0.0034)(0.0356)(0.0035)
Short-term productive input −0.2806 ***
(0.1076)
Long-term productive input 0.0128 **
(0.0059)
Constant term0.3510 ***9.2982 ***2.9603 ***0.3510 ***−4.0327 ***0.4025 ***
(0.0835)(0.0471)(1.0035)(0.0835)(0.8627)(0.0863)
N278278278278278278
R20.64570.48920.65460.64570.80320.6734
Adj. R20.63110.46810.63890.63110.79500.6586
Note: *, **, and *** indicate significance at the 10%, 5%, and 1% levels, respectively. The values in parentheses represent standard deviations.
Table 9. Results of two-stage least squares model estimation.
VariablesLand Transfer DecisionLand Utilization RateLabor Input ProportionLabor Input TimeShort-Term Productive InputLong-Term Productive Input
Digital technology0.9105 ***0.1985 ***−0.2622 ***−0.0344 ***−0.0524 ***0.4484 ***
(0.0324)(0.0110)(0.0163)(0.0015)(0.0065)(0.1675)
Education attainment0.0416 **0.0313 ***−0.0307 ***−0.0073 ***0.00020.3553 ***
(0.0175)(0.0057)(0.0054)(0.0009)(0.0035)(0.0490)
Age−0.00010.0025 **−0.0033 ***−0.0007 ***−0.0024 ***−0.0483 ***
(0.0013)(0.0013)(0.0011)(0.0001)(0.0003)(0.0059)
Village Cadre0.04750.0347−0.1129 ***−0.0149 ***0.00790.6623 ***
(0.0347)(0.0228)(0.0253)(0.0023)(0.0076)(0.1165)
Breeding experience0.00160.0031 ***−0.0009−0.0000−0.00010.0189 ***
(0.0018)(0.0006)(0.0006)(0.0001)(0.0003)(0.0047)
Risk perception−0.0688 **0.00310.0461 ***0.0088 ***0.0182 ***0.1160
(0.0335)(0.0103)(0.0115)(0.0014)(0.0047)(0.0928)
Technical training0.1913 ***0.0542 ***−0.0060−0.0043 ***−0.0230 ***0.2450 ***
(0.0364)(0.0133)(0.0129)(0.0015)(0.0048)(0.0920)
Cooperatives0.2190 ***0.0504 ***−0.0682 ***−0.0084 ***−0.0587 ***0.6274 ***
(0.0514)(0.0149)(0.0134)(0.0021)(0.0069)(0.1363)
Household registration type0.04460.0376 ***−0.0203 *−0.00190.0438 ***0.9121 ***
(0.0321)(0.0111)(0.0106)(0.0015)(0.0051)(0.1101)
Composition of income−0.00030.00050.00040.0002 ***0.0007 ***0.0028 *
(0.0005)(0.0003)(0.0002)(0.0000)(0.0001)(0.0017)
Household labor endowment0.0322 ***0.00210.0128 ***0.0012 **0.0073 ***0.1256 ***
(0.0101)(0.0038)(0.0044)(0.0005)(0.0018)(0.0406)
Constant term−0.18780.02570.8182 ***1.5341 ***9.2889 ***−4.3277 ***
(0.3004)(0.0936)(0.0811)(0.0129)(0.0531)(0.8321)
N278278278278278278
R20.7280.6130.7250.7770.4780.669
Adj. R20.7170.5970.7140.7680.4560.655
Note: *, **, and *** indicate significance at the 10%, 5%, and 1% levels, respectively. The values in parentheses represent standard deviations.
Table 10. Test of mediation effect based on the bootstrap method.
VariablesType of EffectCoefficientStandard Deviation95% Confidence Interval
Land factor allocation: land transfer decisionDirect effects0.0181 *0.01050.00840.0446
Indirect effects0.0916 ***0.01190.06820.1149
Land factor allocation: land utilization rateDirect effects0.6295 ***0.03990.55130.7076
Indirect effects0.0398 *0.02120.00180.0815
Labor factor allocation: labor input proportionDirect effects−0.6611 ***0.0307−0.7213−0.6010
Indirect effects−0.0767 ***0.0213−0.1184−0.0349
Labor factor allocation: labor input timeDirect effects−4.6043 ***0.3664−5.3225−3.8859
Indirect effects−0.1206 **0.0541−0.5021−0.0609
Capital factor allocation: short-term productive inputDirect effects−0.2806 ***0.0938−0.4646−0.0967
Indirect effects−0.3451 ***0.0815−0.5048−0.1853
Capital factor allocation: long-term productive inputDirect effects0.0128 *0.00770.00220.0278
Indirect effects0.0240 ***0.00470.01490.0332
Note: *, **, *** indicate significant at the 10%, 5%, and 1% levels respectively.
Disclaimer/Publisher’s Note: The statements, opinions and data contained in all publications are solely those of the individual author(s) and contributor(s) and not of MDPI and/or the editor(s). MDPI and/or the editor(s) disclaim responsibility for any injury to people or property resulting from any ideas, methods, instructions or products referred to in the content.

