Abstract
In this paper, the gas–water two-phase seepage process under a real mechanical environment is restored by a nuclear magnetic resonance experiment, and the gas–water two-phase distribution state and displacement efficiency in coal with different porosity under different gas injection pressures are accurately characterized. The fractal dimension of liquid phase distribution under different gas injection pressures was obtained through experiments, and the gas–water two-phase migration law is inverted according to it. Finally, the gas–water two-phase migration mechanism inside the fractal structure of coal was obtained. The results are as follows: 1. Gas will first pass through the dominant pathway (the composition of the dominant pathway is affected by porosity) and it will continue to penetrate other pathways only when the gas injection pressure is high. When the gas injection pressure is low, the displacement occurs mainly in the percolation pores. With the increase in gas injection pressure, the focus of displacement gradually shifts to the adsorption pore. 2. As the gas injection pressure increases, the displacement efficiency growth rate is relatively uniform for the high-porosity coal samples, while the low-porosity coal samples show a trend of first fast and then slow growth rates. When the gas injection pressure reaches 7 MPa, the displacement efficiency of high-porosity coal samples exceeds that of low-porosity coal samples. 3. With the increase in gas injection pressure, the fractal dimension of the adsorption pore section and the seepage pore section shows an increasing trend, but the fractal dimension of the adsorption pore section changes faster, indicating that with the increase in gas injection pressure, gas–water two-phase displacement mainly occurs in the adsorption pore section.
1. Introduction
Since the industrial age, the emission of greenhouse gases has led to a significant increase in global temperature. Global warming has posed a serious threat to the life system of the earth. Therefore, there has been a worldwide consensus to minimize the output of greenhouse gases and strictly control the CO2 content of the atmosphere [1,2,3,4,5]. In addition to active measures for reducing emissions and improving the Earth’s land system absorption capacity of CO2, the geological storage of this gas has been evaluated in recent years [6,7,8]. In China, deep coal seams are rich in coalbed methane reserves, which provide an ideal space for CO2 geological storage. Deep coal seam CO2 storage technology is considered to be one of the most attractive CO2 storage technologies [9,10]. However, due to the low permeability of coal seams in China, hydrofracking’s reservoir-reconstruction technology has become a key means of increasing coal bed methane production and increasing the amount of space for CO2 storage. Coal seam water injection can effectively expand the development of fracture pore structure and improve the efficiency of coalbed methane extraction [11,12,13,14,15,16,17]. Further injection of CO2 gas after water injection can not only achieve further extraction of residual coalbed methane but also achieve CO2 geological storage. However, the injection of CO2 involves a complex gas–water two-phase flow process, which greatly increases the difficulty of the study of CO2 geological storage. The percolation law of two-phase flow in porous media has been extensively studied by many scholars.
Persoff and Pruess [18] used laboratory flow equipment to visualize and measure gas–water two-phase flow in natural thick-walled rock fractures. Wu et al. [19] studied the dynamic seepage characteristics of microscopic gas–water two-phase fluid in the rock in a micro-visual glass etching displacement experiment and compared it with numerical simulation results. Zhou et al. [20] developed a visual artificial physical model of gas–water two-phase flow in uniform pore model formation using laser etching technology. However, this kind of method generally has the disadvantages of a small model and low experimental pressure and cannot fully study the gas–water two-phase seepage mechanism in the actual coal-rock mass. Meanwhile, nuclear magnetic resonance (NMR) detection technology can not only characterize the microscopic pore structure of coal-rock mass [21,22,23,24,25,26], but also reflect the flow characteristics of reservoir fluid, and has no such disadvantages [27,28,29,30]. Therefore, Xiao et al. [31] carried out water-drive gas reservoir experiments based on NMR online detection technology, studied the displacement characteristics and displacement efficiency of water-drive gas reservoirs under different water injection pressure gradients, and analyzed the breakthrough pressure of water seal and water lock. Su et al. [32] explored the gas–water two-phase seepage law of a tight gas reservoir and clarified the gas–water two-phase migration mechanism in core pore throats during gas flooding based on a visualization experiment by NMR imaging and a new SE-SPI sequence spectrum. Li et al. [33] conducted water flooding experiments and nitrogen flooding experiments on highly volatile bituminous coal samples based on low-field NMR experiments. They used micro-CT technology to invert the distribution of cracks, pores, and minerals and discussed the influence of cracks, pores, and mineral distribution on retained water. Song et al. [34] used high-resolution NMR imaging to observe the process of CO2 displacement by water injection in porous media under adsorption conditions.
Fractal geometry theory is undergoing continuous development and has been gradually applied to the structural characterization of porous media, such as coal and rock [35,36]. Liu et al. [37] obtained the T2 spectrum of the specimen based on the low-field NMR experiment and obtained the fractal dimension of the effective seepage pathway structure inside the coal body by fitting the relevant data. Neimark [38], Angulo [39], and Friesen [40] established the fractal dimension algorithm of coal-rock fracture-pore structure based on the mercury injection test method and studied the fractal characteristics and geometric significance of coal-rock fracture-pore structure. Wu [41] and Li [42] obtained the conventional structural parameters inside the coal body by carrying out mercury injection experiments and proposed a fractal dimension algorithm based on the capillary pressure curve to study the fractal law of its internal structure. Jin et al. [43] compared and analyzed the similarities and differences of various pore fractal dimension calculation methods and studied the influence of matrix compression effect on pore structure fractal characteristics based on mercury injection test and liquid nitrogen adsorption test. He [44] used a gas adsorption experiment to obtain the fractal characteristics of the pore structure of coal-rock mass and analyzed the relationship between pore fractal dimension and related structural parameters.
In summary, at this stage, more in-depth research has been carried out on the migration law of gas–water two-phase flow in porous media such as coal and rock mass. However, most of the previous studies are from the experimental point of view, and rarely combined with theoretical research. Therefore, this paper takes the gas coal of Xinglongzhuang Coal Mine in Jining City, Shandong Province, and the coking coal of Qingdong Coal Mine in Suixi County, Anhui Province as the research objects. In order to more intuitively and accurately observe the migration mechanism of gas–water two-phase in the coal seam during CO2 injection, the CO2 gas displacement experiment of saturated water coal body was carried out based on the low-field NMR devices. Using the T2 spectra obtained from the experiment, we have obtained the distribution of the pore sizes in the coal sample and the distribution of the gas–water two-phase states in the coal bulk at different gas injection pressures. The fractal geometry theory is introduced to analyze the variation law of the fractal dimension of liquid phase distribution, and the gas–water two-phase migration law is inverted to obtain the water–gas two-phase migration mechanism in the fine-micro fractal structure of coal.
2. CO2 Displacement Experiment Based on Low-Field NMR
2.1. Experimental Samples and Equipment
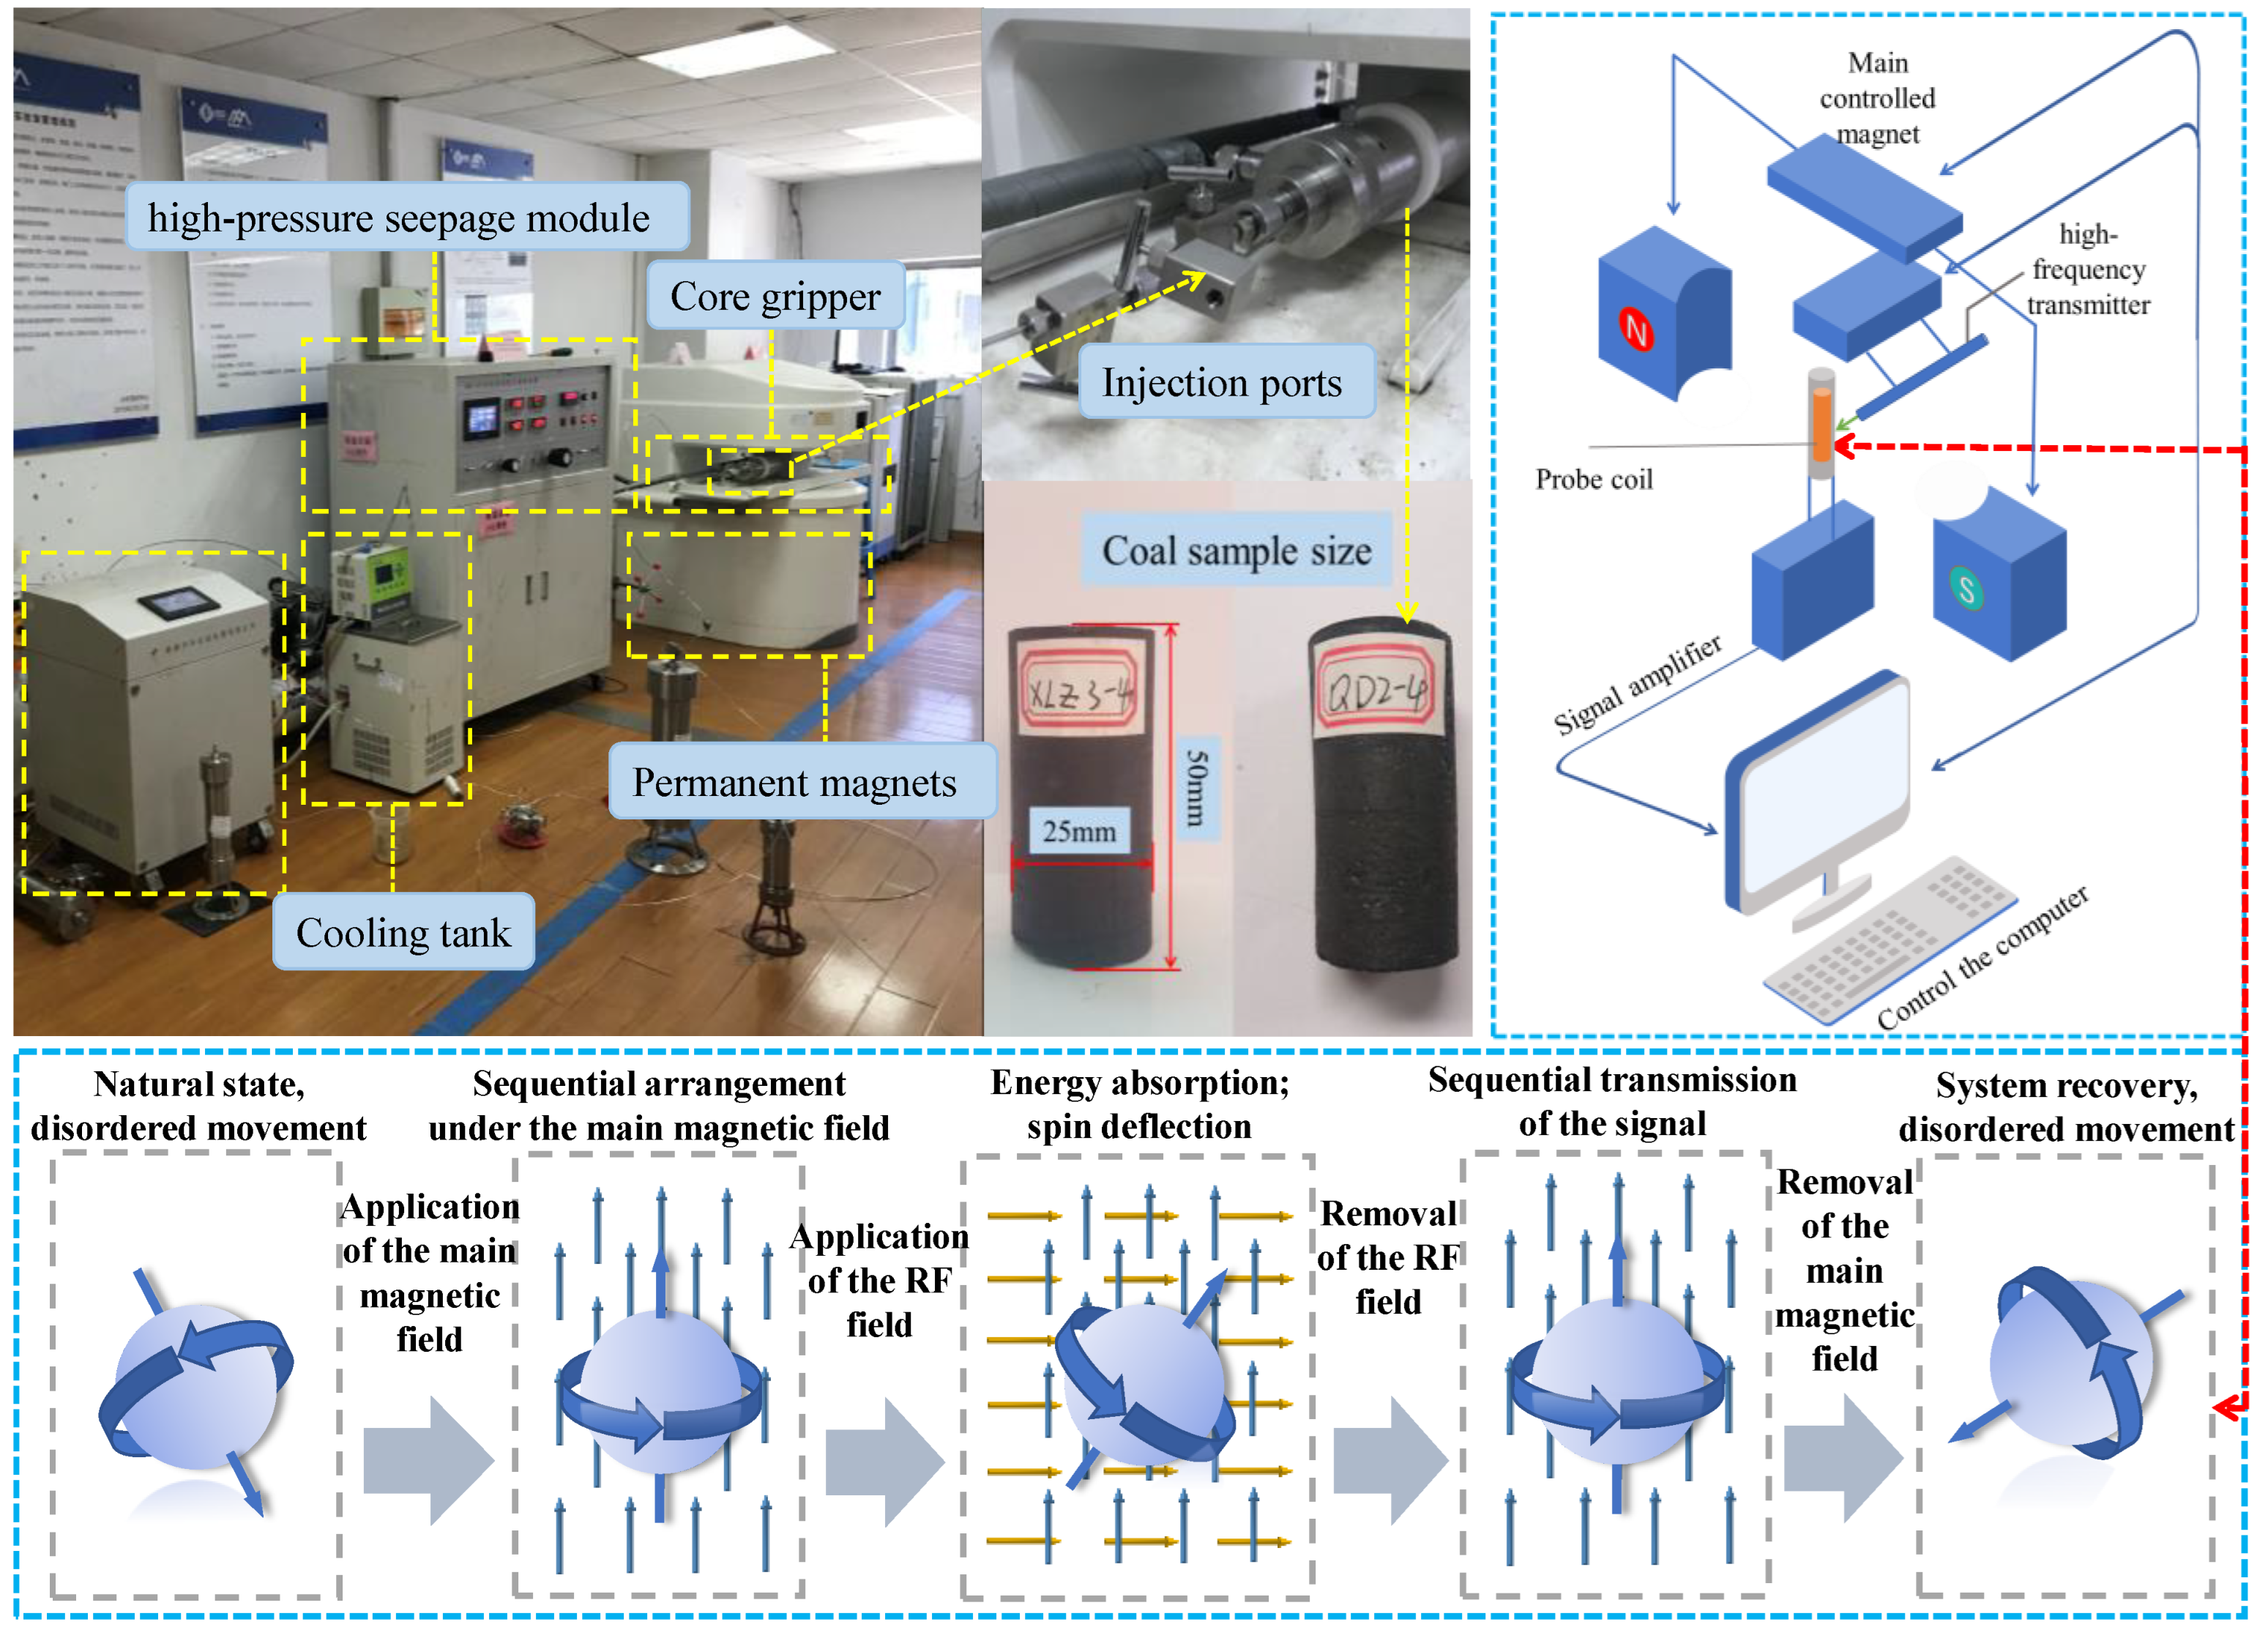
Gas coal samples were collected in the Xinglongzhuang mine (Jining City, Shandong Province) while coking coal samples were collected in the Qingdong mine (Suixi County, Anhui Province). The buried depth of the selected coal sample is relatively deep, which represents the deep low-permeability coal seam. The analysis results of the coal sample are shown in Table 1. Low-field NMR (MacroMR12-150H instrument, Suzhou Niumag Analytical Instrument Co., Suzhou, China) was used to analyze the relaxation time (T2) of saturated coal water before and after the CO2 action was tested (Figure 1). The attenuation curve of signal intensity and the relaxation time was obtained according to the Carr–Purcell–Meiboom–Gill sequence test. The proportion, porosity, and permeability of pores with different sizes were obtained by numerical inversion. The test parameters determined in this test were: the receiver broadband (SW = 250 kHz), the repeated sampling waiting time (TW = 4000 ms), the scanning times (NS = 32), the RF periods delay (RFD = 0.08 ms), the echo interval (TE = 0.39 ms), the echo number (NECH = 15,000), and the test signal-to-noise ratio (>25).

Table 1.
Conventional parameters of the original samples.

Figure 1.
NMR experimental equipment and principle.
2.2. Experimental Methods and Procedures
Raw block coal samples were collected, sealed, and packaged on site, and finally transported to the laboratory to carry out the porosity determination experiment of the coal sample to obtain its porosity. The conventional parameters and porosity of the drilling coal core are shown in Table 1. A rock sampling rig was used to process the raw coal block coal samples into cylindrical raw coal standard specimens with diameters of 25 mm and heights of 50 mm (Figure 1), meeting the experimental requirements. Samples with smooth, clean surfaces with no obvious defects were selected and then placed in a drying oven at 105 °C and vacuum dried for 24 h, taken out, and dry weighed. Afterward, the dried coal samples were placed in NMR equipment to determine their T2 spectrum signals. The samples were first subjected to a vacuum treatment; then, saturated water was pressurized for 12 h under a pressure of 10 MPa, until they were completely saturated with distilled water. The saturated samples were hence taken out and their surfaces were wiped with a wet paper towel. After determining the wet weight, we placed the samples in a nuclear magnetic device to determine their T2 spectra and used the floating weight method to find out their volumes. The relationship between water volume and the nuclear magnetic signal was established; moreover, the volume of saturated water in the coal sample and the porosity of the coal sample were obtained using the weighing method and the nuclear magnetic method, respectively.
To test the effect of gas injection, the samples were put into a core holder to determine their original T2 spectra and the confining pressure loading and gas injection seepage pipelines were connected. A confining pressure of 10 MPa was applied to the coal sample by injecting a confining pressure liquid at the inlet, to simulate with the aim of simulating the pressure-bearing state of the coal seam. Also, CO2 was injected through a port (under a constant temperature of 60 °C and a constant pressure of 0.5 MPa) to simulate the process of gas injection flooding. The T2 spectrum was recorded at 30 min of gas injection. Afterward, the injection pressure was increased. The T2 spectrum was recorded again at 30 min, recording recorded T2 spectrum under an injection pressure of 0.5 MPa, 1 MPa, 3 MPa, and 7 MPa, respectively. Gas injections were stopped when the T2 spectrum did not show any more changes. The gas–water two-phase distribution of the sample under different gas injection pressures was analyzed to obtain the displacement efficiency of the gas injection displacement water flooding process and the gas–water two-phase migration law in the pores under the real mechanical environment.
3. Experimental Results and Analyses
3.1. T2 Cutoff Value Analysis
The internal pore structure of porous media like coal rocks is very complex, and the pore size spans multiple scales. According to the different occurrence states of water in pores of different sizes, the pores themselves can be divided into adsorption (with bound water) and seepage pores (with free water). In NMR experiments, T2 cutoff value (T2c) can be used to distinguish between adsorption porosity (i.e., residual porosity), corresponding to bound water, and seepage porosity (i.e., effective porosity), corresponding to free water, to characterize the storage properties of a fluid in a reservoir [45,46]. In fact, when T2 < T2c, the corresponding pores are adsorption pores, and the internal bound water is difficult to be displaced by gas under the action of capillary force. When T2 > T2c, the corresponding pores are effective seepage pores, because the free water in the pores is not obviously affected by the capillary force (mainly inertial force), it is easier to be displaced by gas [47].
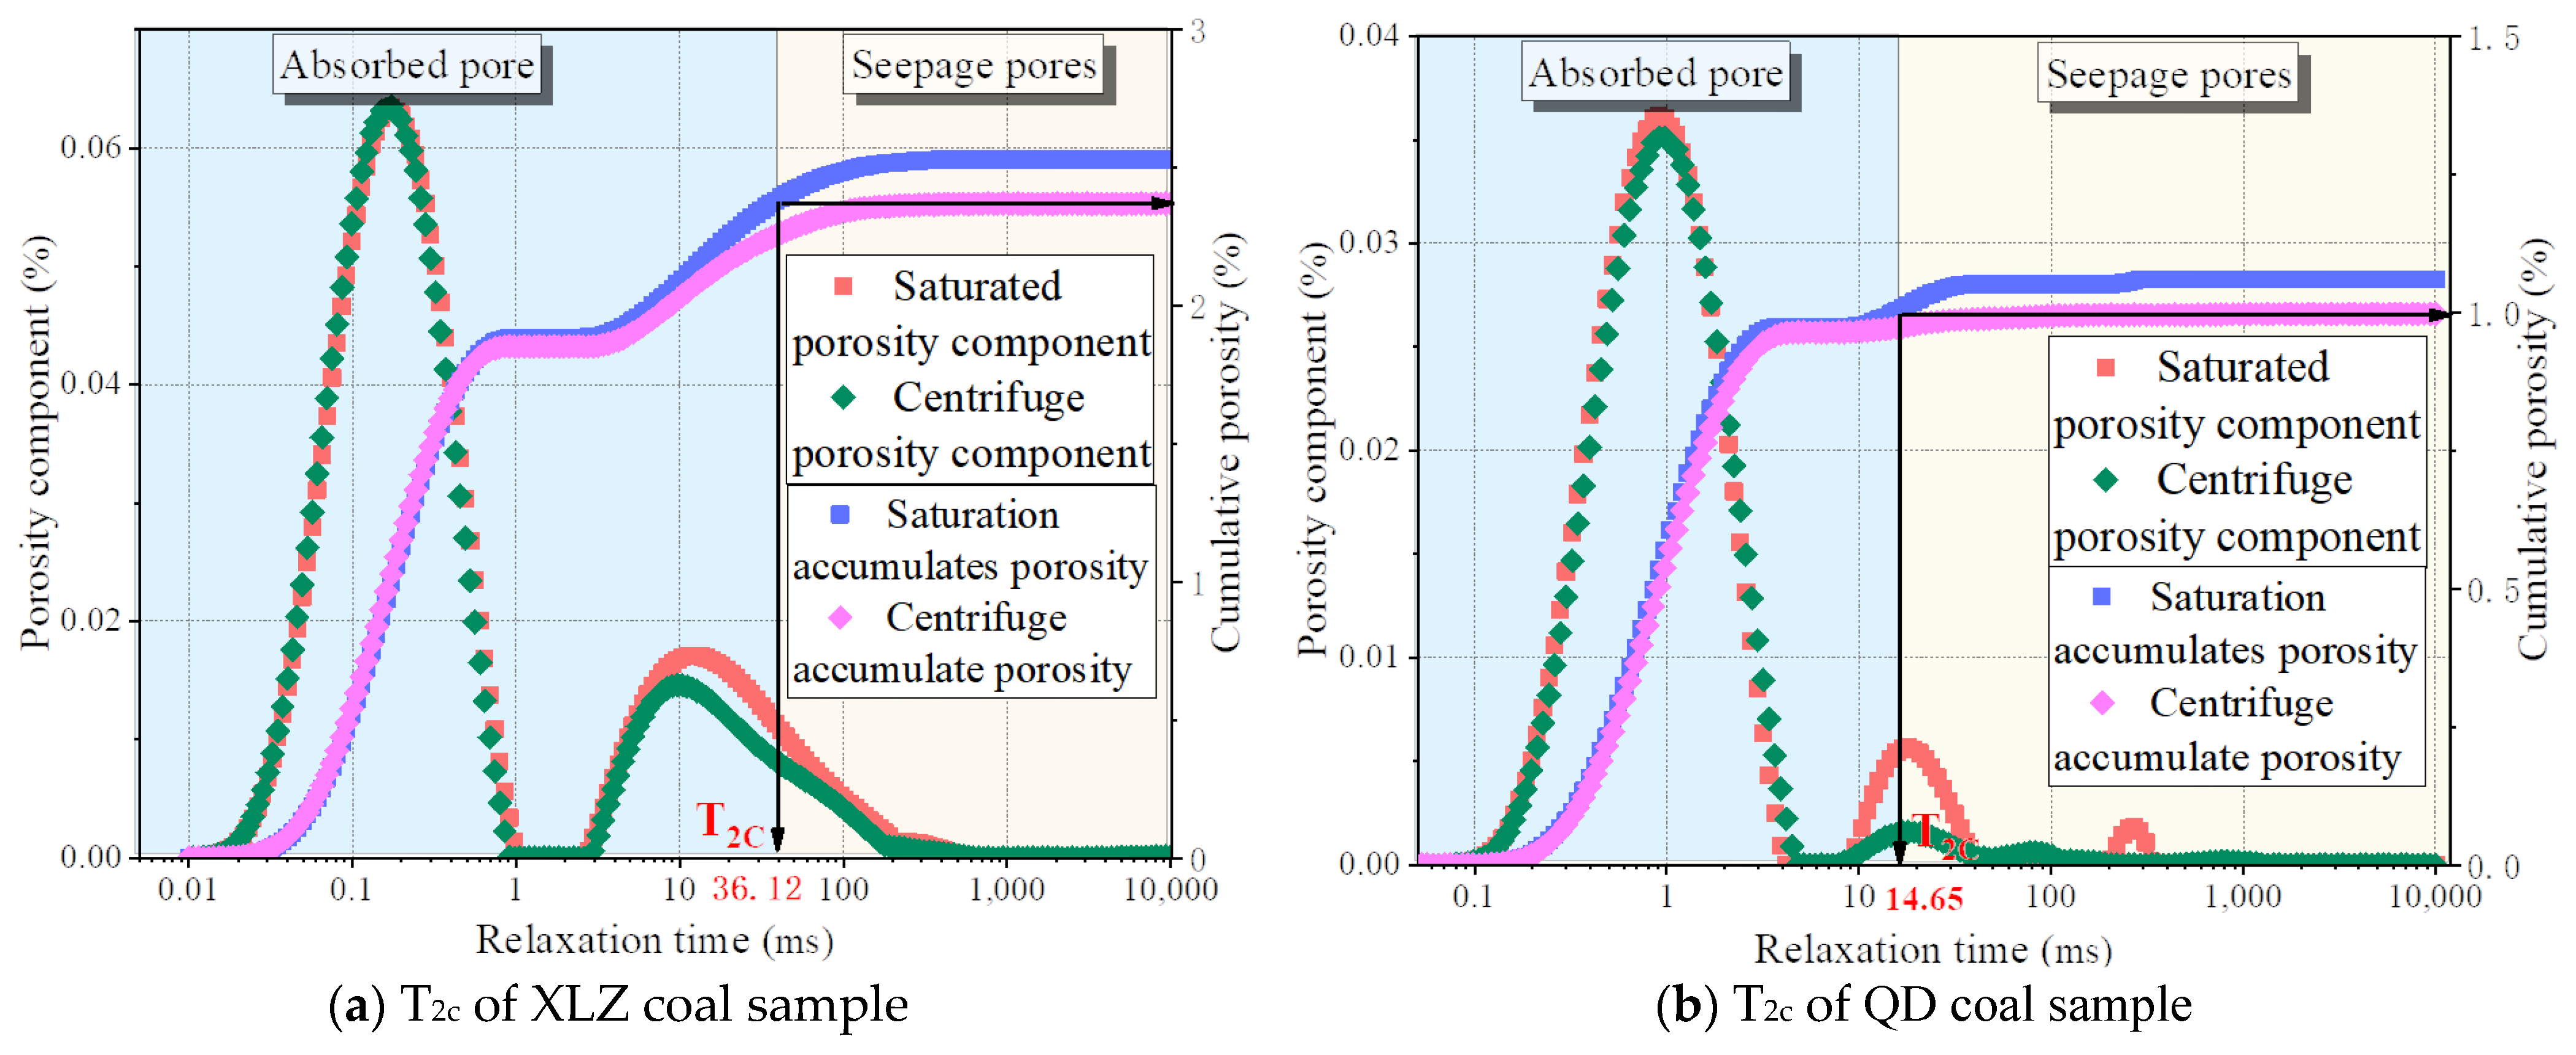
As shown in Figure 2, the T2 spectrum distribution curves and cumulative porosity curves of XLZ and QD saturated water samples before and after centrifugation are shown, respectively. The cumulative porosity curves of T2 spectrum before and after centrifugation under uniform rotation speed were made according to the “People’s Republic of China Petroleum and Natural Gas Industry Standard: SY/T 6747-2008 Nuclear Magnetic Resonance Logging Specification for Oil and Gas Exploration Wells [48]”. A horizontal line is made from the maximum value of the cumulative porosity curve of the T2 spectrum after centrifugation (i.e., the volume of bound water), which intersects with the cumulative porosity curve of saturated water. The vertical line is made from the intersection point to the X-axis, and the corresponding value is the T2 cutoff value. The T2c values of the XLZ and QD samples were 36.12 ms (corresponding pore radius = 0.72 μm) and 14.65 ms (corresponding pore radius = 0.29 μm), respectively. The maximum values of the T2 spectral curves of the XLZ and QD samples were 439.76 ms (corresponding pore radius = 8.21 μm) and 1245.88 ms (corresponding pore radius = 24.92 μm), respectively. Through data processing, we obtained the irreducible water saturation (83.39% and 93.41%, respectively) and the free water saturation (16.61% and 6.59%, respectively) of the XLZ and QD samples. Therefore, it can be obviously found that the proportion of free water in the XLZ coal sample is higher, and the porosity of the XLZ coal sample is higher than that of the QD coal sample, indicating that the seepage pores in the XLZ coal sample are more developed than the those in QD coal sample. This means that, in the XLZ sample, larger seepage pathways are connected to each other in the internal structure: a larger quantity of movable fluids prone to free flow and, hence, more easily displaced by gas, is present.

Figure 2.
T2 spectrum distributions and T2c calculation results of the water-saturated samples before and after centrifugation.
3.2. T2 Spectrum Distribution
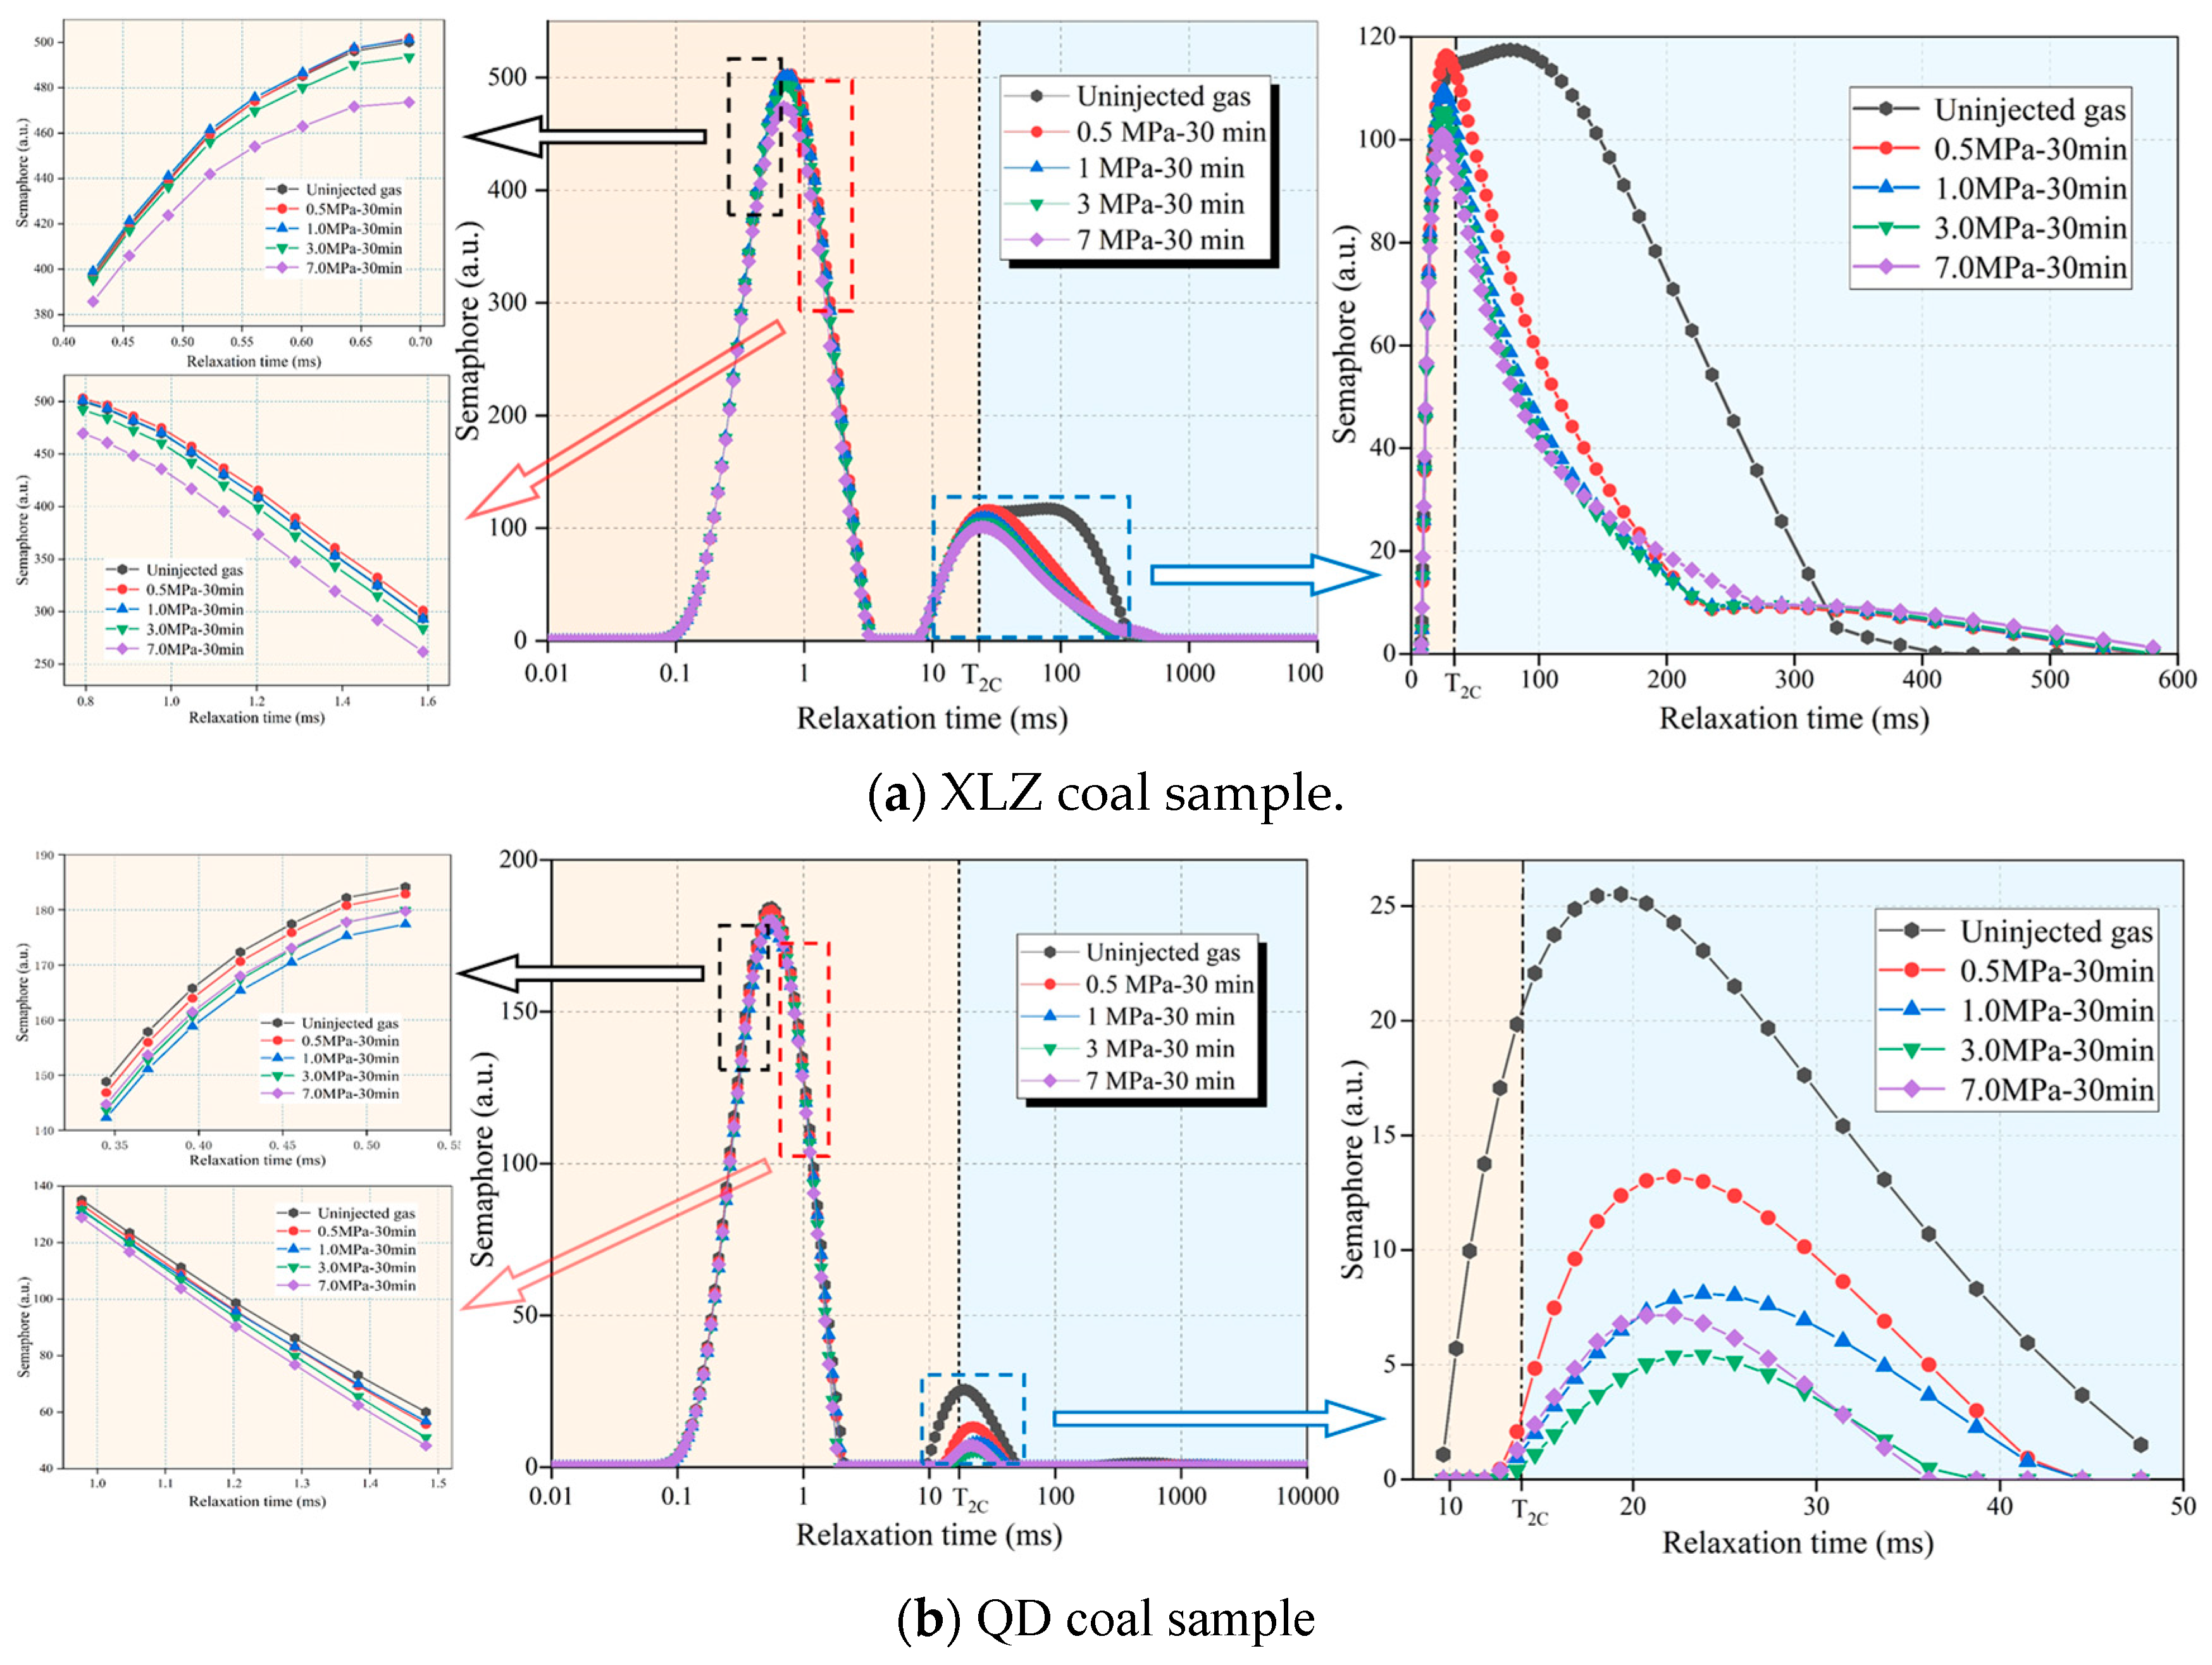
In the NMR experiments, the T2 amplitude of the NMR signal represents the hydrogen nucleus content of a certain diameter pore, which can be converted into the volume or mass of water according to calibration [28]. Therefore, according to the variation law of the T2 spectrum amplitude obtained through the test, we obtained the variation law of the sample water content under different gas injection pressures. The T2 spectra of XLZ and QD coal samples under different gas injection pressures are shown in Figure 3.

Figure 3.
T2 spectra of the XLZ and QD samples.
It can be seen from Figure 3 that the signal of the QD coal sample is much smaller than that of the XLZ coal sample, whether it is an adsorption pore or seepage pore, indicating that the porosity of the XLZ coal sample is larger than that of QD coal sample. During the experiment, the T2 spectrum of the XLZ coal sample changed significantly with the change in gas injection pressure. As shown in Figure 3a, under the same confining pressure, when the gas injection is started at 0.5 MPa pressure, the signal quantity of the adsorption pore section is almost unchanged, while the signal quantity of the seepage pore section is greatly less. With the continuous increase in gas injection pressure, the signal of the adsorption pore section still does not change much, and the signal of the seepage pore section decreases slowly. Until the gas injection pressure reaches 7 MPa, the signal of the adsorption pore section is significantly reduced, which mainly occurs in the pore range of 0.5–3.5 ms, while the signal of the seepage pore section is almost unchanged with the increase in gas injection pressure. We can see that the signal reduction rate of the seepage pore section is significantly higher than that of the adsorption pore section, indicating that the displacement effect of the seepage pore section is significantly better than that of the adsorption pore section.
For QD coal samples, as shown in Figure 3b, the overall trend of signal reduction is basically the same as that of XLZ coal samples, and the reduction mainly occurs in the seepage pore section, but the difference is that the signal amount of QD coal sample adsorption pore section shows different variation rules in different relaxation time ranges. For pores with relaxation time of less than 1 ms, the signal first increases and then decreases with increasing gas injection pressure. For pores with relaxation times larger than 1 ms, the signal increases with increasing gas injection pressure.
3.3. Pore size Distribution and Gas–Water Two-Phase Distribution
The gas–water two-phase migration process inside the coal body is affected by many factors. For example, the wettability of coal and the adsorption kinetics of gas will affect the distribution of gas–water two phase in coal to a certain extent. Saurabh Bhardwaj et al. believed that the wettability of pore surface can affect the flow of non-wetting phase fluid in porous media [49]. The finger-like fluid front advancement is observed in case of hydrophobic wetting pore surface whereas more stable advancement of fluid front is achieved in case of hydrophilic wetting of the pore surface at low porosity. It is further explored that the non-wetting phase saturation in the pore volume is more for hydrophilic wettability compared to mixed and hydrophobic wettability of the pores. Ahmed Farid Ibrahim et al. believed that the adsorption of CO2 on the coal wall would cause the coal matrix to expand, thereby reducing the absolute permeability of the coal body, resulting in a decrease in both gas phase permeability and liquid phase permeability [50]. With the increase in gas injection pressure, the swelling degree of coal matrix increases, which further reduces the gas permeability and liquid permeability of coal body, and ultimately affects the gas–water two-phase distribution state in coal body. It is worth noting that although the gas injection capacity will decrease at high gas injection pressure, the ability of coal to store CO2 in the form of adsorbed phase increases. Although factors such as wettability and gas adsorption can affect the distribution of gas–water two phase in the coal body to a certain extent, the main influencing factor is still the structural characteristics of the coal body itself. Therefore, we mainly analyze the influence of coal structure on the distribution of gas–water two phase.
The T2 distributions obtained for the coal samples from the NMR test reflected the behavior of water in pores of different sizes. The relaxation time of the smallest pores was the shortest, and vice versa. According to this principle, the relaxation time could be converted into pore size, to obtain the distribution of different pore sizes in the coal samples [51,52,53].
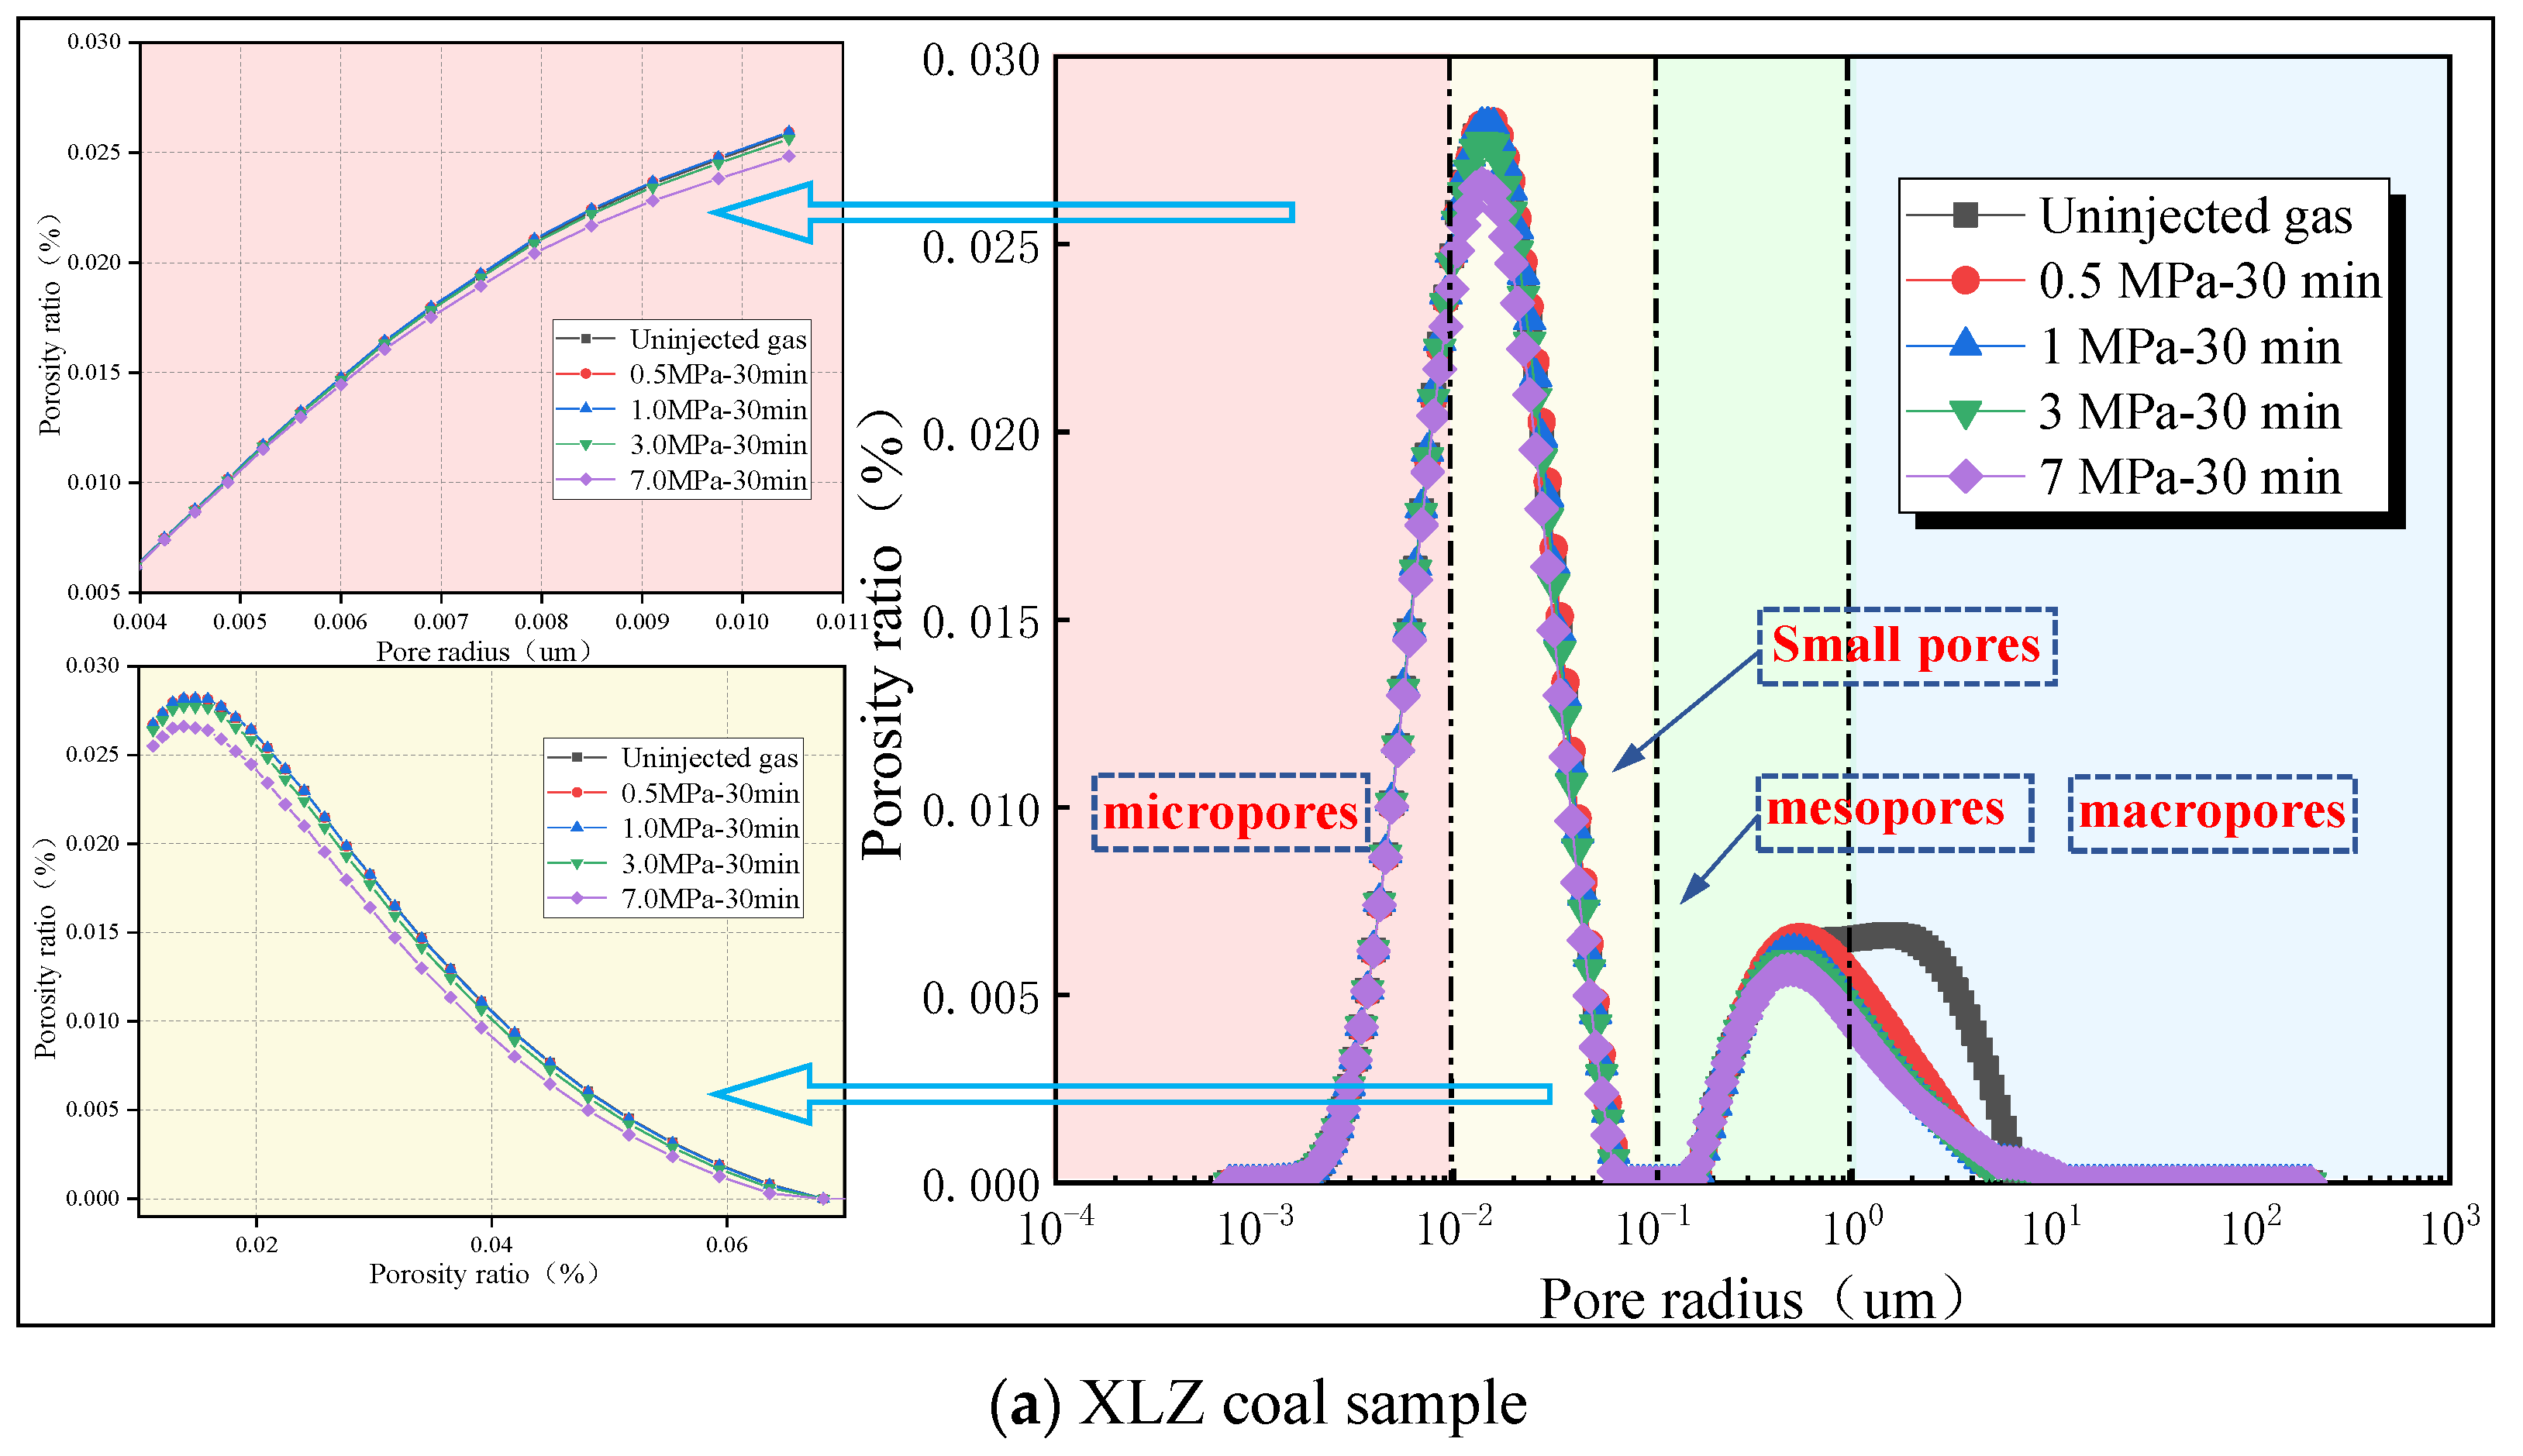
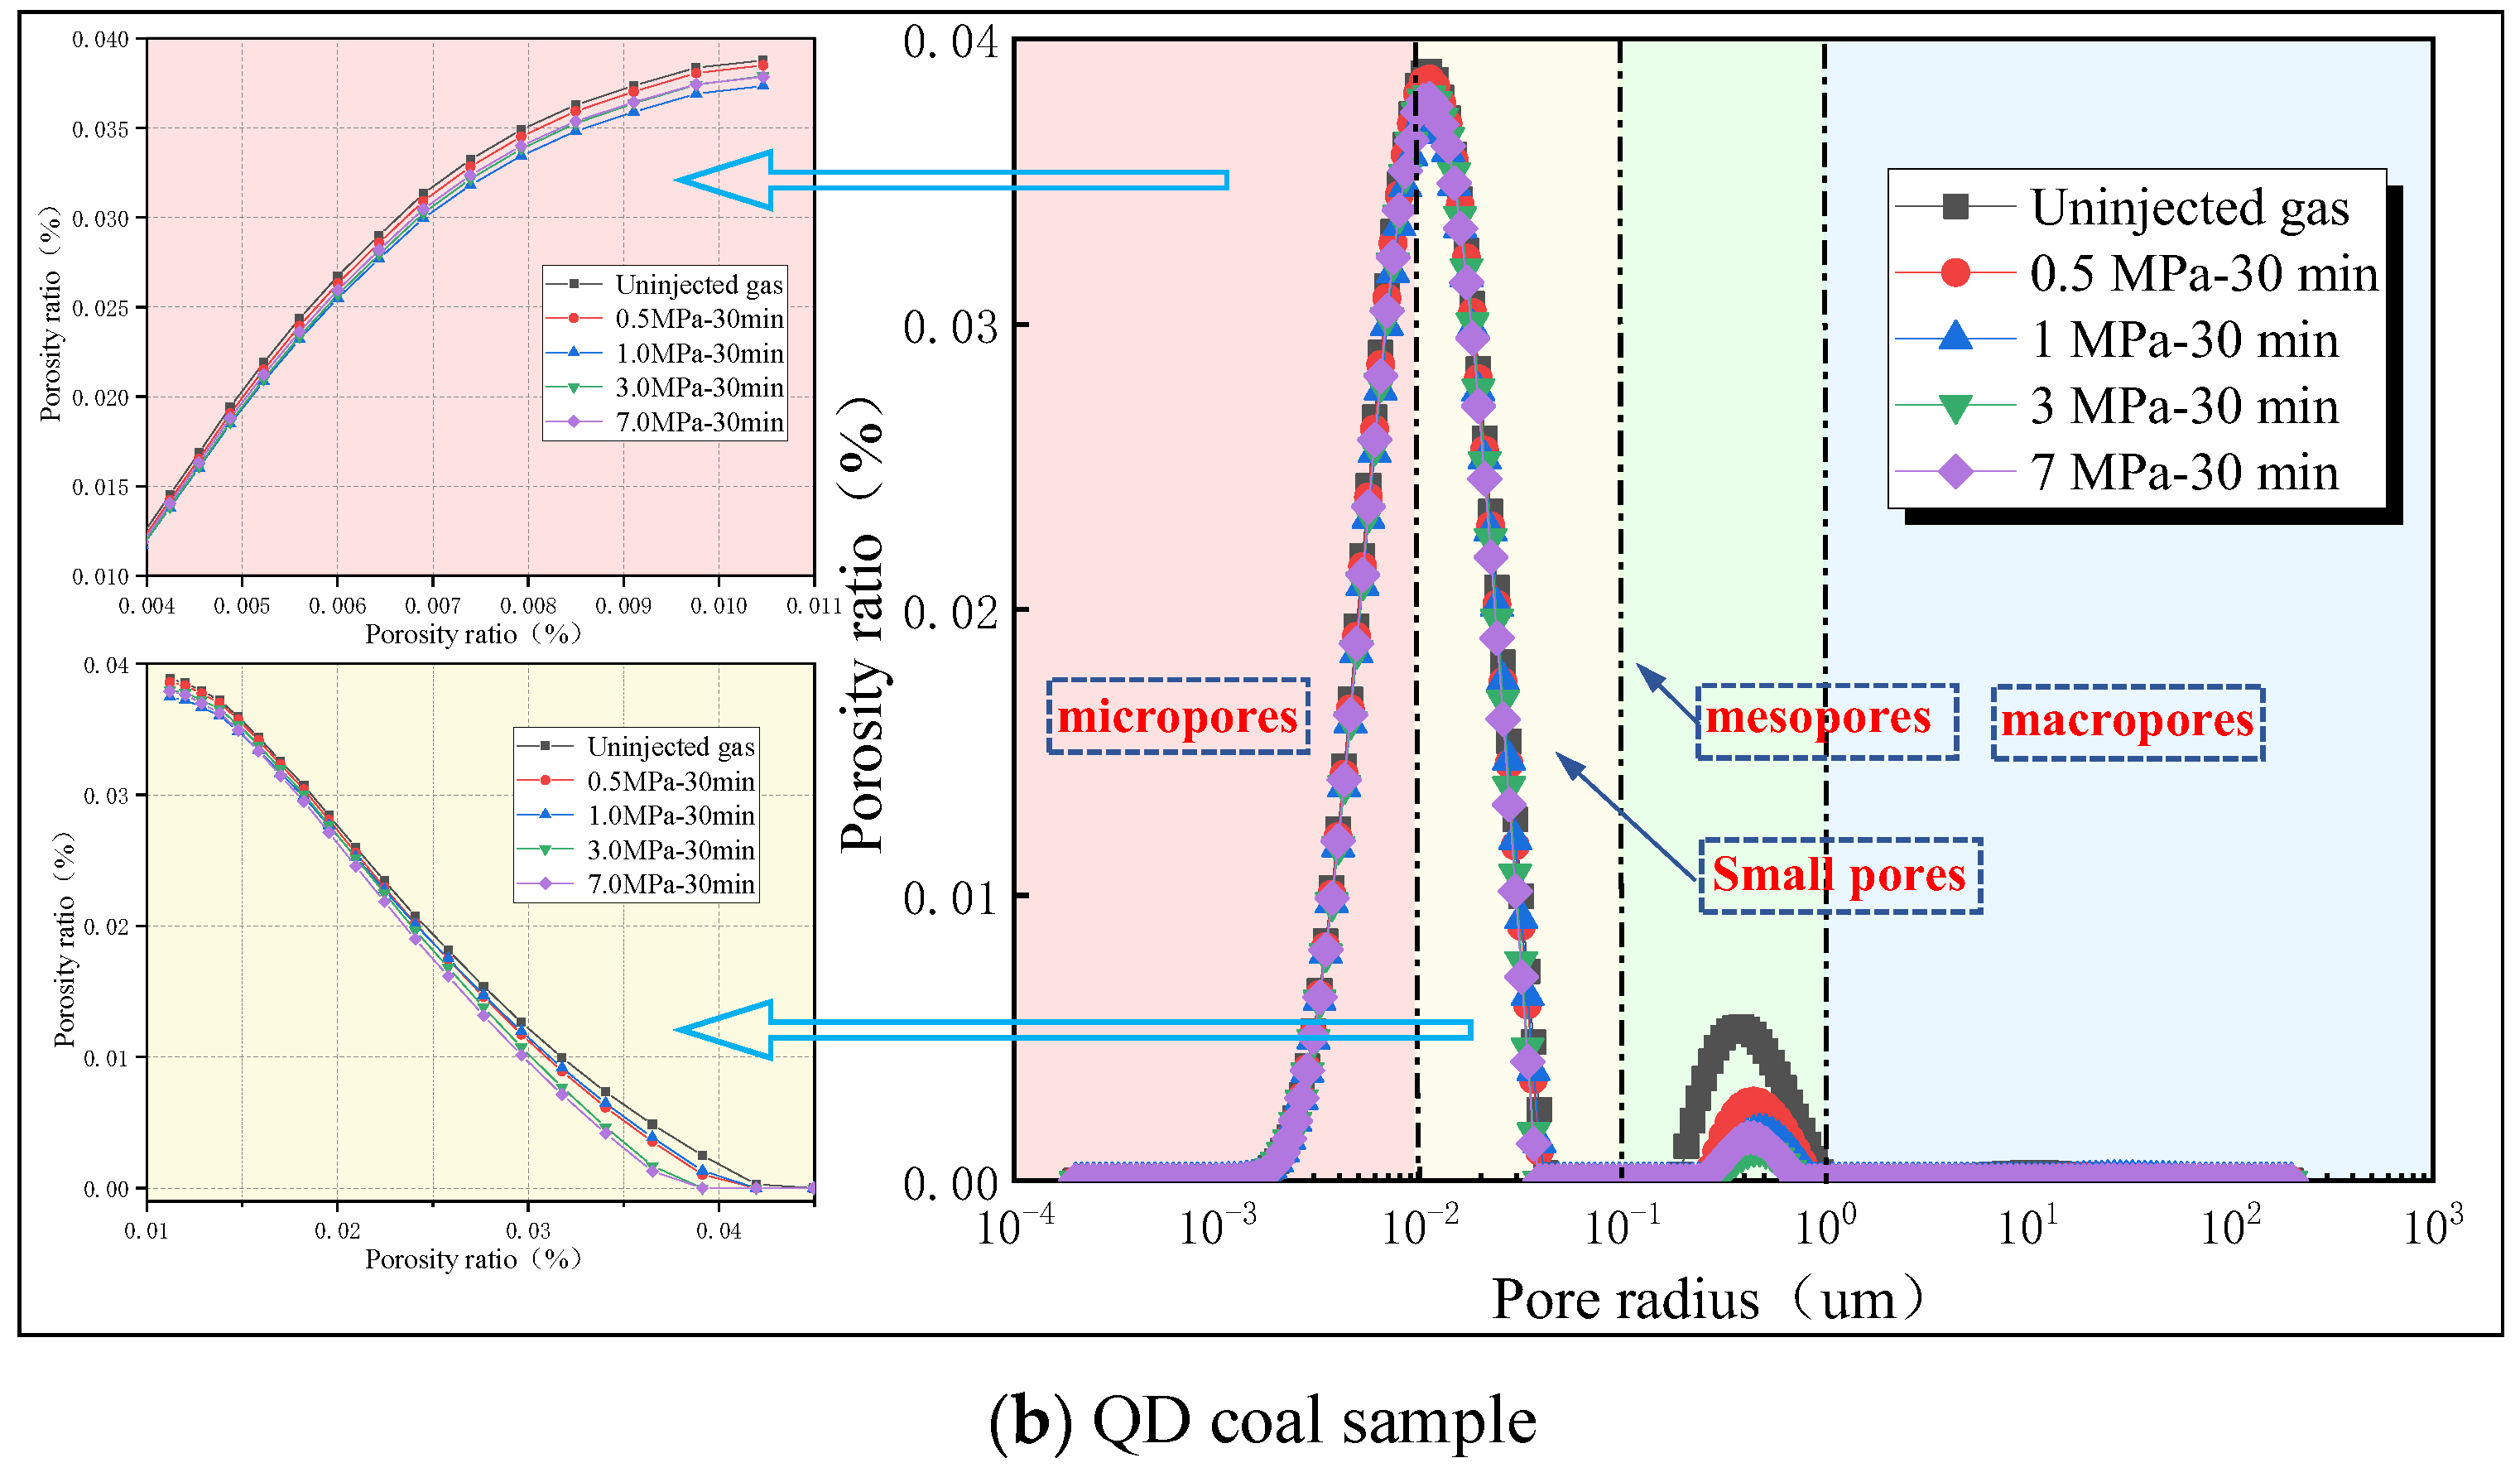
We aimed to clarify the pore size distribution in the mesopore structure, as well as the volume ratio changes. To facilitate the study of the pore structure, we considered four categories according to the Xoдoт B B method [54]: (1) micropores (φ ≤ 10.00 nm), which constitute the adsorption volume in coal; (2) small pores (10.00 nm ≤ φ ≤ 100.00 nm), which constitute the gas diffusion space; (3) mesopores (100.00 nm ≤ φ ≤ 1000.00 nm), which constitute a slow laminar penetration area; and (4) macropores (φ ≥ 1000.00 nm), which constitute the main penetration area. Therefore, the seepage pores are mainly large pores and mesopores, while the adsorption pores are mainly small pores and micropores.
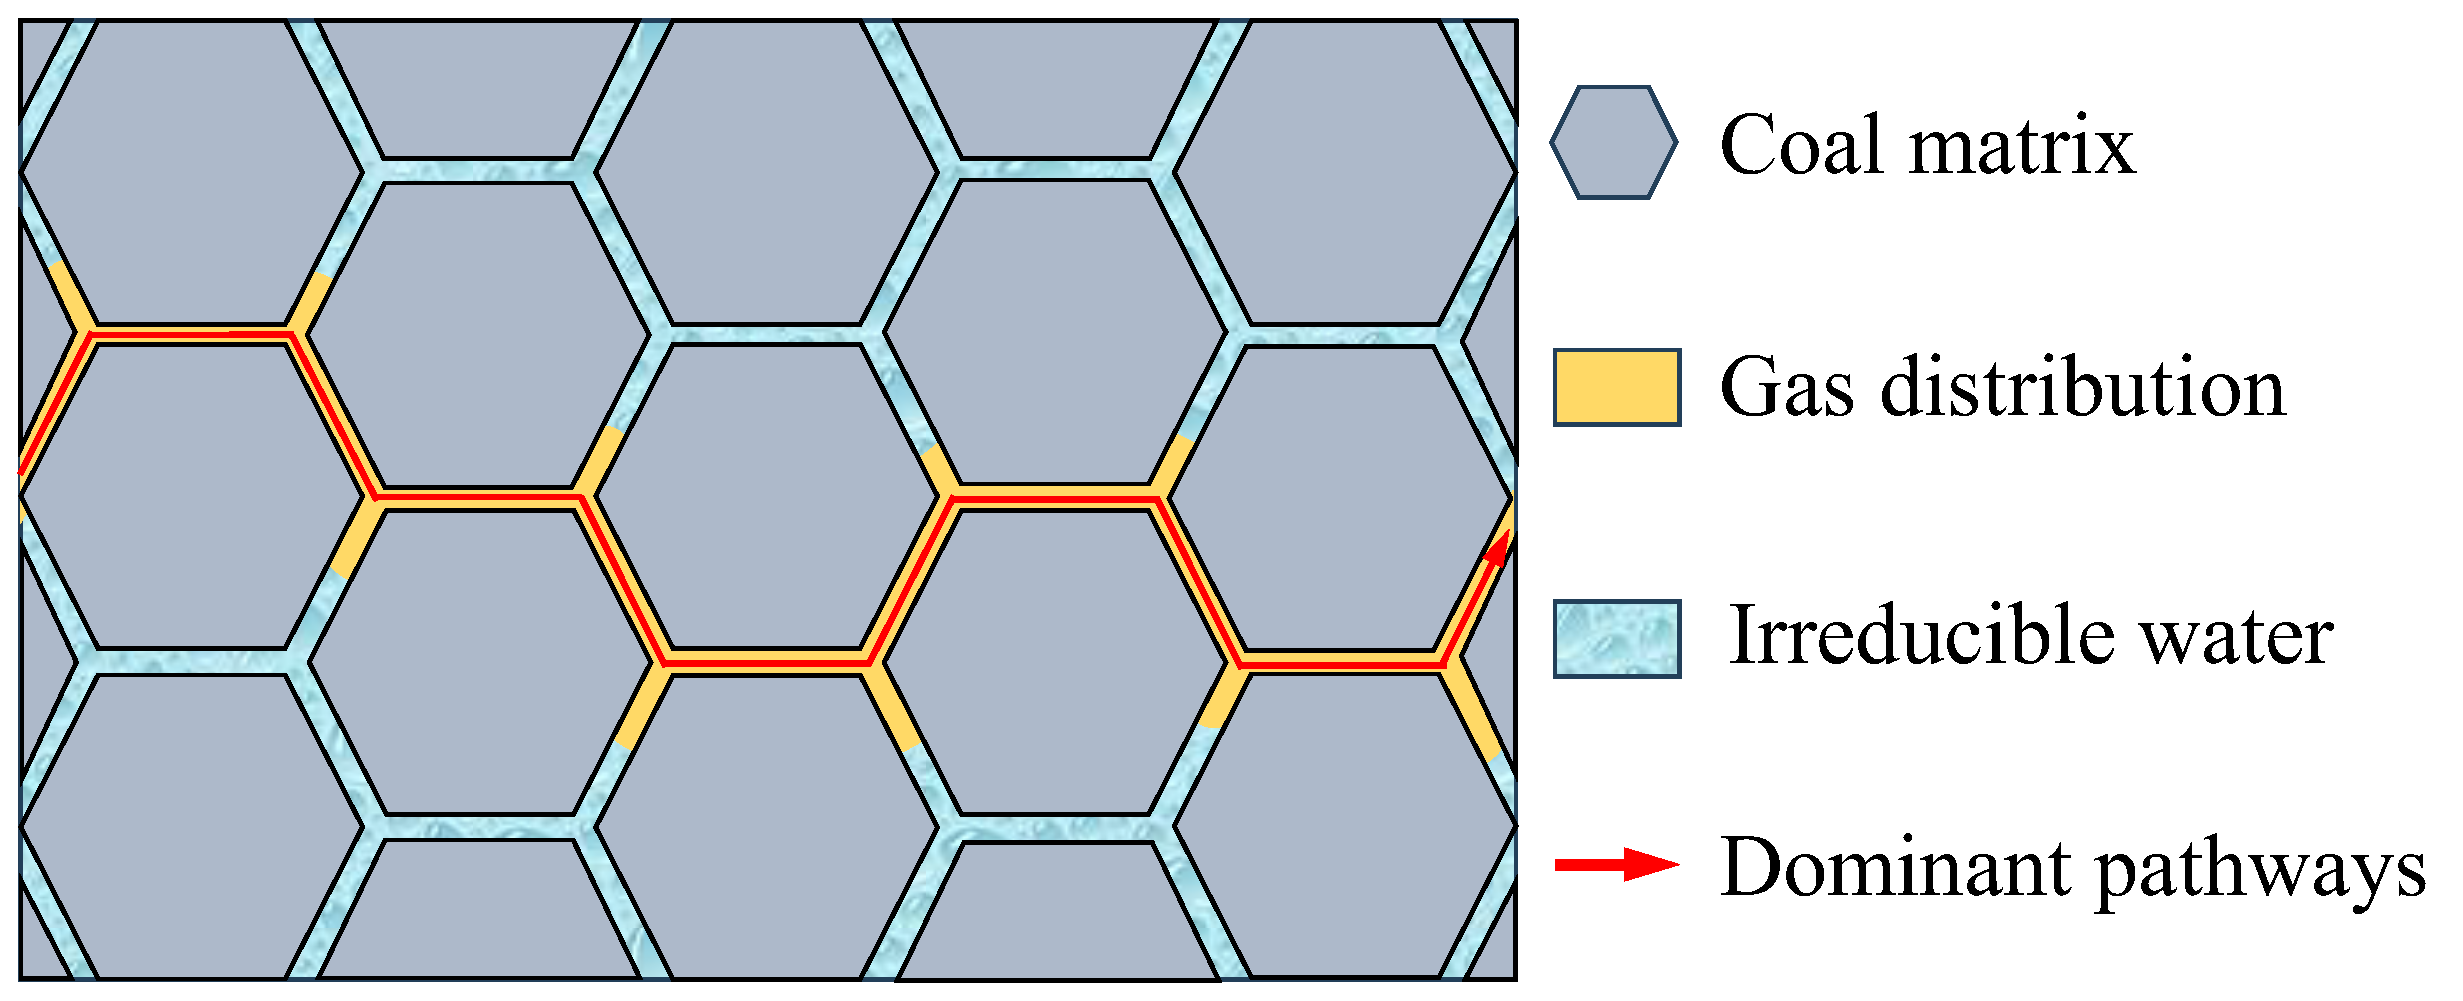
Figure 4 shows that the pore size distribution of the tested coal sample spans multiple scales, and the pore distribution inside the coal body is very complex. Obvious differences were noted in the distribution of the gas-liquid two-phase volume ratio among different pore ranges. With the increase in the gas pressure gradient, this distribution ratio showed dynamic changes. In the same coal sample, the pore water content is inversely proportional to the gas injection pressure. As the gas injection pressure increases, the water content decreases in each pore size range. It was shown that after the injection of the gas, a portion of the water in the pores of each scale was displaced by the gas, and the proportion of signal reduction is the proportion of pore volume of CO2 in the coal sample. It can be obviously seen that the gas saturation in medium and large pores is significantly higher than that in micro and small pores. By comparing the gas–water two-phase distribution of the micropores of the two coal samples, it can be found that the gas of the QD coal sample enters into smaller pores and distributes more widely in the micropore range. This is because, in the process of gas injection to drive water, the gas will first be displaced along the pathway with the smallest resistance (dominant pathway). When the dominant pathway is penetrated, the gas mainly passes through it and rarely displaces the water in other pores. Only when the gas injection pressure increases sharply will it further penetrate other pathways, which explains why even if the gas injection pressure increases, the displacement efficiency is always low. The gas-water two-phase distribution diagram around the dominant channel is shown in Figure 5.
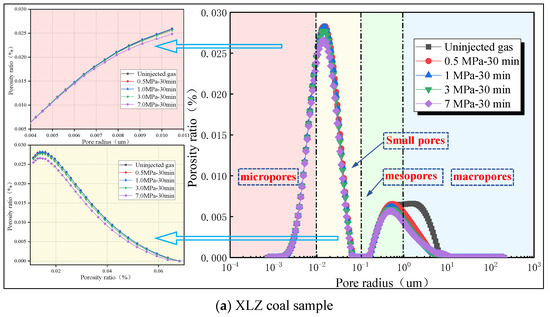

Figure 4.
Pore size distributions in the XLZ and QD samples.

Figure 5.
The schematic diagram of the dominant pathways.
The dominant pathways include pores in each pore size range, which is related to the porosity of coal. For coal with high porosity, the density of pore distribution is large, and the possibility of connecting mesopores and macropores is greater. The dominant pathways are mostly composed of such pores and rarely involve micro and small pores. However, for coal with low porosity, the density of pore distribution is small, and the connectivity between medium and large pores is weak. Relying only on medium and large pores cannot form a pathway so the dominant pathways must include a considerable amount of micro and small pores, and the gas enters smaller pores.
Liu et al. [55] conducted a gas–water micro-flooding experiment through a real sandstone micro-model and realized the visualization of the gas–water flooding process. The experimental results are consistent with the analysis in this paper.
3.4. Displacement Efficiency
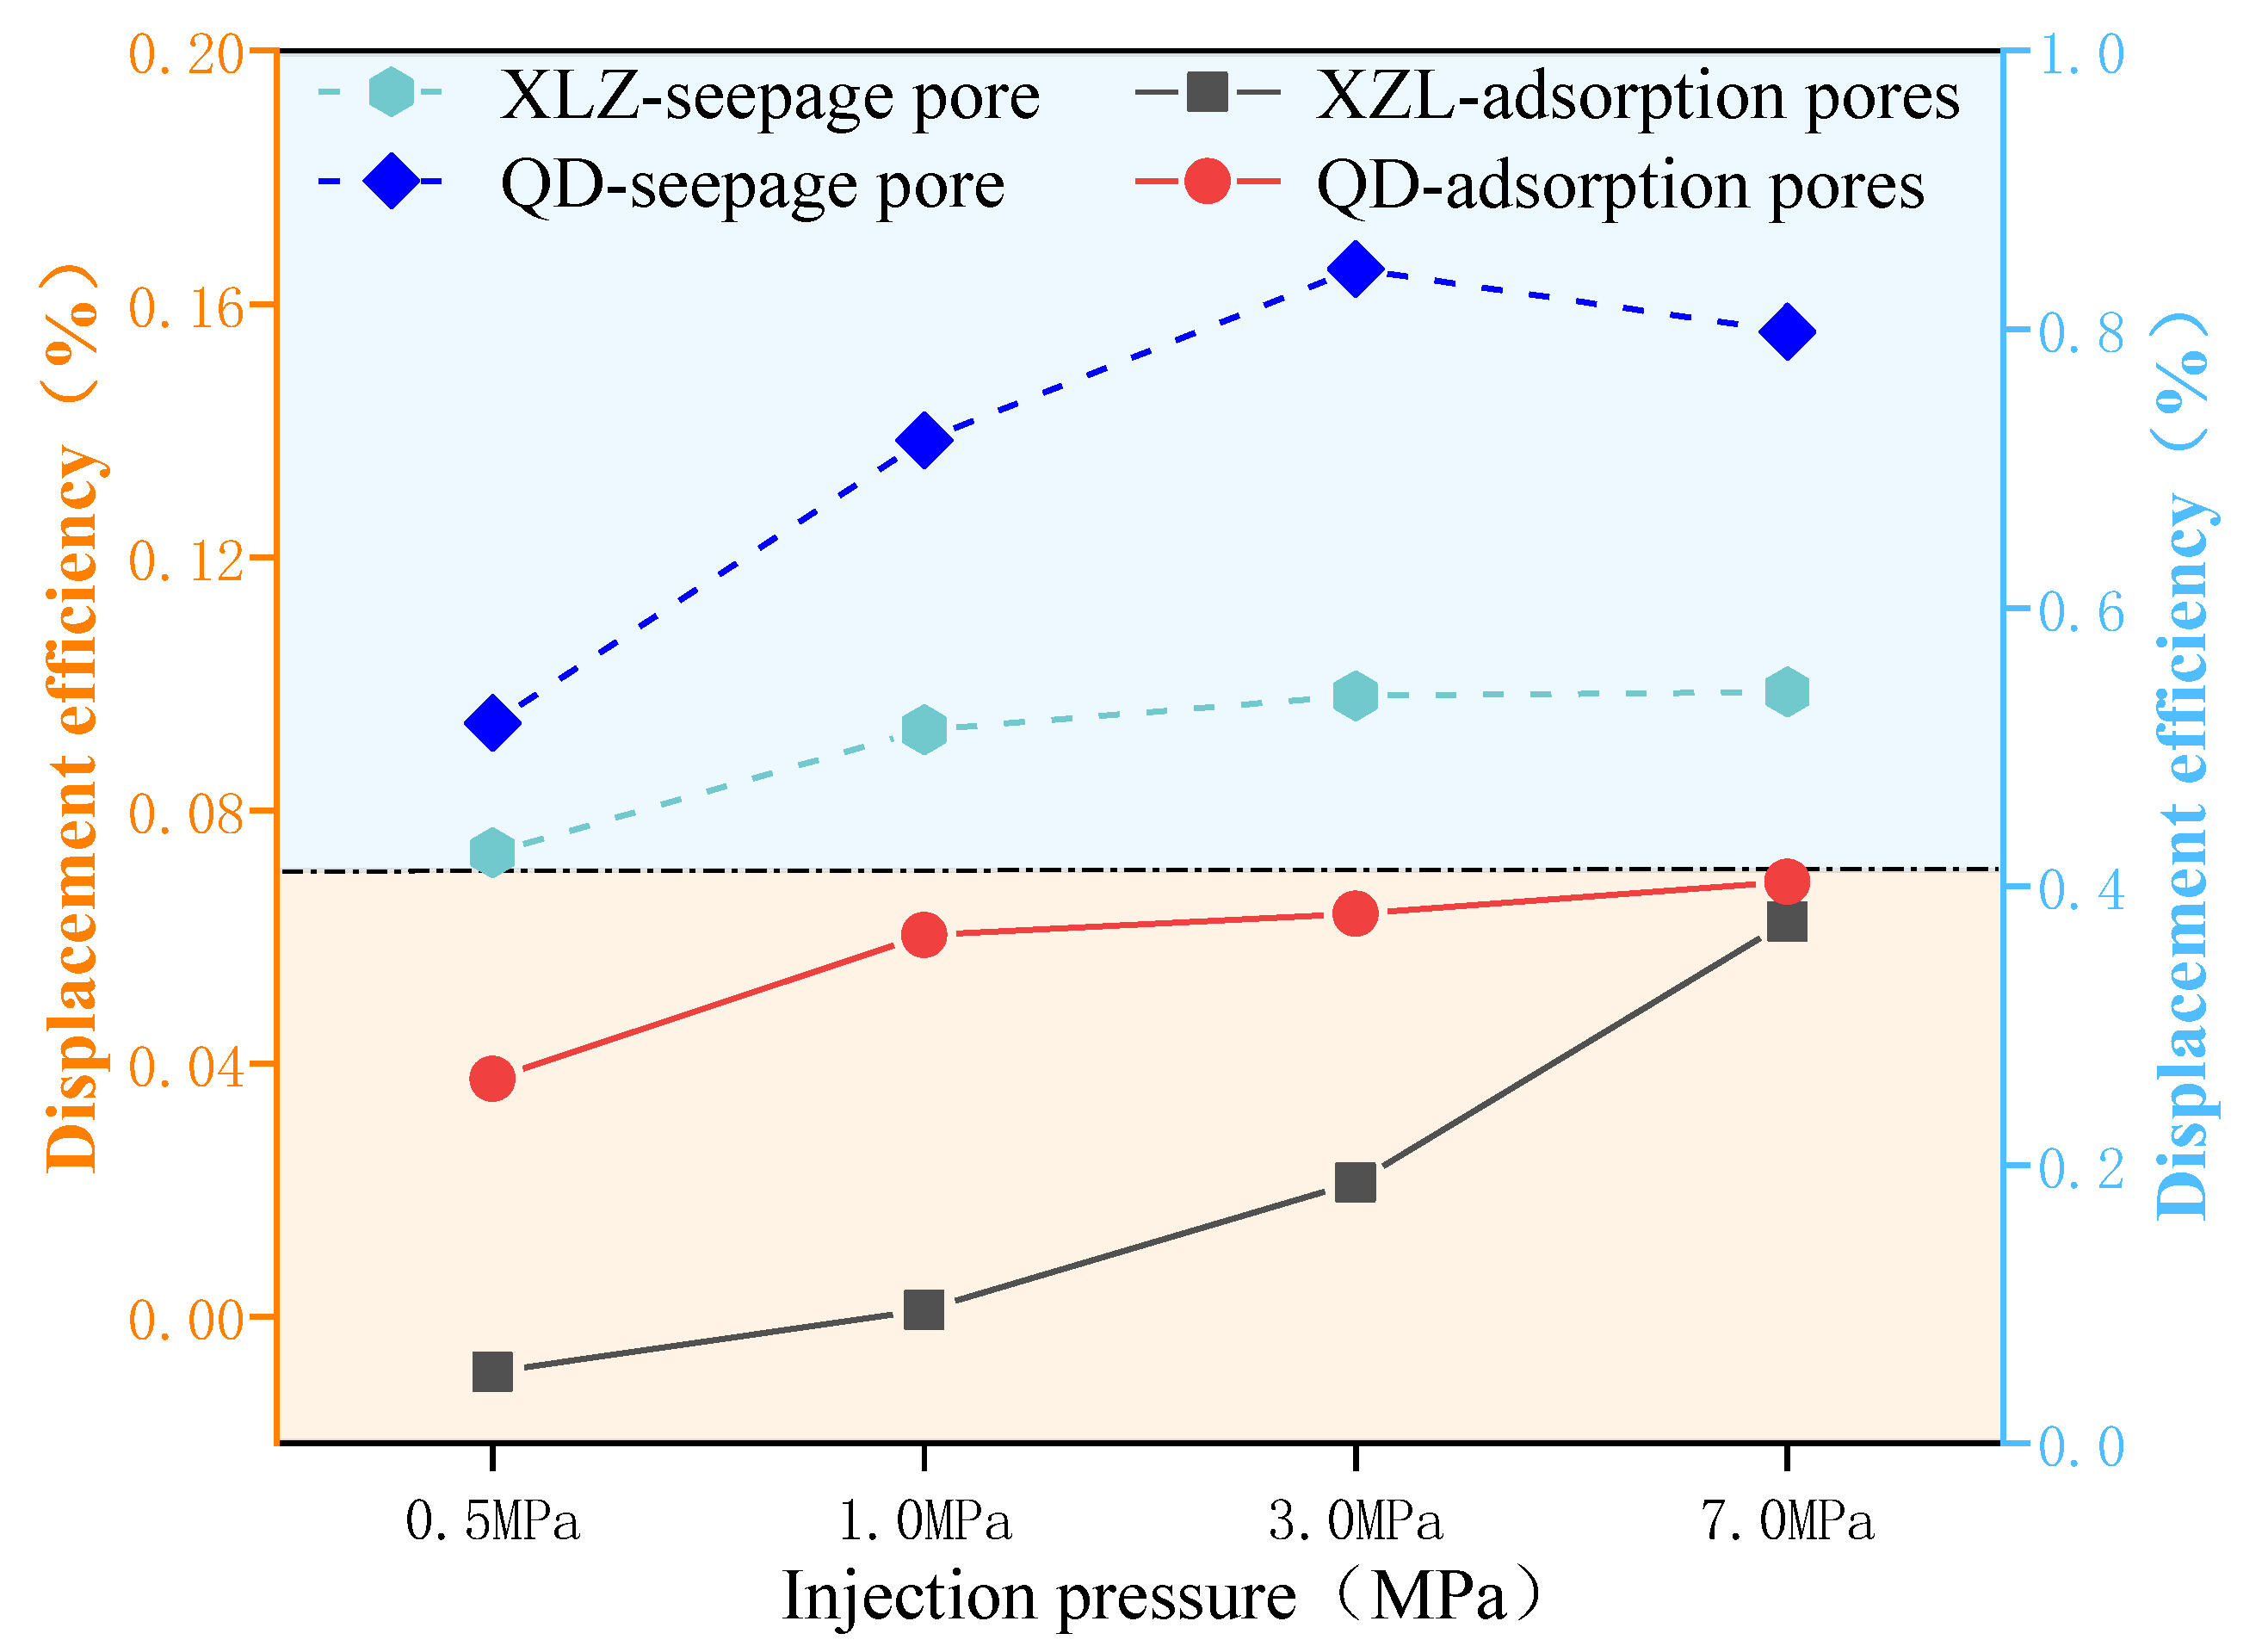
Figure 6 shows the displacement efficiency of each pore section of the coal sample under each displacement pressure. We know that the displacement efficiency of QD coal samples with low porosity is higher than that of XLZ coal samples, whether it is adsorption pores or seepage pores. This is because the pore structure of QD coal samples is relatively simple, and the proportion of closed water formed during the penetration of dominant pathways is small. For XLZ coal samples, the pore structure is more complex. Each pore connects several pores through the throat to form multiple pathways, but only a few can be connected, which forms a large amount of closed water. It can be seen from the figure that the displacement efficiency of the adsorption pores of the QD coal sample does not change much with the gas injection pressure (from 3.8% to 6.9%). This is because the porosity of the QD coal sample is low, so it is difficult to have a new breakthrough pathway. However, the displacement efficiency of the adsorption pores of XLZ coal samples increased significantly with the increase in gas injection pressure (from −0.87% to 6.2%), indicating that the adsorption pores of XLZ coal samples gradually appeared new breakthrough pathways with the increase in gas injection pressure. The displacement efficiency of the seepage pores of the two coal samples did not change dramatically with the increase in gas injection pressure, indicating that no new breakthrough pathways appeared during the displacement process. Xiao et al. [31] used an NMR experiment to obtain similar experimental results when studying the displacement efficiency of water flooding gas reservoirs under different displacement pressure gradients. They believed that low-permeability reservoirs have high-water flooding gas displacement efficiency, while high-permeability reservoirs have low displacement efficiency. When the displacement pressure gradient continues to increase, the displacement efficiency increases first and then decreases.

Figure 6.
Comparison of displacement efficiency of different pore sections.
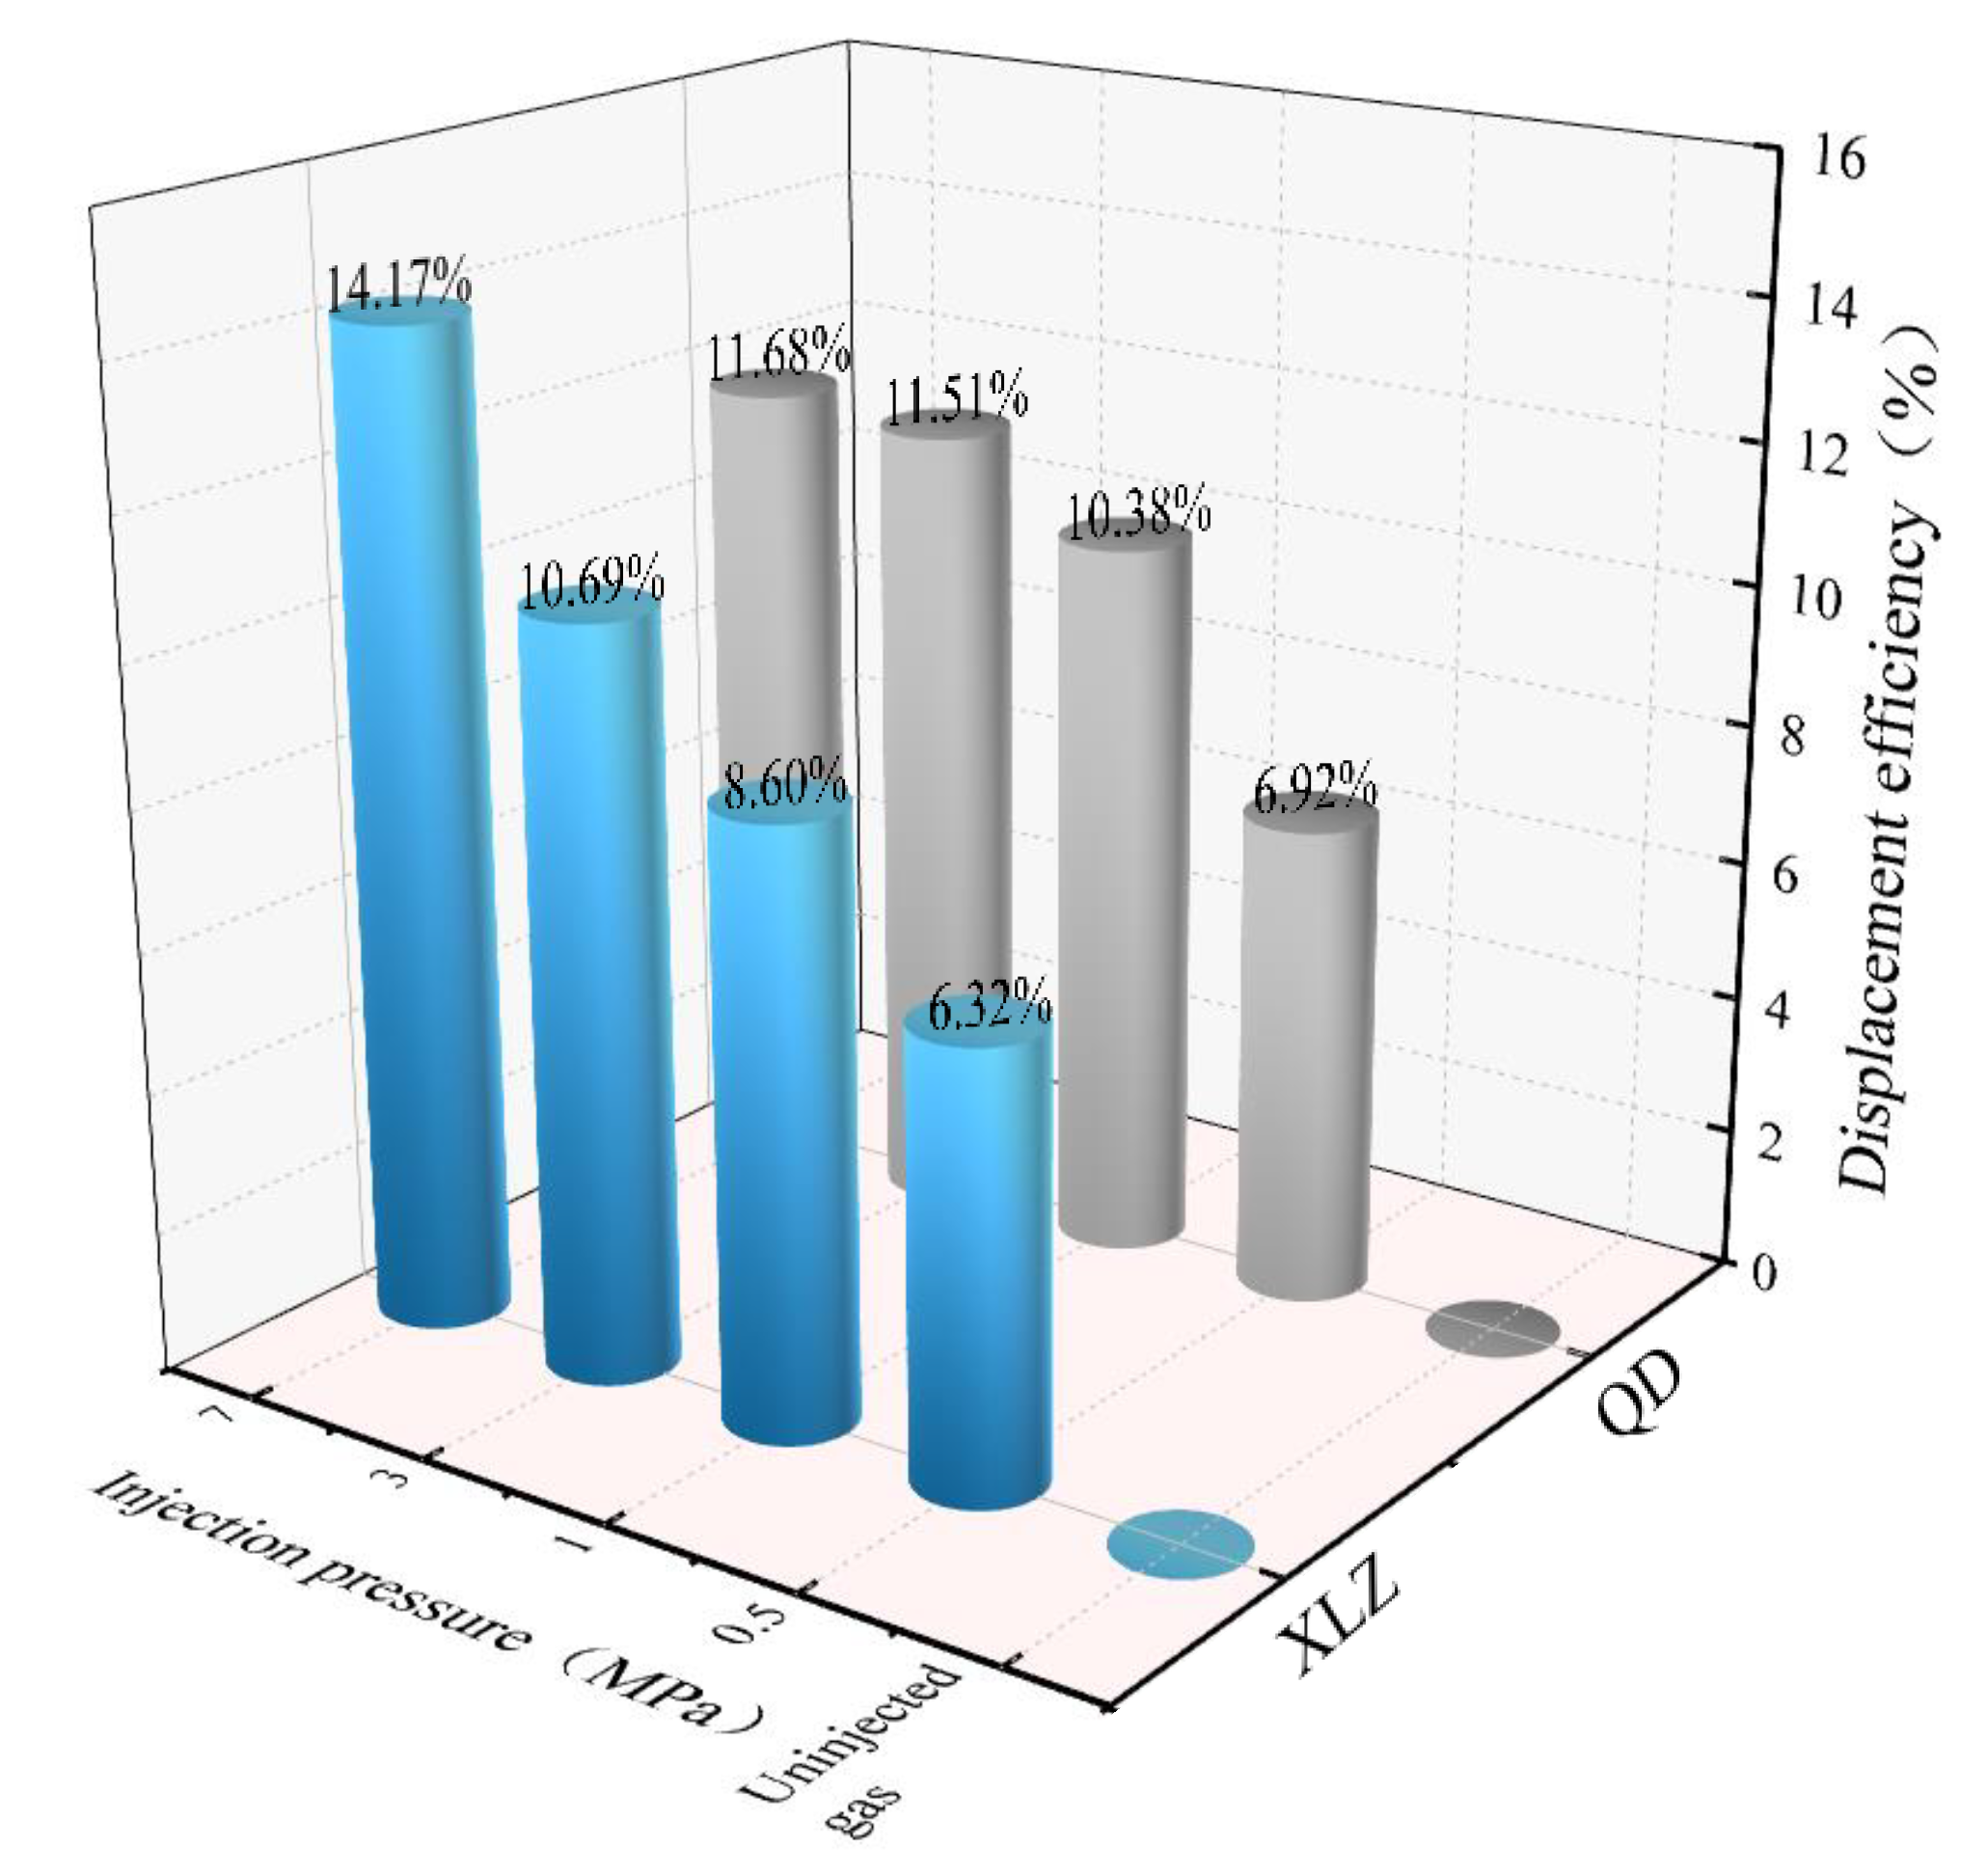
By analyzing the reduction of the T2 spectrum signal, we obtained the displacement efficiency images under different gas injection pressures (Figure 7). During the whole core displacement process of the XLZ sample, under a continuous increase in the gas injection pressure, the displacement efficiency gradually increased. When the gas injection pressure is 0.5 MPa, the displacement efficiency is 6.32%. When the gas injection pressure increases to 7 MPa, the highest displacement efficiency is 14.17%. As can be seen from the figure, the displacement efficiency of XLZ coal sample increases gradually, but the change range decreases gradually. The displacement efficiency of the QD coal sample is proportional to the gas pressure. At a gas injection pressure of 0.5 MPa, the displacement efficiency is 6.92%, which is slightly higher than that of the XLZ coal sample. When the gas injection pressure is increased to 7 MPa, the highest displacement efficiency is 11.68%, which is lower than the efficiency of the XLZ coal sample. As can be seen from the figure, the increment of the displacement efficiency of the QD coal sample gradually decreases as the gas injection pressure increases and eventually settles down.

Figure 7.
Displacement efficiency in the XLZ and QD samples.
4. Discussion
4.1. Aperture Distribution Fractal Dimension
Since the crack–pore structure of coal rock has fractal characteristics, Zhang et al. could establish the following fractal model based on the nuclear magnetic T2 distribution and the fractal theory [56]:
where Sv is the ratio of the sum of the pore volumes with a lateral relaxation time less than T2 to the total pore volume. T2, lg(Sv), and lg(T2) (obtained from the NMR analysis) were linearly fitted: the fitting slope was K = 3 − D. The fractal dimension of the liquid phase distribution of coal samples under the experimental conditions of nuclear magnetic resonance is as follows:
Based on Equation (1), as long as an coordinate system was established and each point in the diagram was linearly fitted, the fractal dimension of the three-dimensional pore structure could be calculated from the fitting slope.
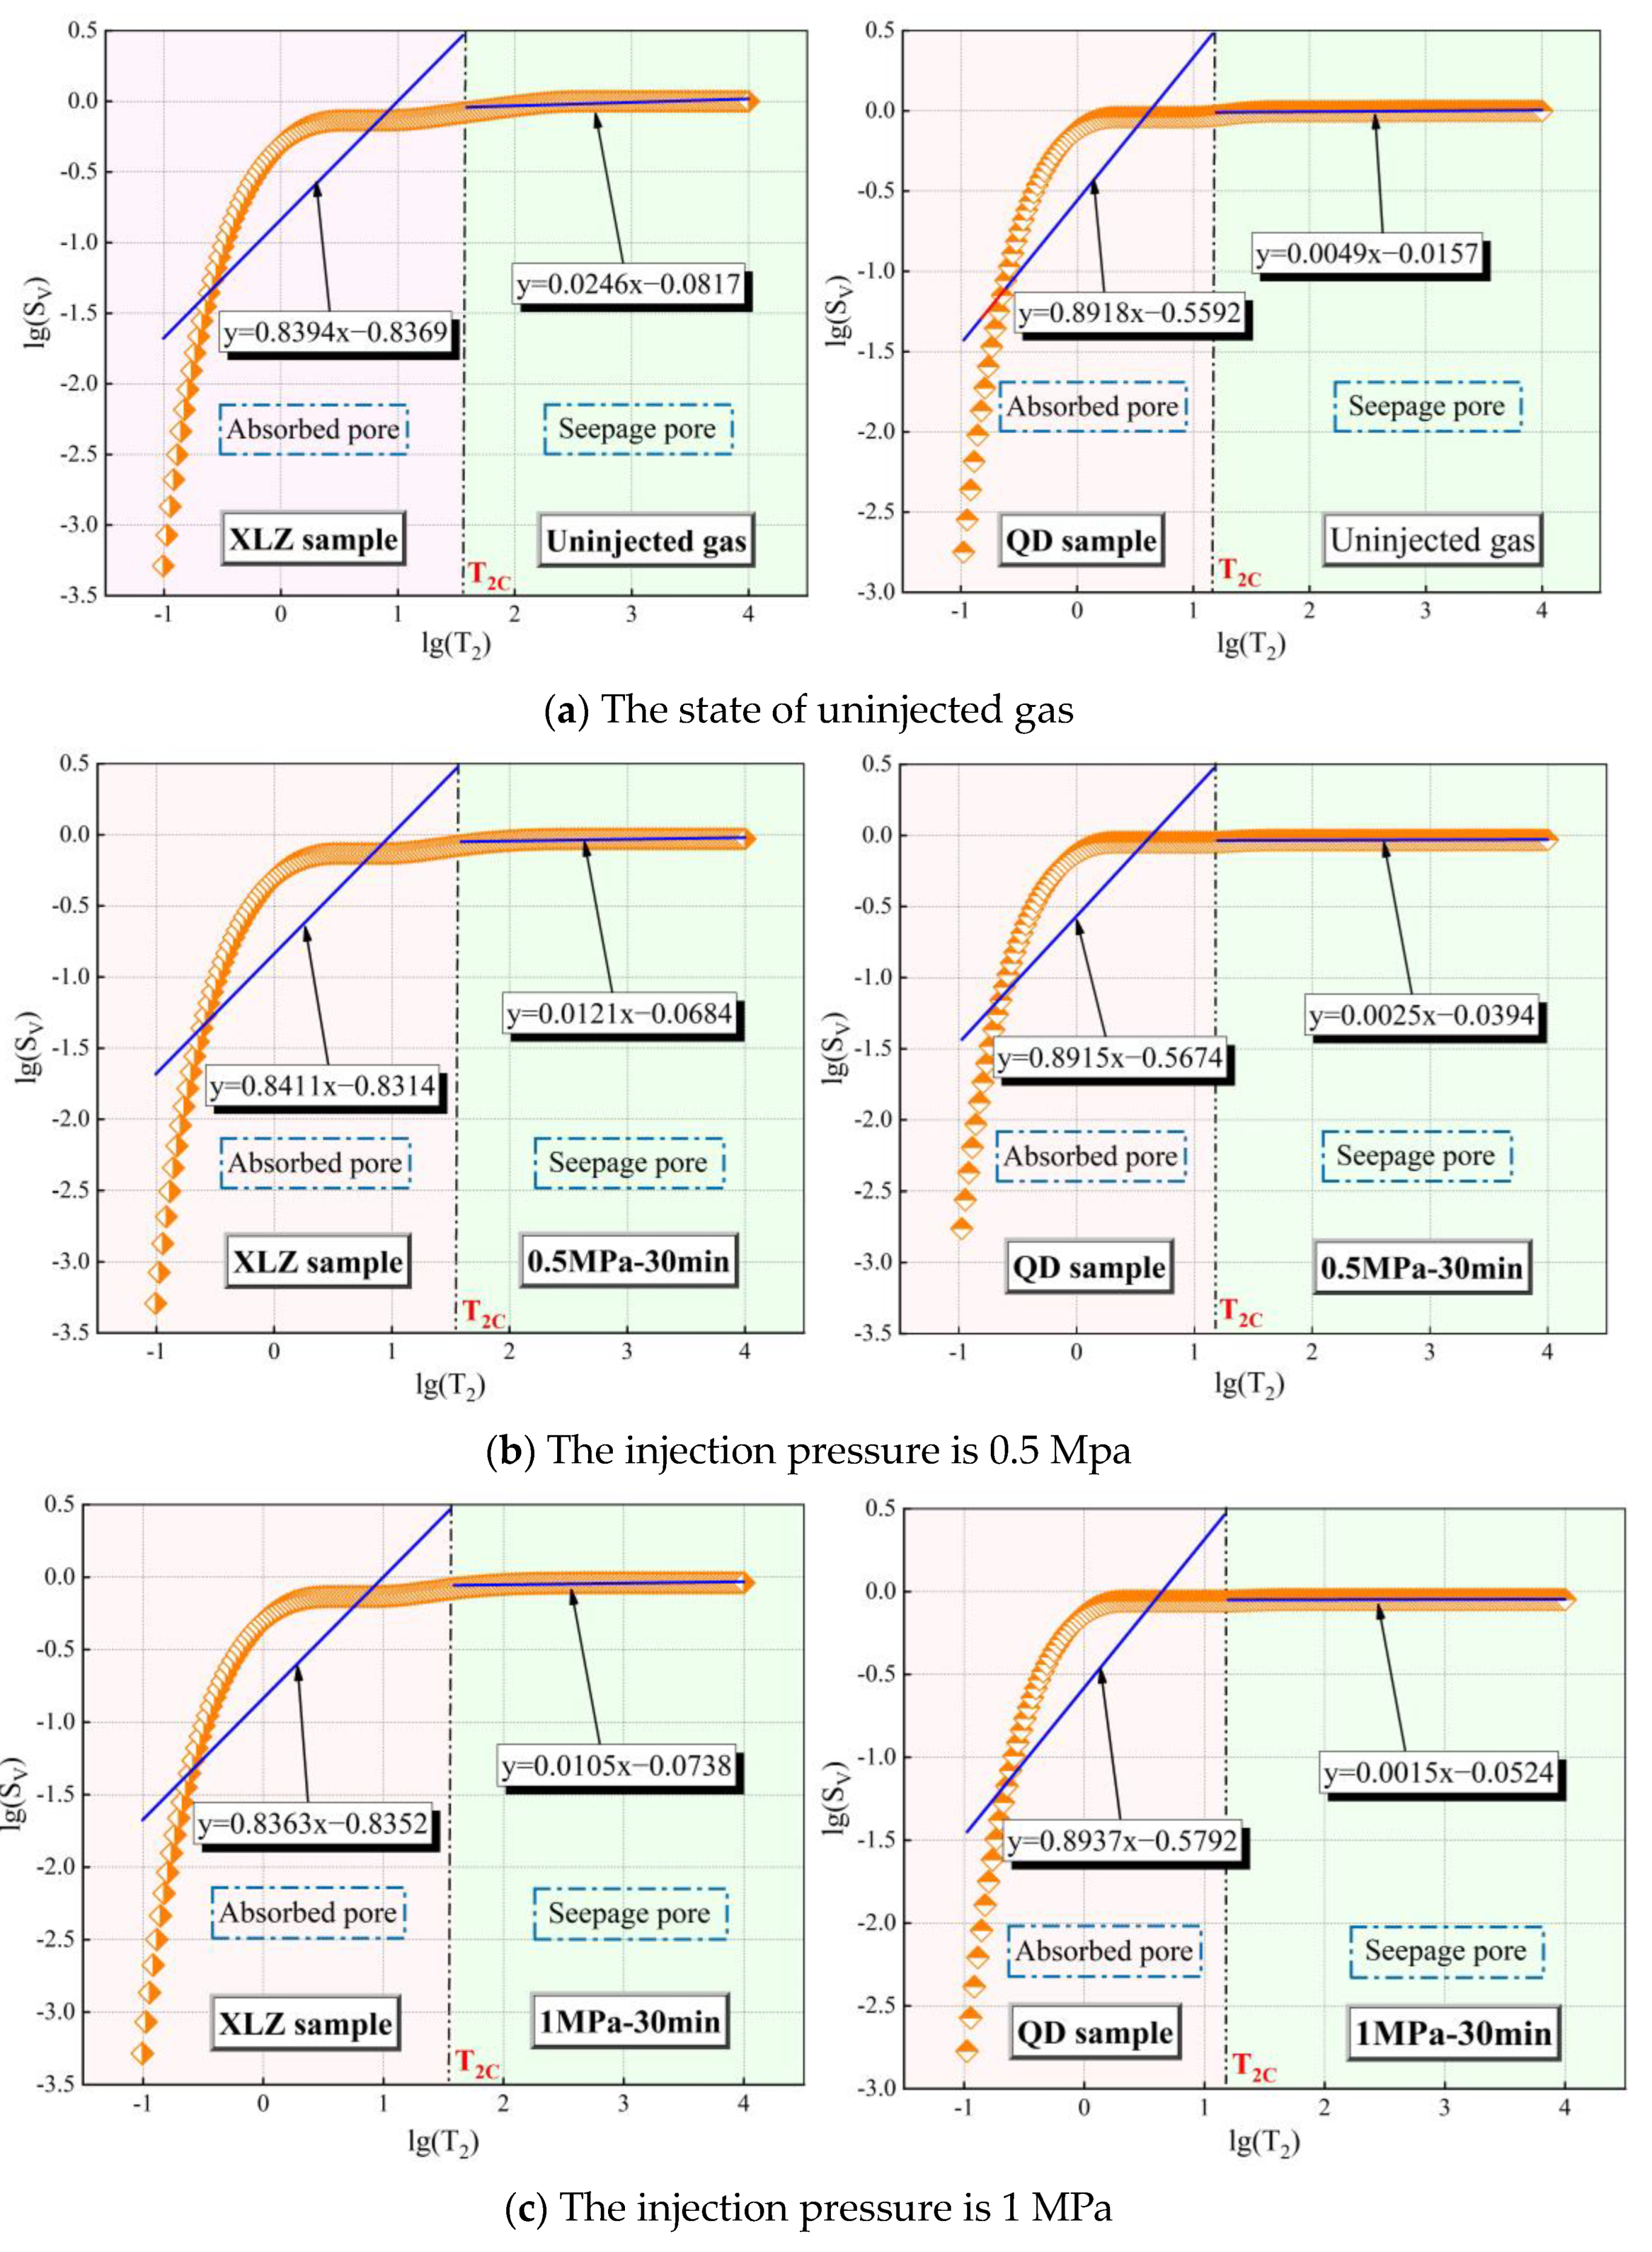
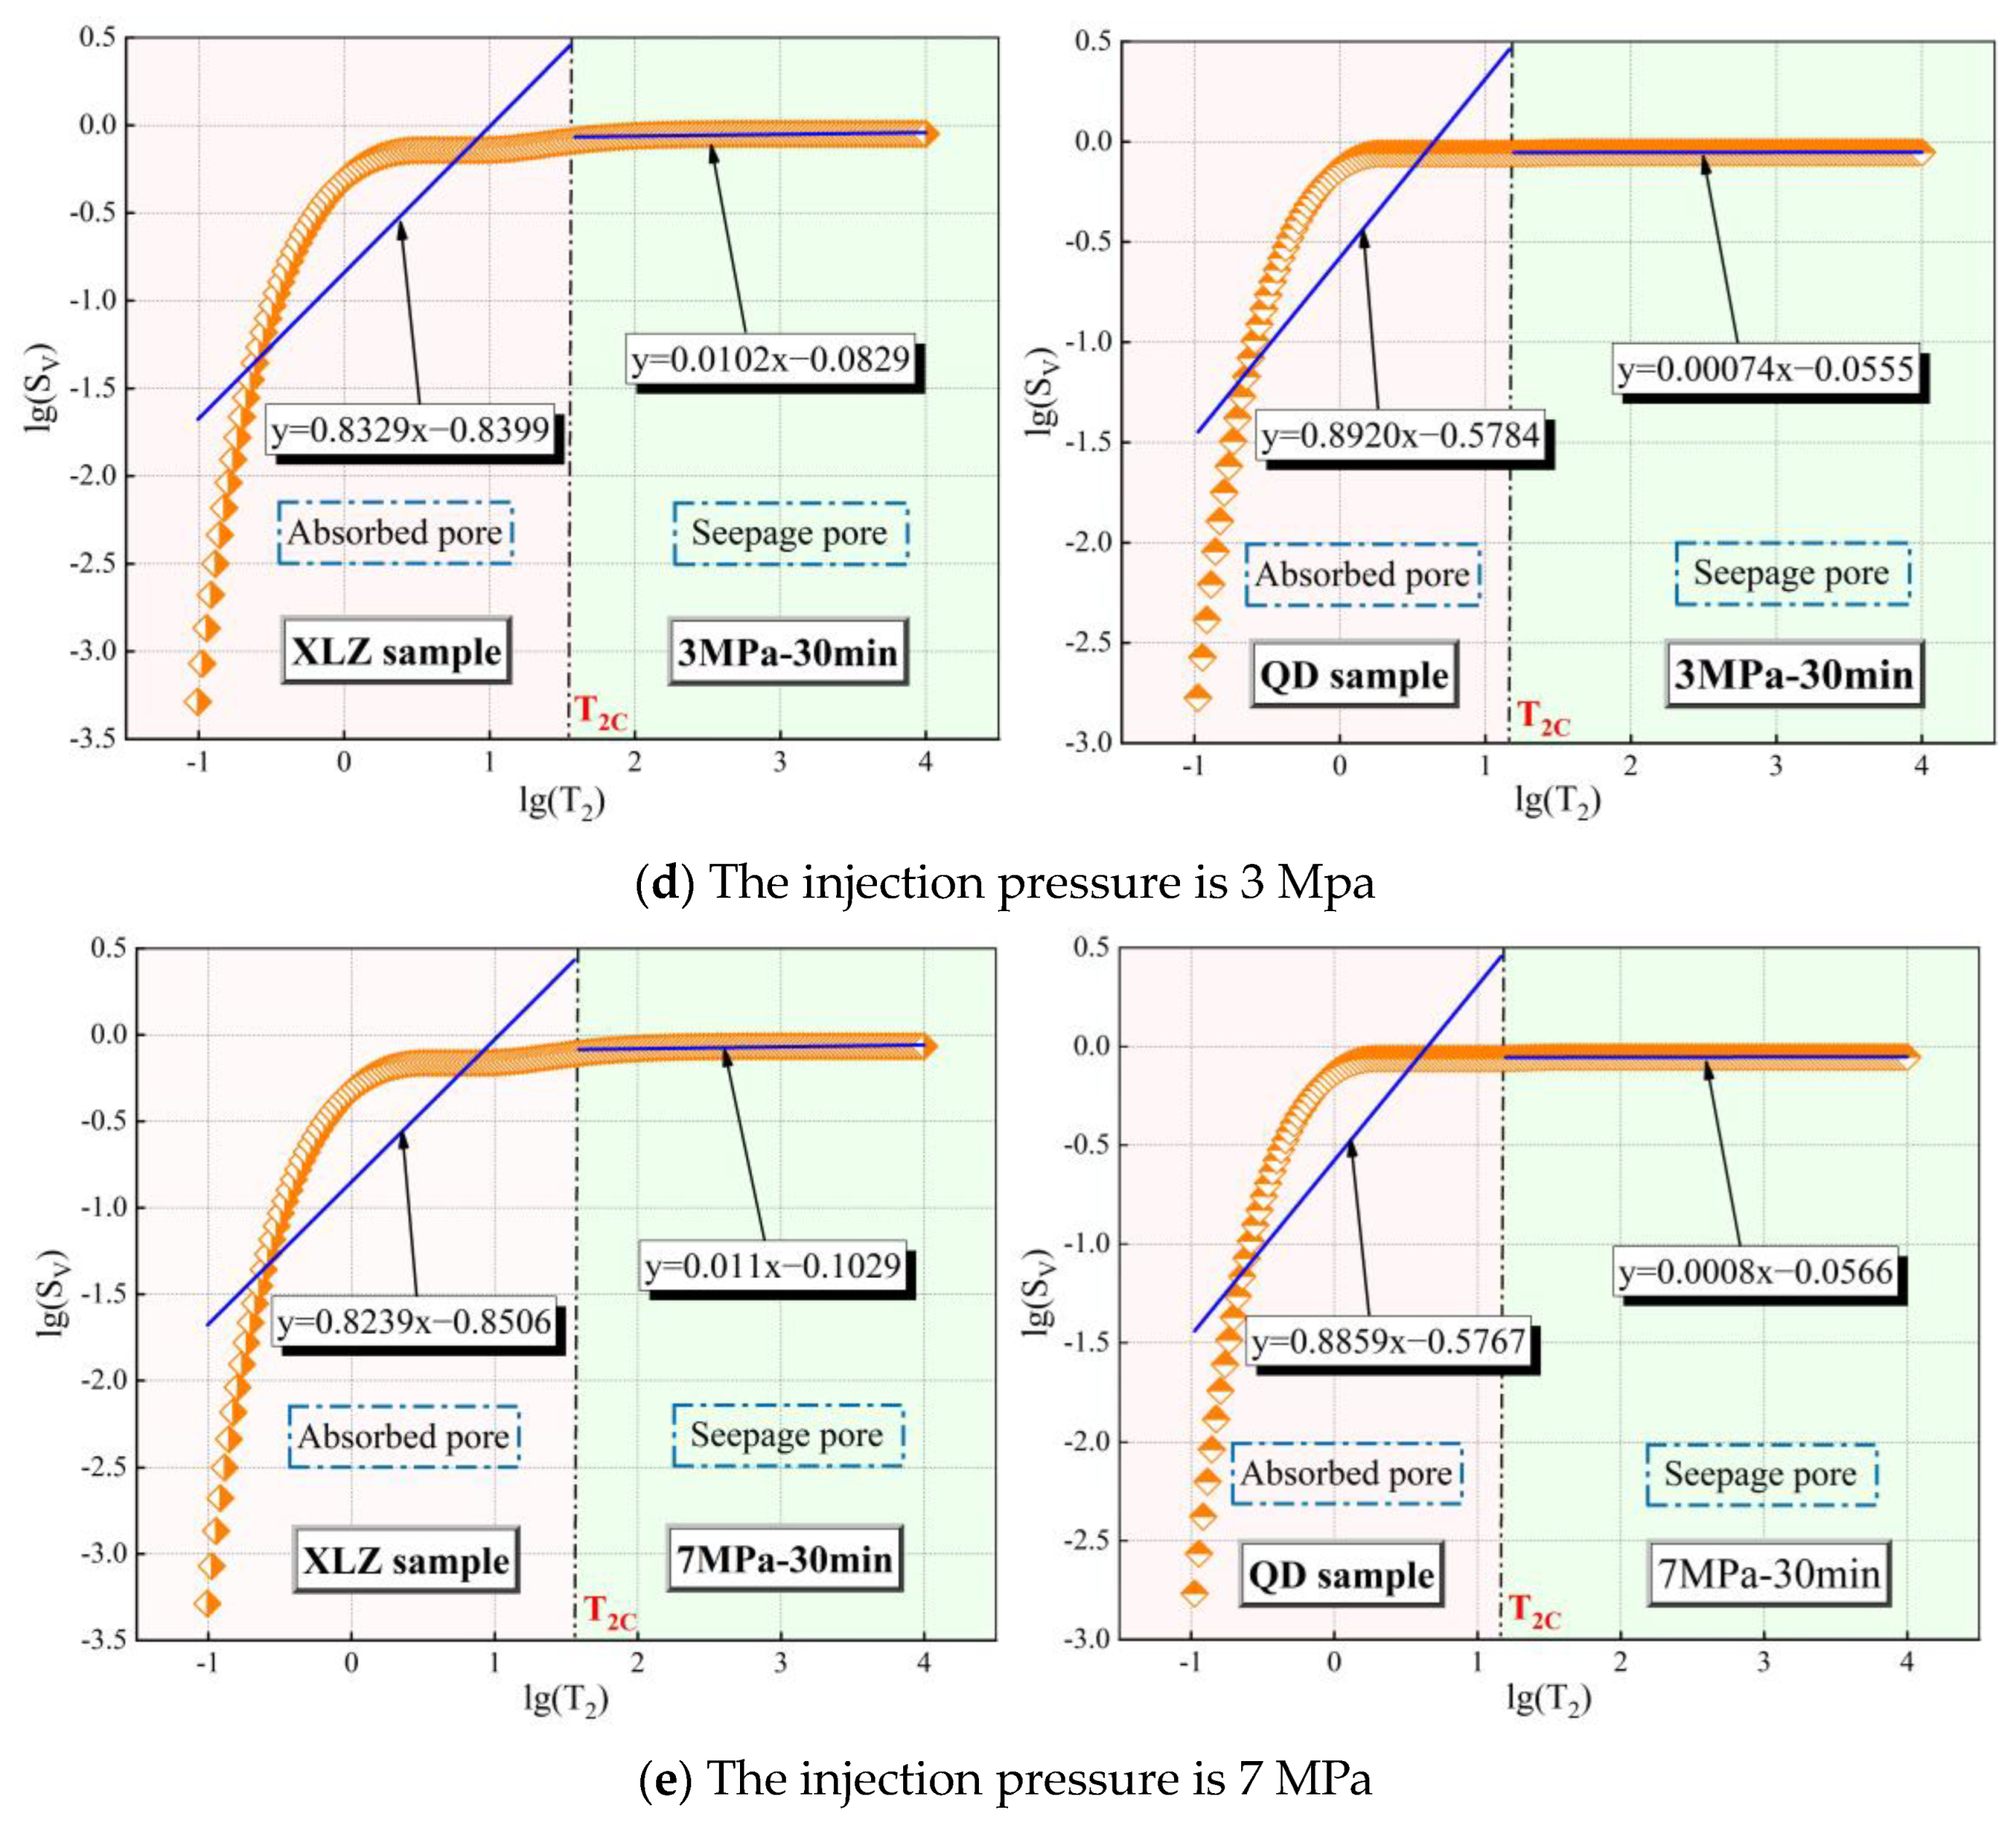
From the piecewise fitting results of Figure 8 and Formula (2), two fractal dimensions can be obtained, which are Dmin and Dmax, respectively. Dmin is the fractal dimension of the liquid phase distribution of the adsorption pore, and Dmax is the fractal dimension of the liquid phase distribution of the seepage pore. The calculation results are shown in Table 2. The variation of fractal dimension of the liquid phase distribution of adsorption pores and seepage pores of different coal samples with gas injection pressure is shown in Figure 9.
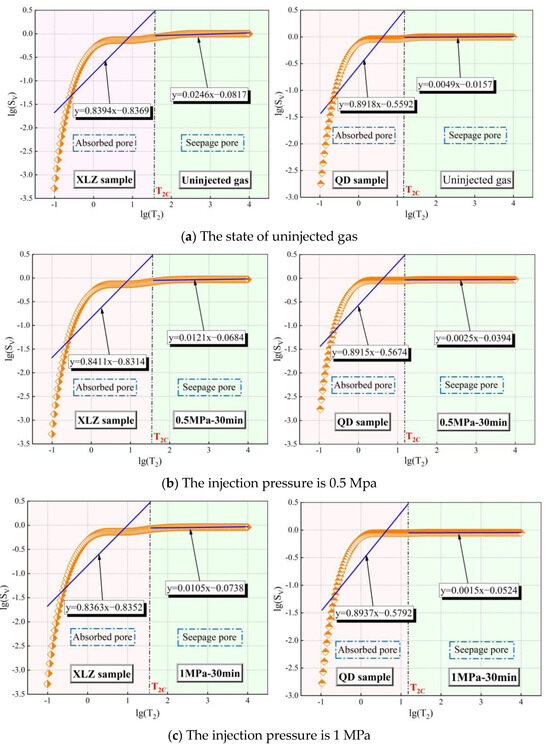

Figure 8.
Fitting curve of the pore volume fractal dimensions measured by NMR.
Table 2.
Three-dimensional experimental fractal dimensions.

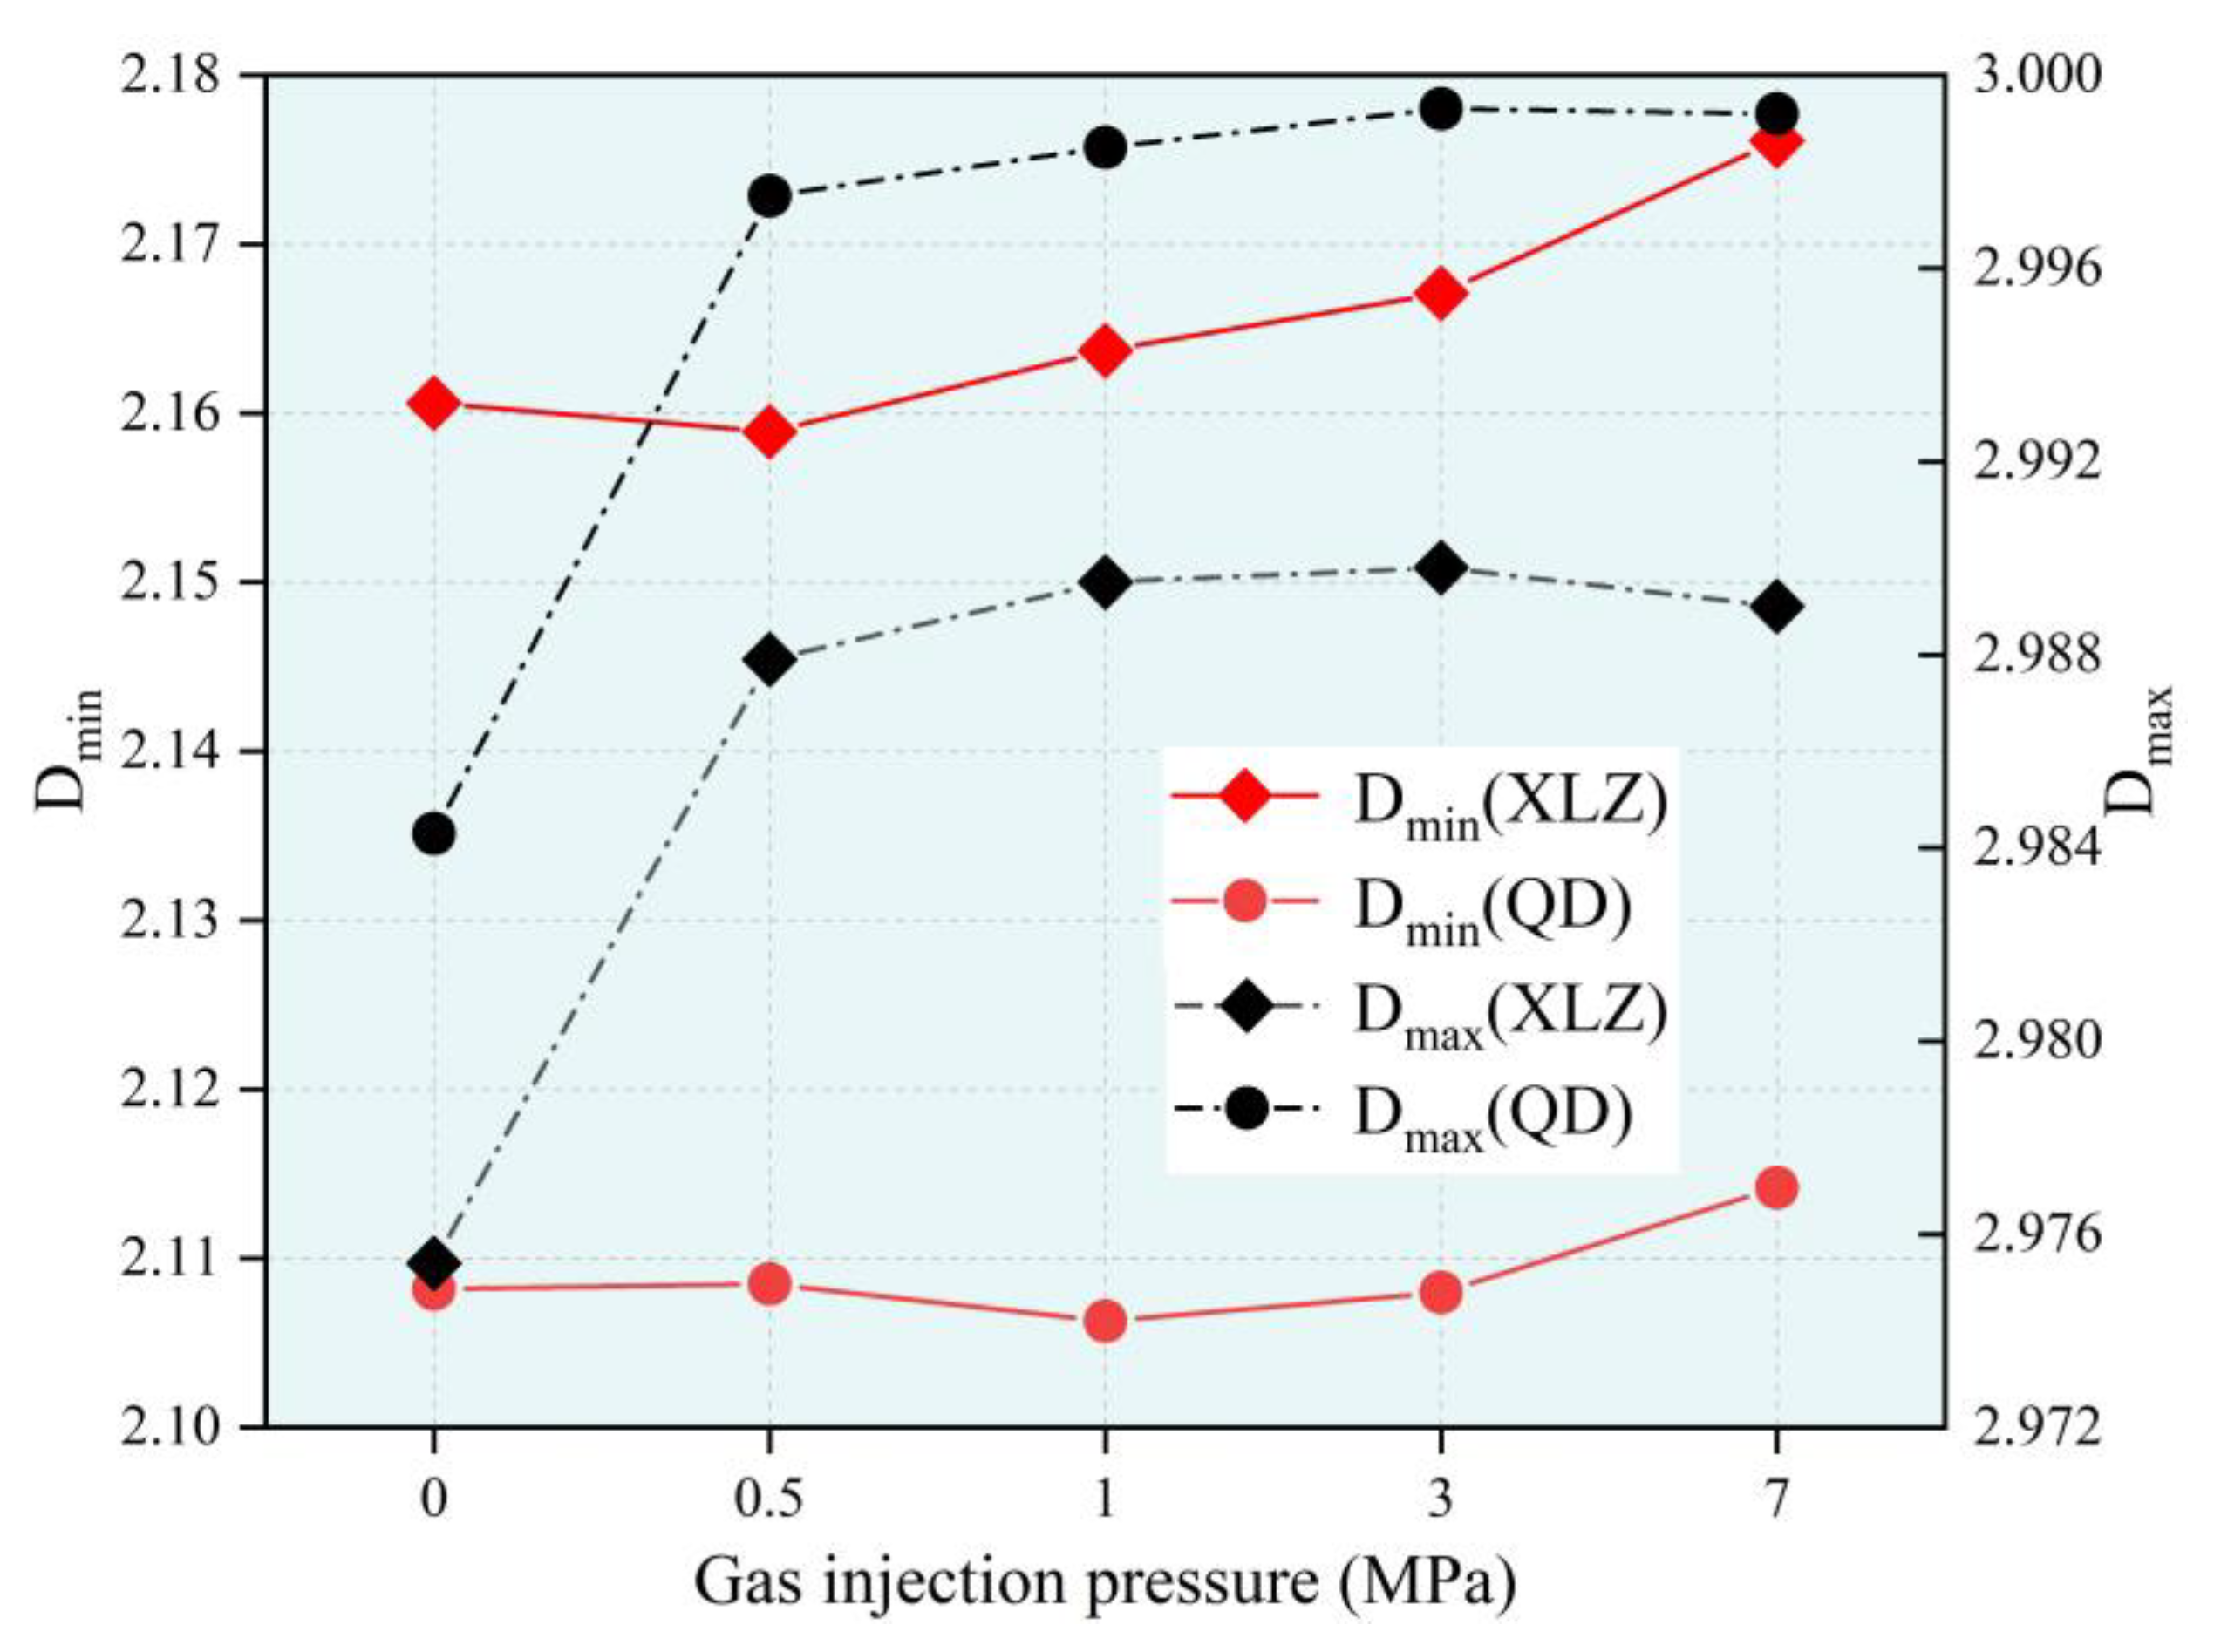
Figure 9.
The change rule of fractal dimension under different gas injection pressures.
It can be seen from Figure 9 that the change rule of fractal dimension mainly has the following two characteristics:
(1) The fractal dimension of adsorption pore liquid phase distribution of XLZ coal sample (2.1589–2.1761) is significantly larger than that of QD coal sample (2.1063–2.1142), while the fractal dimension of seepage pore liquid phase distribution of XLZ coal sample (2.9879–2.9898) is smaller than that of QD coal sample (2.9975–2.9993). The fractal dimension of the liquid phase distribution reflects the complexity of the liquid phase distribution inside the coal body. When the fractal dimension of the liquid phase is large, it indicates that the water inside the coal body is evenly distributed in the pores of each pore size, that is, the pores that make up the dominant pathways of gas displacement are evenly distributed in each pore size range. Therefore, the pore composition of the dominant pathways in the seepage pore part of the XLZ coal sample is more uniform, but the porosity of the XLZ coal sample is higher, and the pores around the dominant channel will produce more residual water during the displacement process, resulting in lower displacement efficiency than the QD coal sample; similarly, the fractal dimension of liquid distribution in the seepage pore of QD coal sample is larger, indicating that the pore composition of the dominant channel in the seepage pore is more uniform. At the same time, due to its low porosity, the proportion of residual water generated in the displacement process is smaller, which makes the displacement efficiency higher than that of the XLZ coal sample;
(2) For the same coal sample, in the initial stage of gas injection, the fractal dimension of the liquid phase distribution of the seepage pore changes greatly, and the fractal dimension of the adsorption pore changes little. With the increase in gas injection pressure, the fractal dimension of seepage pore is basically stable. On the contrary, the fractal dimension of adsorption pore increases obviously. This is because the lower gas injection pressure has reached the starting pressure of the water in the displacement seepage pore. At this time, the displacement mainly occurs in the seepage pore, resulting in a large change in its fractal dimension. Therefore, with the increase in gas injection pressure, there are few new breakthrough channels in the seepage pore, while a large number of breakthrough channels appear in the adsorption pore, which reduces the proportion of cumulative water-bearing porosity, and the slope is smaller during fitting, increasing fractal dimension of liquid phase distribution, while the proportion of cumulative water-bearing porosity in the seepage pore changes little, resulting in the fractal dimension of liquid phase distribution unchanged. It shows that increasing the gas injection pressure does not significantly improve the displacement efficiency of the seepage pore, but will transfer the displacement position from the seepage pore to the adsorption pore.
4.2. Gas–Water Migration Mechanism in a Coal Fine Microstructure
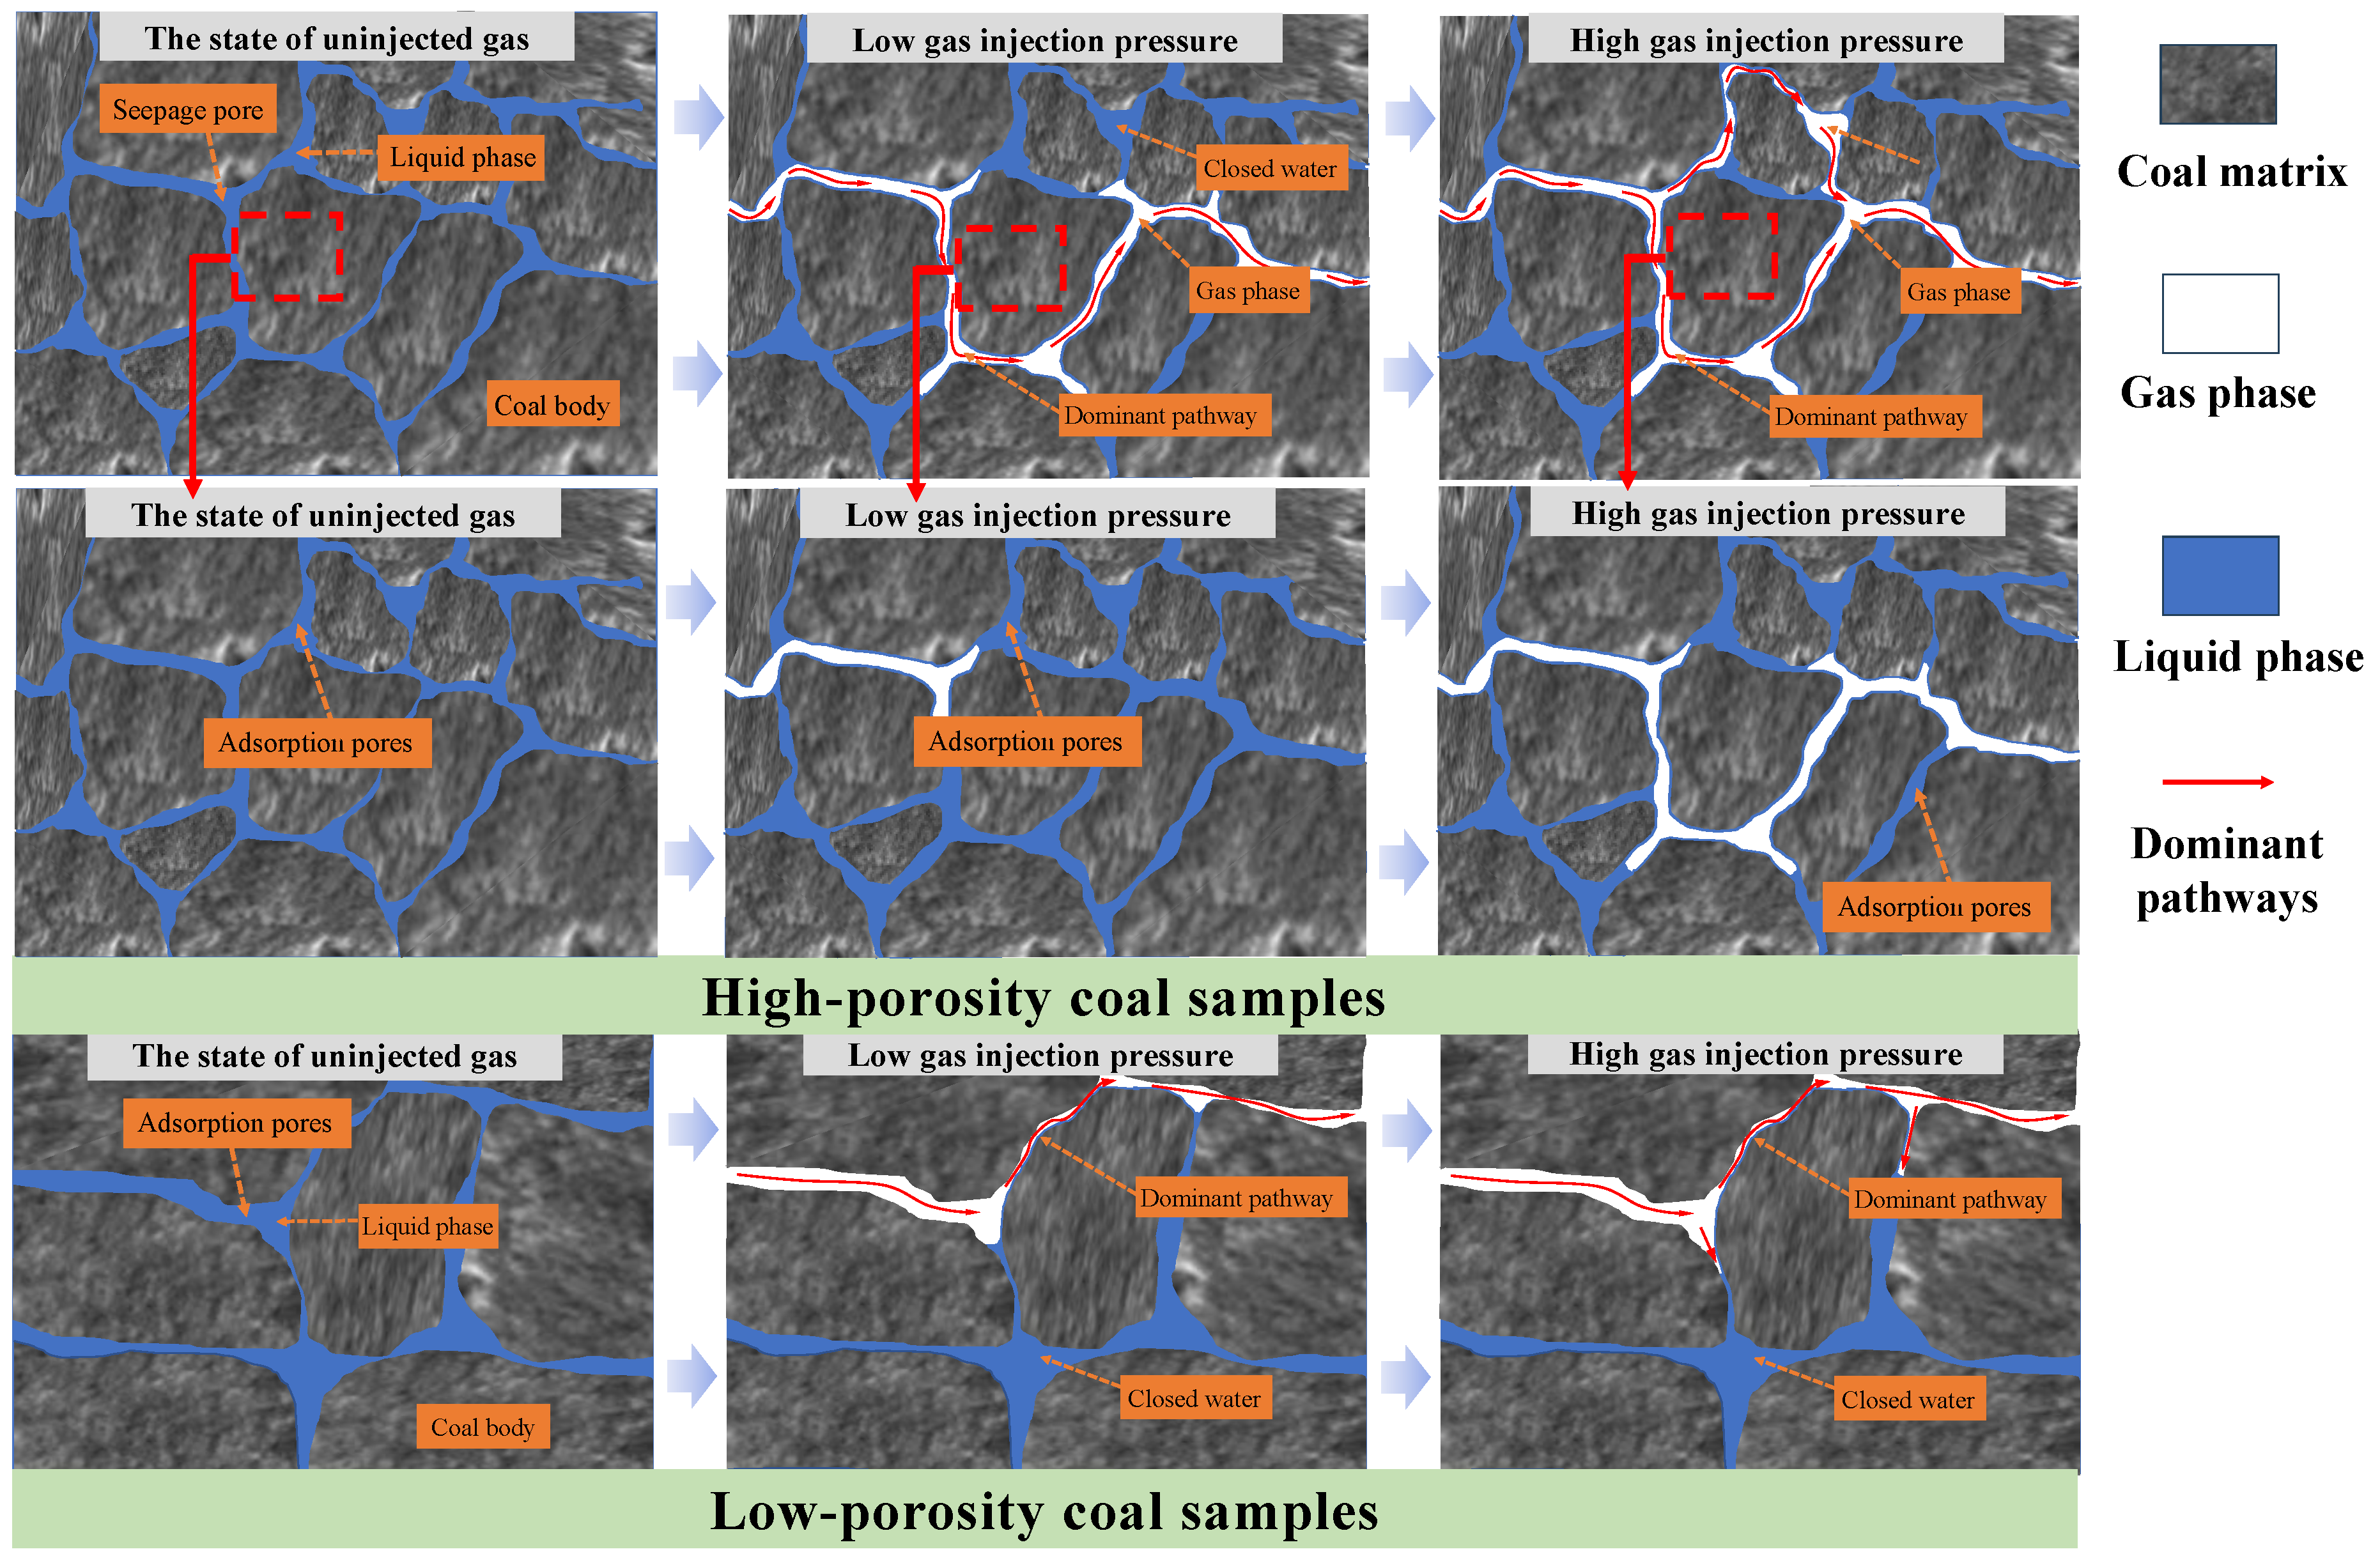
The law of gas–water two-phase transport in the coal body is shown in Figure 10. In the process of gas–water two-phase seepage, the gas displacement of water in coal pores needs to overcome the capillary force, and the capillary force is inversely proportional to the pore size. Therefore, when the gas injection pressure is small, the gas pressure cannot reach the starting pressure required to displace the bound water in the adsorption pore, so that the gas will preferentially pass through the larger seepage pore to discharge the water in the large pore. When the gas injection pressure gradually increases, the gas pressure reaches the starting pressure to displace the bound water, and the gas begins to displace the water in the adsorption pore.

Figure 10.
Gas–water two-phase migration mechanism in coal.
In the process of displacement, not all pores can be displaced. Due to the mesh distribution structure of pores, pores are connected, and one pore will be connected to multiple pores at the same time. However, when the gas is displaced, the gas will preferentially penetrate the “dominant pathways” with the smallest resistance. When the dominant pathways are connected, the gas mainly migrates in it and no longer displaces the water in the adjacent pores, so that a large amount of residual water is formed in the adjacent pores, resulting in the displacement efficiency increasing nonlinearly with the increase in gas injection pressure.
For coal samples with different porosity, the difference in pore size distribution density leads to different compositions of dominant pathways, which ultimately leads to different displacement efficiency. The seepage pore connectivity of high-porosity coal samples is stronger, which makes the residual water generated in the displacement process account for a higher proportion, and the displacement efficiency is lower than that of low-porosity coal samples. Similarly, the displacement efficiency of adsorption pores in high-porosity coal samples is also lower than that in low-porosity coal samples. However, with the increase in gas injection pressure, high-porosity coal samples are more likely to have breakthrough channels, and their displacement efficiency increases faster. Therefore, the displacement efficiency of high-porosity coal samples will eventually exceed that of low-porosity coal samples.
It can be seen from the T2 spectrum that when the gas injection pressure is less than 1 MPa, the gas–water two-phase distribution in the pore size range of the adsorption pore is relatively stable, and the gas pressure has not yet reached the starting pressure to displace the water in the adsorption pore, as a result of which the gas cannot enter the adsorption pore (gas cannot form a large range of through channels in the adsorption pore). When the gas injection pressure increases to 3 MPa, the gas pressure reaches the starting pressure to displace the water in the adsorption pore, and some of the water in the adsorption pore is displaced by the gas. The volume of the water reduction is the volume of the gas increase. At this time, the gas–water two-phase distribution began to change greatly. When the gas injection pressure reaches 7 MPa, the gas pressure reaches the displacement starting pressure of the smaller adsorption pore, and the gas enters into the smaller adsorption pore. More water in the adsorption pore is replaced by gas, and the gas enters into the pores of each pore size range. For the seepage pore section, when the gas injection pressure is only 0.5 MPa, a large amount of water is displaced by the gas, and the gas occupies a large number of pores. When the pressure increases to 1 MPa, the water is further displaced, but after that, as the pressure continues to increase, the gas–water two-phase distribution in the seepage pore does not change much. The fractal dimension changes little in the whole process, indicating that with the increase in gas injection pressure, the gas–water two-phase distribution in the seepage pore section changes little.
According to the research results of this paper, we can know that the injection efficiency of CO2 in the process of geological storage is mainly affected by the pore structure of coal and gas injection pressure. For high-porosity coal samples, with the increase in gas injection pressure, the displacement efficiency of seepage pore is not significantly improved, but the displacement efficiency of adsorption pore is gradually increased. For low-porosity coal samples, the displacement efficiency of seepage pore reaches the maximum when the gas injection pressure is 3 MPa. Continue to increase the gas injection pressure, the displacement efficiency of seepage pore cannot be improved, while the displacement efficiency of adsorption pore of low-porosity coal samples is little affected by the gas injection pressure. Although the CO2 injection efficiency can be improved by increasing the gas injection pressure, higher gas injection pressure represents higher economic input and higher risk. Moreover, when the gas injection pressure is too high, whether the CO2 sealing effect can be guaranteed still needs further research. Therefore, in the process of CO2 storage, it is necessary to comprehensively analyze the porosity, pore size distribution and plugging effect of coal seam to determine the appropriate gas injection pressure, so as to achieve the best storage effect.
5. Conclusions
NMR technology is used to reflect the gas–water two-phase distribution inside the coal body during gas injection and water flooding. The gas–water two-phase migration law in the coal body is obtained by comparing the experimental results of coal samples with different porosities:
- (1)
- When gas is injected into water-saturated coal, the dominant pathway will be penetrated first, resulting in a large amount of closed water in other pathways. Only when the injection pressure is high, do the other pathways continue to penetrate. The dominant pathways of high-porosity coal samples are mainly composed of seepage pores and larger adsorption pores, the pore size ranges from 0.41 μm to 8.21 μm. When the gas injection pressure reaches 7 MPa, the aperture ranges from 0.005 MPa to 8.21 MPa. In the low-porosity coal samples, the pore size range of dominant pathways is wider, and smaller adsorption pores will be involved, the pore size ranges from 0.005 μm to 24.92 μm. When the gas injection pressure is low, the displacement mainly occurs in the seepage pore. As the gas injection pressure increases, the focus of displacement gradually shifts to the adsorption pore section;
- (2)
- Because the proportion of closed water formed in the displacement process of low-porosity coal samples is smaller, the displacement efficiency of the adsorption pore and seepage pore is higher than that of high-porosity coal samples, but with the increase in gas injection pressure, the displacement efficiency of the adsorption pores is higher for the high-porosity coal samples than for the low-porosity ones. Therefore, the displacement efficiency of high-porosity coal samples changes more evenly with the increase in gas injection pressure, and the final displacement efficiency is 14.17%. The increase rate of low-porosity coal samples is relatively gentle, and the final displacement efficiency is 11.68%. Finally, the displacement efficiency of high-porosity coal samples is higher;
- (3)
- The fractal dimensions Dmin and Dmax of the liquid phase distribution were determined by fitting the T2 spectrum data. The results show that: (1) The fractal dimension of liquid phase distribution can reflect the uniformity of pore size distribution of dominant pathways in the displacement process to a certain extent and (2) increasing the gas injection pressure does not significantly improve the displacement efficiency of the seepage pore, but will transfer the displacement position from the seepage pore to the adsorption pore.
Author Contributions
Conceptualization, H.Y.; Methodology, Z.L., Q.G. and J.L.; Investigation, G.L.; Resources, Z.L.; Data curation, Q.G., H.Y. and G.L.; Writing—original draft, Q.G.; Writing—review & editing, H.Y.; Supervision, Z.L., H.Y., P.H. and Z.Y.; Funding acquisition, Z.L. All authors have read and agreed to the published version of the manuscript.
Funding
The National Natural Science Foundation of China (52274213, 52074173, 51934004), Natural Science Foundation of Shandong Province (ZR2022YQ52, ZR2023QE132), and Taishan Scholars Project Special Funding.
Institutional Review Board Statement
Not applicable.
Informed Consent Statement
Not applicable.
Data Availability Statement
Not applicable.
Conflicts of Interest
The authors declare no conflict of interest.
References
- Kuhn, M.; Kempka, T.; De Lucia, M.; Scheck-Wenderoth, M. Dissolved CO2 storage in geological formations with low pressure, low risk and large capacities. Energy Procedia 2017, 114, 4722–4727. [Google Scholar] [CrossRef]
- Mi, Z.; Wang, F.; Yang, Y.; Wang, F.; Hu, T.; Tian, H. Evaluation of the potentiality and suitability for CO2 geological storage in the Junggar Basin, northwestern China. Int. J. Greenh. Gas Control 2018, 78, 62–72. [Google Scholar] [CrossRef]
- Zhou, Y.; Li, W.; Peng, Y.; Tang, S.; Wang, L.; Shi, Y.; Li, Y.; Wang, Y.; Geng, Z.; Wu, K. Hydration and fractal analysis on Low-heat Portland cement pastes by thermodynamic-based methods. Fractal Fract. 2023, 7, 606. [Google Scholar] [CrossRef]
- Li, Y.; Zhang, H.; Huang, M.; Yin, H.; Jiang, K.; Xiao, K.; Tang, S. Influence of different alkali sulfates on the shrinkage, hydration, pore structure, fractal dimension and microstructure of low-heat Portland cement, medium-heat Portland cement and ordinary Portland cement. Fractal Fract. 2021, 5, 79. [Google Scholar] [CrossRef]
- Zhang, L.; Wang, G.; Yu, J.; Xiao, Z.; Wang, K. Permeability evolution model and application of dual-porosity and dual-permeability coalbed. J. Shandong Univ. Sci. Technol. 2021, 40, 33–42. [Google Scholar]
- He, X.; Tian, X.; Song, D. Progress and expectation of CO2, sequestration safety in coal seams. Coal Sci. Technol. 2022, 50, 212–219. [Google Scholar]
- Huang, D.; Hou, X.; Wu, Y. The mechanism and capacity evaluation on CO2 sequestration in antiquated coal mine gob. Environ. Eng. 2014, 32, 1076–1080. [Google Scholar]
- Han, S.; Sang, S.; Liang, J.; Zhang, J. Supercritical CO2 adsorption in a simulated deep coal reservoir environment, implications for geological storage of CO2 in deep coals in the southern Qinshui Basin, China. Energy Sci. Eng. 2019, 7, 488–503. [Google Scholar] [CrossRef]
- Qin, Y.; Moore, T.A.; Shen, J. Resources and geology of coalbed methane in China: A review. Int. Geol. Rev. 2018, 60, 777–812. [Google Scholar] [CrossRef]
- Li, W.; Cheng, Y.; Wang, L. The origin and formation of CO2 gas pools in the coal seam of the Yaojie coalfield in China. Int. J. Coal Geol. 2011, 85, 227–236. [Google Scholar] [CrossRef]
- Li, D.; Huang, C.; Chen, J.; Zhou, D.; Deng, K.; Xu, P. Optimization and experimental study of underground hydraulic fracturing method in low permeability and high gas coal seam. In Proceedings of the International Conference on Energy Development and Environmental Protection, Sanya, China, 21–23 November 2016; pp. 426–435. [Google Scholar]
- Chen, X.; Xu, Y.; Jin, W.; Bi, R. Permeability improvement technology of directional hydraulic fracturing in low permeability coal seam. J. Liaoning Tech. Univ. 2016, 35, 124–128. [Google Scholar]
- Shen, B.; Chai, S.; Zhang, S.; Chen, B. Development and application of hydro-mechanical coupling function in simulating crack propagation of FRACOD. J. Shandong Univ. Sci. Technol. 2021, 40, 26–34. [Google Scholar]
- Liu, Z.; Jiao, L.; Yang, H.; Zhu, M.; Zhang, M.; Dong, B. Study on the microstructural characteristics of coal and the mechanism of wettability of surfactant solutions at different pH levels. Fuel 2023, 353, 129268. [Google Scholar] [CrossRef]
- Zhang, Y.; Hou, S.; Mei, S.; Zhao, T.; Li, D. Experimental study of permeability-hydraulic fracturing characteristics of tight rocks. Geomech. Geophys. Geo-Energy Geo-Resour. 2022, 8, 182. [Google Scholar] [CrossRef]
- Liu, Y.; Zheng, X.; Peng, X.; Zhang, Y.; Chen, H.; He, J. Influence of natural fractures on propagation of hydraulic fractures in tight reservoirs during hydraulic fracturing. Marine Petroleum Geol. 2022, 138, 105505. [Google Scholar] [CrossRef]
- Wu, W. Coupled numerical model of hydraulic fracturing and seepage of soft coal based on elastoplastic damage. J. Shandong Univ. Sci. Technol. 2021, 40, 69–76. [Google Scholar]
- Persoff, P.; Pruess, K. Two-phase flow visualization and relative permeability measurement in natural rough-walled rock fractures. Water Resour. Res. 1995, 31, 1175–1186. [Google Scholar] [CrossRef]
- Wu, F.; Yao, C.; Cong, L.; Yan, L.; Wen, Z.; Zhang, F.; Xi, Y. Comparison of glass etching displacement experiment and finite element numerical simulation for gas-water two-phase seepage in rocks. Lithol. Reserv. 2019, 31, 121–132. [Google Scholar]
- Zhou, K.; Li, N.; Zhang, Q.; Tang, X. Experimental research on gas-water two phase flow and confined gas formation mechanism. Nat. Gas Ind. 2002, 22, 122–125. [Google Scholar]
- Guo, T.; Gong, F.; Lin, X.; Lin, Q.; Wang, X. Experimental investigation on damage mechanism of guar gum fracturing fluid to low-permeability reservoir based on nuclear magnetic resonance. J. Energy Resour. Technol. 2018, 123, 3339–3346. [Google Scholar] [CrossRef]
- Xie, W.; Yin, Q.; Zeng, J.; Wang, G.; Feng, C.; Zhang, P. Fractal-based approaches to pore structure investigation and water saturation prediction from NMR measurements: A case study of the gas-bearing tight sandstone reservoir in Nanpu Sag. Fractal Fract. 2023, 7, 273. [Google Scholar] [CrossRef]
- Chu, Y.; Sun, H.; Zhang, D.; Yu, G. Nuclear magnetic resonance study of the influence of the liquid nitrogen freeze-thaw process on the pore structure of anthracite coal. Energy Sci. Eng. 2020, 8, 1681–1692. [Google Scholar] [CrossRef]
- Wang, F.; Yang, K.; Cai, J. Fractal characterization of tight oil reservoir pore structure using nuclear magnetic resonance and mercury intrusion porosimetry. Fractals 2018, 26, 1840017. [Google Scholar] [CrossRef]
- Kong, B.; He, S.; Tao, Y.; Xia, J. Pore structure and fractal characteristics of frozen–thawed soft soil. Fractal Fract. 2022, 6, 183. [Google Scholar] [CrossRef]
- Yao, Y.; Liu, D. Comparison of low-field NMR and mercury intrusion porosimetry in characterizing pore size distributions of coals. Fuel 2012, 95, 152–158. [Google Scholar] [CrossRef]
- Yang, H.; Cheng, W.; Liu, Z.; Wang, W.; Zhao, D.; Wang, W. Fractal characteristics of effective seepage channel structure of water infusion coal based on NMR experiment. Rock Soil Mech. 2020, 41, 1279–1286. [Google Scholar]
- Yao, Y.; Liu, D. Petrophysics and fluid properties characterizations of coalbed methane reservoir by using NMR relaxation time analysis. Coal Sci. Technol. 2016, 44, 14–22. [Google Scholar]
- Zhang, N.; Wang, S.; Li, Z.; Guo, S.; Wang, R. Application of multifractal theory for determination of fluid movability of coal-measure sedimentary rocks using nuclear magnetic resonance (NMR). Fractal Fract. 2023, 7, 503. [Google Scholar] [CrossRef]
- Ren, X.; Li, A.; Fu, S.; Tian, W. Influence of micro-pore structure in tight sandstone reservoir on the seepage and water-drive producing mechanism—A case study from Chang 6 reservoir in Huaqing area of Ordos basin. Energy Sci. Eng. 2019, 7, 741–753. [Google Scholar] [CrossRef]
- Xiao, Q.; Fang, F.; Wang, Z.; Jiang, B.; Yuan, Y. Nuclear magnetic resonance simulation experiment for a water drive gas reservoir. J. Energy Resour. Technol. 2019, 141, 112901. [Google Scholar] [CrossRef]
- Su, Y.; Li, X.; Li, L.; Zhuang, X.; Wang, C.; Fu, J.; Li, D. Gas-water two-phase percolation mechanism in tight gas reservoirs based on NMR visualization experiment. J. China Univ. Pet. 2021, 45, 104–112. [Google Scholar]
- Li, X.; Fu, X.; Ranjith, P.G. Retained water content after nitrogen driving water on flooding saturated high volatile bituminous coal using low-field nuclear magnetic resonance. J. Nat. Gas Sci. Eng. 2018, 57, 189–202. [Google Scholar] [CrossRef]
- Song, Y.; Jiang, L.; Liu, Y. An experimental study on CO2 water displacement in porous media using high-resolution Magnetic Resonance Imaging. Int. J. Greenh. Gas Control 2012, 10, 501–509. [Google Scholar] [CrossRef]
- Peng, Y.; Tang, S.; Huang, J.; Tang, C.; Wang, L.; Liu, Y. Fractal analysis on pore structure and modeling of hydration of magnesium phosphate cement paste. Fractal Fract. 2022, 6, 337. [Google Scholar] [CrossRef]
- Huang, J.; Li, W.; Huang, D.; Wang, L.; Chen, E.; Wu, C.; Wang, B.; Deng, H.; Tang, S.; Shi, Y.; et al. Fractal analysis on pore structure and hydration of magnesium oxysulfate cements by first principle, thermodynamic and microstructure-based methods. Fractal Fract. 2021, 5, 164. [Google Scholar] [CrossRef]
- Liu, Z.; Yang, H.; Wang, W.; Cheng, W.; Xin, L. Experimental study on the pore structure fractals and seepage characteristics of a coal sample around a borehole in coal seam water infusion. Transp. Porous Media 2018, 125, 289–309. [Google Scholar] [CrossRef]
- Neimark, A.V. Calculating surface fractal dimensions of adsorbents. Adsorpt. Sci. Technol. 1990, 7, 210–219. [Google Scholar] [CrossRef]
- Angulo, R.F.; Alvarado, V.; Gonzalez, H. Fractal dimensions from mercury intrusion capillary tests. Presented at the SPE Latin America Petroleum Engineering Conference, Caracas, Venezuela, 8–11 March 1992; pp. 255–263. [Google Scholar]
- Friesen, W.I.; Mikula, R.J. Fractal dimensions of coal particles. J. Colloid Interface Sci. 1987, 120, 263–271. [Google Scholar] [CrossRef]
- Wu, J.; Zhao, L. Fractal features of Longtan formation coal reservoir in Liupanshui on the mercury injection method. Sichuan Chem. Ind. 2017, 20, 28–30. [Google Scholar]
- Li, C.; Wei, Y.; Wang, A.; Cao, D. Low-ranked coal reservoir pore structure characterized by mercury intrusion-A case study of Southern Junggar Basin. Coal Geol. China 2018, 30, 29–33. [Google Scholar]
- Jin, Y.; Zhao, M.; Liu, S.; Liu, X. Study on the effect of coal matrix compression on fractal characteristics of pore structure by mercury intrusion method. China Coal 2018, 44, 103–109. [Google Scholar]
- He, J.; Lin, C.; Li, X.; Zhang, Y.; Chen, Y. Initiation, propagation, closure and morphology of hydraulic fractures in sandstone cores. Fuel 2017, 208, 65–70. [Google Scholar] [CrossRef]
- Song, N.; Chen, B.; Wang, C.; Chen, D.; Luo, M.; Pu, B. Estimation of core fracture porosity by T2-NMR spectroscopy. Petrochem. Ind. Technol. 2017, 24, 127. [Google Scholar]
- Liu, Z.; Li, R.; Yang, H.; Tian, F.; Zhu, D. A New fractal model of coal permeability based on the increasing fractal construction method of the menger sponge. Fractals 2021, 29, 2150187. [Google Scholar] [CrossRef]
- Yao, Y.; Liu, D.; Cai, Y.; Li, J. Advanced characterization of pores and fractures in coals by nuclear magnetic resonance and X-ray computed tomography. Sci. China 2010, 53, 854–862. [Google Scholar] [CrossRef]
- SY/T 6747-2008; Nuclear Magnetic Resonance Logging Specification for Oil and Gas Exploration Wells. People’s Republic of China Petroleum and Natural Gas Industry: Beijing, China, 2008.
- Bhardwaj, S.; Dalal, A.; Mukherjee, P.P. Mesoscale understanding of capillarity driven two-phase flow in a packed bed architecture. Int. J. Heat Mass Transf. 2019, 136, 116–127. [Google Scholar] [CrossRef]
- Ibrahim, A.; Hisham, A. Effects of formation-water salinity, formation pressure, gas composition, and gas-flow rate on carbon dioxide sequestration in coal formations. SPE J. 2017, 22, 1530–1541. [Google Scholar] [CrossRef]
- Wu, Z.; Lu, H.; Weng, L.; Liu, Q.; Shen, J. Investigations on the seepage characteristics of fractured sandstone based on NMR real-time imaging. Chin. J. Rock Mech. Eng. 2021, 40, 263–275. [Google Scholar]
- Hu, P.; Liang, L.; Xie, G.; Zhou, S.; Peng, Y. Effect of slurry conditioning on flocculant-aided filtration of coal tailings studied by low-field nuclear magnetic resonance and X-ray micro-tomography. Int. J. Min. Sci. Technol. 2020, 30, 859–864. [Google Scholar] [CrossRef]
- Li, B.; Lan, J.; Si, G.; Lin, G.; Hu, L. NMR-based damage characterisation of backfill material in host rock under dynamic loading. Int. J. Min. Sci. Technol. 2020, 30, 329–335. [Google Scholar] [CrossRef]
- Xoдoт, B.B. Coal and Gas Out-Burst; China Industry Press: Beijing, China, 1996; pp. 27–30. [Google Scholar]
- Liu, Y.; Lyu, Q.; Luo, S. Characterization of gas-water flow in tight sandstone based on authentic sandstone micro-model. Geosystem Eng. 2018, 21, 318–325. [Google Scholar] [CrossRef]
- Zhang, C.; Chen, Z.; Zhang, Z.; Li, J.; Linhu, S.; Sun, B. Fractal characteristics of reservoir rock pore structure based on NMR T2 distribution. J. Oil Gas Technol. 2007, 29, 80–86+166–167. [Google Scholar]
Disclaimer/Publisher’s Note: The statements, opinions and data contained in all publications are solely those of the individual author(s) and contributor(s) and not of MDPI and/or the editor(s). MDPI and/or the editor(s) disclaim responsibility for any injury to people or property resulting from any ideas, methods, instructions or products referred to in the content. |
© 2023 by the authors. Licensee MDPI, Basel, Switzerland. This article is an open access article distributed under the terms and conditions of the Creative Commons Attribution (CC BY) license (https://creativecommons.org/licenses/by/4.0/).