Article

Small-Scale Freshwater Aquaculture, Income Generation and Food Security in Rural Madagascar

by
Gianna Angermayr
1,
Andrés Palacio
1,2 and
Cristina Chaminade
1,3,*
1
Department of Economic History, Lund University School of Economics and Management, Lund University, 22007 Lund, Sweden
2
Finanzas, Gobierno y Relaciones Internacionales (FIGRI), Universidad Externado de Colombia, Bogotá 111711, Colombia
3
CIRCLE, Center for Innovation, Research and Competences in the Learning Economy, Lund University, 22100 Lund, Sweden
*
Author to whom correspondence should be addressed.
Sustainability 2023, 15(21), 15439; https://doi.org/10.3390/su152115439
Submission received: 6 September 2023 / Revised: 24 October 2023 / Accepted: 25 October 2023 / Published: 30 October 2023

Abstract

:
This study aims to investigate the nexus between small-scale freshwater aquaculture and poverty-related factors like income generation and food security in rural Madagascar. Evidence of this relationship is scarce in the Global South, particularly in island states. Using linear and logistic regressions and data collected from fish farmers and consumers across six regions in Madagascar in 2021, we obtained significant findings. Extension services, integrated production systems, and higher education are positively correlated with fish-based income generation. For instance, membership in a cooperative can double an aquaculture farmer’s total annual income compared to that of other producers. Wealth is a key determinant of food security, but female decision-makers, fish consumption, and education are also positively correlated with food security. These insights emphasize the vital roles of small-scale aquaculture and women in the household in enhancing livelihoods and food security, underscoring the need for targeted support and policy interventions to foster inclusive and resilient freshwater aquaculture in island states.

1. Introduction

Food security and poverty reduction have always been central concerns in global development agendas. However, the recent emphasis on small-scale aquaculture production systems and their potential to improve nutrition and income in low-income countries marks a significant shift in focus [1]. Aquaculture is increasingly being regarded as a means of enhancing income and nutrition by providing income for farmers and increasing the availability of fish proteins for food-insecure populations [2].
Despite the growth of aquaculture globally, commonly referred to as “the blue revolution”, the spotlight has primarily been on large-scale industrial aquaculture [3,4]. However, while contributing to economic growth through exports, this approach often leads to detrimental social and environmental consequences [3,5,6,7]. Intensive industrial aquaculture has been severely criticized for its adverse effects on the environment, including pollution [4,5,6], habitat destruction, and biodiversity loss [5,8,9], exacerbating poverty in affected communities [10]. Moreover, it displaces small-scale farmers, creates fewer jobs, and does not allow for gains to be redistributed locally [5,11].
In response to these challenges, the FAO launched the “Ecosystems Approach to Aquaculture (EAA)” in 2020, aiming to achieve sustainability and development integration [12,13]. Although the guidelines do not explicitly prioritize small-scale aquaculture, evidence suggests that most EAA implementations have been executed in the context of rural small-scale aquaculture practices using low-input methods, extensive or semi-intensive technologies, and household labor [12]. Yet, research on small-scale freshwater aquaculture and its connections to poverty-related factors, such as income, food security, and gender dynamics, remains limited [1,2,14].
This paper aims to fill this gap by investigating the factors associated with income generation and food security in small-scale fish farming. Here, the focus is on freshwater aquaculture initiatives in Madagascar, where 80% of the population resides in rural areas and three-quarters work in the primary sector, including in aquaculture [15]. Madagascar’s national Multidimensional Poverty Index (MPI) [16] was 0.384 in 2018, placing it in the 104th position out of 111, with 69.1% of the population being multidimensionally poor. Thus, this study explores the role of fish as a nutritional source in consumer diets and the positive association between freshwater aquaculture, improved livelihoods, and food security in this context [17].
This paper is structured as follows: Section 2 provides an overview of freshwater aquaculture and reviews the existing literature on its links to income generation and food security. Section 3 presents a case study, including the data and econometric models used. Section 4 discusses the statistical results, and Section 5 concludes with a discussion of policy implications and suggestions for future research.

2. Small-Scale Freshwater Aquaculture, Food Security, and Income Generation

2.1. Small-Scale Freshwater Aquaculture

Freshwater aquaculture, a counterpart of seawater-based aquaculture, involves farming fish in freshwater sources, such as rivers and lakes or ponds and rice fields [17]. Pond and integrated rice-fish farming represent traditional forms of aquatic animal production, contributing to over 80% of freshwater production [18]. Freshwater aquaculture exhibits varying degrees of intensification. Intensive and super-intensive production systems feature high productivity due to formulated fish diets associated with high fish-stocking densities. These systems rely on complete artificial feed, constituting a significant investment in aquaculture [13,18]. Semi-intensive production systems have lower stocking densities and occasionally supplement fish diets with locally produced feeds. Extensive production systems entirely depend on the natural productivity of water bodies, requiring no additional inputs [13].
Small-scale freshwater aquaculture mainly occurs in three production forms: cage, pond, and rice-fish farming. Cage farming is mostly carried out in aquatic ecosystems, such as rivers, lakes, or artificial waterbodies, allowing for water exchange [13]. Pond aquaculture, the most widespread land-based aquaculture practice in rural areas, can be semi-intensive or intensive. Integrating rice-fish farming, dating back to ancient China, involves breeding fish in irrigated or rainfed rice fields in rotational schemes or simultaneously.
Cage aquaculture is typically intensive, whereas pond aquaculture can be semi-intensive or intensive. Rice-fish farming is an extensive production system leveraging the synergy of fish and plants. Rice plants provide fish with weeds, pests, insects, and snails to eat, while fish act as a biological control for rice plants, and their manure fertilizes the plants and the soil [19]. Considering different intensification levels, monocultures require high fish-stocking densities and supplementary feed, whereas polycultures can use ponds’ nutrients for complementary feed. Although the literature suggests secondary fish species can increase fish yields by up to 40%, polyculture potential depends on fish pairings and labor involved in sorting species during harvest [18].
Farmed fish in freshwater aquaculture primarily comprise short-food-chain species, such as carp and tilapias, which are usually herbivores or omnivores [18]. Cyprinids and cichlids are predominant freshwater species. Common carp, farmed in 86 countries, is the most widespread cyprinid species. Nile tilapia constitutes 72% of global cichlid production [18], and the Malagasy farmers analyzed in this case study farm both fish species.

2.2. Small-Scale Freshwater Aquaculture and Income Generation

Few studies have delved into the contribution of rural aquaculture to income generation. The primary challenge in this regard lies in the absence of causal analyses and the complexity of generalizing very diverse aquaculture practices with varying local contexts, shaped by cultural norms and values determining farm access and ownership, technology utilization, decision-making inclusivity, labor responsibilities, and food consumption [14,20,21]. Despite ongoing discussions, robust evidence suggests that aquaculture positively influences poverty-related outcomes like income generation, particularly benefitting impoverished communities [14]. Gonzalez Parrao et al. [2] argue that aquaculture development yields direct income benefits and indirectly aids in poverty reduction and livelihood improvement.
The direct income connections stem from efficiency enhancements in small- and medium-scale aquaculture sites and their value chains, leading to higher returns and incomes [2]. Certain production practices have been linked to enhanced farmer incomes. For instance, polycultures have exhibited more positive income impacts than monocultures: successful combinations of complementary fish species have improved fish yields by 14 to 35%, depending on the species [18]. Integrated production systems, especially rice-fish culture, have demonstrated higher profitability and income potential than fish production due to the presence of dual revenue streams [19,22]. Synergies between these practices enable higher outputs on the same land surface [14,23], while cost reduction is facilitated via eliminating the need for chemical fertilizers and pesticides [23].
Additionally, diversifying production leads to diversified income, enhancing resilience against unforeseen shocks and reducing vulnerability to future poverty. However, integrated farming may entail higher operational costs and risks due to production complexity. The labor- and knowledge-intensive nature of this production form may pose challenges to low-education-level farmers [19].
The indirect income link operates on the premise that increased freshwater aquaculture profitability attracts other producers to enter the market, thereby boosting sectoral employment [2]. This indirect mechanism is particularly effective for the aquaculture sector because its labor intensiveness allows it to surpass other land-based production practices in creating business opportunities and employment [24]. Furthermore, indirect spillovers from business opportunities and employment often outweigh direct benefits gained through new ventures or small and medium enterprises. Still, the existing literature on freshwater aquaculture underscores gender imbalances regarding labor division, benefit distribution, and access to and control of assets and resources. These imbalances typically disadvantage women when compared to their male counterparts [2].

2.3. Small-Scale Freshwater Aquaculture and Food Security

Small-scale aquaculture is generally acknowledged for its significant contributions to household food security and improving dietary quality [1]. According to the FAO [25], “food security exists when all people, at all times, have physical and economic access to sufficient, safe and nutritious food that meets their dietary needs and food preferences for an active and healthy life”. Food security entails adequate food availability, financial accessibility, balanced diets, and uninterrupted access to food despite sudden shocks or cyclical events [25]. As can be inferred from the definition, food insecurity entails undernutrition and malnutrition. While addressing undernutrition requires an increased energy intake, it also necessitates a balanced diet that provides essential nutrients [22,26].
Individuals with low income and a food deficit (LIFD) often rely on carbohydrate-based diets that lack proteins and micronutrients [22]. Animal proteins are the most efficient way to consume vital micronutrients, but their availability, affordability, and cultural acceptability are often limited, especially for the impoverished [22]. Being comparatively affordable and culturally preferred, fish holds advantages over other animal-sourced foods.
Kawarazuka and Béné [22] theorized three impact pathways of aquaculture development on food security and nutrition: consumption, income, and distribution. The consumption pathway involves aquaculture farmers and their households’ direct fish consumption. However, evidence on this pathway is inconclusive: many studies have found no significant differences in fish consumption between fish-farming households and other households [22,23,27]. In contrast, the income pathway, supported by extensive research, pertains to the contribution of small-scale aquaculture to higher incomes. An increased income enables aquaculture farmers to diversify their food baskets [22]. The distribution pathway is also vital as it emphasizes the role of women in securing nutritional outcomes. Women allocate more family income to food than men, ensuring household food security [22].
While the existing literature has offered valuable insights into how small-scale freshwater aquaculture can contribute to income generation and food security, the evidence remains limited. Therefore, it is imperative to gather more empirical evidence on factors enhancing income generation and nutritional outcomes in various regional contexts worldwide, considering mediating factors such as production type, intensity, organizational form, and gender.
This paper aims to enrich the literature by investigating the relationship between small-scale rural aquaculture, income generation, and food security in six regions in Madagascar. The selection of the case, as well as the analytical method, will be discussed in the following section.

3. Research Design

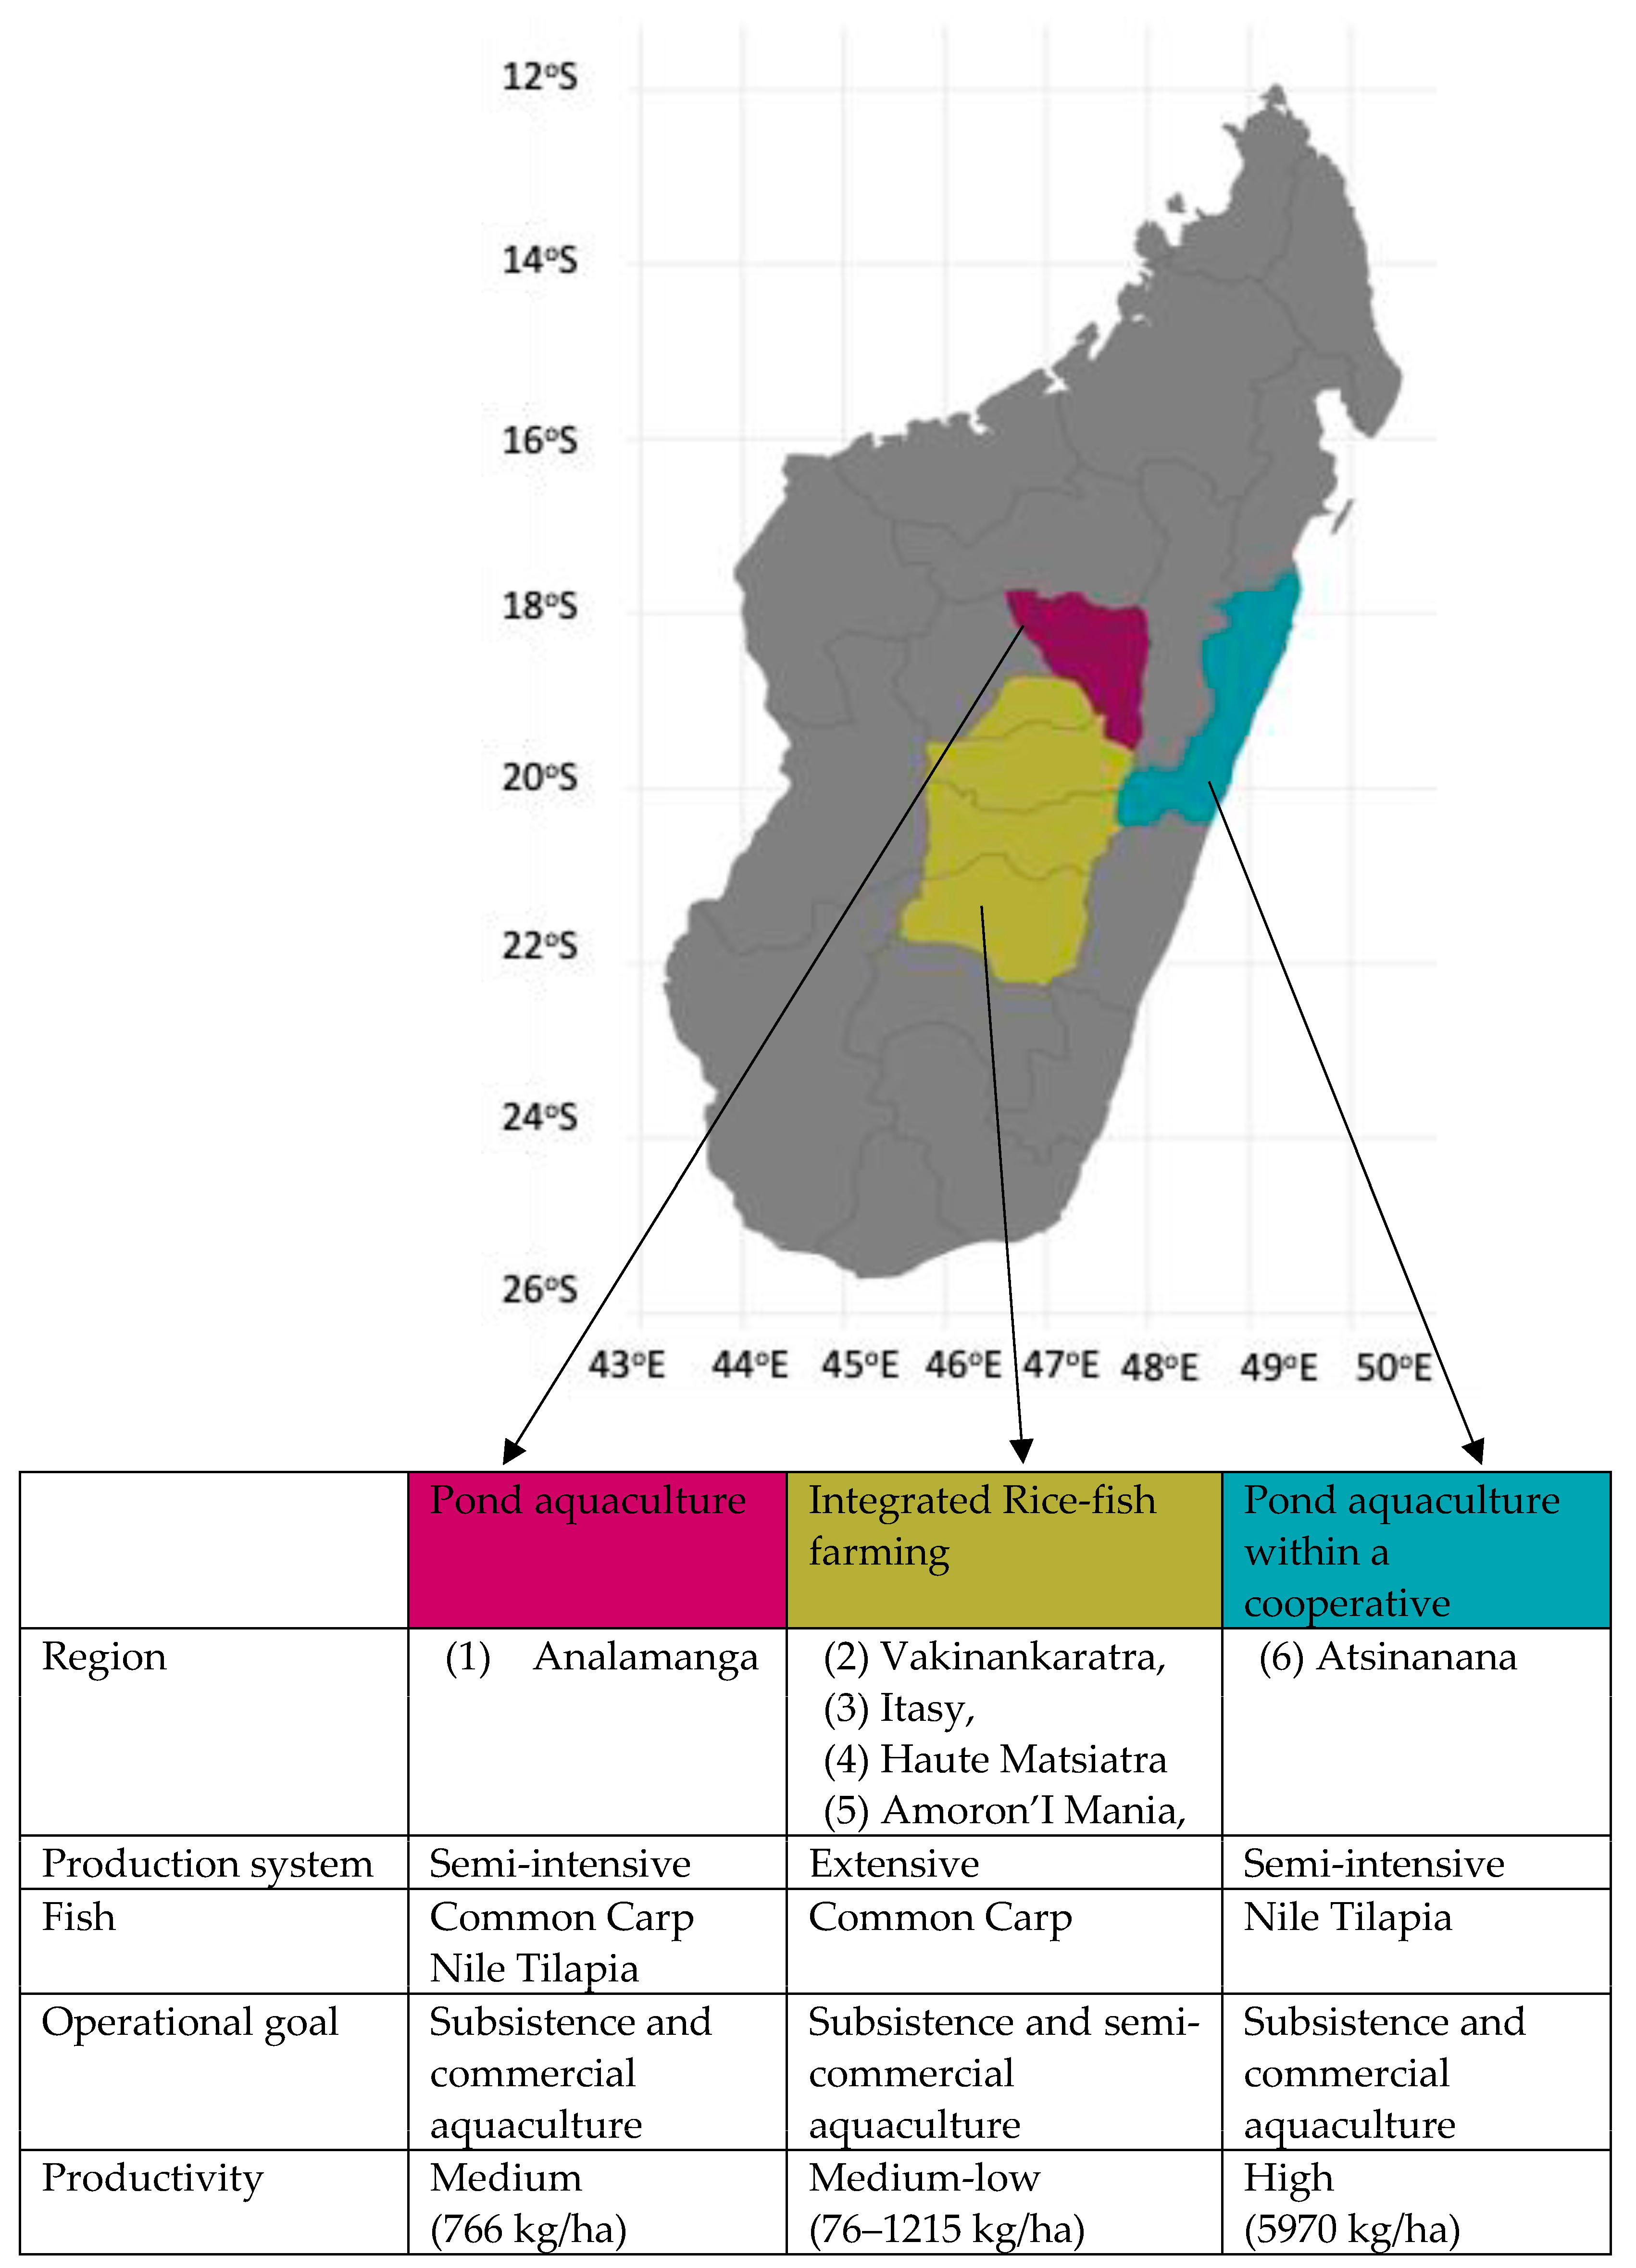
3.1. Selection of the Case: Freshwater Aquaculture in Rural Madagascar

Madagascar, the fourth largest island globally, grapples with significant human development challenges and multidimensional poverty. The fisheries and aquaculture sectors accounted for 7% of the country’s GDP and 6.6% of exports in 2018, playing vital roles in the economy [28,29,30]. Freshwater aquaculture, particularly in inland regions like Antananarivo and rural areas, is essential in addressing undernutrition and enhancing the livelihoods of the local population. This sector relies on diverse methods, including small-scale pond and rice-fish aquaculture, and employs traditional practices and low-input technologies [31,32,33].
Recognizing the importance of freshwater aquaculture, the Malagasy government has prioritized its sustainable development. National strategies, such as the “Lettre de la politique bleue” and the “Programme Sectoriel Agriculture Élevage Pêche” (PSAEP), focus on fostering inclusive growth, strengthening governance, and enhancing food accessibility and affordability. The government’s “Stratégie Nationale de l’Aquaculture à Madagascar” (SNDAM) for 2021–2030 emphasizes the requirement for technological advancements in inland aquaculture in order to boost rural revenues, employment, and food security [34,35,36,37].
Aligned with these strategies, the Deutsche Gesellschaft für Internationale Zusammenarbeit (GIZ) supports Madagascar’s aquaculture objectives through the “Pêche et Aquaculture Durable à Madagascar” (PADM) project [34,35]. Operating in six regions, including Analamanga, Vakinankaratra, Itasy, Amoron’I Mania, Haute Matsiatra, and Atsinanana, the project encompasses three types of aquaculture production systems [35]. In the Analamanga region, semi-intensive pond aquaculture practices are employed for common carp and Nile tilapia. Rice-fish farming is extensively practiced in the Vakinankaratra, Itasy, Amoron’I Mania, and Haute Matsiatra regions [36]. Additionally, in the Atsinanana region, under the cooperative Tilapia de l’Est (TDE), farmers produce semi-intensive Nile tilapia ponds, utilizing formulated feed [37]. These diverse aquaculture methods and their geographical distribution are illustrated in Figure 1. The data in this study originate from the PADM project and offer valuable insights into Madagascar’s freshwater aquaculture sector.

3.2. Data

The data in this study come from the monitoring and evaluation process of the “Pêche et Aquaculture Durable à Madagascar” project (PADM). This program’s steering unit, a Madagascar-based team, and a local consulting firm collected data from fish farmers, value chain actors (VCAs), and consumers in the six regions of interest [35]. The VCAs include food producers and vendors, fertilizer producers and distributors, wholesalers and retailers, fish shop and grocery store owners, manifold operators, restaurateurs, hoteliers, and service providers. The project team conducted the surveys in 2018, established baseline values, set project targets, and ran a follow-up midline survey in 2021 to monitor progress. The analysis for this paper utilized the 2021 midline data, leading to the use of a cross-sectional dataset.
The sampling design for the three types of respondents was based on different criteria. On the one hand, consumers and value chain actors were surveyed in the local markets and restaurants. The fish farmersincluded in the surveys, on the other hand, were the beneficiaries of the project, specifically pond producers in Analamanga and Atsinanana and rice-fish producers in the Highlands, excluding the Analamanga region [35]. After a pre-test in the field, three semi-structured questionnaires were used for data collection, covering food, aquaculture business type, fish and fingerling products, income, spending, access to credit, satisfaction, training, fish access and consumption patterns, and socio-economic details. The analysis of this paper focused on 492 fish farmers to ascertain fish-based income determinants and 1981 consumers, VCAs, and producers to ascertain food security characteristics.

3.3. Model

3.3.1. Fish Income

To explore which factors influence income generation in the small-scale aquaculture sector in the six regions, we utilized the total net income from fish production per aquaculture farmer annually as a dependent variable. Production techniques were categorized into individual pond producers, rice-fish farmers, and cooperative pond farmers.
The model also includes some variables related to the production context. First, ownership of tangible goods, financial assets, and farmland are positively associated with aquaculture income generation because of the greater income flow and the lack of costs related to rental [11,21,38,39]. Second, polycultures are associated with higher incomes. Research has shown that fish yields can increase by up to 40% for certain species thanks to the complementary use of nutrients [18]. Finally, extensive and semi-intensive aquaculture production systems require different feeding inputs, translating into non-negligible production costs that could drive farmers’ total income through increased production or become a burden due to excessively elevated costs [11,18,19].
This analysis incorporated various demographic and socio-economic control variables. Age is associated with more farming experience and thus potentially higher income. However, as individuals age, their productivity declines, leading to reduced income per farmer [36,40]. The gender of the household head and family size influence household poverty. Female-headed households tend to have a lower economic status than those led by men, especially when there is a significant number of economically dependent household members (i.e., when the dependency ratio is higher) [21,38,41]. Higher education levels and more years of experience in fish farming are associated with increased total income [21,41]. At the community level, the availability of infrastructure for market access plays a crucial role [21]. A comprehensive overview of these variables, including their descriptions and anticipated relationships with total fish-based income, is presented in Table A1 in Appendix A.
Given the cross-sectional nature of the analyzed data, this study uses multiple linear regression (MLR) to estimate the relationship between net fish-based income and the variables discussed earlier [21,38]. This estimation was made using the weighted least squares (WLS) method [42,43].
ln ( f i s h _ i n c o m e ) i = β 0 + β 1 t y p e _ p r o d u c e r i + β 2 a g e i + β 3 a g e i 2 + β 4 m a l e i + β 5 h h _ s i z e i + β 6 h h h e a d _ e d u c i + β 7 e x p e r i e n c e i + β 8 d i s t a n c e i + β 9 l a n d _ o w n e r i + β 10 p o l y c u l t u r e i + β 11 l n ( f e e d _ c o s t s ) i + ε i

3.3.2. Food Security

To explore the determinants of food security in the six regions, we used the Food Insecurity Experience Scale (FIES) as the dependent variable, measuring subjective food insecurity experience through eight questions [44]. A FIES score between 0 and 3 indicates food security, while one between 4 and 8 indicates food insecurity [43].
The model includes variables related to fish consumption, such as the distance to the nearest fish market [24,38,44], the frequency of fish consumption [14,22,24], the types of fish consumed (to explore whether the consumption of local fish is associated with higher levels of food security) [3,45], and the utilization of the entire fish for nutritional intake. Demographic and socio-economic variables, including age, household size, gender dynamics, education, and wealth, were also employed as control variables [22,46,47,48]. The variables and their expected effects are summarized in Table A2 in Appendix A.
Given the cross-sectional nature of the data and the dummy nature of the dependent variable, using only two values, namely, “food secure” and “food insecure”, we employed binary logistic regression to estimate the odds of being food secure according to the previously introduced predictor variables, as this technique has been used in several scientific publications investigating the determinants of food security [49].
l o g i t f o o d   s e c u r e = β 0 + β 1 t y p e _ r e s p o n d e n t i + β 2 a g e i + β 3 h h h e a d _ g e n d e r i + β 4 h h _ d e c i d e i + β 5 h h h e a d _ s i z e i + β 6 h h h e a d _ e d u c i + β 7 h h _ w e a l t h i + β 8 d i s t a n c e i + β 9 f r e q u e n c y i + β 10 f i s h _ s p e c i e s i + β 11 f i s h _ w h o l e i

4. Results and Discussion

4.1. Fish Income

4.1.1. Descriptive Statistics

The sample comprises a total of 492 observations. The descriptive statistics summarized in Table 1 reveal that approximately 69% of fish farmers are engaged in integrated rice-fish production, whereas only one-third are involved in a semi-intensive production system. Regarding age, the aquaculture farmers are typically in their productive age, with a mean age of around 45 years. The gender dynamics data indicate male dominance, with males constituting over 80% of the total sample. This result aligns with global trends in the aquaculture sector [41]. The household size distribution varies from one person per household to fifteen family members, indicating substantial diversity among the respondents. In terms of education, Table 1 illustrates that over 65% of the fish farmers have a secondary or higher-level degree. The value for the average years of experience in the sector is around seven years.
Regarding proximity to a market, Table 1 shows that the individuals are relatively close, with an average walking distance of 23 min. Almost all the fish farmers (93%) own the land on which they conduct aquacultural activities. Concerning the production types, Table 1 indicates that less than one-third of the producers use a polyculture approach. Fish-based income ranged between MGA 20,000 and almost 44 million while the total feed-related costs varied from zero to more than MGA 31,000. At the time when the data were collected (2021), MGA 1 million was equivalent to approximately USD 250 (USD 1 = MGA 3900).

4.1.2. Results of the Regression Analysis

Table 2 shows the results of the WLS estimation of the multiple linear regression. Models (2) to (4) gradually expand model (1) by adding demographic characteristics, socio-economic factors, and aquaculture production characteristics. Model (4) was therefore the final model concretely analyzed and is discussed in the following section. The robustness of the results was confirmed via both a Durbin–Watson autocorrelation test and the Variance Inflator Factor (VIF) test for multicollinearity.
Several key findings emerged from this analysis:
  • Type of producer: Compared to pond aquaculture farmers, rice-fish farmers have, on average, a 45% lower fish-based income derived from fish. (Given that fish-based income is logged, the interpretation of the coefficients needs a transformation. For log-linear relationships, one unit change in the independent variable changes the dependent variable according to the explanatory variable’s coefficient multiplied by 100 and expressed as a percentage (coefficient: β1X > interpretation: 100 × β1%). For log-log relationships, which will be relevant when interpreting the costs of fish feed, one unit change in the independent variable is associated with a change in the outcome variable according to the explanatory variable’s coefficient expressed as a percentage (coefficient: β1X > interpretation: β1%)). This result confirms previous findings and may be related to higher operational costs and variability in productivity [16,18,23,50]. Furthermore, rice-fish culture enhances farm productivity by integrating resources and reducing the need for fish feed, fertilizers, and pesticides [16,23,50]. However, it comes with high operational costs and demands specific skills, potentially leading to lower profitability [18,50]. Compared to other methods, rice-fish practices yield lower fish-based income due to variable productivity, ranging from 76 to 1215 kg per hectare [50].
  • Cooperatives: Participation in cooperatives results in a remarkable 231% higher fish-based income, confirming the benefits of cooperative organization, including reduced costs and improved market access [37]. In this case, the magnitude of the result can be explained by the global organization of the cooperative Tilapia de l’Est’s (TDE) value chain, which increases the profitability of production. Indeed, TDE is involved in fingerling production, technical skill support, entrepreneurial strategy development, and the improvement of commercialization processes.
  • Production techniques: Adopting polyculture leads to a 33% increase in fish-based income compared to monoculture, making it a significant factor in determining fish-based income. This finding is noteworthy as debates over this matter persist in research; some scholars claim that an up to 40% boost in fish yields can be obtained via polyculture, while others argue that there is no effect [17,18]. Specifically, combining Nile tilapias, micro-herbivorous column feeders, with common carps, omnivorous bottom feeders, has proven highly effective in increasing fish yields [19].
  • Education: Fish farmers with a secondary degree or higher education have a 32% higher fish-based income, emphasizing the positive correlation between education, informed decision making, and income generation. Education significantly impacts fish-based income at the 1% level. Those with a secondary degree or higher earn 32% more than individuals with only primary school education or none, which confirms the results of previous research. This indicates that educated households are more likely to adopt advanced fish-farming techniques and make informed business decisions due to their deeper understanding of production processes, distinguishing them from uneducated farmers [1,41].
  • Experience: Every additional year of experience positively correlates with income, although the impact is moderate. This result suggests that experience alone does not guarantee the adoption of more profitable production systems [41].
  • Gender disparities: Men tend to have a 22% higher fish-based income than women, reflecting the gender imbalances within this sector [2,38,41]. This finding aligns with the trend wherein women are often employed in less-profitable aspects of the fish production chain, leading to lower returns and benefits than men. Additionally, they face higher levels of labor discrimination, explaining their comparatively lower fish-based incomes.

4.2. Food Security

4.2.1. Descriptive Statistics

A binary logistic regression was conducted on a sample of 1981 observations. The descriptive statistics (Table 3) reveal that within this sample over 60% of consumers are not engaged in fish farming or are part of the value chain. Fish farmers constitute roughly 30% of the sample, while VCA members comprise less than 10%. The respondents’ ages varied from 17 to 83 years, with the mean of 42 years, indicating that most of the sample was in the productive age. Regarding household characteristics, males dominate as household heads, accounting for more than 86% of the total sample. Interestingly, almost half of the household decisions are made by females. In 43% of the cases, both parents make decisions jointly, highlighting a balanced division of responsibilities within the households. Most households comprise no more than five individuals, and two-thirds of the respondents completed secondary education or higher.
Regarding self-perceived wealth status compared to other households, only 8% of the respondents consider themselves better off. In contrast, the majority perceive their wealth status as average or lower than that of others in their area. The respondents exhibit significant variability in their access to the nearest fish-selling point, ranging from living right next to the selling spot to needing to travel for 4 h to reach it. However, with a mean access time of around 20 min, most individuals have rather easy access to fish products. The frequency and types of fish consumption also vary: over 65% of the sample consumes fish weekly or daily. Notably, most consume the whole fish, including the bones, heads, and guts, while around 20% consume only the valuable parts.

4.2.2. Results of the Regression Analysis

The binary logistic regression analysis results in Table 4 show the factors influencing food security in the sample population. The additional control variables are age, household units, and distance. The coefficients in the table indicate the direction of the relationships with respect to the binary outcome and their significance, while the odds ratios offer insights into the magnitude of these relationships [43]. The odds ratio measures the association between the explanatory variable and the outcome:
An OR > 1 indicates greater odds of an association;
An OR = 1 means there is no association;
An OR < 1 indicates a lower odds of an association.
The key findings are discussed below.
  • Consumption pathway: We expected that fish farmers would have easier access to fish compared to consumers and would consume relatively more fish and be associated with a better food security status [2,50]. However, this link was not confirmed in the analyzed data. There were no differences between fish farmers and consumers in terms of food security. VCAs have a 39% higher likelihood of being food secure, but this result was only significant at the 10% level.
  • Income pathway: Value chain actors are associated with better food security because they are generally wealthier and can purchase high-quality and nutritious food. The data show that wealth is a strong predictor, with better-off households having a four times higher likelihood than others of being food secure. This finding is in line with the results of previous research [40,49,50].
  • Distributional pathway: Female-headed households have a 36% lower likelihood of being food secure than male-headed households. This finding is significant at the 1% level. Concerning our second variable, when females make food-related decisions independently, the likelihood of being food secure increases by 39% compared to decisions made by males. This result is in line with the existing literature [2,22].
  • Frequency of fish consumption: A high frequency of fish consumption increases the likelihood of being food secure by 62% compared to individuals consuming fish only monthly or yearly. Fish provides consumers with high-quality proteins, fatty acids, and micronutrients, which are usually absent in carbohydrate-based diets [22,24,49]. However, the positivity of this relationship could also be because individuals who are better off financially have the means to frequently consume fish, hence their association with a higher nutritional status.
  • Parts of fish consumed: Consuming parts also does not show consistent impacts on food security. This finding is unexpected, as scientific research has shown that eating a whole fish significantly improves the micronutrient intake of the consumer, thus supporting better food security outcomes [22]. However, the indication of these findings is probably that the food-insecure population consumes whole fish because they cannot afford large fish or valuable fish parts or complement fish meals with other nutrient sources.
  • Type of fish consumed: Compared to consuming ocean fish, the consumption of carp increases the likelihood of being food secure by 111%, and the consumption of tilapias increases it by 36%. Since these data allowed us to test a relationship but not the direction of causality, the results could indicate that locally produced fish contributes to food security. Still, it would also signify the reverse: food-secure individuals can afford fresh and more expensive local fish. At the same time, the food-insecure population consumes the usually salted, dried, and cheaper ocean fish [24]. This interpretation makes even more sense when it is considered that carp are the most expensive fish species in this sample, as they are traditionally consumed for special occasions.
  • Education: Having a household head with a higher education level improves the likelihood of being food secure by two times. This is in line with previous research, highlighting that higher education levels allow people to make well-informed decisions impacting food security positively [40,49,50].

5. Discussion

The findings of this study reveal important insights into the factors influencing fish-based income in the small-scale aquaculture sector of Madagascar, offering valuable insights for policymakers and stakeholders.
In line with recent evidence [37,51], one of the key observations made in this study is the importance of cooperative membership for fish-based income generation, which confirms findings from recent research. Cooperative participation enables members to generate two times more income than independent pond fishermen. This finding underscores the value of collective action, knowledge sharing, and shared resources within aquaculture cooperatives, confirming the results of previous studies [37]. It provides evidence for policymakers and other stakeholders regarding the importance of promoting and supporting the formation of such cooperatives, offering a promising avenue for enhancing the profitability and livelihoods of fish farmers.
This study also highlights the challenges faced in integrated rice-fish farming, which, contrary to expectations, is related to significantly lower average fish-based income. While integrated farming provides opportunities for resource synergy [17,23,36], this study suggests the presence of operational challenges and productivity variations within this technique, an issue that has also been highlighted by other authors [19,36]. Further research focusing on the specific constraints encountered by rice-fish farmers could provide targeted strategies for support and improvement.
The positive impact of polyculture on fish-based income emphasizes the importance of species diversification within aquaculture systems. This is interesting because this topic is still debated in research, with some scholars suggesting there can be up to 40% higher fish yields through implementing polyculture and others proposing that is has no effect on fish yields [18,19]. Exploring optimal combinations of fish species beyond the ones analyzed in this study [46], considering ecological compatibility and market demand, could further enhance the income potential of aquaculture farms. Future research efforts could focus on identifying suitable species combinations and assessing their economic viability, offering valuable insights for fish farmers.
Education and experience play vital roles in determining fish-based income. This result is in line with previous research that found similar robust relationships [21,41]. Educated farmers, equipped with informed decision-making abilities, tend to implement advanced techniques and management practices, leading to higher incomes [1,41]. Targeted training programs tailored to the specific needs of fish farmers could bridge knowledge gaps, empowering individuals to adopt high-yield, sustainable practices [47]. As expected, experience is positively related to income generation, which is a result similar to other findings, but the magnitude is rather low, supporting the results of previous studies that found that more years of experience do not necessarily coincide with the adoption of more productive production systems, which are usually associated with higher income [41].
Additionally, this study underscores the significance of addressing gender disparities within this sector. Understanding the factors contributing to this gap, such as access to resources, training opportunities, and market networks, is crucial, as previous research has confirmed [2,38,41]. Policy interventions promoting gender equality, including targeted training programs and financial support for female fish farmers, could help mitigate this disparity, fostering inclusive growth in the aquaculture sector.
Surprisingly, the weak correlation between fish feed costs and income highlights the need for a more nuanced understanding of investment strategies. As previous studies have underscored, while high-quality feed is essential for fish health and growth, excessive spending on feed might not guarantee substantial income gains [11,17]. Farmers must balance feed quality, cost, and overall production efficiency to optimize their income, not least with regard to the environmental impacts of animal feed versus plant sources, as recent evidence suggests [48].
With regard to food security, the corresponding income pathway stands out, confirming that involvement in the value chain positively affects food security [2]. Stable, income-generating activities are pivotal in ensuring consistent access to food, aligning with the existing literature emphasizing this connection [2,22]. However, the unexpected negative correlation between consuming whole fish and food security reveals the complex dynamics at play. While existing evidence suggests that eating small fish whole greatly improves the micronutrient intake of consumers [22], our results might reflect economic constraints, where food-insecure individuals consume whole fish due to affordability rather than choice, indicating the need for targeted interventions that address both economic challenges and nutritional needs.
Additionally, the stark gender disparities observed highlight the multifaceted nature of food security [40] and the well-documented gender imbalances in aquaculture [2]. Female-headed households face challenges reflecting wider societal inequalities [38]. Empowering women and enhancing their decision-making authority could act as a catalyst for improved food security outcomes, emphasizing the importance of gender-sensitive policies and interventions.
In light of these findings, future research endeavors could explore regional variations and specific challenges faced by different demographic groups within the aquaculture sector. Investigating innovative and sustainable production techniques, coupled with rigorous economic analysis, could provide valuable insights into optimizing fish-based income.
Longitudinal studies tracking the impact of interventions and policy changes over time could offer a comprehensive understanding of the evolving aquaculture landscape in Madagascar. By addressing the challenges faced by rice-fish producers, promoting cooperative models, encouraging species diversification, and ensuring equitable opportunities for education and training, policymakers and stakeholders can foster a thriving and inclusive aquaculture sector. This, in turn, would improve the livelihoods of fish farmers, contributing significantly to food security and economic development in this region.

6. Conclusions

This study sheds light on the intricate dynamics of small-scale aquaculture in Madagascar, unraveling the key factors influencing fish-based income and food security. It significantly contributes to the existing knowledge regarding the complex interplay between freshwater aquaculture, food security, and fish-based income, especially in rural Madagascar. Through a meticulous examination of the diverse aspects of small-scale aquaculture, ranging from production techniques to socio-economic factors, this research provides a nuanced understanding of the challenges and opportunities within this sector. The findings provide valuable insights into the challenges faced by fish farmers and offer concrete solutions for policymakers and stakeholders aiming to enhance the aquaculture sector’s sustainability and inclusivity.
This study underscores the challenges encountered in integrated rice-fish farming, emphasizing the need for targeted support to address operational hurdles and productivity variations within this technique. Cooperative participation has emerged as a beacon of hope, showcasing substantial increases in fish-based income among participants. This highlights the importance of collective action, knowledge sharing, and shared resources within aquaculture cooperatives, paving the way for enhanced profitability and livelihoods. The positive impact of polyculture indicates the significance of species diversification, suggesting that exploring optimal combinations based on ecological compatibility and market demand could substantially enhance aquaculture farms’ income potential. Education and experience prove to be vital, underlining the necessity of tailored training programs that can empower farmers via granting them advanced techniques and management practices. Additionally, addressing gender disparities within this sector is pivotal, requiring targeted interventions to promote equality and inclusive growth.
This study reveals the complexity of food security pathways within the aquaculture context. While involvement in the value chain positively influences food security, unexpected correlations challenge conventional assumptions. The negative link between consuming whole fish and food security highlights economic constraints, emphasizing the need for interventions addressing both affordability and nutritional needs. Gender disparities in decision making further underscore the multifaceted nature of food security, calling for gender-sensitive policies empowering women and enhancing their role in household food matters.
This study’s implications reverberate beyond research, offering actionable strategies for policymakers and stakeholders. By addressing challenges faced by rice-fish producers, promoting cooperative models, encouraging species diversification, and ensuring equitable opportunities for education and training, a thriving and inclusive aquaculture sector can be fostered. Future research should explore regional variations, delve into specific challenges faced by diverse demographic groups, and track the impacts of interventions over time. Additionally, rigorous economic analyses of innovative and sustainable production techniques can provide further insights, enabling a comprehensive understanding of Madagascar’s evolving aquaculture landscape. By providing a comprehensive analysis and identifying key determinants, this research not only advances scholarly understanding but also paves the way for sustainable development, improved livelihoods, and enhanced food security in similar contexts worldwide.

Author Contributions

This paper is based on the master’s thesis of G.A., who performed the initial literature review and data analysis. All authors (G.A., A.P. and C.C.) contributed to writing the first draft of the manuscript as well as subsequent editing. All authors have read and agreed to the published version of the manuscript.

Funding

Cristina Chaminade and Andrés Palacio are funded by the Swedish Research Council (VR) project entitled “Sustainable Development of Small Island States“ (project number VR 2019-04117). Open-access funding was provided by Lund University.

Informed Consent Statement

Informed consent was obtained from all subjects involved in the study.

Data Availability Statement

Data are not publicly available due to privacy and ethical restrictions. Please contact the authors directly.

Acknowledgments

The authors would like to thank the Deutsche Gesellschaft für Internationale Zusammenarbeit (GIZ) for providing access to the data on which this research is based.

Conflicts of Interest

The authors declare no conflict of interest.

Appendix A

Table A1. Variables included in the model to estimate fish-based income in small-scale freshwater aquaculture.
VariableCodingDescriptionExpected Sign
Outcome Variable
Fish-based incomelnfish_incomeContinuous variable indicating an aquaculture farmer’s total income in MGA in a year.
Independent Variables
Type of producertype_producerCategorical variable indicating whether the respondent is (1) a pond farmer, (2) a rice-fish farmer, or (3) part of a pond-based cooperative system.(1) ref
(2) ±
(3) +
Demographic characteristicsAge of producerageContinuous variable indicating the age of the producer in years.+
Age squaredage_squaredContinuous variable measuring the square of the producers’ age.
Gender of producermaleDummy variable indicating whether the producer is a male (1) or a female (0).+
Household sizehh_sizeContinuous variable indicating the number of people living in the household.
Socio-economic characteristicsEducation of household headhhhead_educDummy variable indicating whether the household head attended secondary school or higher (1) or whether they only have a primary school degree or none at all (0).+
Farming experienceexperienceContinuous variable indicating the number of years of experience of the aquaculture farmer.+
Market infrastructuredistanceContinuous variable indicating the walking distance in minutes from the closest selling point.
Production characteristicsLandownerland_ownerDummy variable indicating whether an aquaculture farmer owns their land (1) or not (0).+
Fish culturepolycultureDummy variable indicating whether an aquaculture farmer adopted a polyculture (1) or a monoculture (0) system.+
Fish feed costslnfeed_costsContinuous variable indicating an aquaculture farmer’s total costs MGA in a year.±
Note: Expected signs: ref (reference variable), +: positive sign; −: negative sign; ± evidence inconclusive on the sign.
Table A2. Variables included in the model to estimate food security in small-scale freshwater aquaculture.
VariableCodingDescriptionExpected Sign
Outcome Variable
Food securityfiesDummy variable indicating whether the respondent is food secure (1) or food insecure (0).
Independent Variables
Type of respondenttype_respondentCategorical variable indicating whether the respondent is (1) a consumer, (2) a producer, or (3) a value-chain actor.(1) ref
(2) +
(3) +
Demographic characteristicsAge of respondentageContinuous variable indicating the age of the respondent in years.±
Gender of household headhhhead_genderDummy variable indicating whether the household head is a male (1) or a female (0).
Who decides on food mattershh_decideCategorical variable indicating whether decisions regarding food matters are made by (1) the male, (2) the female, or (3) both.(1) ref
(2) +
(3) +
Household sizehh_sizeContinuous variable indicating the number of people living in the household.
Socio-economic characteristicsEducation of household headhhhead_educDummy variable indicating whether the household head attended secondary school or higher (1) or whether they only have a primary school degree or none at all (0).+
Household wealthhh_wealthDummy variable indicating whether the respondent perceives their household as better off than the others (1) or not (0). +
Fish consumption characteristicsAccessibility of fish distanceContinuous variable indicating the walking distance in minutes from the closest fish-purchasing point.
Frequency of fish consumptionfrequencyDummy variable indicating whether the respondent consumes fish frequently (1) or not (0).+
Fish species consumedfish_speciesCategorical variable indicating whether the respondent consumes ocean fishes or other (1), carp (2), or tilapias (3).(1) ref
(2) +
(3) +
Consumption of whole fishfish_wholeDummy variable indicating whether the respondent consumes the whole fish (1) or not (0).+
Note: Expected signs: ref (reference variable), +: positive sign; −: negative sign; ± evidence inconclusive on the sign.

References

  1. Béné, C.; Arthur, R.; Norbury, H.; Allison, E.H.; Beveridge, M.; Bush, S.; Campling, L.; Leschen, W.; Little, D.; Squires, D. Contribution of fisheries and aquaculture to food security and poverty reduction: Assessing the current evidence. World Dev. 2016, 79, 177–196. [Google Scholar] [CrossRef]
  2. Gonzalez Parrao, C.; Shisler, S.; Moratti, M.; Yavuz, C.; Acharya, A.; Eyers, J.; Snilstveit, B. Aquaculture for improving productivity, income, nutrition and women’s empowerment in low-and middle-income countries: A systematic review and meta-analysis. Campbell Syst. Rev. 2021, 17, e1195. [Google Scholar] [CrossRef]
  3. Food and Agriculture Organization (FAO). Regional Review on Status and Trends in Aquaculture Development in Sub-Saharan Africa (2020); FAO: Rome, Italy, 2022. [Google Scholar]
  4. Food and Agriculture Organization (FAO). The State of World Fisheries and Aquaculture 2022: Towards Blue Transformation; FAO: Rome, Italy, 2022. [Google Scholar]
  5. Ahmed, N.; Turchini, G.M. The evolution of the blue-green revolution of rice-fish cultivation for sustainable food production. Sustain. Sci. 2021, 16, 1375–1390. [Google Scholar] [CrossRef]
  6. Costa-Pierce, B.A. Epilogue: Aquaculture, innovation and social transformation. Aquac. Innov. Soc. Transf. 2008, 17, 315–326. [Google Scholar]
  7. Hou, H.; Ren, A.; Yu, L.; Ma, Z.; Zhang, Y.; Liu, Y. An Environmental Impact Assessment of Largemouth Bass (Micropterus salmoides) Aquaculture in Hangzhou, China. Sustainability 2023, 15, 12368. [Google Scholar] [CrossRef]
  8. Finegold, C. The Importance of Fisheries and Aquaculture to Development. Master’s Thesis, The Royal Swedish Academy of Agriculture and Forestry, Stockholm, Sweden, 2009. Available online: https://digitalarchive.worldfishcenter.org/bitstream/handle/20.500.12348/1445/WF_2546.pdf?sequence=1&isAllowed=y (accessed on 3 May 2023).
  9. Johnson, R. The Ecosystem Approach to Aquaculture; Stockholm Resilience Center: Stockholm, Sweden, 2007; Available online: https://www.stockholmresilience.org/download/18.aeea46911a31274279800082928/Robert+Johnson+NGG+07+Thesis.pdf (accessed on 2 February 2023).
  10. Chen, S.; De Bruyne, C.; Bollempalli, M. Blue economy: Community case studies addressing the poverty–environment nexus in ocean and coastal management. Sustainability 2020, 12, 4654. [Google Scholar] [CrossRef]
  11. Burns, T.E.; Wade, J.; Stephen, C.; Toews, L. A scoping analysis of peer-reviewed literature about linkages between aquaculture and determinants of human health. EcoHealth 2014, 11, 227–240. [Google Scholar] [CrossRef]
  12. Brugère, C.; Aguilar-Manjarrez, J.; Beveridge, M.C.; Soto, D. The ecosystem approach to aquaculture 10 years on–a critical review and consideration of its future role in blue growth. Rev. Aquac. 2019, 11, 493–514. [Google Scholar] [CrossRef]
  13. Soto, D.; Aguilar-Manjarrez, J.; Hishamunda, N. Building an ecosystem approach to aquaculture. In Proceedings of the FAO/Universitat de les Illes Balears Expert Workshop, Palma de Mallorca, Spain, 7–11 May 2007; FAO: Rome, Italy, 2008. Available online: https://www.fao.org/3/i0339e/i0339e00.htm (accessed on 1 April 2023).
  14. Stevenson, J.R.; Irz, X. Is aquaculture development an effective tool for poverty alleviation? A review of theory and evidence. Cah. Agric. 2009, 18, 292–299. [Google Scholar] [CrossRef]
  15. World Bank. Employment in Agriculture (% of Total Employment) (Modeled ILO Estimate)-Madagascar. 2023. Available online: https://data.worldbank.org/indicator/SL.AGR.EMPL.ZS?locations=MG (accessed on 15 April 2023).
  16. Oxford Poverty and Human Development Initiative (OPHI). Global MPI Country Briefing 2021: Madagascar (Sub-Saharan Africa); University of Oxford: Oxford, UK, 2021; Available online: https://ophi.org.uk/ (accessed on 1 April 2023).
  17. Edwards, P. Aquaculture, Poverty Impacts and Livelihoods; Overseas Development Institute: London, UK, 2000. [Google Scholar]
  18. Lhoste, P.; Baudoux, S.; Vall, E. Mémento de l’agronome; CIRAD: Dakar, Senegal, 2009; Available online: https://www.doc-developpement-durable.org/file/Culture/Agriculture/Memento-de-l-Agronome_CIRAD.pdf (accessed on 1 April 2023).
  19. Frei, M.; Becker, K. Integrated Rice-Fish Culture: Coupled Production Saves Resources; Wiley Online Library: Hoboken, NJ, USA, 2005; pp. 135–143. Available online: https://onlinelibrary.wiley.com/doi/10.1111/j.1477-8947.2005.00122.x (accessed on 1 April 2023).
  20. Morgan, M.; Terry, G.; Rajaratnam, S.; Pant, J. Socio-cultural dynamics shaping the potential of aquaculture to deliver development outcomes. Rev. Aquac. 2017, 9, 317–325. [Google Scholar] [CrossRef]
  21. Tuyen, T.Q. Socio-economic determinants of household income among ethnic minorities in the North-West Mountains, Vietnam. Croat. Econ. Surv. 2015, 17, 139–159. [Google Scholar]
  22. Kawarazuka, N.; Béné, C. Linking small-scale fisheries and aquaculture to household nutritional security: An overview. Food Secur. 2010, 2, 343–357. [Google Scholar] [CrossRef]
  23. Dey, M.M.; Paraguas, F.J.; Kambewa, P.; Pemsl, D.E. The impact of integrated aquaculture–agriculture on small-scale farms in Southern Malawi. Agric. Econ. 2010, 41, 67–79. [Google Scholar] [CrossRef]
  24. Cojocaru, A.L.; Liu, Y.; Smith, M.D.; Akpalu, W.; Chávez, C.; Dey, M.M.; Dresdner, J.; Kahui, V.; Pincinato, R.B.M.; Tran, N. The “seafood” system: Aquatic foods, food security, and the Global South. Rev. Environ. Econ. Policy 2022, 16, 306–326. [Google Scholar] [CrossRef]
  25. Food and Agriculture Organization (FAO). Food Security; FAO: Rome, Italy, 2006; Available online: https://www.fao.org/fileadmin/templates/faoitaly/documents/pdf/pdf_Food_Security_Cocept_Note.pdf (accessed on 15 August 2023).
  26. Tacon, A.G.; Metian, M. Food matters: Fish, income, and food supply—A comparative analysis. Rev. Fish. Sci. Aquac. 2018, 26, 15–28. [Google Scholar] [CrossRef]
  27. Prein, M.; Ahmed, M. Integration of Aquaculture into Smallholder Farming Systems for Improved Food Security and Household Nutrition. Food Nutr. Bull. 2000, 21, 466–471. [Google Scholar] [CrossRef]
  28. Djaoui, L.; Hourtoule, M. Madagascar 2021: L’Émergence Malagasy; LD Media Development: Tananarive, Madagascar, 2021. [Google Scholar]
  29. World Bank. Madagascar: Balancing Conservation and Exploitation of Fisheries Resources. 2020. Available online: https://www.worldbank.org/en/news/feature/2020/06/08/madagascar-balancing-conservation-and-exploitation-of-fisheries-resources (accessed on 10 April 2023).
  30. Agulhas and Somali Current Large Marine Ecosystems Project (ASCLME). ASCLME National Marine Ecosystem Diagnostic Analysis: Madagascar; United Nations Development Programme: New York, NY, USA, 2012; Available online: https://iwlearn.net/resolveuid/d45c0f0654714a85a06761ef8f234f09 (accessed on 1 April 2023).
  31. Joffre, O.; Rovahasambarana Irajanahary Ekembahoaka, N.; Loberline Ratiarisoa, D.; Borchert, P. Cadre Stratégique et Juridique de l’Aquaculture à Madagascar: Manuel de Bonnes Pratiques; Deutsche Gesellschaft für Internationale Zusammenarbeit (GIZ): Bonn, Germany, 2023; Available online: https://www.giz.de/en/downloads/giz2023-fr-cadre-strat%C3%A9gique-juridique-aquaculture-madagascar.pdf (accessed on 1 April 2023).
  32. Ministère des Ressources Halieutiques et de la Pêche. Lettre de Politique BLEUE: Pour une économie BLEUE, Valorisant le Travail des Pêcheurs et Aquaculteurs, Durabilisant la Création de ses Richesses, et Prenant en Compte le bien être écologique des Ressources Halieutiques; Ministère des Ressources Halieutiques et de la Pêche: Tananarive, Madagascar, 2015. [Google Scholar]
  33. République de Madagascar. Programme Sectoriel Agriculture, Elevage, Pêche (PSAEP) et Plan National d’Investissement Agricole (PNIAEP) 2016–2020; République de Madagascar: Antananarivo, Madagascar, 2015; Available online: https://faolex.fao.org/docs/pdf/Mad169997.pdf (accessed on 1 April 2023).
  34. Deutsche Gesellschaft für Internationale Zusammenarbeit (GIZ). Projet d’Aquaculture Durable à Madagascar (PADM)-Composante du Programme Mondial « Pêche et Aquaculture Durable »; Deutsche Gesellschaft für Internationale Zusammenarbeit (GIZ): Bonn, Germany, 2022; Available online: https://www.giz.de/en/downloads/giz-2023-fr-programme-mondial-p%C3%AAche-et-aquaculture-durables-madagascar.pdf (accessed on 1 April 2023).
  35. Kleemann, L.; Semrau, F.O. Unterstützung des Globalvorhabens für nachhaltige Fischerei und Aquakultur bei der Midline-Erhebung im Länderpaket Madagaskar; Deutsche Gesellschaft für Internationale Zusammenarbeit (GIZ) GmbH: Bonn, Germany, 2022; Available online: https://www.giz.de/de/downloads/nachhaltige-fischerei-aquakultur.pdf (accessed on 1 April 2023).
  36. Bentz, B.; Randriampeno, T.; Nantenaina Fanomezantsoa, P.; Mandresilahatr, J.; Nomentsoa Ramananjaona, J.; Zafimandimby, E.; Rafenomanjato, A.; Maureaud, C.; Tiambahoaka, C. Rizipisciculture sur les Hautes Terres Malgaches: Manuel de Bonnes Pratiques; Deutsche Gesellschaft für Internationale Zusammenarbeit (GIZ): Bonn, Germany, 2023; Available online: https://www.apdra.org/images/Apdra/Pdf/Manuels_fiches_techniques/2305_Livre_1__Manuel_de_bonnes_pratiques_en_aquaculture_PADM_FR.pdf (accessed on 1 April 2023).
  37. Rafalimisy, C.K.; Monja, M.T.; Ahitantsoa, F.; Fuller, M.; Mugaas, A.; Tønnesen, J. Production de Tilapia du Nil (Oreochromis niloticus) en Etang dans la Région Atsinanana: Manuel de Bonnes Pratiques; Deutsche Gesellschaft für Internationale Zusammenarbeit (GIZ): Bonn, Germany, 2023; Available online: https://www.giz.de/en/downloads/giz2023-fr-production-%c3%a9tang-madagascar.zip (accessed on 1 April 2023).
  38. World Bank. Introduction to Poverty Analysis; World Bank: Washington, DC, USA, 2005. [Google Scholar]
  39. Kaliba, A.R.; Ngugi, C.C.; Mackambo, J.M.; Osewe, K.O.; Senkondo, E.; Mnembuka, B.V.; Amisah, S. Potential effect of aquaculture promotion on poverty reduction in Sub-Saharan Africa. Aquac. Int. 2007, 15, 445–459. [Google Scholar] [CrossRef]
  40. Gebre, G.G. Determinants of food insecurity among households in Addis Ababa city, Ethiopia. Interdiscip. Descr. Complex Syst. 2012, 10, 159–173. [Google Scholar] [CrossRef]
  41. Iruo, F.A.; Onyeneke, R.U.; Eze, C.C.; Uwadoka, C.; Igberi, C.O. Economics of smallholder fish farming to poverty alleviation in the Niger Delta Region of Nigeria. Turk. J. Fish. Aquat. Sci. 2018, 19, 313–329. [Google Scholar]
  42. Verbeek, M.A. Guide to Modern Econometrics, 5th ed.; Wiley: Hoboken, NJ, USA, 2017. [Google Scholar]
  43. Wooldridge, J.M. Introductory Econometrics: A Modern Approach; Cengage Learning: Boston, MA, USA, 2015. [Google Scholar]
  44. Food and Agriculture Organization (FAO). The Food Insecurity Experience Scale: Measuring Food Insecurity through People’s Experiences; Food and Agriculture Organization: Rome, Italy, 2017; Available online: https://www.fao.org/publications/card/en/c/2c7ce182-b76d-40bb-9fbe-59ba3c8394fc/ (accessed on 1 April 2023).
  45. Refaliarison, J. National Aquaculture Sector Overview Madagascar; Fisheries and Aquaculture Division, Food and Agriculture Organization (FAO): Rome, Italy, 2023. [Google Scholar]
  46. Romana-Eguia, M.R.R.; Rutaquio, M.P.; Gutierrez, R.C.; Salayo, N.D. Assessment of Tilapia–Freshwater Prawn Co-Culture Schemes in Tanks and Lake-Based Cages for Increased Farm Production. Sustainability 2021, 13, 13574. [Google Scholar] [CrossRef]
  47. Gabriel, R.N.; Gabriel, N.N.; Shikesho, O.N. The Potential of Small-Scale Freshwater Aquaculture for Household Nutritional Security and Malnutrition Alleviation in Namibia. In Emerging Sustainable Aquaculture Innovations in Africa; Gabriel, N.N., Omoregie, E., Abasubong, K.P., Eds.; Springer Nature: Singapore, 2023; pp. 477–491. [Google Scholar]
  48. Fonseca, T.; Valenti, W.C.; Giannetti, B.F.; Gonçalves, F.H.; Agostinho, F. Environmental Accounting of the Yellow-Tail Lambari Aquaculture: Sustainability of Rural Freshwater Pond Systems. Sustainability 2022, 14, 2090. [Google Scholar] [CrossRef]
  49. Bashir, M.K.; Schilizzi, S.; Pandit, R. The Determinants of Rural Household Food Security in the Punjab, Pakistan: An Econometric Analysis. No. 1784-2006-141882. 2012. Available online: https://ideas.repec.org/p/ags/uwauwp/122526.html (accessed on 1 April 2023).
  50. Assefa, B.A. Factors Influencing the Food Security of Smallholder Farmers in Madagascar. Ph.D. Thesis, University of Minnesota, Minneapolis, MN, USA, 2018. [Google Scholar]
  51. Desprez, D.; Rakotoambinina, S.; Andriantsoa, M.; Rakotoasimbola, L.; Godard, L.; Andriniaina, H.; Randriarilala, F.; Rakotomavo, D. Production en Etang dans la Région Analamanga: Manuel de Bonnes Pratiques; Deutsche Gesellschaft für Internationale Zusammenarbeit (GIZ): Bonn, Germany, 2023; Available online: https://www.giz.de/en/downloads/giz2023-fr-production-%c3%a9tang-madagascar.zip (accessed on 1 April 2023).
Figure 1. Regional distribution of the data collection sites.
Sustainability 15 15439 g001
Table 1. Descriptive statistics of the factors influencing fish-based income.
VariableFrequencyPercentageMean
Type of producer
    Pond11723.8%
    Rice-fish33968.9%
    Cooperative367.3%
Age of producer (years) 45.5
Age squared 168.8
Gender of producer 0.8
    Male 39880.9%
    Female9419.1%
Household size 5.3
Education of household head
    Primary or lower 17134.8%
    Secondary or higher32165.2%
Farming experience (years) 7.3
Distance (minutes) 23.4
Land ownership
    Landowner46093.5%
    Otherwise326.5%
Fish culture
    Polyculture14629.7%
    Monoculture34670.3%
Fish feed costs (log) 8.0
Table 2. WLS regression output of the factors affecting fish-based income.
Dependent Variable: Fish Income
(1)(2)(3)(4)
Type of producer (Baseline = pond)
Rice-fish−0.79 *** (0.12)−0.80 *** (0.12)−0.77 *** (0.13)−0.45 *** (0.12)
Cooperative2.48 *** (0.16)2.53 *** (0.17)2.67 *** (0.18)2.31 *** (0.20)
Age of producer 0.004 (0.004)0.003 (0.004)0.005 (0.004)
Age squared −0.0003 (0.0003)−0.0004 (0.0003)−0.0001 (0.0003)
Male 0.25 * (0.13)0.25 * (0.13)0.22 * (0.13)
Household size 0.01 (0.02)0.01 (0.02)−0.002 (0.02)
Education of household head 0.30 *** (0.11)0.32 *** (0.11)
Farming experience 0.02 ** (0.01)0.02 ** (0.01)
Distance −0.004 ** (0.002)−0.003 ** (0.002)
Landowner −0.10 (0.20)
Polyculture 0.33 *** (0.11)
Fish feed costs 0.09 *** (0.01)
Constant13.78 *** (0.10)13.44 *** (0.26)13.21 *** (0.29)12.21 *** (0.34)
Observations492492492492
R20.530.520.490.52
Adjusted R20.530.510.480.51
Residual Std. Error1.30 (df = 489)1.31 (df = 485)1.32 (df = 482)1.33 (df = 479)
F Statistic279.90 ***
(df = 2; 489)
86.95 ***
(df = 6; 485)
51.72 ***
(df = 9; 482)
38.60 ***
(df = 12; 479)
Note: * p < 0.1; ** p < 0.05; *** p < 0.01.
Table 3. Summary of statistics of the determinants of food security.
VariableFrequencyPercentageMean
Food security
    Food insecure 86943.9%
    Food secure111256.1%
Type of respondent
    Consumer119360.2%
    Fish farmer61130.8%
    VCA (Value Chain Actor)1778.9%
Age of respondent (years) 42
Gender of household head
    Male 171286.4%
    Female26913.6%
Who makes decisions on food matters
    Male 1457.3%
    Female98449.7%
    Both85243%
Household size (units) 4.9
Education of household head
    Primary or lower69835.2%
    Secondary or higher128364.8%
Household wealth
    Poorer or same 182191.9%
    Better off1608.1%
Distance (minutes) 19.7
Frequency
    Rarely68034.3%
    Frequently131065.7%
Fish species
    Ocean62331.4%
    Carps40620.5%
    Tilapias95248.1%
Fish consumption
    Parts 37318.8%
    Whole160881.2%
Table 4. Logistic regression output of the factors influencing food security.
Dependent Variable: FIES
(1)(2)(3)(4)Odds Ratio (4)
Type of respondent
(baseline = consumer)
Fish farmer0.26 *** (0.10)0.21 ** (0.11)0.12 (0.11)0.07 (0.12)1.07
VCA0.55 *** (0.17)0.54 *** (0.17)0.43 ** (0.17)0.33 * (0.18)1.39
Female as household head −0.56 *** (0.14)−0.49 *** (0.14)−0.45 *** (0.15)0.64
Who makes decisions on food matters
(baseline = male)
Female 0.38 ** (0.18)0.37 ** (0.19)0.33 * (0.19)1.39
Both 0.21 (0.18)0.18 (0.19)0.09 (0.19)1.09
Household size −0.05 * (0.03)−0.02 (0.03)−0.02 (0.03)0.98
Education of household head 0.71 *** (0.10)0.70 *** (0.10)2.00
Household wealth 1.52 *** (0.24)1.42 *** (0.24)4.12
Frequency 0.48 *** (0.10)1.62
Fish species (baseline = ocean)
Carp 0.74 *** (0.15)2.11
Tilapia 0.31 *** (0.11)1.36
Consumption of whole fish −0.33 ** (0.13)0.72
Constant0.12 ** (0.06)−0.13 (0.24)−0.82 *** (0.27)−1.04 *** (0.30)0.35
Observations1981198119811981
Log Likelihood−1350.78−1339.15−1277.72−1255.58
Akaike Inf. Crit.2707.562694.302577.432541.17
McFadden R-squared0.01 (df = 3)0.01 (df = 8)0.06 (df = 11)0.08 (df = 15)
Note: * p < 0.1; ** p < 0.05; *** p < 0.01.
Disclaimer/Publisher’s Note: The statements, opinions and data contained in all publications are solely those of the individual author(s) and contributor(s) and not of MDPI and/or the editor(s). MDPI and/or the editor(s) disclaim responsibility for any injury to people or property resulting from any ideas, methods, instructions or products referred to in the content.

