Article

The Influence of Winter Irrigation Amount on the Characteristics of Water and Salt Distribution and WUE in Different Saline-Alkali Farmlands in Northwest China

1
College of Sciences, Shiehezi University, Shihezi 832003, China
2
College of Water Conservancy and Architectural Engineering, Shihezi University, Shihezi 832003, China
*
Author to whom correspondence should be addressed.
Sustainability 2023, 15(21), 15428; https://doi.org/10.3390/su152115428
Submission received: 1 September 2023 / Revised: 5 October 2023 / Accepted: 24 October 2023 / Published: 30 October 2023

Abstract

:
Winter irrigation is widely carried out to alleviate soil salinization in Northwest China. In recent years, the effects of irrigation amount and irrigation schedule on soil water and salt distribution and water use efficiency (WUE) during crop growth periods have been extensively studied, but the effects of winter irrigation on water use efficiency have been generally ignored. This work was conducted from November 2018 to October 2020 in two kinds of saline-alkali farmlands (mild saline-alkali farmland and moderate saline-alkali farmland) with five winter irrigation amounts (0, 150, 225, 300 and 375 mm). The results indicated that, during the winter irrigation period, the maximum moisture content layer in the soil becomes more shallow with the increase in the winter irrigation amount and the salinity of the soil. The salt return process mainly occurs during the late thawing period. After two years, for a winter irrigation amount of 150 mm to 375 mm, the change rate of soil salt in mild saline-alkali farmland decreased from −2.50% to −15.38% in the 0–100 cm profile, and that value in moderate saline-alkali farmland decreased from 12.22% to −16.85%. Compared with the non-winter irrigation treatment, the sprouting rate, survival rate, morphological index and cotton yield in the coming year are greater under the winter irrigation treatment. For mild saline-alkali farmland and moderate saline-alkali farmland, to keep soil desalinated, enhance cotton growth and save water resources, the recommended winter irrigation amounts are 225 mm and 300 mm, respectively. The research methods and results are of great significance for rationally evaluating the sustainable winter irrigation amount for cotton fields under mulched drip irrigation in different saline-alkali farmlands.

1. Introduction

Increasing demand for food and fiber has put unprecedented stress on agriculture and natural resources [1]. In China, agricultural water accounts for roughly 70% of total water consumption, of which 90% is used for farmland irrigation [2]. However, available irrigation water is seriously reduced because of the higher demands of industrial and urban water consumption [3]. In recent years, in order to expand the area of cultivated land, large tracts of salinization soil have been reclaimed into cultivated land in Xinjiang province, and then local farmers have continued to exploit groundwater or brackish water to meet growing irrigation water demands [4,5]. Moreover, mulched drip irrigation is the most important irrigation method in the growing process of crops in Xinjiang. Compared with border irrigation, furrow irrigation and spray irrigation, it is considered to be the best irrigation method for saving water and increasing crop production [6,7,8,9]. However, the saline-alkali area in Xinjiang is very large, and almost 1.23 × 10⁶ hm2 of irrigated cropland is affected by salinization, which accounts for one third of the total cultivated area [10]. Among them, the mild (1–3 g/kg), moderate (3–7 g/kg) and severe (7–10 g/kg) salinized farmland account for 49%, 33% and 18% of the total area of salinized farmland, respectively [11,12]. However, because of the high irrigation frequency and shallow wetting depth characterized by the mulched drip irrigation technology, the leaching depth of soil salt is limited. Therefore, flood irrigation is widely carried out in winter to alleviate soil salinization, and it is also considered a prerequisite for high yield [13,14,15]. Under the contradictory requirements of water saving and soil salt leaching, improving WUE is an effective way to alleviate water shortages, which restrict agricultural crop production [16]. A large number of scholars have researched the effects of irrigation amount and irrigation schedule on soil water-salt distribution and WUE during crop growth [17,18]. However, on the basis of consideration of salt control by irrigation treatment, the effect of winter irrigation on WUE was generally ignored.
Cotton is the pillar industry of Xinjiang agriculture, and it is also the largest production base of high-quality commercial cotton in China and the most important in the world. The annual irrigation amount of cotton farmland in Xinjiang is generally maintained at 850–1050 mm, and the irrigation amount reaches 350–575 mm by using mulched drip irrigation technology during the cotton growing period [19,20]. However, winter irrigation accounts for more than 50% of the total annual irrigation. Farmland water consumption has not decreased significantly due to the large amount of water consumed in winter. Yang et al. proposed that winter irrigation is one of the water and salt management practices in arid irrigated areas, and the desalination effect of winter irrigation increases with the increase in irrigation amount, but its efficiency decreases with the increase in irrigation amount [21]. Li et al. [22] emphasized that excessive irrigation in winter would lead to the rise of groundwater level, which is easily caused by the secondary salinization of soil and thus deteriorate the soil environment. In addition, Fan et al. pointed out that the random setting of winter irrigation amounts in farmland with different levels of salinization results in a vicious cycle of salt leaching, salt accumulation and salt leaching in the irrigated area [23]. Therefore, realizing the efficient utilization of irrigation water resources in Xinjiang and determining the appropriate amount of winter irrigation for farmland with different levels of salinization is an urgent problem that needs solving.
From the perspective of controlling soil salt and improving water use efficiency, the experiment was conducted in Xinjiang, China. Two kinds of saline-alkali farmlands (mild saline-alkali farmland and moderate saline-alkali farmland) and five winter irrigation amounts (0, 150, 225, 300 and 375 mm) were designed to investigate the influence of winter irrigation amounts on soil water-salt distribution, cotton growth and WUE in farmland. The research methods and results are very significant in evaluating winter irrigation amounts, controlling soil salinization and enhancing WUE for different saline-alkali farmlands in northwest China.

2. Materials and Methods

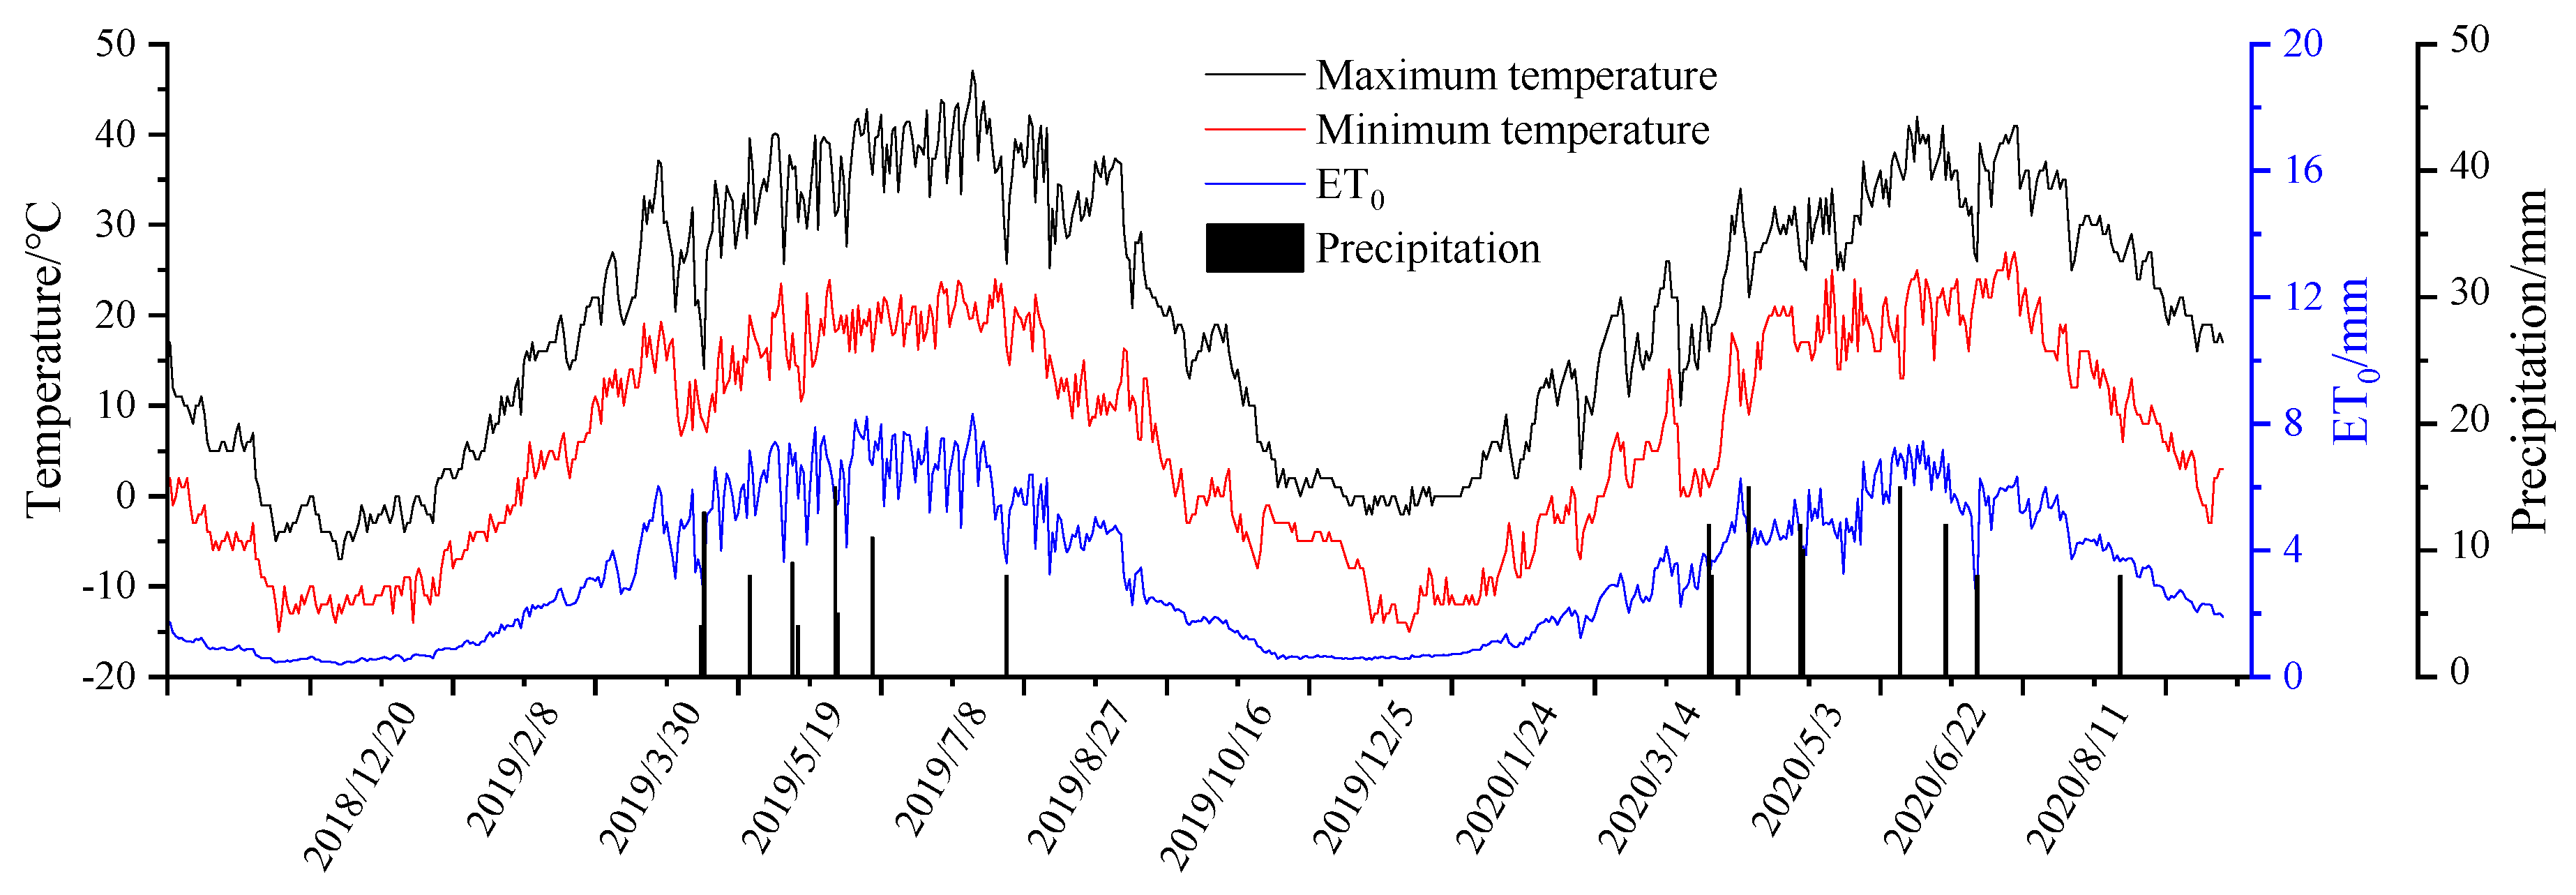
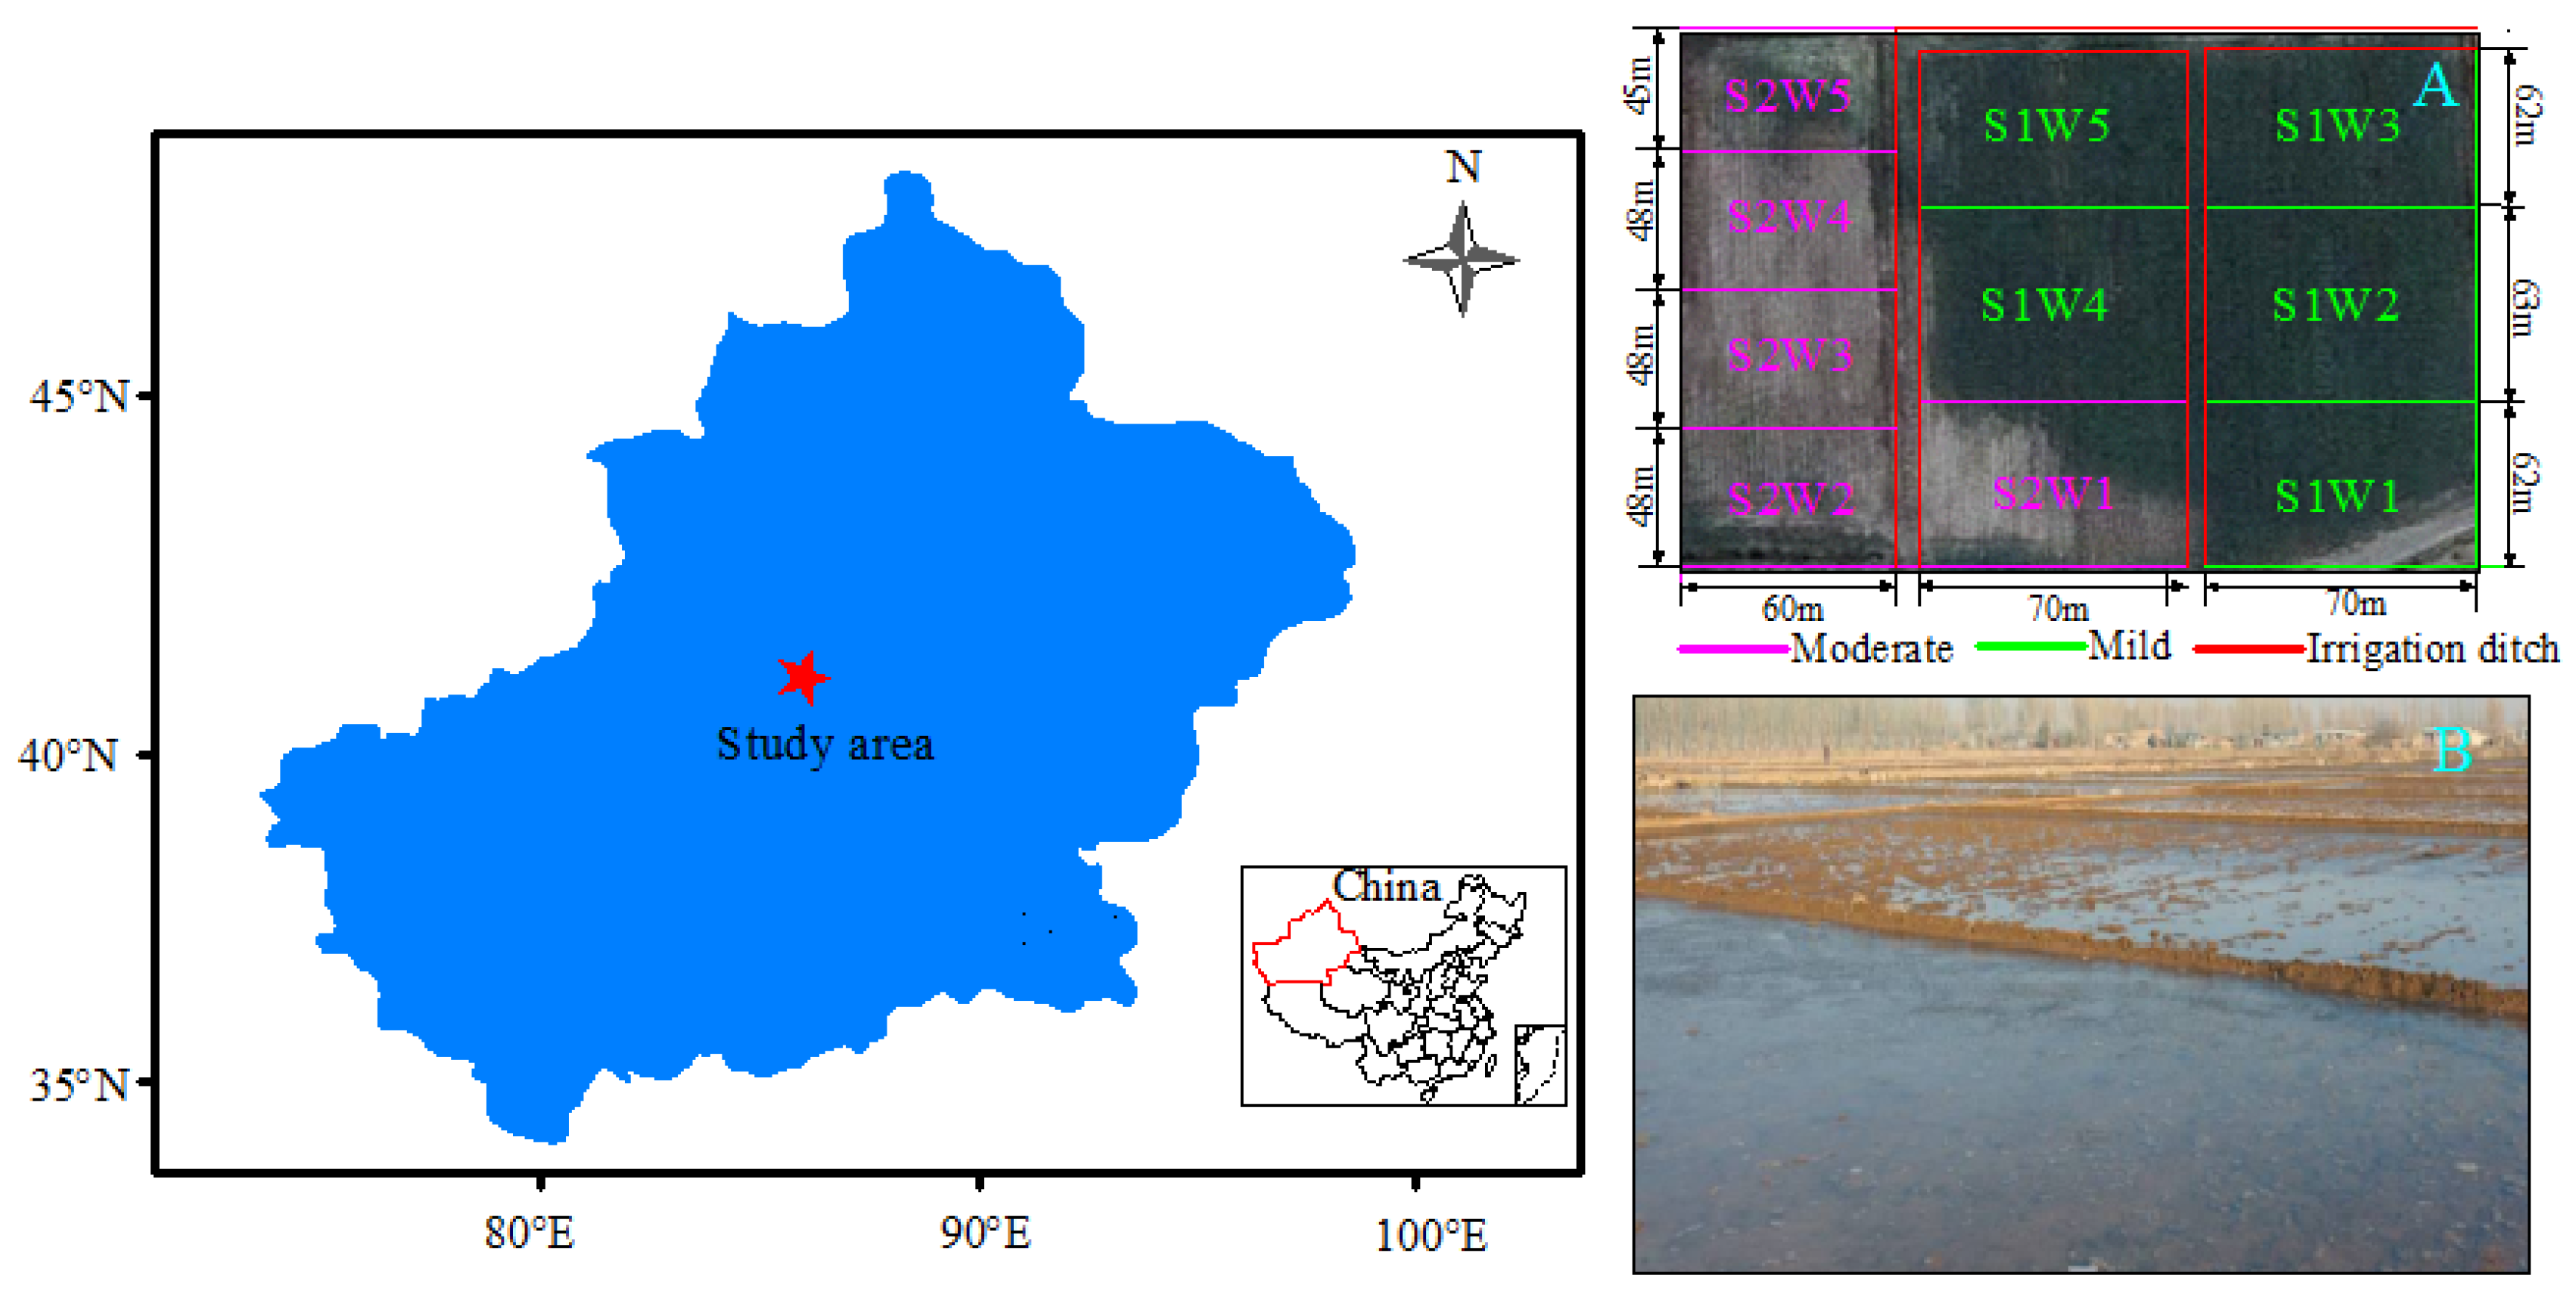
2.1. Experimental Site

The experiment was conducted from November 2018 to October 2020 at Puhui Farm (85°52′ E, 41°25′ N, altitude 880 m) in Korla, Xinjiang, China. The site is located on the Northeast edge of the Tarim Basin at the southern foot of Tianshan Mountain, belonging to the alluvial plain of the Peacock River. The region is rich in light and heat resources with a mean annual sunshine duration of over 3000 h. The region has limited water resources, with an annual mean precipitation of 58.6 mm and an evaporation-precipitation ratio of about 40. In winter, the land surface is basically free of snow cover. The soil began to freeze in mid-to-late November and thaw in mid-to-early March of the coming year. The freeze lasts up to about 110 days, and the maximum freezing depth was 0.6~1 m. Flood irrigation is usually carried out in the middle of November. The depth of groundwater decreased from 1.2 m in the winter to 2 m in the spring. Temperature conditions were monitored by an automatic weather station (Zhongke Zhengqi (Beijing) Technology Co., Ltd., Beijing, China). The changes in temperature, precipitation and reference crop evapotranspiration (ET0) during the observation period are shown in Figure 1.

2.2. Experimental Design

The experimental fields have mild saline-alkali farmlands (S1) and moderate saline-alkali farmlands (S2) with a total area of 3.8 hm2, which have been cultivated for 22 years and 5 years, respectively. Soil texture is shown in Table 1. According to the irrigation water requirements of local farmland during the winter irrigation period [24]. Each type of farmland set has 5 irrigation levels (W1, 0 mm; W2, 150 mm; W3, 225 mm; W4, 300 mm; W5, 375 mm). Field division is shown in Figure 2. Winter irrigation times were conducted on 11 November 2018 and 17 November 2019. Winter irrigation water was taken from Peacock River with 1.21–1.94 g/L of total dissolved solids, which was transported to the field for flood irrigation through a ditch.
In the coming year, all treatment farmlands were applied with mulched drip irrigation technology to plant cotton in mid-to-early April. The cotton cultivar “Xinluzhong 66” was commonly planted in the local area with a planting density of 2.41 × 10⁵ plants/hm2. For all treatments, irrigation schedule and fertilization method control were the same both in 2018–2019 and 2019–2020, with a 475 mm irrigation amount during the growth period.

2.3. Data Collection and Measurement

2.3.1. Soil Sample and Measurement

Soil samples were taken in each plot with an auger (5 cm in diameter) before winter irrigation, after winter irrigation, freezing stage, initial thawing stage and late thawing stage, respectively. Three sets of repeats were made for the sampling points of different treatments, and corresponding marks were made, and the average value was taken as the test result. For each treatment, seven soil samples were taken within a depth of 0–100 cm (i.e., 0–5, 5–10, 10–20, 20–40, 40–60, 60–80 and 80–100 cm).
Each layer of soil sample was placed in an aluminum box to be air-dried to measure the soil moisture and then sieved through a 2 mm sieve The electrical conductivity (EC) of the soil solution, whose soil water weight ratio is 1:5, was measured by a DDS-11A conductivity meter (INESA Scientific Instrument Co., Ltd., Shanghai, China). The total dissolved salt was calculated from the measured EC, and the accuracy of the calculated salt content was improved by a regression equation. The relationship between soil salt content and EC was calibrated using the drying-residue method as follows:
S = 0.00005 E C 1 : 5 0.0194   ( R 2 = 0.9812 ,   n = 60 )
where S is soil salt content, g/kg; EC1:5 is electrical conductivity, μs/cm; n is the number of selected samples.
The formula for calculating the water storage in soil profiles is as follows:
W i j = 10 i = 1 n θ i j × H i × γ i
where W i j is water storage of the i-th layer in the j-th time node, mm; θ i j is soil water content of the i-th layer in the j-th time node, %; Hi is soil thickness in the i-th layer, cm; γi is soil bulk density in the i-th layer, g/cm3.
The formula for calculating the water flux is as follows:
WF = ( W i j - W i j 1 ) / N
where WF is water flux, mm/d; W i j and W i j 1 is water storage in the i-th layer in the j-th time and j−1-th time node, mm, respectively; N is the number of days between two observation points.
The formula for calculating the salt storage in soil profiles is as follows:
SS i j = ( i = 1 n S i j × H i × γ i ) / 1000
where SS i j is salt storage of the i-th layer in the j-th time node, g/cm2; S i j is soil salt content of the i-th layer in the j-th time node, g/kg.
The formula for calculating the salt flux is as follows:
SF = ( SS i j SS i j 1 ) / N
where SF is salt flux, g/(cm2·d); ( SS i j SS i j 1 ) is the difference of soil salt content in the i-th layer during the j-th period (between the j-th time node and the j−1-th time node), g/cm2.
The formula for calculating the change rate of soil salt during the two sampling periods is as follows:
RSC = ( S β - S α ) / S α × 100 %
where RSC is the changing rate of soil salt, %; Sα and Sβ, respectively, are the initial and final soil salt content, g/kg. A positive RSC indicates that desalinization has occurred and a negative RSC indicates that salt has accumulated.

2.3.2. Sprouting Rate and Survival Rate

After 30 days and 60 days of sowing, the sprouting rate and survival rate of cotton were investigated, respectively. The calculation formula is as follows:
η = n / N
ξ = m / n
where η is the sprouting rate of cotton, %; n is the sprout number per unit area, plant/m2; N is the planting number per unit area, plant/m2; ξ is the survival rate, %; m is the survival number per unit area, plant/m2.

2.3.3. Yield and WUE

All treatments were harvested in late September. To obtain seed cotton yield, 100 bolls were randomly selected for weighing during the boll opening period in each plot. The cotton yield and WUE were calculated as follows:
Y = 0.001 c × g × ρ × ξ × η
iWUE = Y / ( 10 × i )
IWUE = Y / ( 10 × I )
where Y is the cotton yield, kg/hm2; iWUE is water use efficiency of cotton during the growth period, kg/m3; IWUE is water use efficiency of cotton considering winter irrigation and growth period, kg/m3; c is the average number of bolls per plant; g is the average weight of single boll fiber, g; i is the irrigation amount in growth period, (mm); I is the sum of irrigation amounts in winter and growth period, (mm).

3. Results

3.1. Soil Moisture Distribution

Figure 3 describes the variation of soil moisture content at different depths from November to April next year in mild saline-alkali farmland and moderate saline-alkali farmland in 2018–2019 and 2019–2020, respectively.
Results showed that the soil moisture isopleth in treatments S1W1 and S2W1 were horizontally distributed, while those in other winter irrigation treatments were vertically distributed (Figure 3). After winter irrigation in November, the surface soil moisture presented an upward trend, and soil moisture under different treatments remained at a relatively high level in the 0–20 cm profile for both years. From December to February next year, the coldest period in winter, the ET0 was the lowest, with a value of 0.73 mm (Figure 1). The maximum soil moisture content layer became shallower with the increase in the amount of winter irrigation. Figure 3A,C showed that, in mild saline-alkali farmland, the position of the maximum soil moisture raised from 100 cm to 60 cm depth for S1W1 to S1W5 in both 2018–2019 and 2019–2020. In the meantime, in moderate saline-alkali farmland, the position of the maximum soil moisture rose from 80 cm to 40 cm depth and from 80 cm to 60 cm depth for S2W1 to S2W5 in 2018–2019 and 2019–2020, respectively (Figure 3B,D). Under the influence of temperature increases in March and April, soil moisture presented a downward trend.
Moreover, soil moisture content was higher in moderate saline-alkali farmland (6.1–34.61%) than that in mild saline-alkali farmland (5.38–30.89%) under the same winter irrigation amount. However, because the background soil moisture content was different among each treatment, in order to avoid interference from different background values among different treatments, we calculated the results of soil water flux, which can be considered indications of the water transfer rate and direction from different stages after winter irrigation. The results are shown in Figure 4.
In mild saline-alkali farmland (Figure 4A,C), from November to February next year in 2018–2019 and 2019–2020, water flux observed in the soil layer above 40 cm was negative, while it was about 0 mm/d in the soil layer below 40 cm for all treatments, indicating that the lower-layer soil moisture moved slowly after freezing but the upper-layer soil moisture still slightly moved upward due to the influence of temperature potential. However, the increase in irrigation could accelerate the thawing rate and thus supply some water to the lower-layer soil in the initial thawing stage (February to March). From February to March, it was observed that the water flux in the soil layer above 60–80 cm was negative, while that below 80 cm was positive, and the value increased with the increase in winter irrigation amount. From March to April (the late thawing stage), it was observed that the values of soil water flux in the 0–100 cm profile of all treatments were negative and decreased with the increase in winter irrigation amount, indicating that the soil is in a stable evaporation state in the late thawing stage, and the greater the winter irrigation amount, the more soil water evaporation. In the late thawing stage of 2018–2019, the average soil water flux in the 0–100 cm profile of treatments S1W1, S1W2, S1W3, S1W4 and S1W5 were −0.03, −0.27, −0.29, −0.35 and −0.37 mm/d, respectively, and the comparable values measured in 2019–2020 were −0.07, −0.51, −0.60, −0.62 and −0.69 mm/d, respectively.
The soil water flux distribution law in moderate saline-alkali farmland was the same as that in mild saline-alkali farmland during the freezing stage and the late thawing stage (Figure 4B,D). However, in the initial thawing stage, the soil water flux in treatment S2W5 presented positive in the soil layer below 10 cm, and the other treatments were basically negative in the soil layer above 60 cm and positive in the soil layer below 60 cm in both 2018–2019 and 2019–2020, demonstrating that the extensive winter irrigation amount will accelerate the thawing rate in moderate saline-alkali farmland.

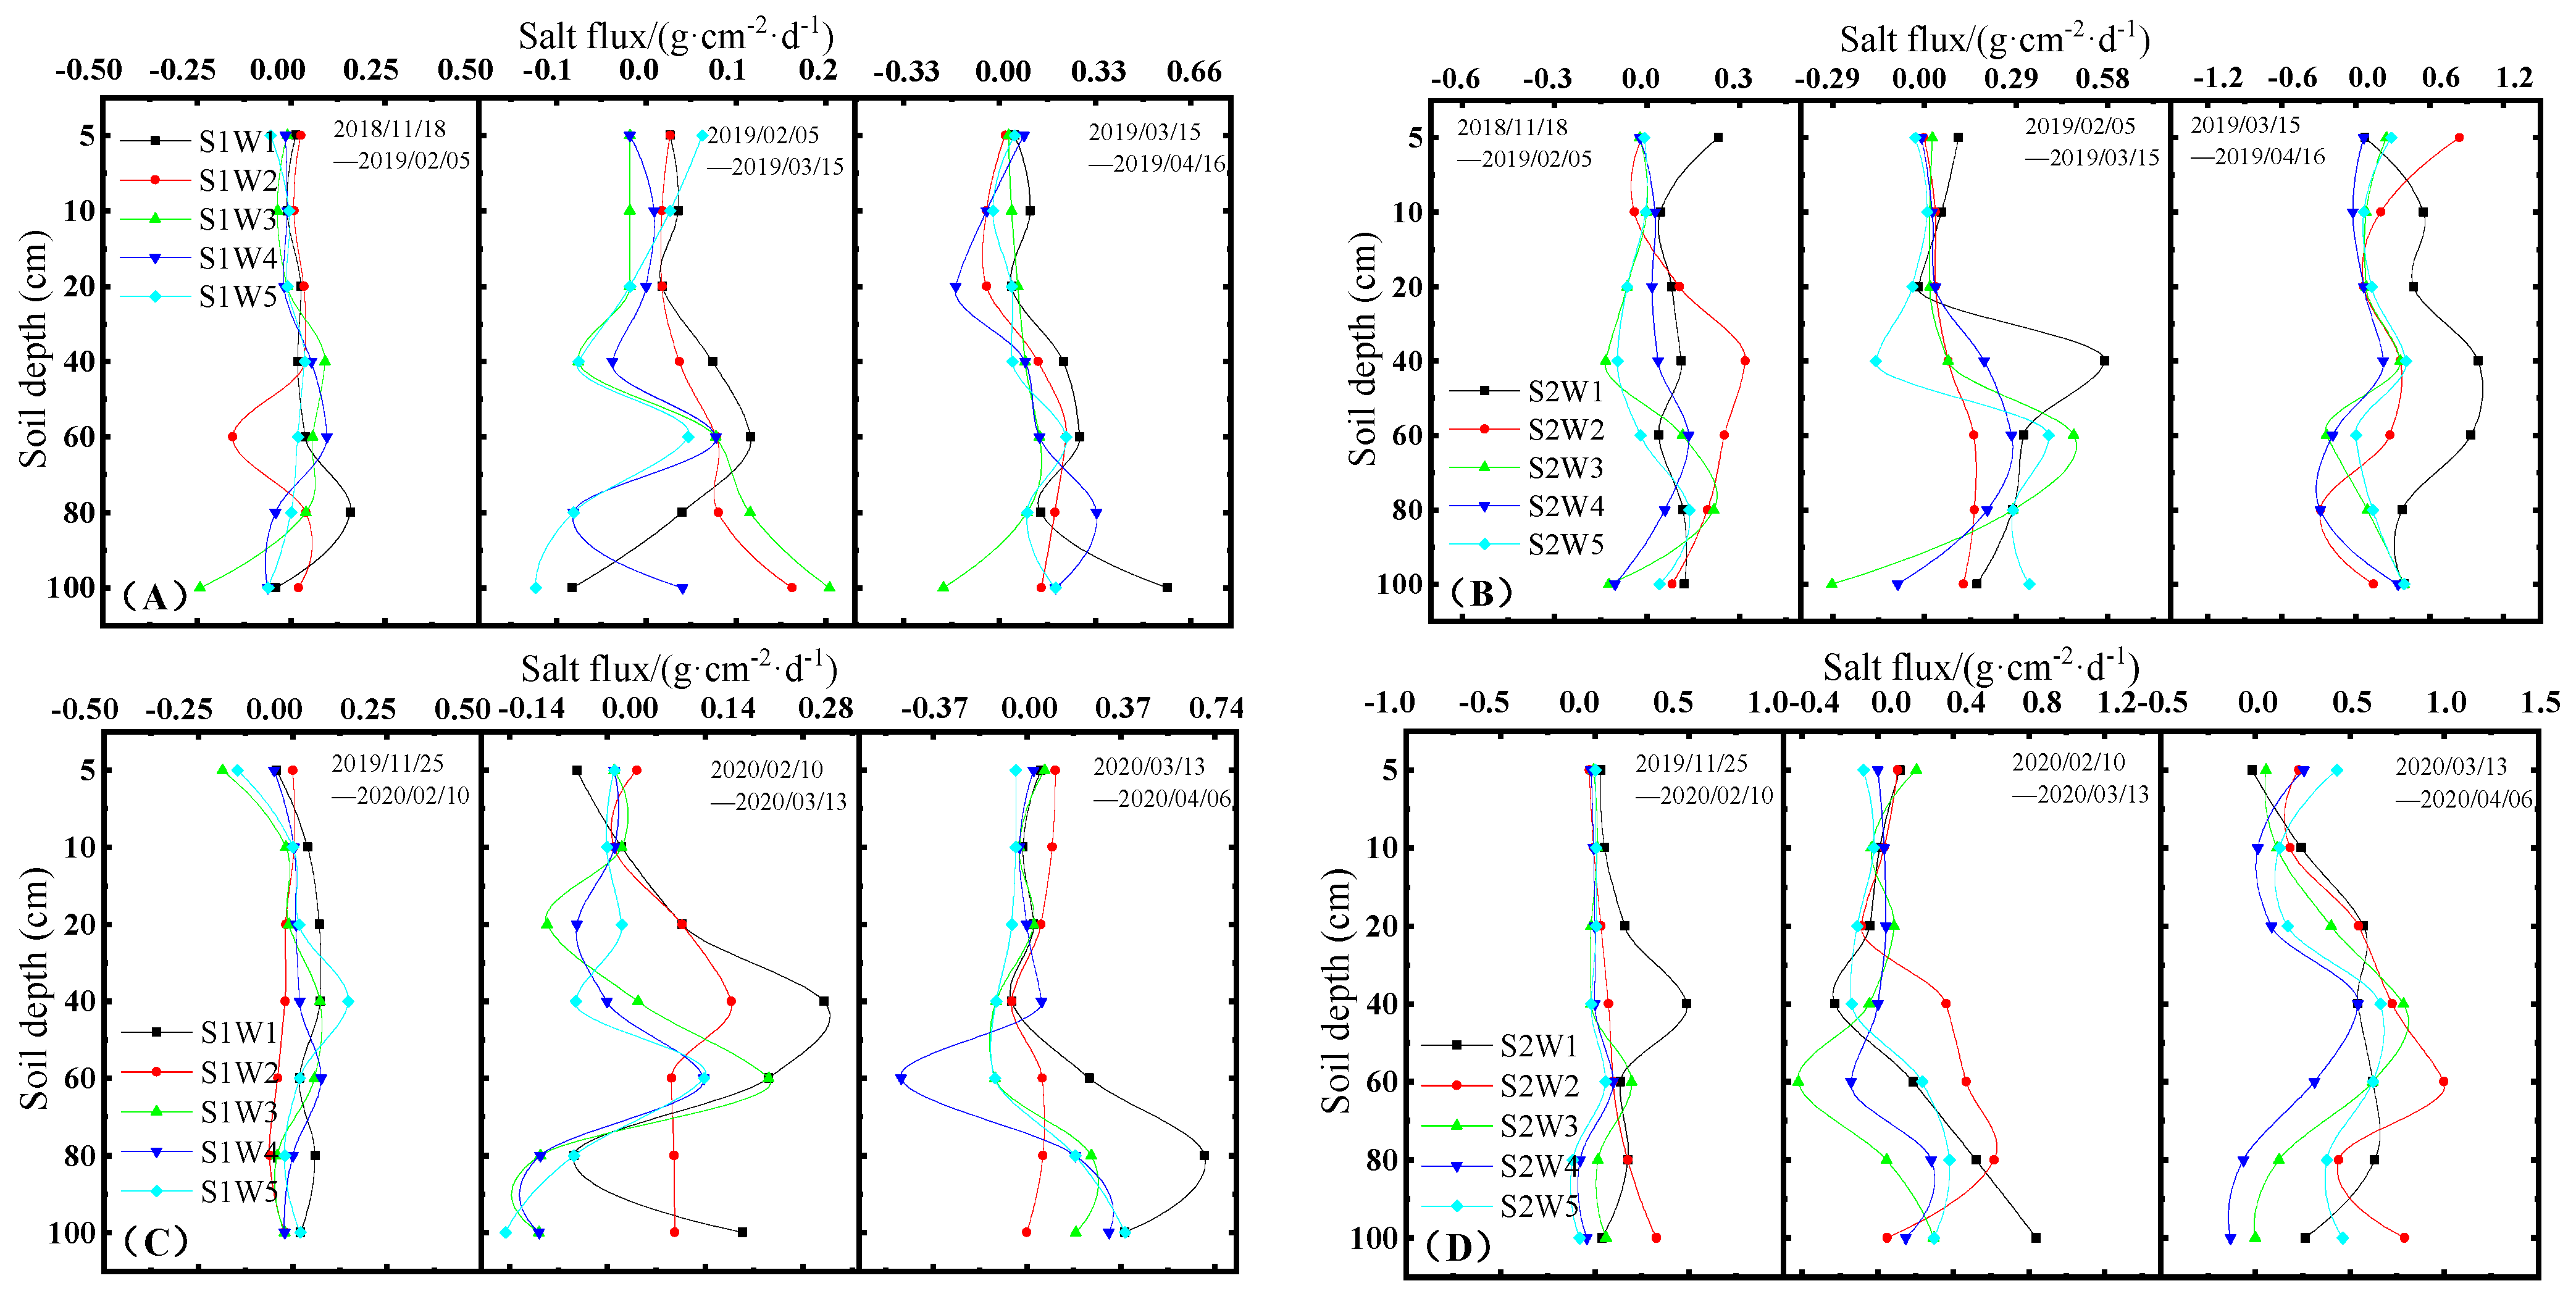
3.2. Soil Salinity Distribution

Figure 5 describes the variation of soil salt content at different depths from November to April next year in mild saline-alkali farmland and moderate saline-alkali farmland in 2018–2019 and 2019–2020, respectively.
The distribution pattern of soil salinity was less stable than that of soil moisture. Soil salinity in treatments S1W1 and S2W1 kept a high level in the 0–5 cm soil layer during the observed period for both years, while those in other treatments only showed slight surface salt accumulation at the beginning of winter or spring of the coming year. After winter irrigation in November, the majority of soil salinity accumulated in the deep layer, and the salt accumulation layer became shallower with the decrease in winter irrigation amount. It was observed that the soil salt content in the upper layer (0–40 cm) was maintained at a low value for all treatments but increased in the layers of 40–60 cm in S1W2, 60–80 cm in S1W3, 80–100 cm in S1W4 and below 100 cm in S1W5, and was also increased in 40–60 cm, 60–100 cm, 80–100 cm and 80–100 cm in treatments S2W2, S2W3, S2W4 and S2W5, respectively. Until March and April, the increase in temperature led to an increase in evaporation intensity, and the movement ability of soil salinity in frozen soil gradually recovered and moved to the upper part of the soil profile, which resulted in a slight increase in soil salinity. Moreover, soil salinity in the mild saline-alkali farmland was always lower than that in the moderate saline-alkali farmland under the same winter irrigation amount. The change rule of soil salt flux in the 0–100 cm profile is shown in Figure 6.
Soil salt was consolidated during the freezing period, which significantly reduced the salt movement. In mild saline-alkali farmland, it was observed that the soil salt flux in a 0–100 cm profile under different winter irrigation amounts from November to February next year was about 0.00 g/(cm2·d). However, soil salt flux showed a trend of decrease-increase-decrease with the increase of soil depth for both years during the initial thawing stage, and the salt flux in the 40–80 cm soil layer was positive and showed the most obvious increase, but the average soil salt flux in the 0–100 cm profile gradually decreased with the increase in winter irrigation amount. In the initial thawing stage of 2018–2019, the average soil salt flux in the 0–100 cm profile of treatments S1W1, S1W2, S1W3, S1W4 and S1W5 was 0.033, 0.060, 0.038, −0.001 and −0.023 g/(cm2·d), respectively; the corresponding values observed in 2019–2020 were 0.110, 0.089, 0.004, −0.010 and −0.010 g/(cm2·d), respectively, indicating that the soil layer of 40–80 cm exhibits soil salt accumulation in the initial thawing stage, while the salt accumulation rate in the 0–100 cm profile was decreased with the increase in winter irrigation amount. At the late thawing stage, the soil salt flux of all treatments was positive, and the soil salt flux of the soil layer below 60 cm was larger. In the late thawing stage of 2018–2019, the average soil salt flux in the 0–100 cm profile for treatments S1W1, S1W2, S1W3, S1W4 and S1W5 were 0.204, 0.091, 0.038, 0.093 and 0.091 g/(cm2·d), respectively; the corresponding values observed in 2019–2020 were 0.193, 0.048, 0.040 and 0.028 g/(cm2·d), respectively, indicating that there exists salt-return in the late thawing stage, and it has the most obvious effect on the soil salt movement for the layer of soil below 60 cm.
In moderate saline-alkali farmland, the soil salt flux in the 0–100 cm profile was the same as in mild saline-alkali farmland and was maintained at 0.00 g/(cm2·d) for all treatments during the freezing periods of 2018–2019 and 2019–2020. However, during the initial thawing stage, soil salt flux increased first and then decreased with the increase of soil depth in both 2018–2019 and 2019–2020, and the soil salt flux of the 60–100 cm soil layer for treatment S2W5 was significantly higher than that in other treatments. In the late thawing stage, the soil salt flux significantly increased in the soil layer of 20–60 cm and decreased in the soil layer below 60 cm. Moreover, the average soil salt flux in the 0–100 cm profile decreased at first and then increased with the increase in winter irrigation amount in the late thawing stage. In 2018–2019, the average soil salt flux in the 0–100 cm profile of the treatments S2W1, S2W2, S2W3, S2W4 and S2W5 was 0.544, 0.231, 0.148 and 0.204 g/(cm2·d), respectively; the corresponding values observed in 2019–2020 were 0.410, 0.560, 0.302, 0.146 and 0.409 g/(cm2·d), respectively.

3.3. Change Rate of Soil Salt (RSC)

The soil salinity measured before winter irrigation and during the late thawing stage was seen as the initial soil salinity and the final soil salinity, respectively. The distribution of RSC in mild saline-alkali farmland and moderate saline-alkali farmland under different winter irrigation amounts was calculated, and the results are shown in Figure 7.
In mild saline-alkali farmland, increasing winter irrigation amount can effectively promote soil desalination in 0–40 cm and 0–100 cm depth, and the desalination effect of winter irrigation in the 0–40 cm soil layer was better than that in the 0–100 cm soil layer. In 2018–2019, the RSC of treatments S1W2, S1W3, S1W4 and S1W5 was 29.21%, 33.99%, 32.96% and 34.44% lower than that of treatment S1W1 in the 0–40 cm soil layer, and the corresponding values in the 0–100 cm profile were 10.33%, 21.48%, 24.91% and 33.23% lower, respectively. The above phenomenon was also observed in 2019–2020. However, in moderate saline-alkali farmland, both the treatment of S2W4 and S2W5 can cause the highest desalination rate in the 0–40 cm and the 0–100 cm soil layer. From 2018 to 2020, the average RSC in the 0–40 cm soil layer of treatments S2W2, S2W3, S2W4 and S2W5 was 7.03%, −1.49%, −12.40% and −11.75%, respectively, and the corresponding values in the 0–100 cm soil layer were 21.67%, −2.55%, −10.01% and −9.88%, respectively. Table 2 shows the change rate of soil salt storage content in the 0–100 cm profile from 2018 to 2020.
Winter irrigation can effectively leach soil salt. For irrigation amounts of 150 mm to 375 mm, the change rate of soil salt in mild saline-alkali farmland decreased from −2.50% to −15.38% in the 0–100 cm profile, and that value in moderate saline-alkali farmland decreased from 12.22% to −16.85%, which was in line with the result of Liu et al. [25].

3.4. Cotton Growth Indexes and Yield

Table 3 shows the sprouting rate and survival rate of cotton in 2019 and 2020. Under the same winter irrigation amount, the sprouting rate and survival rate in mild saline-alkali farmland were always higher than those in moderate saline-alkali farmland in both 2019 and 2020. In mild saline-alkali farmland, S1W3, S1W4 and S1W5 showed a significant increase in sprouting rate in comparison with S1W1 and S1W2. The average sprouting rate of S1W3, S1W4 and S1W5 was 30.36% higher than that of S1W1 and S1W2 in 2019 and 32.90% higher in 2020. No differences were observed for survival rate in mild saline-alkali farmland, and the average value was 95.94% and 96.12% in 2019 and 2020, respectively. However, in moderate saline-alkali farmland, there was a significant effect of the winter irrigation amount on sprouting rate and survival rate. Both the sprouting rate and survival rate observed in 2020 were significantly higher than those in 2019, and the average sprouting rate and survival rate increased by 2.34% and 5.34%, respectively. In addition, the sprouting rate of W5 treatment was lower than that of W4 treatment in both 2019 and 2020, and this phenomenon occurred in both mild saline-alkaline farmland and moderate saline-alkaline farmland, indicating that excessive winter irrigation may have a negative effect on the sprouting rate in the coming year.
The morphological index and yield of cotton in 2019 and 2020 are shown in Table 4. In mild saline-alkali farmland, treatments S1W3, S1W4 and S1W5 showed a significant increase in plant height and boll number in comparison with S1W1 and S1W2. Cotton yield in treatment S1W4 was the highest, and the yield among S1W3, S1W4 and S1W5 had no difference. In moderate saline-alkali farmland, treatments S2W4 and S2W5 showed a significant increase in plant height and boll number in comparison with S2W1, S2W2 and S2W3, and the treatment of S2W4 showed the highest cotton yield in both 2019 and 2020.
Moreover, plant height, boll number and cotton yield in mild saline-alkali farmland were always higher than those in moderate saline-alkali farmland under the same winter irrigation amount in both 2019 and 2020. No significant differences were found in the plant height, boll number or cotton yield in mild saline-alkali farmland in 2019 and 2020, but in moderate saline-alkali farmland, compared with those in 2019, the cotton yield increased by 10.66%, 9.84%, 16.04% and 8.26% under the treatment of S2W2, S2W3, S2W4 and S2W5 in 2020.

3.5. Water Use Efficiency (WUE or iWUE and IWUE)

The iWUE and IWUE of cotton are presented in Table 5. Both the iWUE and IWUE in mild saline-alkali farmland were higher than those in moderate saline-alkali farmland under the same winter irrigation amount in 2018–2019 and 2019–2020.
In mild saline-alkali farmland, treatments S1W3, S1W4 and S1W5 showed a significant increase in iWUE in comparison with S1W1 and S1W2. There was a significant difference among the treatments of IWUE, and the treatment S1W3 showed the highest value in both 2018–2019 and 2019–2020. In addition, under the same winter irrigation amount, iWUE and IWUE in 2019–2020 had no significant changes compared with 2018–2019.
In moderate saline-alkali farmland, the WUE of winter irrigation treatment was higher than that of no winter irrigation treatment, and it was first increased and then decreased with the increase in winter irrigation amount. Compared with 2018–2019, WUE in 2019–2020 of treatment S2W1 decreased by 3.45%, while treatments S2W2, S2W3, S2W4 and S2W5 increased by 10.66%, 9.84%, 16.04% and 8.26%, respectively. The treatment S2W4 showed the highest iWUE and IWUE in both 2018–2019 and 2019–2020.

4. Discussion

This paper describes the effect of winter irrigation amount on soil water-salt distribution, cotton growth, yield and WUE in different saline-alkali farmlands. As in other studies, the winter irrigation amount was correlated with the salinization degree of farmland, and the soil water-salt distribution, cotton growth, yield and WUE changed with the irrigation amount [26]. Furthermore, the total irrigation amount affects the salt storage content change rate, iWUE and IWUE over the whole observed period.
After winter irrigation, soil moisture changes from liquid to solid under the influence of temperature. At low temperatures, evaporation intensity decreases and surface soil condenses, thus reducing the water loss of surface soil. Meanwhile, the temperature difference between surface soil and subsoil increases, thus forming a temperature potential and pulling the moisture of the subsoil upward [27]. Hence, the surface soil moisture showed an upward trend after winter irrigation in November (Figure 3).
The soil froze from December to February next year, and the maximum soil moisture content layer became shallower with the increase in winter irrigation amount and the salinity of the soil during the freezing period (Figure 3). That is related to the pulling effect of temperature potential on soil moisture [28]. The decreasing temperature decreases the matrix suction of soil, increases the water viscosity, slows down the soil water flux, and gradually transforms liquid water into solid. However, the soil ice content is proportional to the soil moisture during the freezing period, and the increase in ice content will reduce the migration space of water in the soil and reduce the migration capacity [29]. Hence, with the increase in winter irrigation, the maximum moisture content layer in the soil becomes shallower. In addition, the increase in soil salt content can increase the solution concentration and reduce the migration capacity of soil water [30,31]. Therefore, under the same amount of winter irrigation, the maximum soil moisture layer in moderate saline-alkali farmland is shallower than that in mild saline-alkali farmland. In winter irrigation treatments, the vertical distribution of soil moisture isopleth under freeze-thaw conditions is due to the decrease of surface evaporation capacity and soil matrix suction, turning the temperature potential and gravity potential into the dominant driving forces of water movement.
Moreover, during the freezing period, we observed that the soil salt flux in the 0–100 cm profile was about 0 g/(cm2·d) for different irrigation treatments. It is because the decrease in soil temperature leads to a decrease in the solubility of water to salt [32], as well as s decrease in the carrying capacity of water to salt. However, soil salinity significantly increased at the late thawing stage, which is due to the increase in temperature and evaporation intensity in March and April. Some of the soil water recoverd the dissolving capacity of water to salt [33] and could carry some salt to the upper part, which made the soil salt content slightly higher. As a result, salt return occurs in all treatments in the spring.
Increasing the irrigation amount can increase the leaching depth of soil salt by irrigation water. Although the evaporation of soil water increases with the increase in irrigation amount, the soil salt return rate decreases with the increase in irrigation amount due to the increase in salinity of the ascending path. Zikalala P pointed out that the degree of soil salinization is one of the factors affecting the distribution of soil water and salt under winter irrigation [34,35], and Ponnamperuma (1984) reported that the severe salinization soil has a slower drainage rate and a longer submergence period than that in mild salinization soil [36]. In our research, the salt return rate in treatment S2W5 was higher than that in treatment S2W4, but lower than that in treatment S2W2 and treatment S2W3, which may be due to the drainage difficulty in soil water caused by the severe soil salinization [37,38], enhancing the connection between soil water and groundwater under S2W5 treatment. The continuous evaporation of soil water resulted in more serious soil salinization in April. This is basically consistent with the conclusion drawn by Li et al. that excessive winter irrigation may aggravate soil salinization [22,39,40].
In semi-arid regions, soil water-salt content is a key factor affecting crop growth and productivity [41,42]. Different irrigation levels and soil salinization degrees have important effects on improving the sprouting rate and survival rate of cotton [43]. In our experiments, the effect of winter irrigation amount and soil salinization degree on cotton sprouting rate was greater than that on survival rate. These results are consistent with those of Zhang et al. and Dong et al., who found that the cotton in the seedling stage is more sensitive to salt and is more easily killed by salt [12,14]. Moreover, Li et al. [44] illustrated that excessive soil moisture at high salinity will reduce the sprouting rate of cotton. In our research, both the S2W4 and S2W5 treatments were able to achieve a high desalination rate in the 0–40 cm and 0–100 cm profiles. However, cotton requires a certain soil temperature to germinate [45]. The increase in winter irrigation causes an increase in soil moisture before sowing, which leads to a slower rise in soil temperature in spring and thus affects the emergence of cotton, so that the sprouting rate of cotton treated with S2W5 was lower than that with S2W4.
Zhang et al. [25,46] investigated the effect of different winter irrigation amounts on desalination in mild saline-alkali farmland and recommended the irrigation amount of 315–360 mm to achieve the best desalination effect. Li et al. [26] studied the reasonable spring irrigation amount in farmland with different degrees of salinization and proposed that with the increase in salinization degree, the irrigation amount should be increased accordingly. They also suggested that the reasonable irrigation amount in mild, moderate and severe saline-alkaline land should be 300 mm, 370 mm and 450 mm, respectively. In our research, from the perspective of salt leaching and WUE, the feasible winter irrigation amount in mild saline-alkali farmland and moderate saline-alkali farmland is 225 mm and 300 mm, respectively.
According to the research result, there is no yield difference in mild saline-alkali farmland in 2019 and 2020 under the same winter irrigation amount (Table 4). Traditionally, the impact of irrigation water on RSC should be taken into account when determining the amount of irrigation water in winter [18,47,48]. In this study, both S1W4 and S1W5 can achieve a good leaching effect on the 0–100 cm profile, but the effect of treatment S1W3 on the salinity in the 0–40 cm profile was the same as that of treatment S1W4 and S1W5, and the soil salt content in the 0–100 cm profile of treatment S1W3 decreased by 10% after two years of winter irrigation (Table 2). However, in terms of the total amount of irrigation, the treatment of S1W3 can achieve the highest IWUE (Table 5). In addition, the yield of five treatments in moderate saline-alkali farmland was relatively low in 2019 due to the high salt concentration in the initial soil. Conversely, in 2020, all treatments had significant increases in sprouting rate, survival rate, plant height, iWUE and IWUE except for S2W1, and treatment S2W4 had the lowest RSC and the highest iWUE and IWUE in both 2018–2019 and 2019–2020 (Table 5). Therefore, in order to save agricultural water in Southern Xinjiang, China, the feasible winter irrigation amount for mild saline-alkali farmland and moderate saline-alkali farmland is 225 mm and 300 mm, respectively.

5. Conclusions

(1)
In the winter irrigation period, soil moisture can move slowly, but soil salt is basically not transported, and the maximum moisture content layer in the soil becomes shallower with the increase in the winter irrigation amount and the salinity of the soil. The salt return process mainly occurs during the late thawing period.
(2)
Winter irrigation can effectively leach soil salt, but excessive winter irrigation has little effect on desalination in mild saline-alkali farmland. With the decrease in winter irrigation, the salt accumulation layer becomes shallower.
(3)
Compared with non-winter irrigation, the WUE under winter irrigation is increased, but it is first increased and then decreased with the increase in winter irrigation amount, and the excessive winter irrigation may have a negative effect on the sprouting rate next year.
(4)
For the mild saline-alkali farmland and moderate saline-alkali farmland of an arid area, from the perspective of soil salt leaching, soil moisture distribution, cotton growth, yield and WUE, the sustainable winter irrigation amount is 225 mm and 300 mm, respectively.

Author Contributions

Methodology, W.C. and M.L.; Software, Q.L.; Data curation, W.C. and Q.L.; Writing—original draft, W.C.; Writing—review & editing, W.C. and M.L.; Funding acquisition, W.C. All authors have read and agreed to the published version of the manuscript.

Funding

This research was funded by the National Natural Science Foundation of China (grant number 51790533) and the High-level Talent Project of Shihezi University (grant number RCZK2021B05). The authors gratefully thank the field staff of the experimental farm.

Conflicts of Interest

The authors declare no conflict of interest.

References

  1. Foley, J.A.; Ramankutty, N.; Brauman, K.A.; Cassidy, E.S.; Gerber, J.S.; Johnston, M.; Mueller, N.D.; O’Connell, C.; Ray, D.K.; West, P.C.; et al. Solutions for a cultivated planet. Nature 2011, 478, 337–342. [Google Scholar] [CrossRef] [PubMed]
  2. Zhang, M.; Wang, F.; Zhang, G. Problems of agricultural water use in China and the strategies for saving water. Trans. Chin. Soc. Agric. Eng. 2005, 21, 6. [Google Scholar]
  3. Rao, S.S.; Tanwar, S.P.S.; Regar, P.L. Effect of deficit irrigation, phosphorous inoculation and cycocel spray on root growth, seed cotton yield and water productivity of drip irrigated cotton in arid environment. Agric. Water Manag. 2016, 169, 14–25. [Google Scholar] [CrossRef]
  4. Yang, G.; Li, F.D.; Tian, L.J.; He, X.L.; Gao, Y.L.; Wang, Z.L.; Ren, F.T. Soil physicochemical properties and cotton (Gossypium hirsutum L.) yield under brackish water mulched drip irrigation. Soil Tillage Res. 2020, 199, 104592. [Google Scholar] [CrossRef]
  5. Li, X.; Jin, M.; Huang, J.; Yuan, J. The soil-water flow system beneath a cotton field in arid north-west China, serviced by mulched drip irrigation using brackish water. Hydrogeol. J. 2015, 23, 35–46. [Google Scholar] [CrossRef]
  6. Li, T.; Zhang, J.F.; Xiong, S.Y.; Zhang, R.X. The spatial variability of soil water content in the potato field before and after spray irrigation in arid northwestern China. Water Sci. Technol.-Water Supply 2020, 20, 860–870. [Google Scholar] [CrossRef]
  7. Li, B.; Shi, B.J.; Yao, Z.Z.; Shukla, M.K.; Du, T.S. Energy partitioning and microclimate of solar greenhouse under drip and furrow irrigation systems. Agric. Water Manag. 2020, 234, 106096. [Google Scholar] [CrossRef]
  8. Wang, Y.H.; Li, S.; Qin, S.J.; Guo, H.; Yang, D.N.; Lam, H.M. How can drip irrigation save water and reduce evapotranspiration compared to border irrigation in arid regions in northwest China. Agric. Water Manag. 2020, 239, 106256. [Google Scholar] [CrossRef]
  9. Wang, Z.H.; Wu, Q.; Fan, B.H.; Zheng, X.R.; Zhang, J.Z.; Li, W.H.; Guo, L. Effects of mulching biodegradable films under drip irrigation on soil hydrothermal conditions and cotton (Gossypium hirsutum L.) yield. Agric. Water Manag. 2019, 213, 477–485. [Google Scholar] [CrossRef]
  10. Chen, W.; Hou, Z.; Wu, L.; Liang, Y.; Wei, C. Evaluating salinity distribution in soil irrigated with saline water in arid regions of northwest China. Agric. Water Manag. 2010, 97, 2001–2008. [Google Scholar] [CrossRef]
  11. He, W.S.; Liu, Y.C.; He, J.Y. Relationships between soluble salt content and electrical conductivity for different types of salt-affected soils in Ningxia. Agric. Res. Arid. Areas 2010, 28, 111–116. [Google Scholar]
  12. Zhang, Y.; Wang, L.H.; Sun, S.M.; Chen, X.L.; Liang, Y.J.; Hu, S.J. Indexes of salt tolerance of cotton in Akesu river irrigation district. Sci. Agric. Sin. 2011, 44, 2051–2059. [Google Scholar]
  13. Liu, M.X.; Yang, J.S.; Li, X.M.; Liu, G.M.; Yu, M.; Wang, J. Distribution and dynamics of soil water and salt under different drip irrigation regimes in northwest China. Irrig. Sci. 2013, 31, 675–688. [Google Scholar] [CrossRef]
  14. Dong, H.Z.; Li, W.J.; Tang, W.; Zhang, D.M. Early plastic mulching increases stand establishment and lint yield of cotton in saline fields. Field Crops Res. 2009, 111, 269–275. [Google Scholar] [CrossRef]
  15. Wang, Z.M.; Jin, M.G.; Simunek, J.; van Genuchten, M.T. Evaluation of mulched drip irrigation for cotton in arid Northwest China. Irrig. Sci. 2014, 32, 15–27. [Google Scholar] [CrossRef]
  16. Chen, X.P.; Qi, Z.M.; Gui, D.W.; Sima, M.W.; Zeng, F.J.; Li, L.H.; Li, X.Y.; Gu, Z. Evaluation of a new irrigation decision support system in improving cotton yield and water productivity in an arid climate. Agric. Water Manag. 2020, 234, 106139. [Google Scholar] [CrossRef]
  17. Zhang, H.Z.; Khan, A.; Tan DK, Y.; Luo, H.H. Rational water and nitrogen management improves root growth, increases yield and maintains water use efficiency of cotton under mulch drip irrigation. Front. Plant Sci. 2017, 8, 912. [Google Scholar] [CrossRef] [PubMed]
  18. Li, X.X.; Liu, H.G.; He, X.L.; Gong, P.; Lin, E. Water-Nitrogen coupling and multi-objective optimization of cotton under mulched drip irrigation in arid Northwest China. Agronomy 2019, 9, 894. [Google Scholar] [CrossRef]
  19. Wang, H.D.; Wu, L.F.; Cheng, M.H.; Fan, J.L.; Zhang, F.C.; Zou, Y.F.; Chau, H.W.; Gao, Z.J.; Wang, X.K. Coupling effects of water and fertilizer on yield, water and fertilizer use efficiency of drip-fertigated cotton in northern Xinjiang, China. Field Crops Res. 2018, 219, 169–179. [Google Scholar] [CrossRef]
  20. Chen, Z.K.; Niu, Y.P.; Zhao, R.H.; Han, C.L.; Han, H.Y.; Luo, H.H. The combination of limited irrigation and high plant density optimizes canopy structure and improves the water use efficiency of cotton. Agric. Water Manag. 2019, 218, 139–148. [Google Scholar] [CrossRef]
  21. Yang, P.N.; Zia-Khan, S.; Wei, G.H.; Zhong, R.S.; Aguila, M. Winter irrigation effects in cotton fields in arid inland irrigated areas in the North of the Tarim Basin, China. Water 2016, 8, 47. [Google Scholar] [CrossRef]
  22. Li, X.W.; Jin, M.G.; Yuan, J.J.; Huang, J.O. Evaluation of soil salts leaching in cotton field after mulched drip irrigation with brackish water by freshwater flooding. J. Hydraul. Eng. 2014, 45, 1091–1098. [Google Scholar]
  23. Fan, W.; Zhou, J.L.; Zhou, Y.H.; Zeng, Y.Y.; Chen, Y.F.; Sun, Y. Water quality and health risk assessment of shallow groundwater in the southern margin of the Tarim Basin in Xinjiang, P.R. China. Hum. Ecol. Risk Assess. 2020, 5, 483–503. [Google Scholar]
  24. Liu, H.R.; Feng, J.P.; Liu, H.G. Effect of periodic winter irrigation on salinity and economic benefit of cotton field under mulched drip irrigation in Xinjiang. J. Arid. Land Resour. Environ. 2022, 36, 194–201. [Google Scholar]
  25. Liu, Z.P.; Jiao, X.Y.; Lu, S.H.; Zhu, C.L.; Zhai, Y.M.; Guo, W.H. Effects of winter irrigation on soil salinity and jujube growth in arid regions. PLoS ONE 2019, 14, e0218622. [Google Scholar] [CrossRef] [PubMed]
  26. Li, W.J.; Hudan, T.; Yang, P.N.; Li, H.; Zhu, D.Q.; Zhao, Y.C. Influence of different spring irrigation scheduling on moisture and salinity change rules in cotton field with different salinity. Water Sav. Irrig. 2014, 4, 7–10. [Google Scholar]
  27. Fu, Q.; Hou, R.; Li, T.; Ma, Z.; Peng, L. Soil moisture-heat transfer and its action mechanism of freezing and thawing soil. Trans. Chin. Soc. Agric. Mach. 2016, 47, 99–110. [Google Scholar]
  28. Jame, Y.W.; Norum, D.I. Heat and mass transfer in a freezing unsaturated porous medium. Water Resour. Res. 1980, 16, 811–819. [Google Scholar] [CrossRef]
  29. Zhang, D.; Wang, S.J. Mechanism of freeze-thaw action in the process of soil salinization in northeast China. Environ. Geol. 2001, 41, 96–100. [Google Scholar] [CrossRef]
  30. Bing, H.; He, P.; Zhang, Y. Cyclic freeze–thaw as a mechanism for water and salt migration in soil. Environ. Earth Sci. 2015, 74, 675–681. [Google Scholar] [CrossRef]
  31. Padilla, F.; Villeneuve, J.P. Modeling and experimental studies of frost heave including solute effects. Cold Reg. Sci. Technol. 1992, 20, 183–194. [Google Scholar] [CrossRef]
  32. Jin, Z.F.; Hudan, T.; Mu, H.C.; Jiang, M.; Li, W.J. Soil water and salt migration in cotton field under soil freezing-thawing temperature. Arid. Zone Res. 2013, 30, 623–627. [Google Scholar]
  33. Perfect, E.; Williams, P.J. Thermally induced water migration in frozen soils. Cold Reg. Sci. Technol. 1980, 3, 101–109. [Google Scholar] [CrossRef]
  34. Zikalala, P.; Kisekka, I.; Grismer, M. Calibration and global sensitivity analysis for a salinity model used in evaluating fields irrigated with treated wastewater in the Salinas valley. Agriculture 2019, 9, 31. [Google Scholar] [CrossRef]
  35. Hanson, B.R.; Grattan, S.R.; Fulton, A. Agricultural Salinity and Drainage; University of California: Davis, CA, USA, 2006; Volume 3375. [Google Scholar]
  36. Ponnamperuma, F.N. Effects of Flooding on Soils; Academic Press: New York, NY, USA, 1984. [Google Scholar]
  37. Du, L.; Zheng, Z.C.; Li, T.X.; Li, W. Effects of water and salt transport in different level of secondary salinization of soil under greenhouse irrigation. J. Soil Water Conserv. 2014, 27, 183–189. [Google Scholar]
  38. Peng, Z.Y.; Huang, J.S.; Wu, J.W.; Abudu, A. Salt movement of seasonal freezing-thawing soil under autumn irrigation condition. Trans. Chin. Soc. Agric. Eng. 2012, 28, 77–81. [Google Scholar]
  39. Hou, R.; Li, T.; Fu, Q.; Liu, D.; Li, M.; Zhou, Z.; Li, L.; Yan, J. Characteristics of water–heat variation and the transfer relationship in sandy loam under different conditions. Geoderma 2019, 340, 259–268. [Google Scholar] [CrossRef]
  40. Zhang, Z.; Zhang, F.; Ma, F.; Chai, X.; Zhang, S. Spatiotemporal changes in soil salinity in a drip-irrigated field. Geoderma 2009, 149, 243–248. [Google Scholar] [CrossRef]
  41. Leib, B.G.; Caspari, H.W.; Redulla, C.A.; Andrews, P.K.; Jabro, J.J. Partial rootzone drying and deficit irrigation of ‘Fuji’ apples in a semi-arid climate. Irrig. Sci. 2006, 24, 85–99. [Google Scholar] [CrossRef]
  42. Gowing, J.W.; Rose, D.A.; Ghamarnia, H. The effect of salinity on water productivity of wheat under deficit irrigation above shallow groundwater. Agric. Water Manag. 2009, 96, 517–524. [Google Scholar] [CrossRef]
  43. Aslam, M.; Maqbool, M.A.; Zaman, Q.U.; Shahid, M.; Saeed, A. Full length article comparison of different tolerance indices and PCA biplot analysis for assessment of salinity tolerance in Lentil (Lens culinaris) genotypes. Int. J. Agric. Biol. 2017, 19, 470–478. [Google Scholar] [CrossRef]
  44. Li, K.J.; Ma, J.Y.; Cao, C.Y.; Zheng, C.L.; Niu, Y.J. Effect of irrigation water salt content on cotton growth and yield. Chin. J. Eco-Agric. 2011, 19, 312–317. [Google Scholar] [CrossRef]
  45. Lou, S.W.; Tuoheti, A.; Sidikejiang, A.; Ma, T.F.; Bian, Y.; Paerhti, M.; Zhang, P.Z. Soil temperature at seedling stage:effect on early growth process of cotton. Chin. Agric. Sci. Bull. 2018, 34, 13–16. [Google Scholar]
  46. Zhang, H.; Yang, P.; Wang, C. Effect of winter irrigation amount on soil moisture and salt distribution in arid area. J. Irrig. Drain. 2016, 35, 42–46. [Google Scholar]
  47. Fan, J.C.; Lu, X.J.; Gu, S.H.; Guo, X.Y. Improving nutrient and water use efficiencies using water-drip irrigation and fertilization technology in Northeast China. Agric. Water Manag. 2020, 241, 106352. [Google Scholar] [CrossRef]
  48. Liang, J.P.; He, Z.J.; Shi, W.J. Cotton/mung bean intercropping improves crop productivity, water use efficiency, nitrogen uptake, and economic benefits in the arid area of Northwest China. Agric. Water Manag. 2020, 240, 106277. [Google Scholar] [CrossRef]
Figure 1. The changes in temperature, precipitation and ET0 during the observed period.
Sustainability 15 15428 g001
Figure 2. The experimental location. (A) Field division; (B) Winter irrigation farmland.
Sustainability 15 15428 g002
Figure 3. Soil moisture content distribution in different saline-alkali farmland (Unit: %). S1 represents mild saline-alkali farmland ((A) in 2018–2019, (C) in 2019–2020). S2 represents moderate saline-alkali farmland ((B) in 2018–2019, (D) in 2019–2020). W1, W2, W3, W4 and W5 represent winter irrigation amounts of 0, 150, 225, 300 and 375 mm, respectively. The color changes from blue to red, indicating a gradual increase in soil moisture content.
Sustainability 15 15428 g003
Figure 4. Soil water flux in a 0–100 cm profile. S1 represents mild saline-alkali farmland ((A) in 2018–2019, (C) in 2019–2020). S2 represents moderate saline-alkali farmland ((B) in 2018–2019, (D) in 2019–2020). W1, W2, W3, W4 and W5 represent winter irrigation amounts of 0, 150, 225, 300 and 375 mm, respectively. A positive value indicates a soil moisture increase, and a negative value indicates a soil moisture decrease.
Sustainability 15 15428 g004
Figure 5. Soil salt content distribution in different saline-alkali farmland (Unit: g/kg). S1 represents mild saline-alkali farmland ((A) in 2018–2019, (C) in 2019–2020). S2 represents moderate saline-alkali farmland ((B) in 2018–2019, (D) in 2019–2020). W1, W2, W3, W4 and W5 represent winter irrigation amounts of 0, 150, 225, 300 and 375 mm, respectively. The color changes from blue to red, indicating a gradual increase in soil salt content.
Sustainability 15 15428 g005
Figure 6. Soil salt flux in a 0–100 cm profile. S1 represents mild saline-alkali farmland ((A) in 2018–2019, (C) in 2019–2020). S2 represents moderate saline-alkali farmland ((B) in 2018–2019, (D) in 2019–2020). W1, W2, W3, W4 and W5 represent winter irrigation amounts of 0, 150, 225, 300 and 375 mm, respectively. A positive value indicates a soil salt increase, and a negative value indicates a soil salt decrease.
Sustainability 15 15428 g006
Figure 7. RSC in mild saline-alkali farmlands and moderate saline-alkali farmlands. A positive value indicates soil salt accumulation, and a negative value indicates soil desalination. S1 represents mild saline-alkali farmland ((A) in 2018–2019, (C) in 2019–2020). S2 represents moderate saline-alkali farmland ((B) in 2018–2019, (D) in 2019–2020). W1, W2, W3, W4 and W5 represent winter irrigation amounts of 0, 150, 225, 300 and 375 mm, respectively.
Sustainability 15 15428 g007
Table 1. Soil texture of the experimental field.
Soil Layer (cm)Soil Particle Distribution (%)Bulk Density (g/cm3)Soil Porosity (%)Soil TexturePH
Clay (<0.002 mm)Silt (0.002–0.02 mm)Sand (2–0.02 mm)
Mild saline-alkali farmland
0–2011.132.256.71.3747.53Sandy loamy7.4–8.9
20–408.932.858.31.4245.69Sandy loamy
40–6011.235.453.41.4842.31Sandy loamy
60–8010.542.447.11.5341.98Loamy
80–10013.755.730.61.5541.91Loamy
Moderate saline-alkali farmland
0–2012.734.452.91.3848.30Sandy loamy7.7–10.2
20–4013.930.955.21.4546.42Sandy loamy
40–6017.734.647.71.5044.15Loamy
60–8024.832.642.61.5242.91Loamy
80–10021.837.440.81.5842.59Loamy
Table 2. The change rate of salt storage content in the 0–100 cm soil profile from 2018 to 2020.
TreatmentInitial Salt Storage (8 November 2018) (g/cm2)Final Salt Storage (6 April 2020) (g/cm2)Variation in Salt Storage (g/cm2)RSC (%)
S1W10.41 c0.54 e0.13 b31.71 a
S1W20.40 c0.39 f−0.01 d−2.50 c
S1W30.40 c0.36 g−0.04 e−10.00 e
S1W40.38 c0.34 h−0.04 e−10.53 f
S1W50.39 c0.33 h−0.06 f−15.38 g
S2W11.04 a1.37 a0.33 a31.73 a
S2W20.90 b1.01 b0.11 c12.22 b
S2W30.86 bc0.78 c−0.08 g−9.30 d
S2W40.89 bc0.69 d−0.20 i−22.47 i
S2W50.89 bc0.74 cd−0.15 h−16.85 h
Note: different lower-case letters in the same column represent significant differences (p < 0.05).
Table 3. Sprouting rate and survival rate of cotton in 2019 and 2020 (%).
Treatment20192020
Sprouting RateSurvival RateSprouting RateSurvival Rate
S1W155.9 c96.1 a53.4 c94.0 a
S1W285.3 bc95.4 a86.2 b97.8 a
S1W392.3 a96.8 a92.3 a96.3 a
S1W492.1 a95.3 a93.8 a96.4 a
S1W591.7 a96.1 a92.2 a96.1 a
S2W144.2 d75.8 c40.6 d86.0 b
S2W271.3 c87.1 b76.4 c88.4 b
S2W377.4 bc88.7 ab81.8 bc90.7 ab
S2W489.6 a87.0 a90.6 a93.7 a
S2W585.5 a86.8 a87.2 b89.3 b
Note: different lower-case letters in the same column represent significant differences (p < 0.05).
Table 4. Morphological index and yield of cotton in 2019 and 2020.
Treatment20192020
Height/cmBoll Number/(per Plant)Yield/(kg/hm2)Height/cmBoll Number/(per Plant)Yield/(kg/hm2)
S1W165.34 c5.2 c2742.49 c62.37 c5.4 c2661.15 c
S1W277.71 b7.6 b6071.79 b79.32 b7.7 b6372.98 b
S1W381.54 a8.0 a7017.35 a80.68 a8.0 a6981.10 a
S1W482.82 a8.1 a7065.98 a81.54 a8.1 a7190.69 a
S1W581.73 a8.1 a7007.83 a80.77 a8.0 a6959.05 a
S2W157.21 d4.5 c1480.16 e51.11 c4.2 d1439.73 e
S2W262.34 c5.7 b3475.27 d65.33 b5.8 c3845.74 d
S2W367.55 b6.1 ab4111.50 c68.72 b6.2 b4516.04 c
S2W471.63 a6.3 a4812.20 a75.45 a6.7 a5584.04 a
S2W570.71 a6.3 a4590.21 b72.54 ab6.5 a4969.21 b
Note: different lower-case letters in the same column represent significant differences (p < 0.05).
Table 5. IWUE and iWUE in 2018–2019 and 2019–2020.
Treatment2018–20192019–2020
Winter Irrigation Amount (mm)Irrigation Amount in the Growth Period (mm)WUE (kg/m3·mm)Winter Irrigation Amount (mm)Irrigation Amount in the Growth Period (mm)WUE (kg/m3·mm)
iWUEIWUEiWUEIWUE
S1W104750.58 c0.58 d04750.56 c0.56 d
S1W21504751.28 b0.97 ab1504751.34 b1.02 a
S1W32254751.48 a1.00 a2254751.47 a1.02 a
S1W43004751.49 a0.91 b3004751.51 a0.93 b
S1W53754751.48 a0.82 c3754751.47 a0.82 c
S2W104750.31 d0.31 c04750.30 e0.30 d
S2W21504750.73 c0.56 b1504750.81 d0.62 b
S2W32254750.87 b0.59 ab2254750.95 c0.65 b
S2W43004751.01 a0.62 a3004751.18 a0.72 a
S2W53754750.97 ab0.54 b3754751.05 b0.58 c
Note: different lower-case letters in the same column represent significant differences (p < 0.05).
Disclaimer/Publisher’s Note: The statements, opinions and data contained in all publications are solely those of the individual author(s) and contributor(s) and not of MDPI and/or the editor(s). MDPI and/or the editor(s) disclaim responsibility for any injury to people or property resulting from any ideas, methods, instructions or products referred to in the content.

