Abstract
The spatial and temporal dynamic monitoring of the heavy metal concentration in agricultural soils can help us to understand the extent and changes of regional soil heavy metal pollution, allowing us safeguard food safety and human health and provide basic data for the prevention and control of heavy metal pollution in agricultural soils. The heavy metals’ concentrations, including Cd, Cr, Cu, Hg, Ni, Pb, Zn, and As, were measured in surface (0–20 cm) soil samples collected in 2017 and 2021 from agriculture land to evaluate their pollution levels in the Ningxia Hui Autonomous Region (Hereinafter referred to as Ningxia), northwest of China. A correlation analysis, principal component analysis, and positive matrix factorization were used jointly to identify possible sources. The results showed that, for most soils, the concentrations of As, Cr, Cu, Ni, Pb, and Zn were lower than the contamination thresholds stipulated by the national guideline. The average concentrations of As, Cd, Zn, and Ni in 2021 were significantly lower than the levels in 2017 (p < 0.05), but the average concentration of Cu was significantly higher in 2021 than in 2017 (p < 0.05), and the average concentrations of Cr, Pb, and Hg did not change significantly during the last five years. According to the pollution assessment index (mean Igeo values), Cd and Hg were found to accumulate in the farmland environment and were the major pollutants in the region, and the hotspots with high concentrations of heavy metals were mainly located in the Yellow River irrigation area in Northern Ningxia. Four main sources of heavy metals in the soils were identified: As mainly originated from natural sources; Pb, Cd, and Ni from atmospheric deposition and industrial activities; Cr, Zn, and Cu from agricultural activities; and Hg from the coal-related industrial activities. The concentration of heavy metals from anthropogenic sources accounted for 77.10% in agricultural soils, indicating the strong influence of this source on soil heavy metal accumulation. These findings provide scientific evidence and valuable information to prevent heavy metal contamination and control of farmland.
1. Introduction
Heavy metals are important nonbiodegradable components of geochemistry [1,2,3], and they persist in soil for long periods after polluting activities have ceased [4]. Due to their high toxicity at low concentrations, long residence times, persistent bioavailability, and subsequent accumulation in soils, heavy metals can alter soil function and reduce the agricultural yield and quality of crops and cause serious threats to human health in the long term [5]. Reports on soil contamination by heavy metals have been published in different countries. In the United States, 28.0% of soil samples had heavy metal concentrations above the EPA (Environmental Protection Agency)’s ecological soil screening levels [6]. In Russia, about one tenth of the surveyed soils were considered “dangerous” or “moderately dangerous” for heavy metal contamination [7]. In China, the MEP (Ministry of Environmental Protection) and MLR (Ministry of Land and Resources) conducted a national investigation of soil contaminants and found that 19.4% of agricultural soil samples contained concentrations of heavy metals that exceeded the standard safe limits [8]. However, soils are dynamic systems and change in their physical and chemical properties. Heavy metals are known to move either horizontally or vertically during soil development [9]. With the rapidly developing industrialization, urbanization, and agricultural intensification, heavy metal pollution has now become an essential threat to the health of soil ecosystems [10,11,12,13] and a research hotspot in ecology and environmental science [1,14].
Natural and anthropogenic sources could contribute to heavy metal accumulation in an agricultural soil environment [15]. Parent rock weathering or pedogenesis are the most common natural sources of heavy metals, while pollutants emitted from human activities (e.g., irrational use of pesticides and fertilizers, vehicle exhaust, wastewater practice in irrigation, industrial waste emissions, etc.) constitute the anthropogenic sources. The source apportionment of heavy metals in agricultural soils has become an important research field in recent years [16], as it is essential to enable efficient restoration design and remediation strategies in contaminated areas [17]. The PCA (principal component analysis) and correlation analysis have been traditionally used to qualitatively identify the source of elements in the soils [1,18]. More recently, PMF (positive matrix factorization) has also been implemented as a modeling tool for source identification and quantification. PMF uses dependable factorization algorithms and weights all data using uncertainty [19]; its greatest advantages are that it does not require a source profile and is able to calculate the precise contribution rates of pollution sources [20,21,22]. PMF has been widely used in many regions for the apportionment of contaminant sources [15,23,24,25].
Most research on heavy metal contamination of Chinese soils has concentrated on eastern soils in coastal regions irrigated by industrial waste and sewage [19,26,27]. Fewer studies have been conducted on farmland in Northwestern China, where heavy metal pollution is less prevalent than in Southern China. However, with changes in farming methods, irrigation conditions, and climate change, the original heavy metal content of the area will also have the possibility of having heavy metal pollution, and reports of excessive heavy metals in agricultural products have been found in some areas [1,11,28,29]. Ningxia, in the northwest regions of China, is a major commercial grain base (3.70 × 10⁶ t/a) and plays an influential role in food security, guaranteeing the economic development and social stability, but there are relatively few studies related to the heavy metal pollution status of farmland in this region. Therefore, heavy metal pollution and source monitoring of the region’s agricultural soils is essential. In this study, the concentrations of heavy metals in the agricultural soils were detected in 2017 and 2021 to identify temporal changes in Ningxia. We aimed to answer the following questions: (1) What was the level of heavy metals in Ningxia farmland? (2) What were the characteristics of the spatial distribution of heavy metals in Ningxia farmland soils? (3) What were the main sources of heavy metals in Ningxia farmland soils? The significance of this study will help to identify areas of heavy metal contamination, clarify contamination levels, develop effective remediation strategies for heavy metal contaminated soils, and maintain sustainable soil use and management.
2. Materials and Methods
2.1. Study Area
The Ningxia (35°14′–39°23′ N, 104°17′–107°39′ E) is adjacent to the Inner Mongolia Autonomous Region in the West and North, Shaanxi Province in the East, and Gansu Province in the south, with a total area of 6.64 × 10⁴ km2 [30,31] and has 5 prefecture-level cities of Yinchuan (the capital), Shizuishan, Wuzhong, Zhongwei, and Guyuan [32]. It is located in the middle and upper reaches of the Yellow River, which flows from southwest to northeast through Northern Ningxia and formed an alluvial plain, where many channels for irrigating farmlands were built along a about 400 km stretch of the Yellow River [33]. The study area features a typical continental monsoon climate, the average annual temperature is 5–9 °C, and the annual sunshine duration is approximately 2194–3082 h. The average annual precipitation is about 200–680 mm, mainly concentrated in summer and autumn. Precipitation gradually increases from north to south, while the average annual temperature, on the contrary, increases from south to north. The annual evaporation is much higher than precipitation, ranging from 1214 to 2803 mm [34]. The arid areas with annual precipitation of less than 400 mm account for a relatively large proportion of the total area of the region, accounting for about 80%.
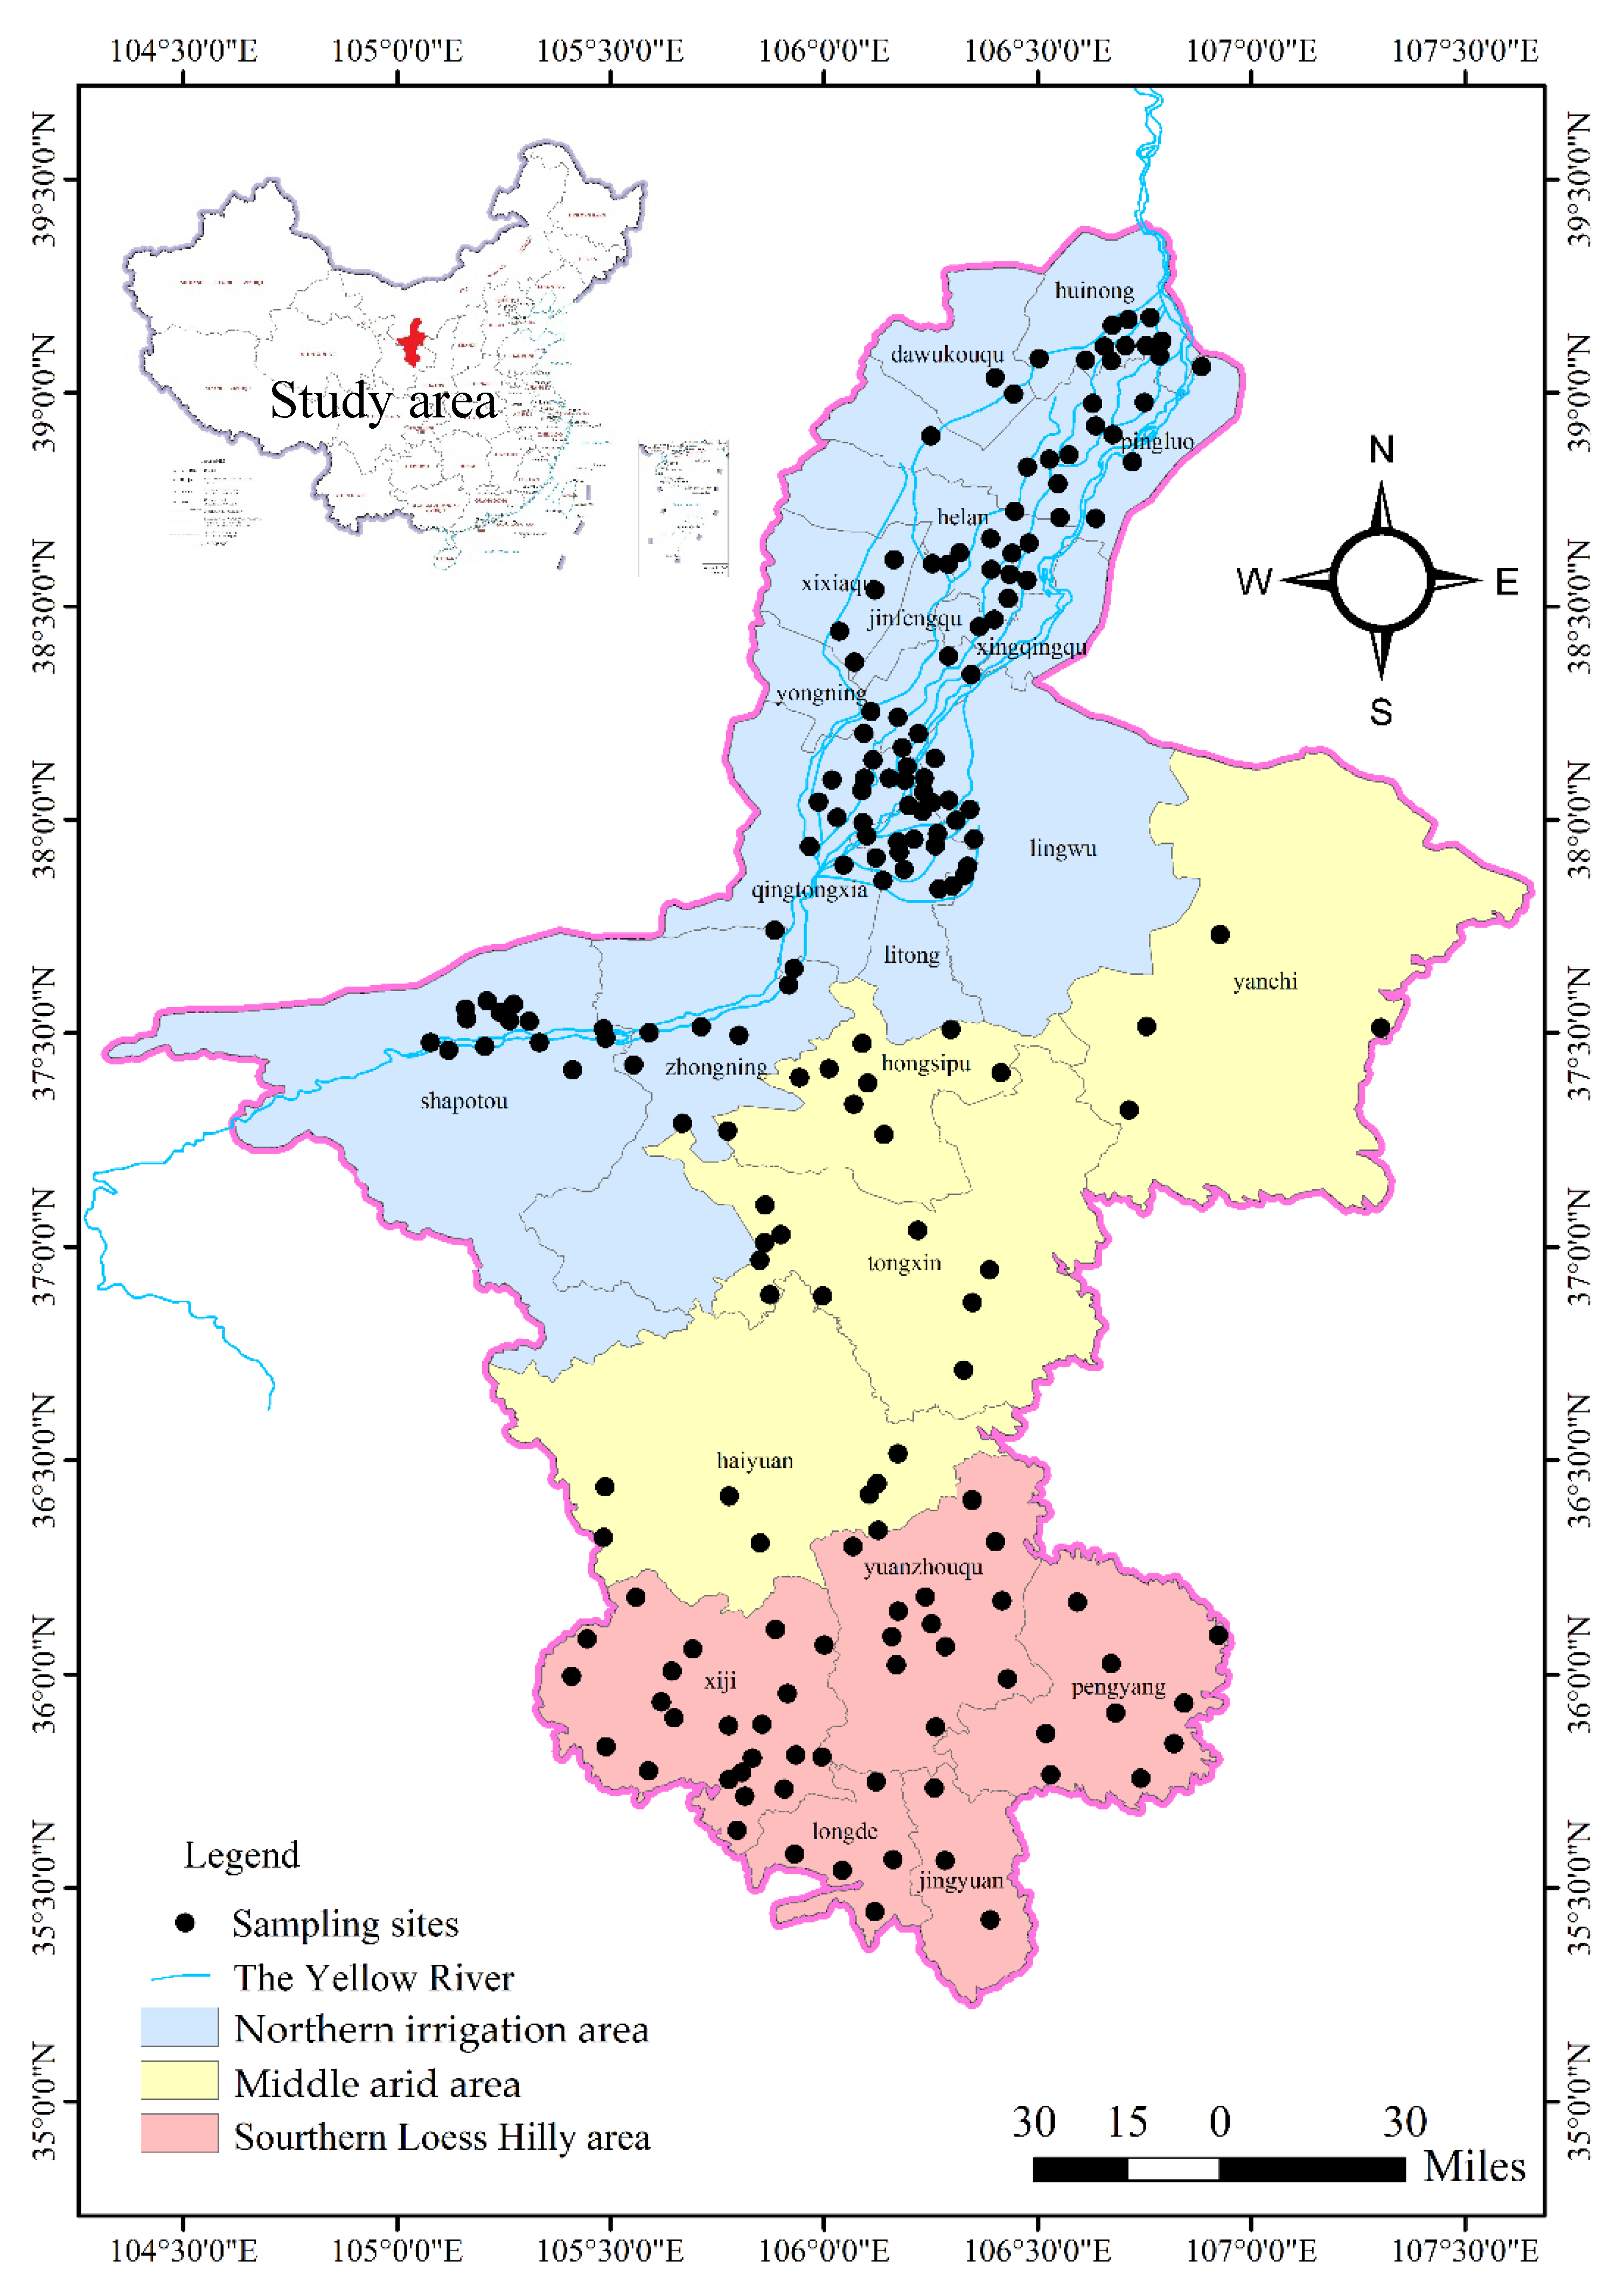
Ningxia can be divided into three ecological zones, from the north to the south, according to the natural conditions (Figure 1), including the Northern Irrigation area (N-I), where are the Yellow River irrigation area in northern with an ancient history, has long enjoyed the fame of “An Oasis in the Hinterland”, is the main grain production area of Ningxia, with the increase of irrigation and planting years, the risk of heavy metal pollution in farmland has increased, so food safety has been concerned; Middle Arid area (M-A), where there are the arid and semi-arid zone in Middle Ningxia, does not have a large flow of rivers that can be used for farmland irrigation and therefore relies on limited natural rainfall for farming; Southern Loess Hilly area (S-L), where there are hilly and mountainous areas in the south with relatively high rainfall, but no perennial rivers that can be used for farmland irrigation, so agriculture is mainly rainfed [31]. Previously, the central and local governments implemented measures and policies to stimulate economic development and urbanization in Ningxia. In fact, the economy of this region is strongly dependent on the mining and energy industries, and the development driven by these heavy industries has had some negative impacts, such as air and soil pollution and ecological degradation [35]. In recent years, both national and local governments have called for a firm path of ecological priority and green development, suggesting that economic development should not come at the cost of ecological damage, and thus environmental protection has been given high priority.

Figure 1.
The map of the study area and sampling sites.
2.2. Sample Collection and Analysis
To determine the spatiotemporal distribution of heavy metals in Ningxia farmland, one hundred and ninety-three surface soil samples (0–20 cm) were obtained in 2017 and 2021 at the same sampling sites, in accordance with the principle of sampling in equal proportion to the scale and the distribution area of farmland in counties, which refers to sampling according to the farmland area of each county, mainly considering the different land use types of each county. Although the area of some counties is large, the area of farmland is not necessarily large, that is, other land use types occupy a relatively high proportion. However, our research mainly focuses on the land use type of farmland. Therefore, we sampled the farmland area of each county in the study area. Those with a large farmland area had more sampling points, while those with a small farmland area had fewer sampling points. Each representative soil sample was a mix of five surface soil subsamples (0–20 cm) collected from different locations within the same farm plot. Then, the collected samples were bagged in an envelope and air dried at room temperature in the laboratory. After the samples were pretreated (plant roots and gravels were manually removed from each sample), they were ground using an agate mortar and passed through a 200-mesh nylon screen via the quartering method for chemical analysis.
The pH was measured at a soil: water (1:2.5) by using an electronic pH meter (PHS-3C, Shanghai Leici, China). The soil organic matter (OM, g·kg−1) was measured using H2SO4-K2Cr2O7 oxidation, followed by titration with FeSO4 [36]. The cation exchange capacity (CEC) was tested by calcium acetate extraction, following the Environmental Protection Standards of China (NY/T 1121.5-2006) [37]. The concentrations of Cr, Ni, Cu, and Zn were analyzed by a flame atomic absorption spectrophotometer (240 AA Agilent, Santa Clara, CA, USA), the contents of Cd and Pb were determined by a graphite furnace atomic absorption spectrophotometer (AA-7000 Shimadzu, Kyoto, Japan), and the concentrations of As and Hg were determined by an atomic fluorescence spectrometer (AFS230E Haiguang Analytical Instrument Co., Beijing, China) [38,39]. The recoveries of all eight metals were 100 ± 15%. The detection limits for As, Cd, Cr, Cu, Pb, Hg, Ni, and Zn were 0.08, 0.01, 4.0, 1.0, 0.1, 0.002, 3.0, and 1.0 mg·kg−1, respectively.
2.3. Pollution Assessment (Igeo)
The Igeo is expressed as follows:
where is the geo-accumulation index, is the measured concentration of heavy metal n in the soil sample, represents the background value of the heavy metal n (Table 1), and the numerical value 1.5 represents the possible variation of the background values due to weathering and lithogenic effects. The specific pollution levels are shown in Supplementary Table S1 depending on the intensity of pollution.

Table 1.
Background reference values of soil heavy metals in Ningxia [40].
2.4. Source Apportionment Methods
2.4.1. Multivariate Statistical Analysis
The PCA and correlation analysis have been widely used to study the chemical–physical characteristics of different heavy metals [1]. The PCA is a dimensionality-reducing linear technique that transforms various environmental factors into several principal components that correspond to potential sources [14]. In this study, a PCA for heavy metals in soils was performed to detect the principal components, which were assumed to be the major sources of heavy metals. The dataset was tested by Kaiser–Meyer–Olkin (KMO) and the Bartlett sphericity tests (KMO = 0.77, p < 0.001), demonstrating that the PCA was reliable for this analysis.
The Pearson’s correlation analysis was performed to determine the intensity of a linear relationship between heavy metals concentrations and to distinguish effectively between the natural and anthropogenic sources. When Pearson’s correlation coefficient > 0.1, it shows that there is a degree of correlation between the variables [41]. Data analyses for the PCA and correlation analysis were carried out using SPSS Statistics 24.0 (IBM Corporation, Armonk, NY, USA).
2.4.2. PMF
PMF 5.0 software was employed to apportion the sources of heavy metals in agricultural soils. The PMF model can be expressed by the following mathematical equation [14]:
where is the total concentration of j heavy metal in i soil sample; is the contribution of k source for i soil sample; is the concentration of j heavy metal in the k source; is the residual error for j heavy metal in i soil sample; and the target function, Q, can be obtained via an iterative algorithm.
The calculating procedure of the objective function, Q, was performed as shown below:
where denotes the uncertainty for each soil sample. Equation (4) indicates the uncertainty calculation process for heavy metal concentrations higher than the method detection limit (MDL):
where a represents the relative standard deviation, and c is the detection of heavy metal concentration. Moreover, if the heavy metal concentration is either equal to or lower than the MDL, the uncertainty can be calculated according to Equation (5).
Finally, based to the above calculations, the most preferred solution would be taken to ensure the accurate apportionment results.
Using this model, 20 runs were performed on the data with random seeds and different numbers of factors (ranging from 3 to 6) until lower Q values, higher R2 values, and clear interpretable factors were attained [20].
2.5. Correlation Analysis
The Pearson correlation coefficient was used to evaluate the linear correlation among heavy metals. The Pearson correlation coefficient (r) is defined as follows:
where and are two random variables, is the number of samples, and and are mean values of the corresponding heavy metals. Moreover, the linear correlations between different heavy metals in soils using scatter matrix analysis were plotted by R programming language.
2.6. Data Analysis
A statistical analysis of the data (SPSS 24.0, IBM Corporation, Armonk, NY, USA) was performed to calculate descriptive statistics (mean, minimum, maximum, median, extreme difference, variable coefficient, and standard deviation). The least significant difference (LSD) and the PCA were also performed using SPSS 24.0. Box plots were plotted by using R programing language. The spatial distributions of heavy metal concentrations were mapped by ArcGIS (ArcGIS 10.5, ESRI, incorporated, Redlands, CA, USA). The quantitative source apportionment was analyzed using the PMF model (EPA PMF 5.0, Washington, DC, USA).
3. Results and Discussion
3.1. Physicochemical Properties and Heavy Metal Concentration
The physicochemical properties and heavy metal concentrations of agricultural soils gathered in 2021 are shown in Table 2. The pH value varied from 7.80 to 9.10, with a mean value of 8.43, which was not significantly different from the mean pH value of 8.47 in 2017 (p > 0.05). Over the past five years, the mean pH value has decreased by 0.04, which some scholars believe may be associated with the anthropogenic use of chemical fertilizers [42]. The range of OM in 2021 was from 1.75 to 31.60 g·kg−1, with a mean value of 13.60 g·kg−1. The high CV (41.64%) of OM implied a greater anthropogenic disturbance of agricultural production [14]. The CEC varied from 1.08 to 24.70 mol·kg−1, with a mean value of 9.40 in 2021, and it showed no significant difference from the mean value of 9.57 mol·kg−1 in 2017 (p > 0.05), but the CV of CEC was 39.23%, which mainly showed higher spatial variability characteristics.
The concentrations of As, Cd, Cr, Hg, Pb, Cu, Zn, and Ni ranged from 4.24 to 18.00 g·kg−1, 0.02 to 0.35 g·kg−1, 35.00 to 90.00 g·kg−1, 0.00 to 0.16 g·kg−1, 13.00 to 23.10 g·kg−1, 12.00 to 36.00g·kg−1, 33.00 to 91.00 g·kg−1, and 18.00 to 40.00 g·kg−1, respectively, and the mean concentrations were 10.57, 0.16, 61.13, 0.03, 18.74, 23.04, 62.86, and 27.96 g·kg−1, respectively. Zn, Cu, Cd, Cr, and Hg were all higher than the corresponding background values, demonstrating the accumulation of these metals in soils [14]. The CVs of Hg and Cd were higher than 30%, showing strong variation, indicating that the two metals may be related to the external input of anthropogenic activities [43] and lead to a heterogeneous spatial distribution [14]. Meanwhile, the CVs of As, Cr, Pb, Cu, Zn, and Ni were below 25%, showing a weaker variation.
Table 2.
Descriptive statistics of soil physicochemical properties and heavy metals in 2021.
Table 2.
Descriptive statistics of soil physicochemical properties and heavy metals in 2021.
| pH | OM | CEC | As | Cd | Cr | Hg | Pb | Cu | Zn | Ni | |
|---|---|---|---|---|---|---|---|---|---|---|---|
| Mean | 8.43 | 13.60 | 9.40 | 10.57 | 0.16 | 61.13 | 0.03 | 18.74 | 23.04 | 62.86 | 27.96 |
| Median | 8.40 | 13.10 | 9.20 | 10.50 | 0.15 | 61.00 | 0.03 | 18.60 | 23.00 | 64.00 | 27.00 |
| Max | 9.10 | 31.60 | 24.70 | 18.00 | 0.35 | 90.00 | 0.16 | 23.10 | 36.00 | 91.00 | 40.00 |
| Min | 7.80 | 1.75 | 1.08 | 4.24 | 0.02 | 35.00 | 0.00 | 13.00 | 12.00 | 33.00 | 18.00 |
| ED | 1.30 | 29.85 | 23.62 | 13.76 | 0.33 | 55.00 | 0.15 | 10.10 | 24.00 | 58.00 | 22.00 |
| SD | 0.23 | 5.66 | 3.69 | 2.25 | 0.05 | 9.67 | 0.02 | 2.16 | 4.38 | 11.19 | 4.04 |
| CV | 2.79 | 41.64 | 39.23 | 21.28 | 31.34 | 15.82 | 77.51 | 11.53 | 19.00 | 17.81 | 14.45 |
| Background values of Ningxia [40] | - | - | - | 11.90 | 0.11 | 60.00 | 0.02 | 20.90 | 22.10 | 58.80 | 36.50 |
| Background values of China [44] | - | - | - | 11.00 | 0.10 | 61.00 | 0.07 | 26.00 | 23.00 | 74.00 | 27.00 |
| Grade Ⅰ [45] | - | - | - | 15.00 | 0.20 | 90.00 | 0.15 | 35.00 | 35.00 | 100.00 | 40.00 |
| Grade Ⅱ [45] | - | - | - | 30.00 | 0.30 | 200.00 | 0.50 | 300.00 | 100.00 | 250.00 | 50.00 |
The units of heavy metals are mg kg−1, the unit of OM is g kg−1, and the unit of CEC is mol·kg−1. ED, extreme difference; SD, standard deviation; CV, coefficient of variable.
3.2. Assessment of Soil Heavy Metal Pollution
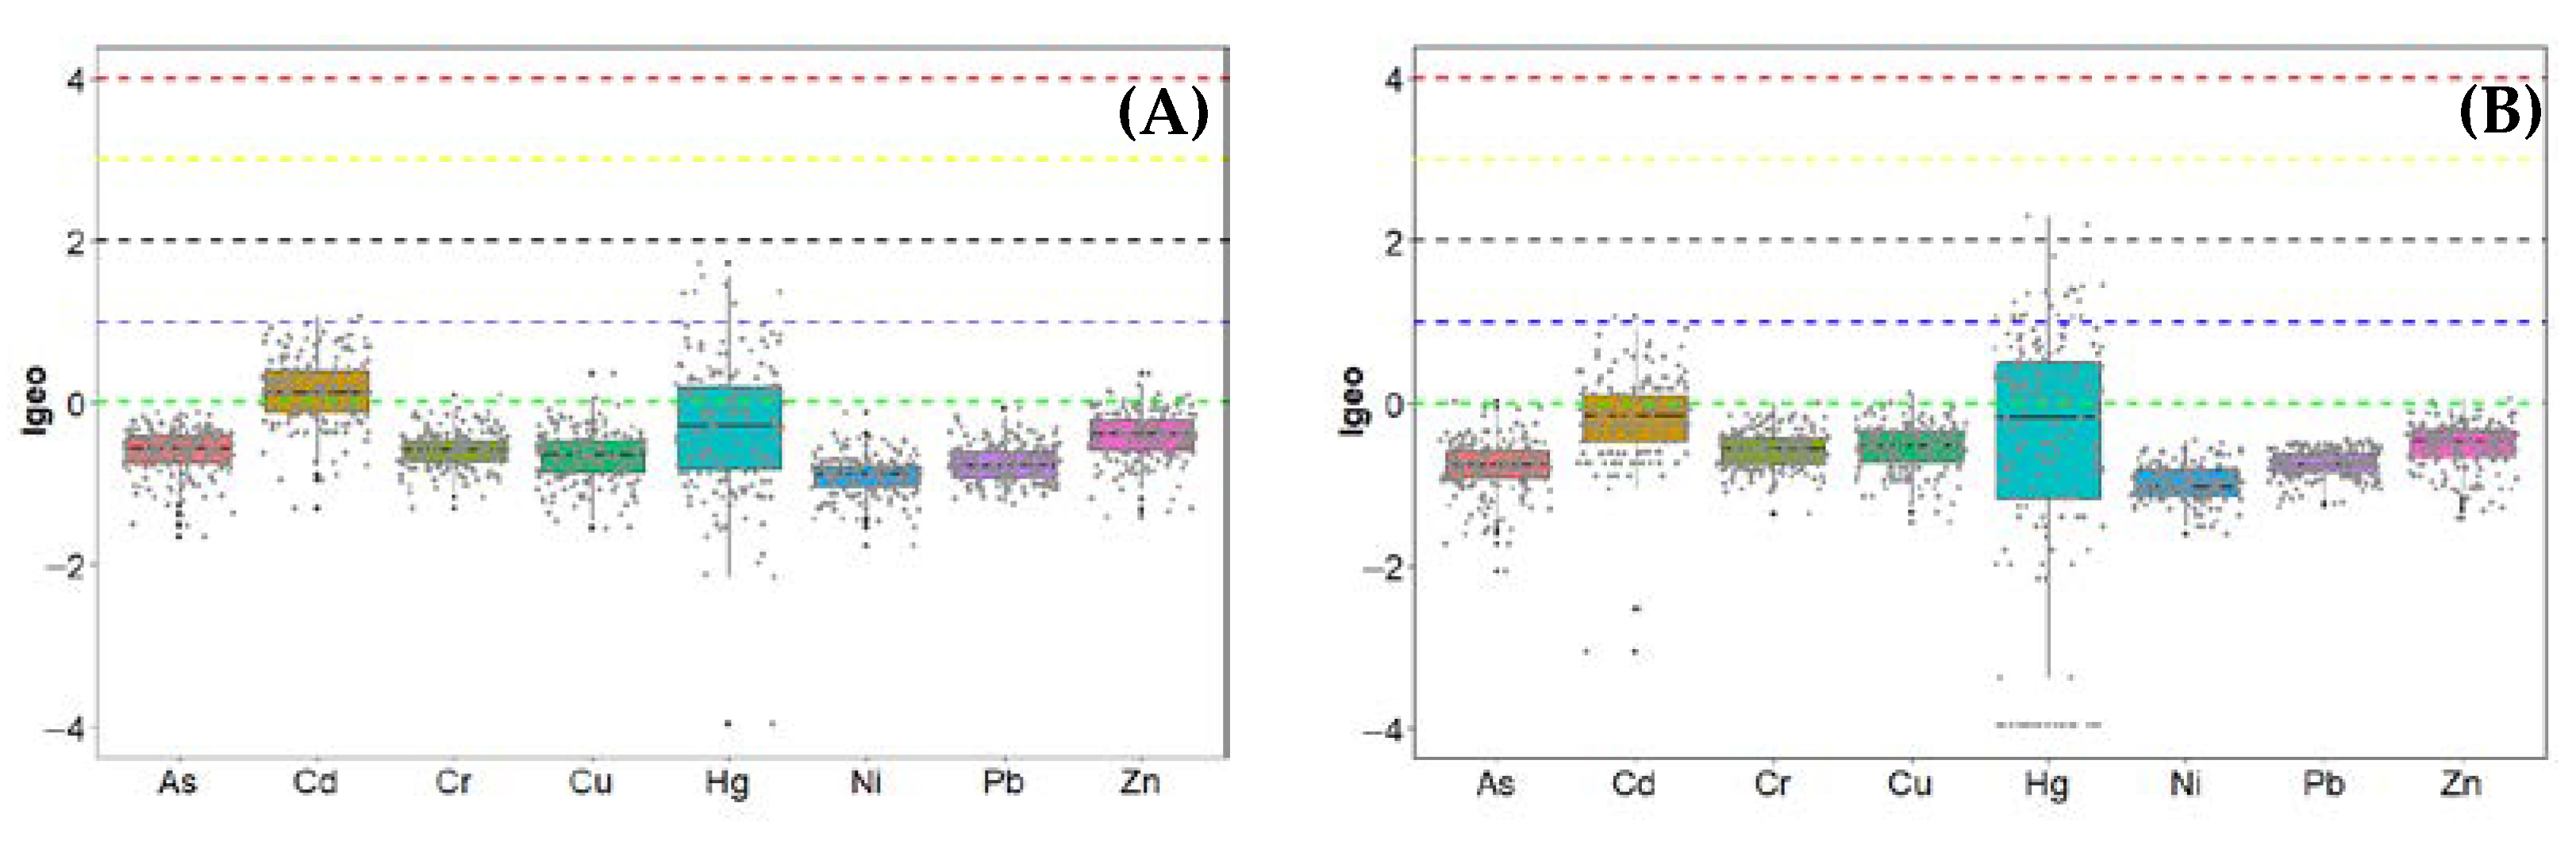
In 2017 and 2021, the median Igeo values of eight heavy metals were all less than 0 (Figure 2), indicating that these heavy metals were mainly of natural origin [21]. From the data of two years, the Igeo values of Cr, Ni, and Pb were lower than or equal to 0, indicating that there is no Cr, Ni, and Pb pollution in the soil. A few of the soil sites’ Igeo values of As, Cu, and Zn ranged from 0 to 1, indicating that they are moderately polluted with these metals. In respect to Cd and Hg, although most sites had Igeo values below 1, a minority of sites still had Igeo values above or equal to 1, and even two sites had Igeo values of Hg greater than 2 in 2021, suggesting that these heavy metals may have been affected by point source pollution and human activities had some influence on them [16,21,29].

Figure 2.
Box plots for the 2017 (A) and 2021 (B) soil heavy metal pollution assessment. The green, blue, black, yellow, and red dashed lines indicate Igeo = 0, 1, 2, 3, and 4, respectively.
3.3. Spatiotemporal Distributions of Soils Physicochemical Properties and Heavy Metals
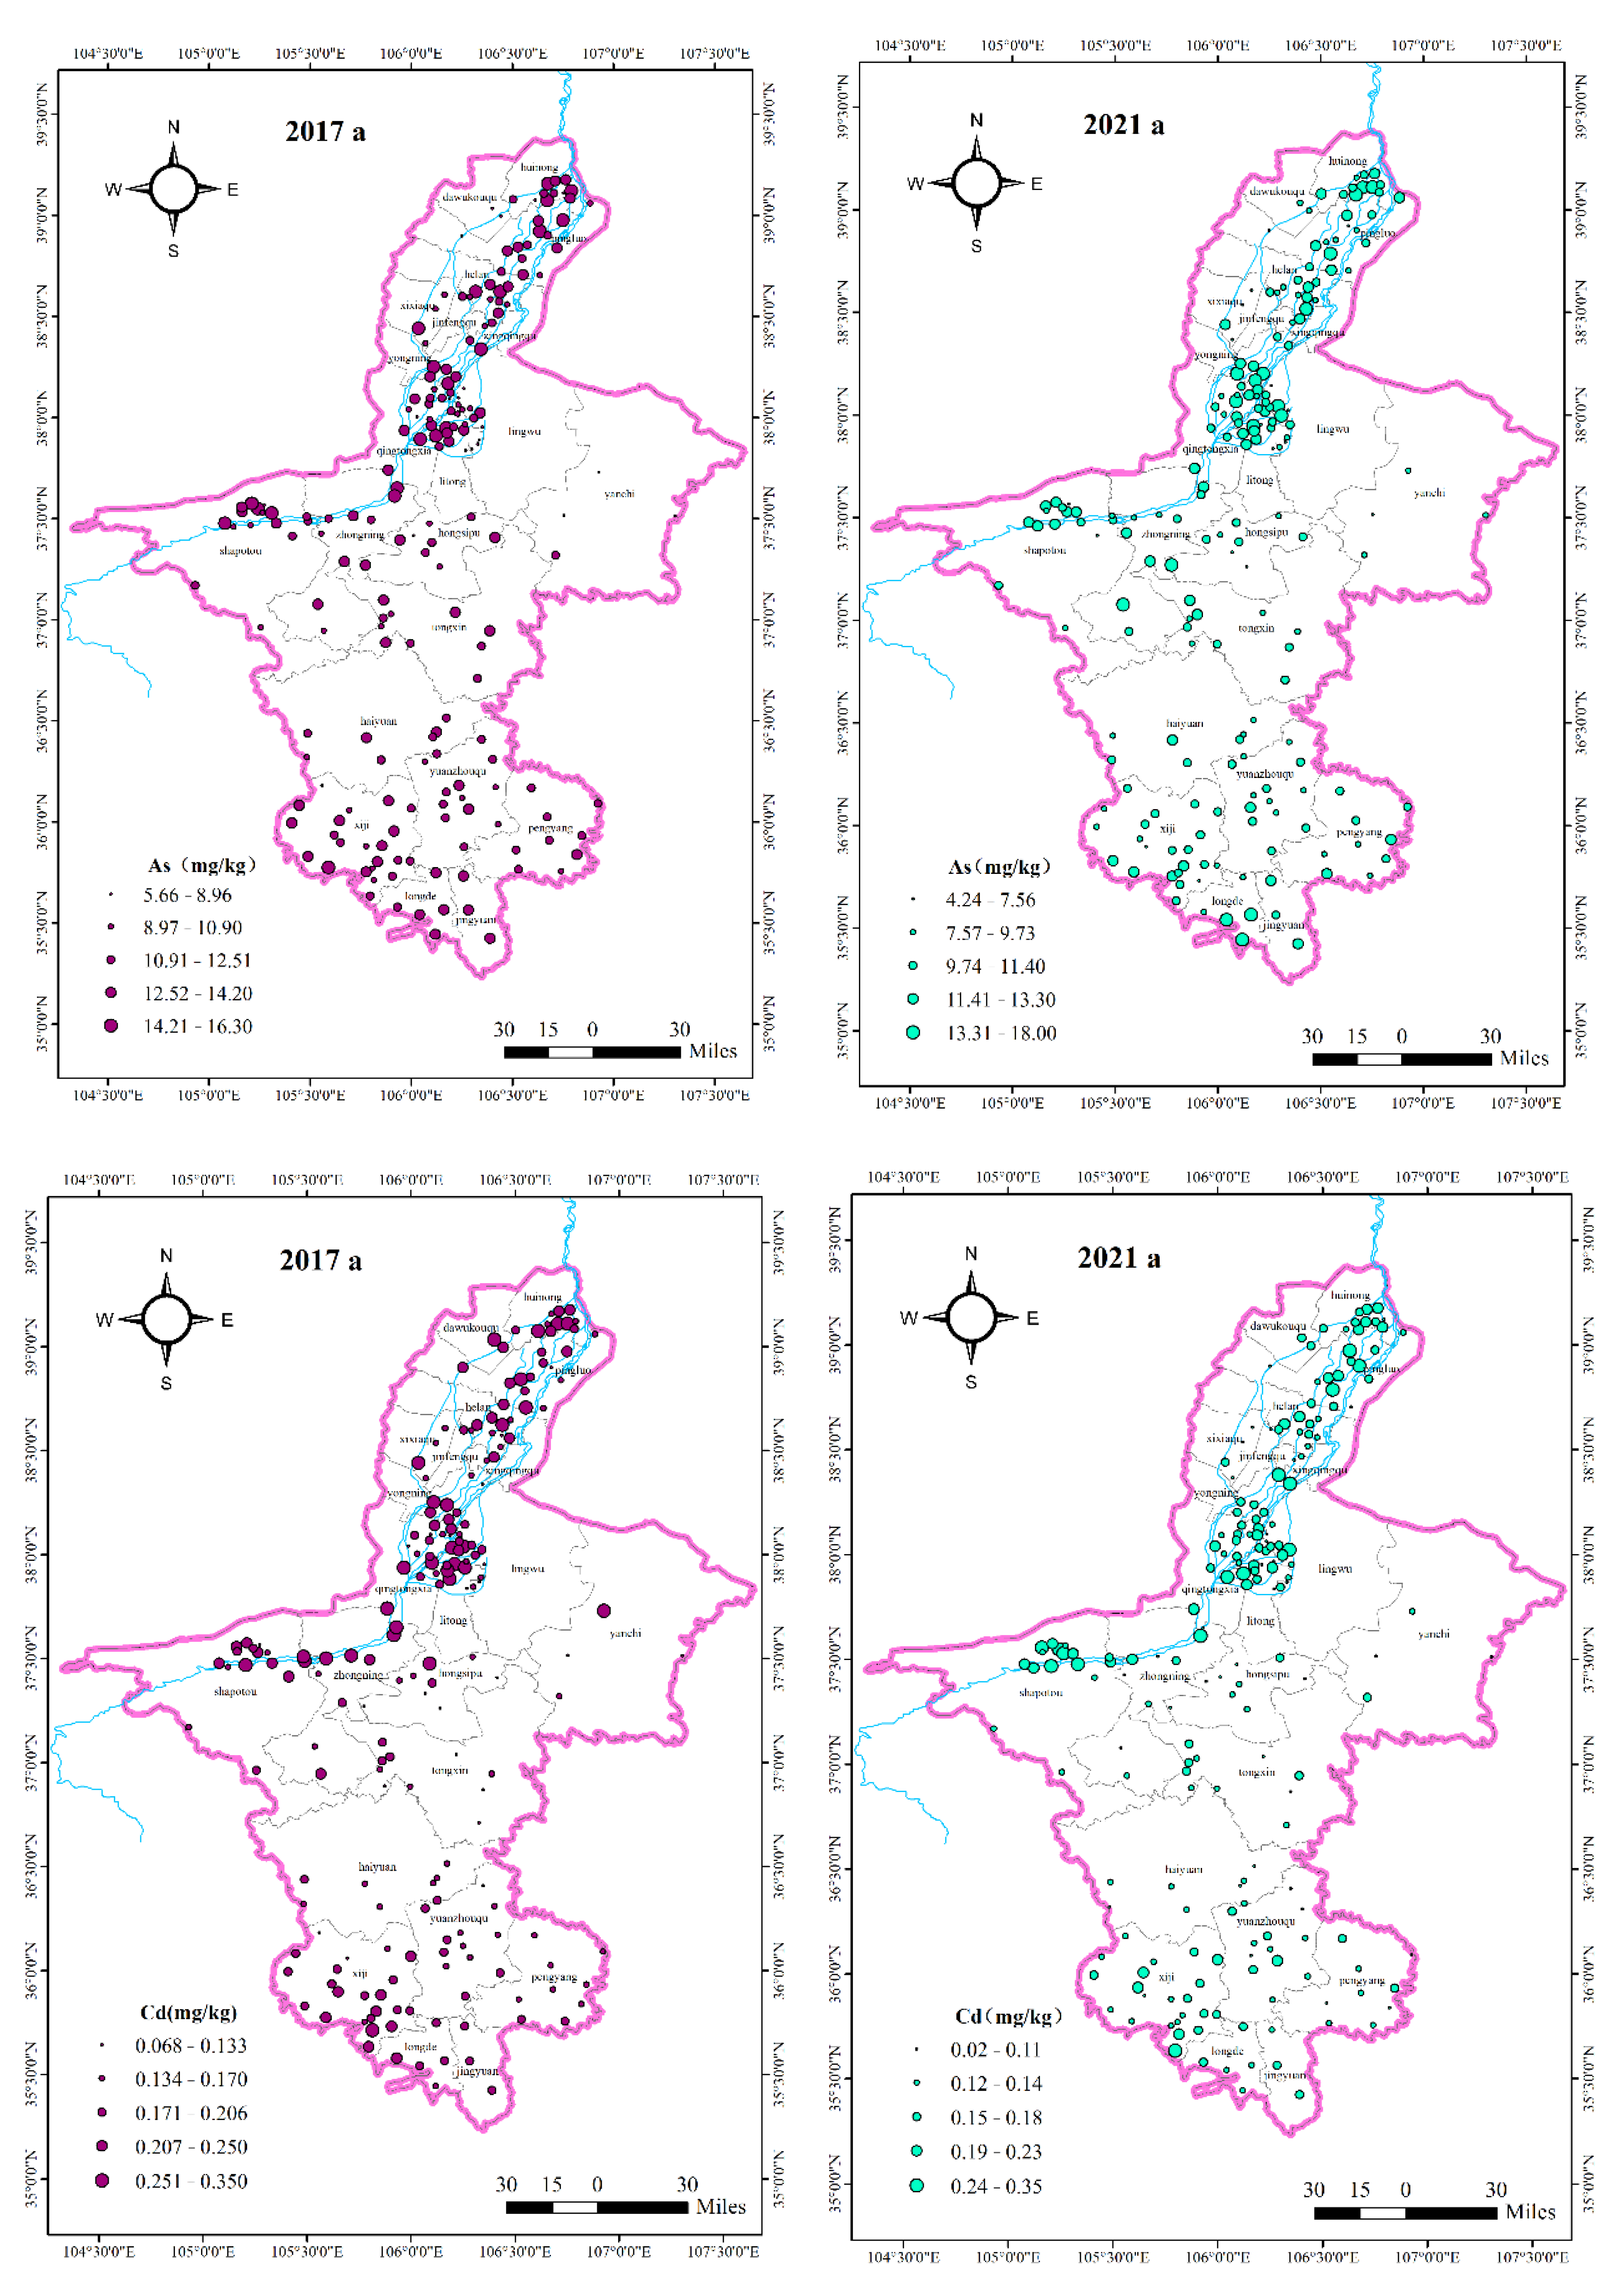
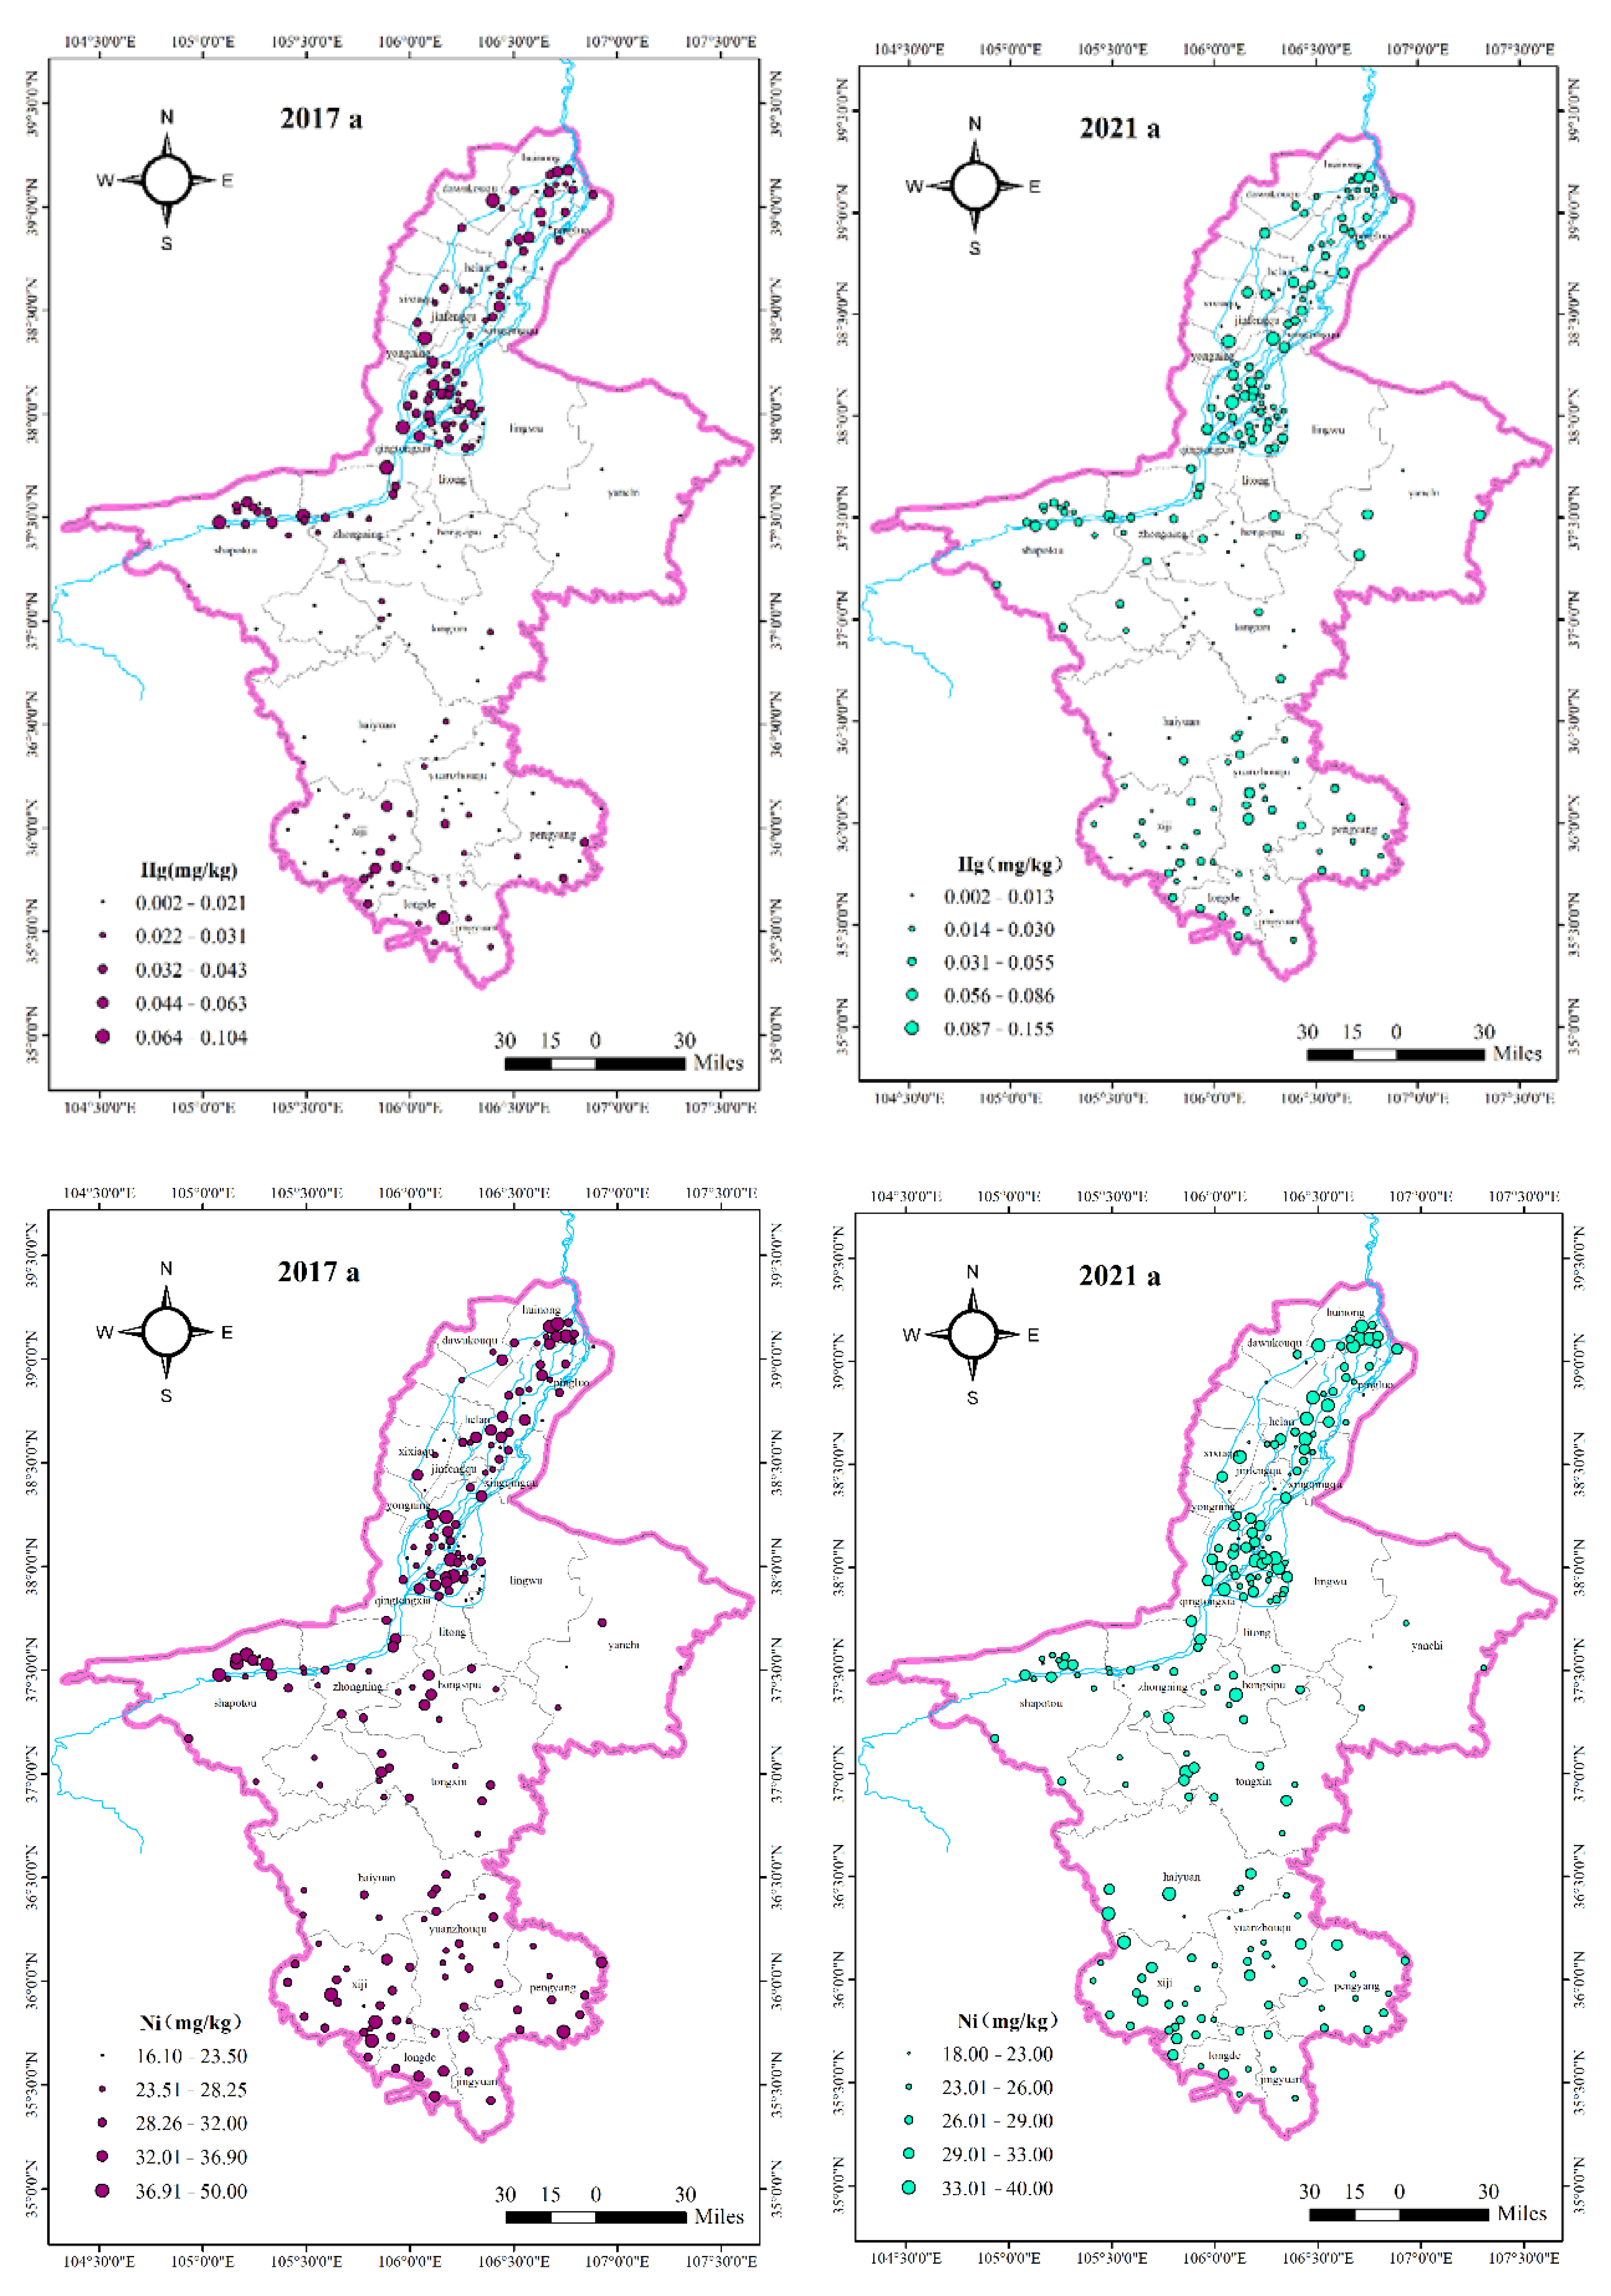
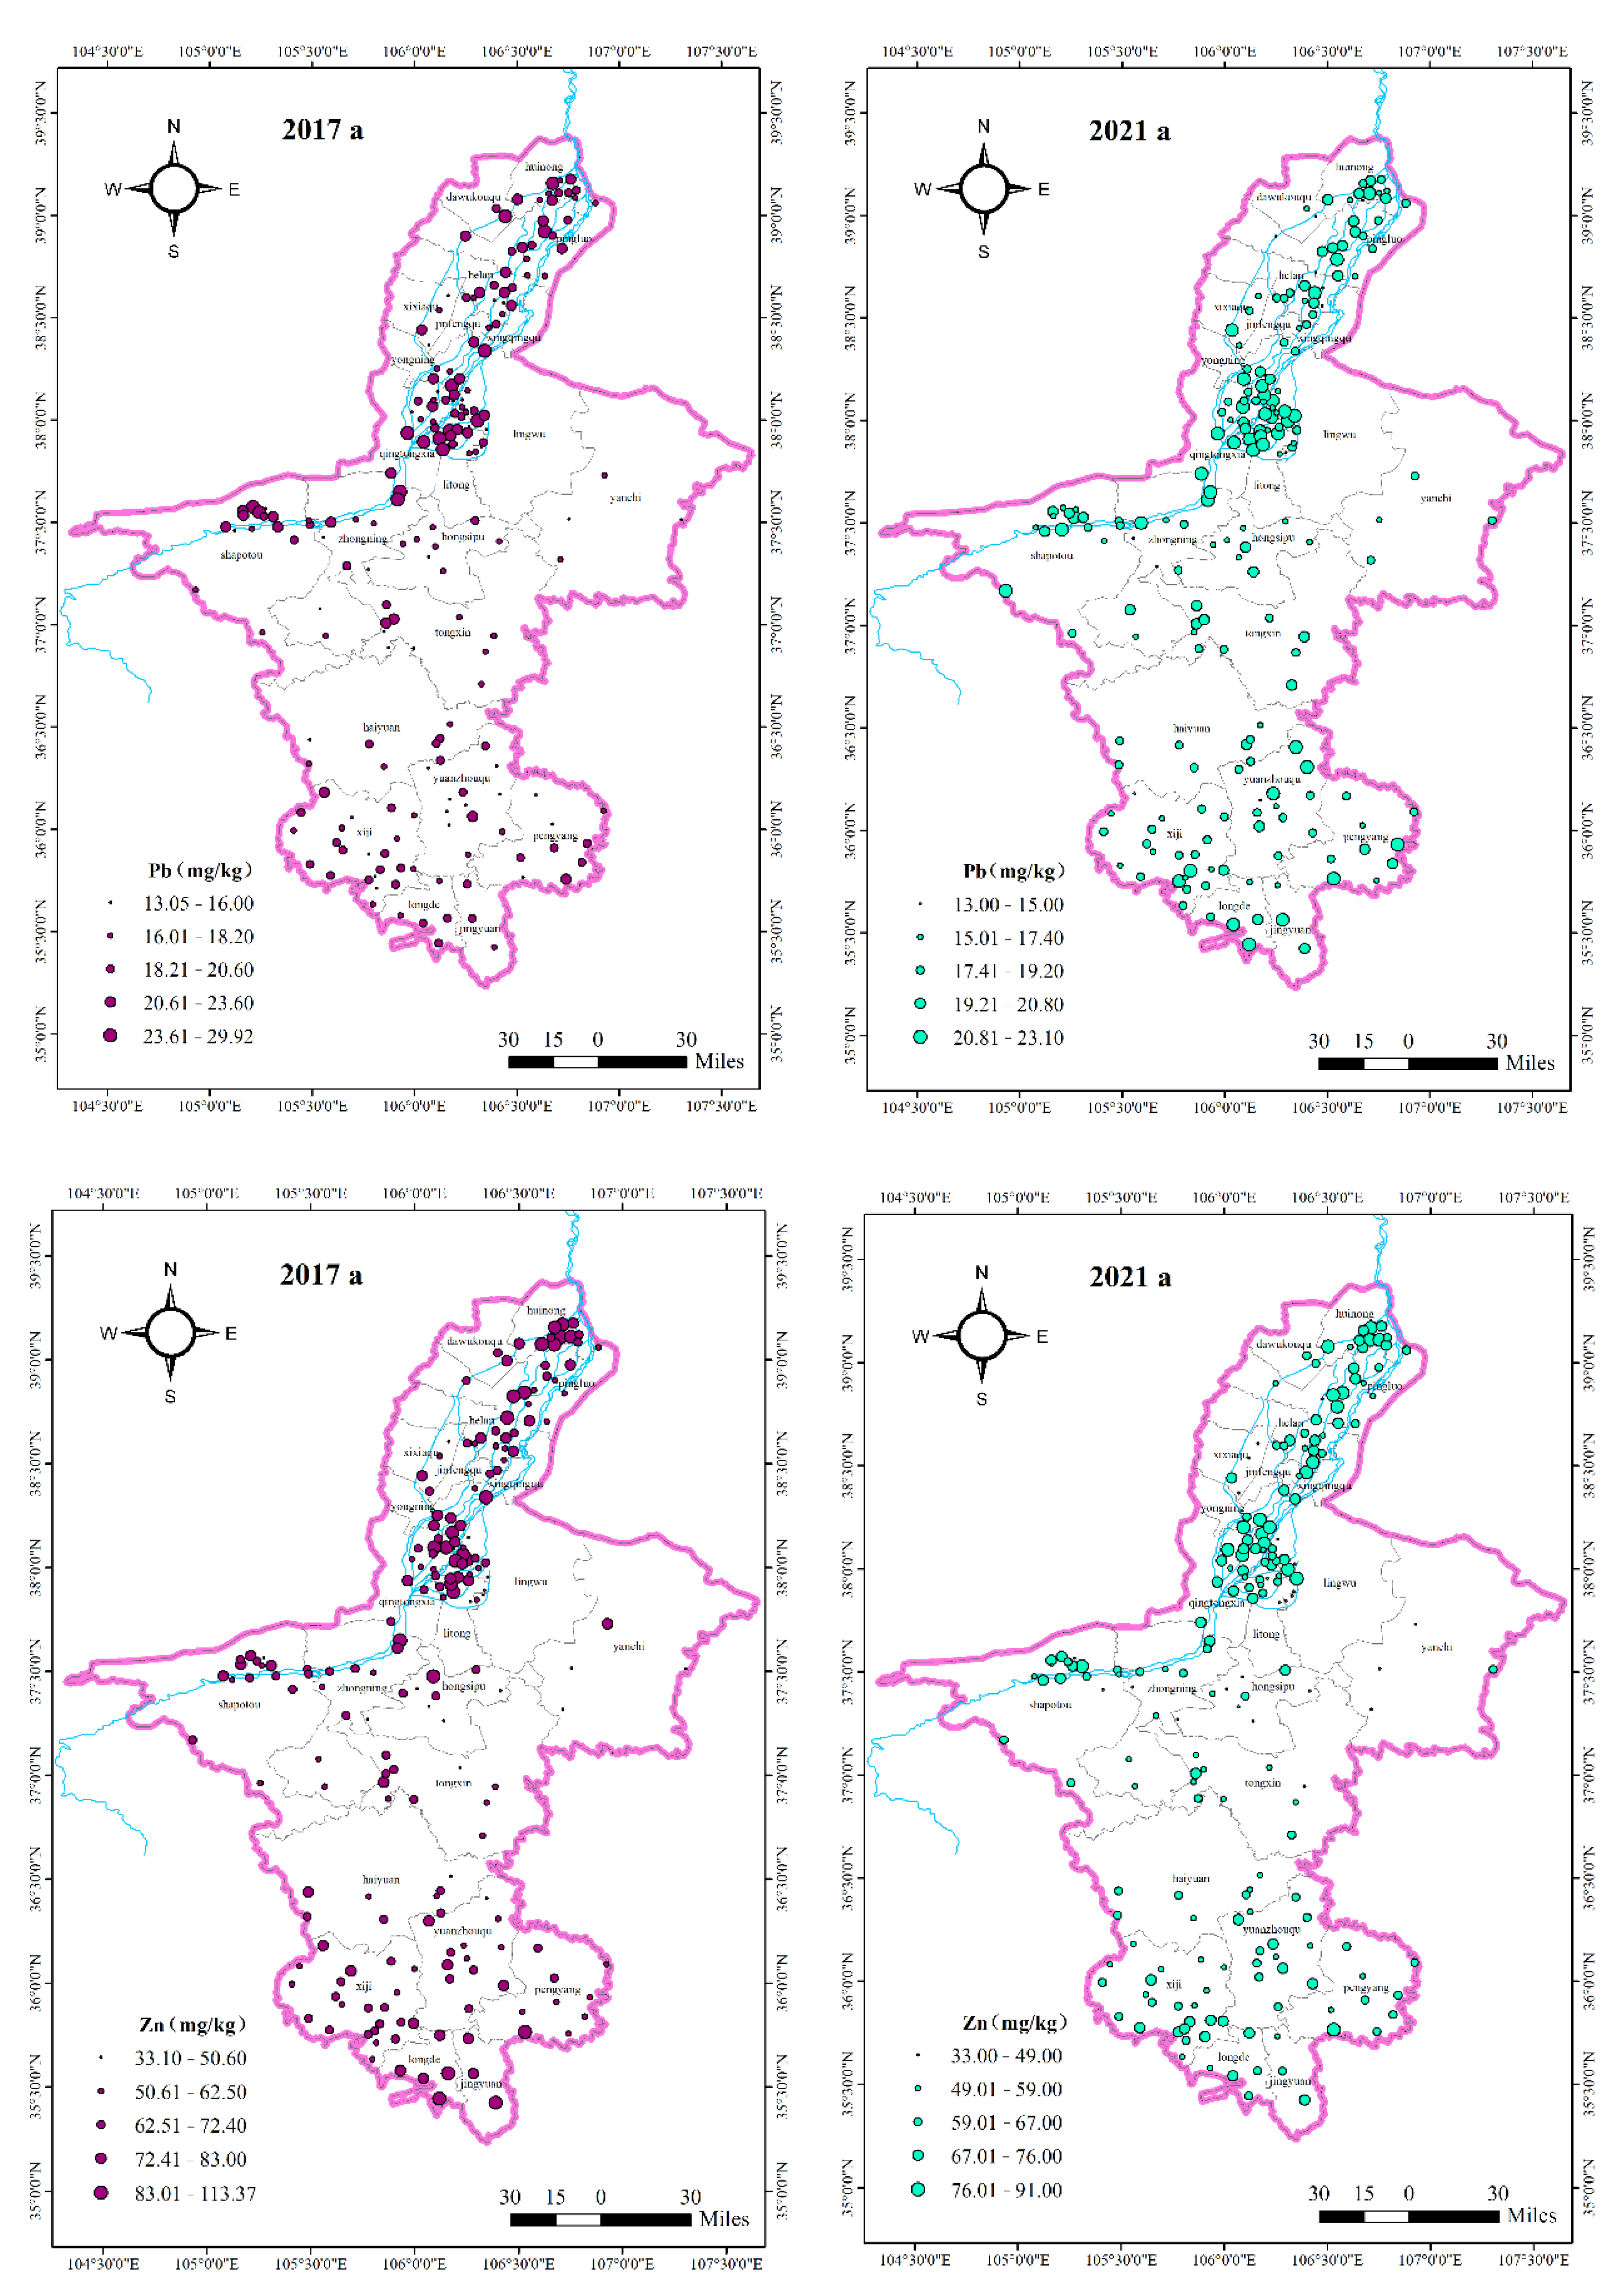
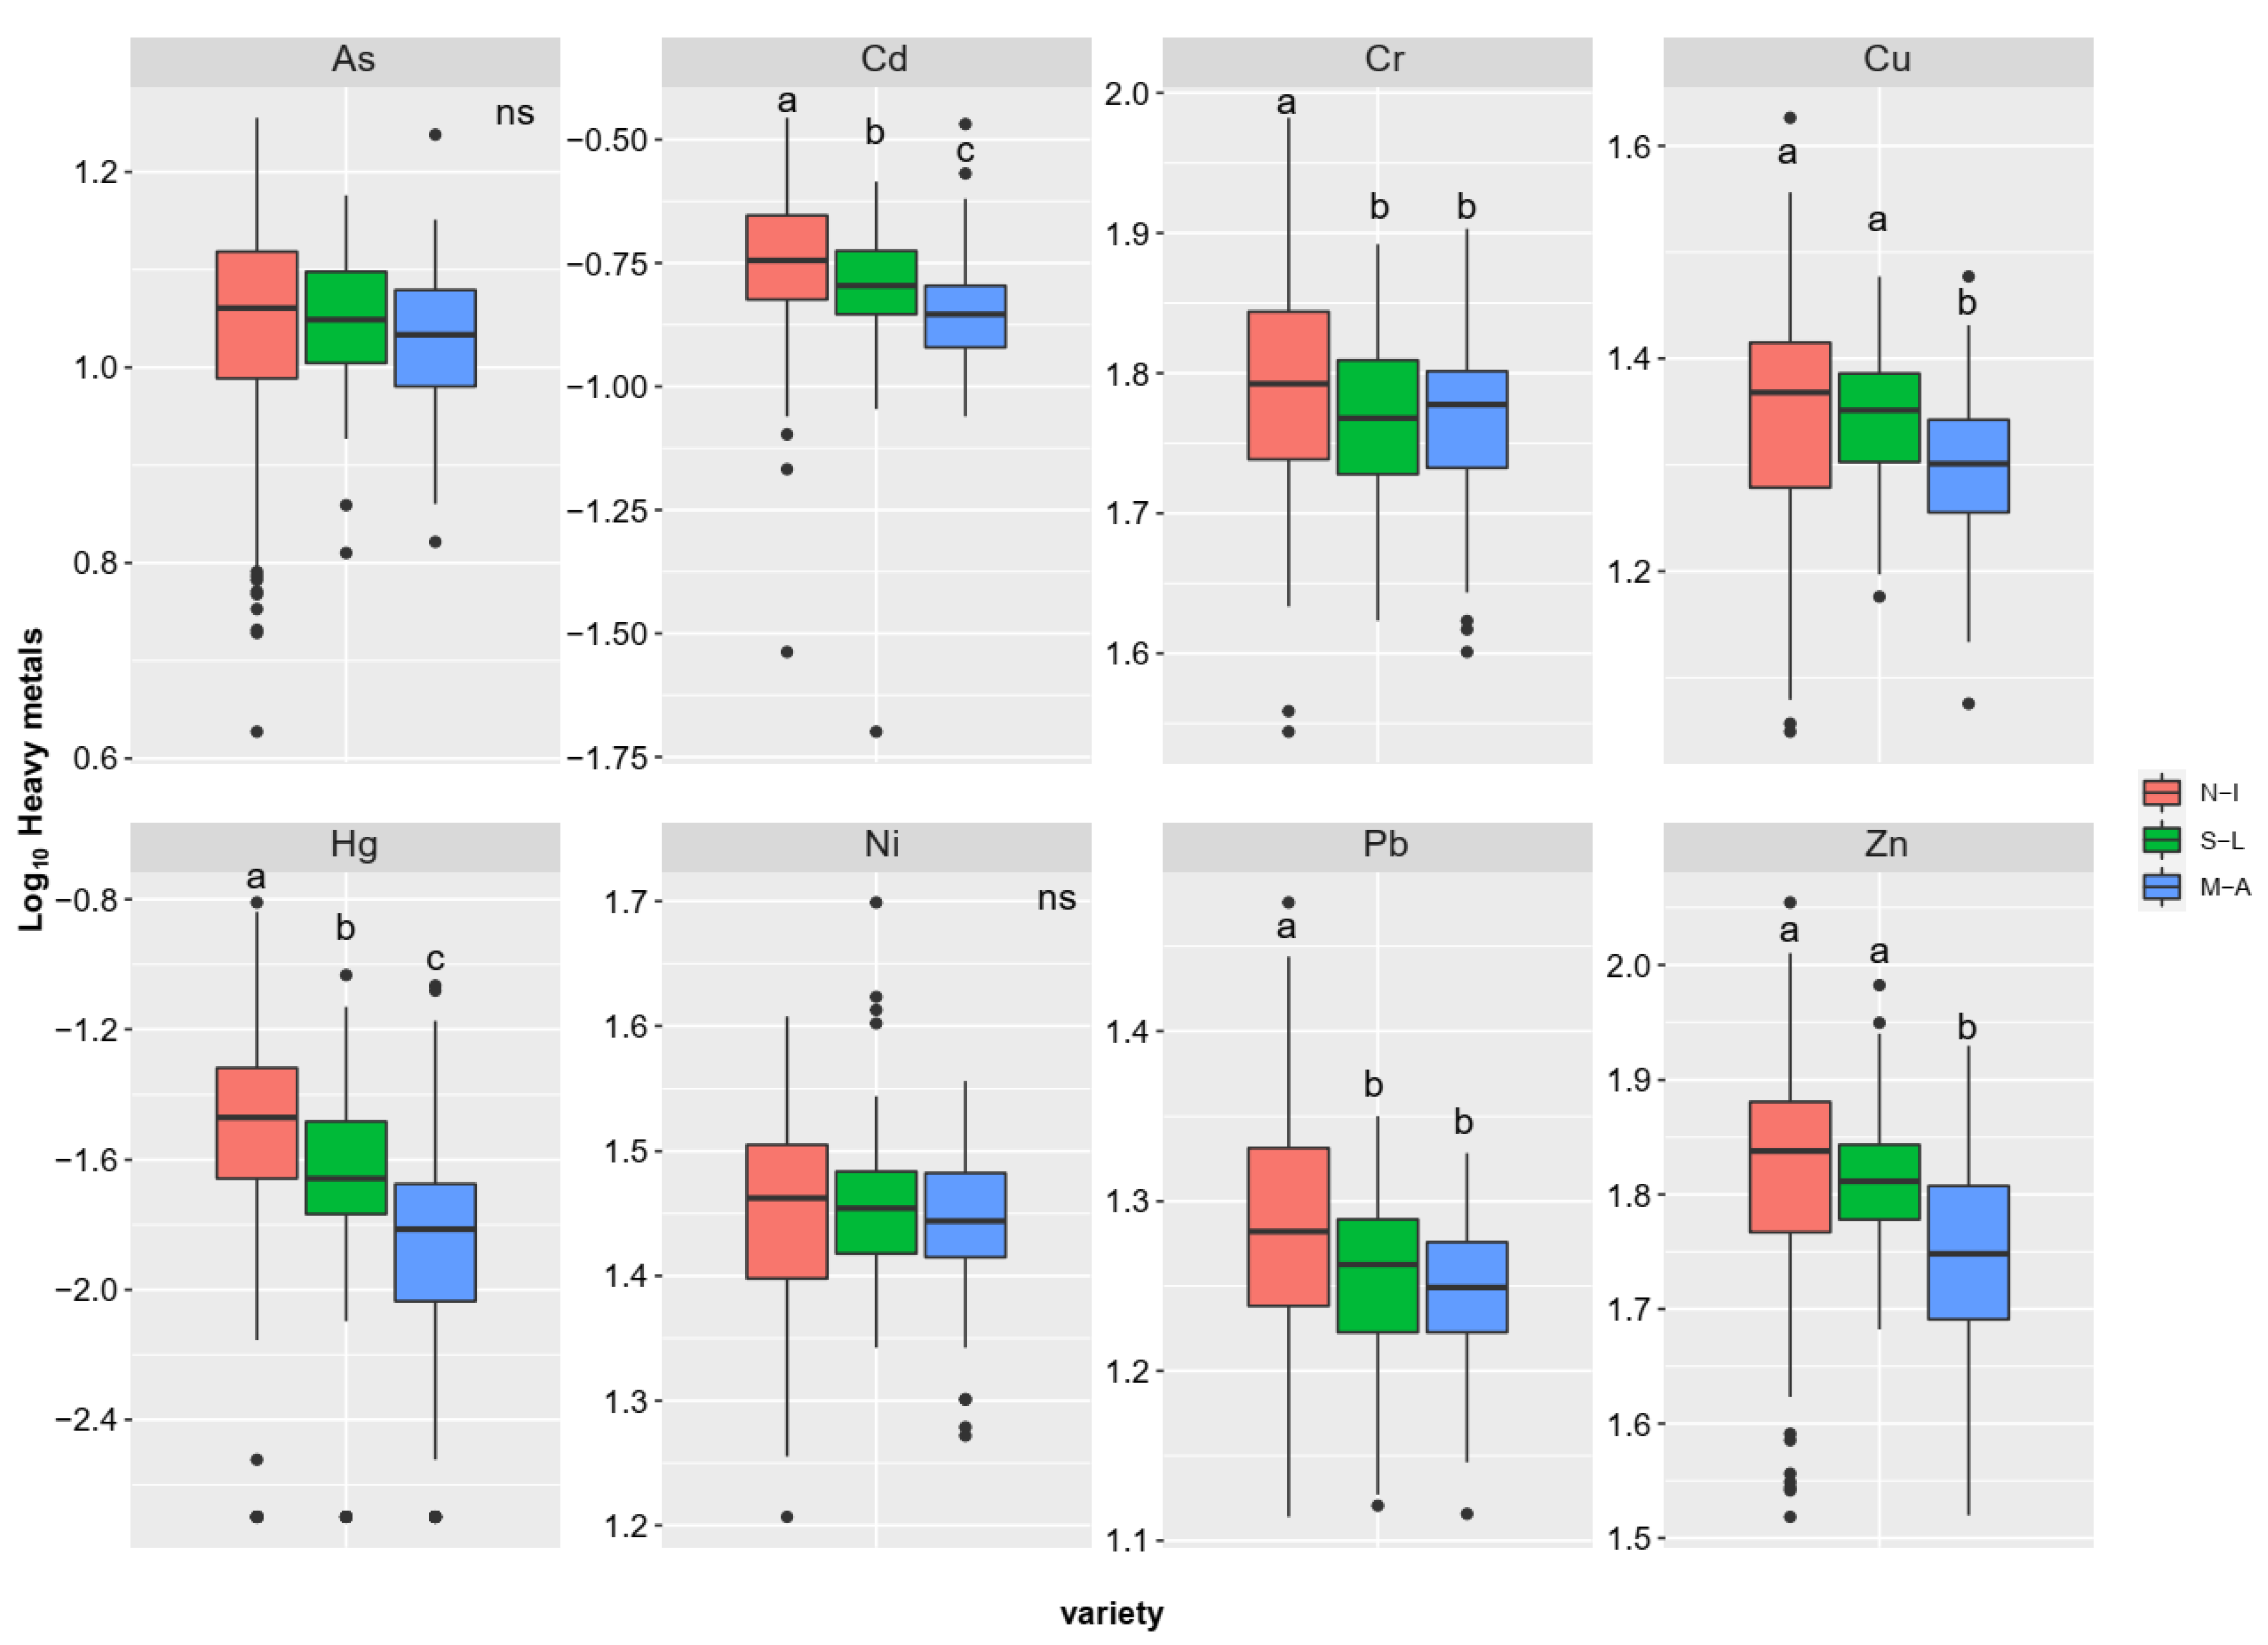
The heavy metal distributions of As, Cd, Cr, Hg, Pb, Cu, Zn, and Ni in 2017 and 2021 were identified, along with their spatial and temporal characteristics, in Ningxia (Figure 3). The results showed that hotspots with high heavy metal concentrations were mainly located in Yongning, Zhongning, Huinong, Helan, Shapotouqu, Pingluo, Litongqu, and Qingtongxia, the Yellow River irrigation area in Northern Ningxia (N-I) is with a long history of irrigated cultivation. The second hotspot areas were distributed in Longde, Jingyuan, Xiji, Yuanzhouqu, and Pengyang, where the Loess Hilly area (S-L) is in Southern Ningxia, with relatively high rainfall. The area with the lowest heavy metal concentration was the arid and semi-arid zone in Middle Ningxia (M-A), where most sites receive little rainfall and no irrigation (Figure 4 and Supplementary Table S2).
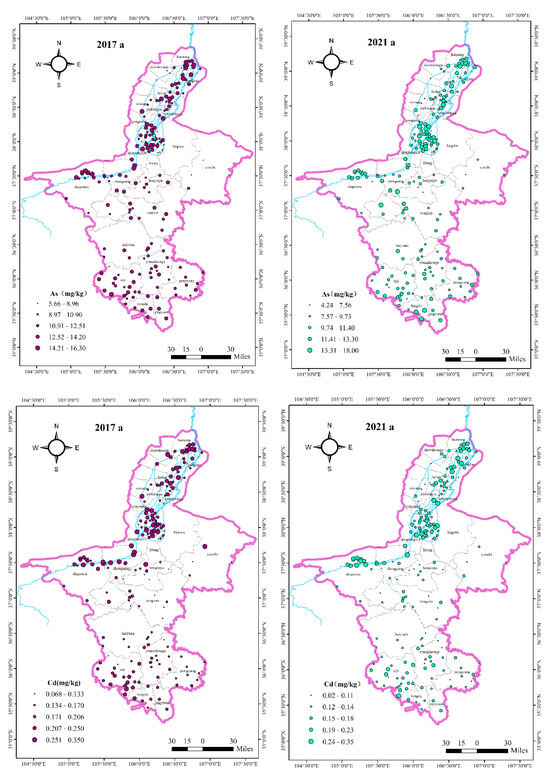
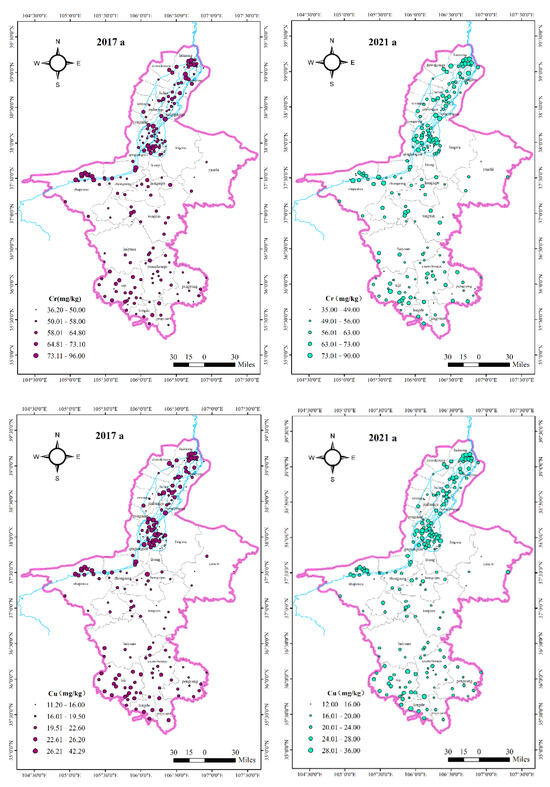
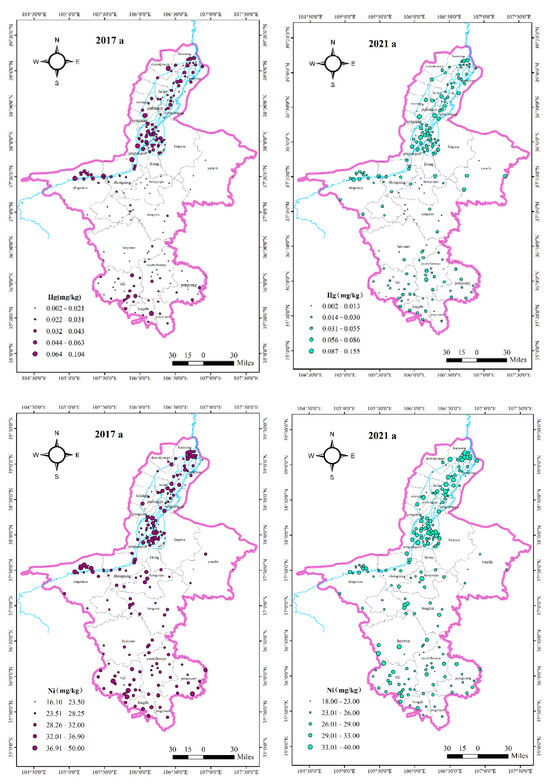
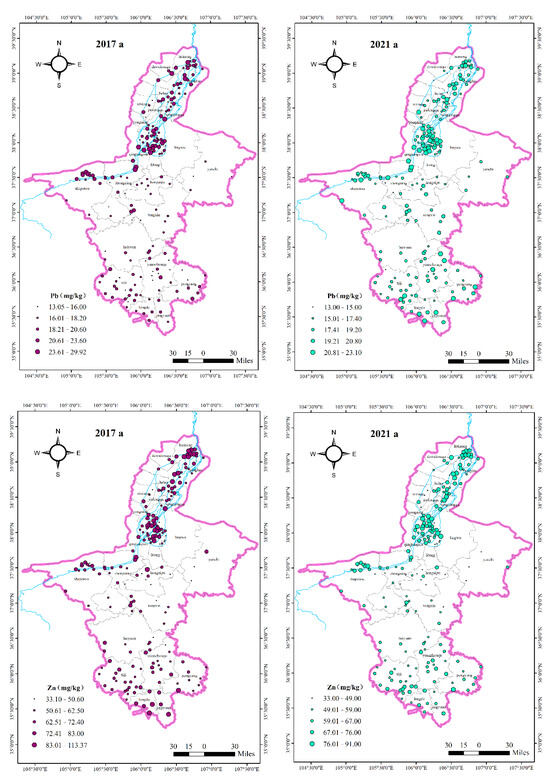
Figure 3.
Spatial distribution of soil heavy metal in Ningxia agricultural soils in 2017 and 2021.

Figure 4.
Comparison of soil heavy metal concentrations in different ecological zones. The vertical coordinate is the log-transformed heavy metal concentration. Note: Different lowercase letters indicate significant differences in different ecological zones.
In 2017, the highest concentrations were 16.30 g·kg−1, 0.35 g·kg−1, and 96.00 g·kg−1 for As, Cd, and Cr, respectively, and appeared in the Yongning. Pingluo was the hotspot of highest Cu and Zn concentrations, with 42.29 g·kg−1 and 113.37 g·kg−1, respectively. The concentration of Ni was the highest at 50 g·kg−1, which was significantly above the background value and appeared in Xiji of the Loess Hilly area. Lingwu and Shapotouqu were the hotspots with the highest concentrations of Hg and Pb at 0.10 g·kg−1 and 29.91 g·kg−1, respectively. In 2021, the concentrations of As, Cu, and Zn were highest at 18.00 g·kg−1, 36.00 g·kg−1, and 91.00 g·kg−1, respectively, and appeared in Huinong. The concentrations of Cr, Pb, and Ni were highest at 90.00 g·kg−1, 23.10 g·kg−1, and 40.00 g·kg−1, respectively, and appeared in the Lingwu. The highest concentration of Hg was 0.16 g·kg−1 and appeared in Qingtongxia. The top three highest concentrations of Cd were 0.35 g·kg−1, 0.32 g·kg−1, and 0.30 g·kg−1, respectively, and all were located in Shapotouqu.
The heavy metal concentrations in 2017 and 2021 were also compared to determine changes over time (Supplementary Table S3). The mean concentrations of As, Cd, Zn, and Ni in 2021 were 10.57 g·kg−1, 0.16 g·kg−1, 62.86 g·kg−1, and 27.96 g·kg−1, lower than those in 2017, which were 11.89 g·kg−1, 0.19 g·kg−1, 67.62 g·kg−1, and 29.53 g·kg−1 (p < 0.05). The mean concentration of Cu in 2021 was 23.04 g·kg−1, higher than that in 2017 of 21.36 g·kg−1 (p < 0.05). The mean concentration of Cr in 2021 was 61.13 g·kg−1, showing no significant increase compared to the Cr concentration in 2017 (p > 0.05). The mean concentration of Pb in 2021 was 18.74 g·kg−1, which was similar to that of 18.82 g·kg−1 in 2017, which showed a slight decrease (p > 0.05). The Hg concentrations in 2017 and 2021 were the same, both at 0.03 g·kg−1, but with different CVs.
3.4. Correlation Analysis
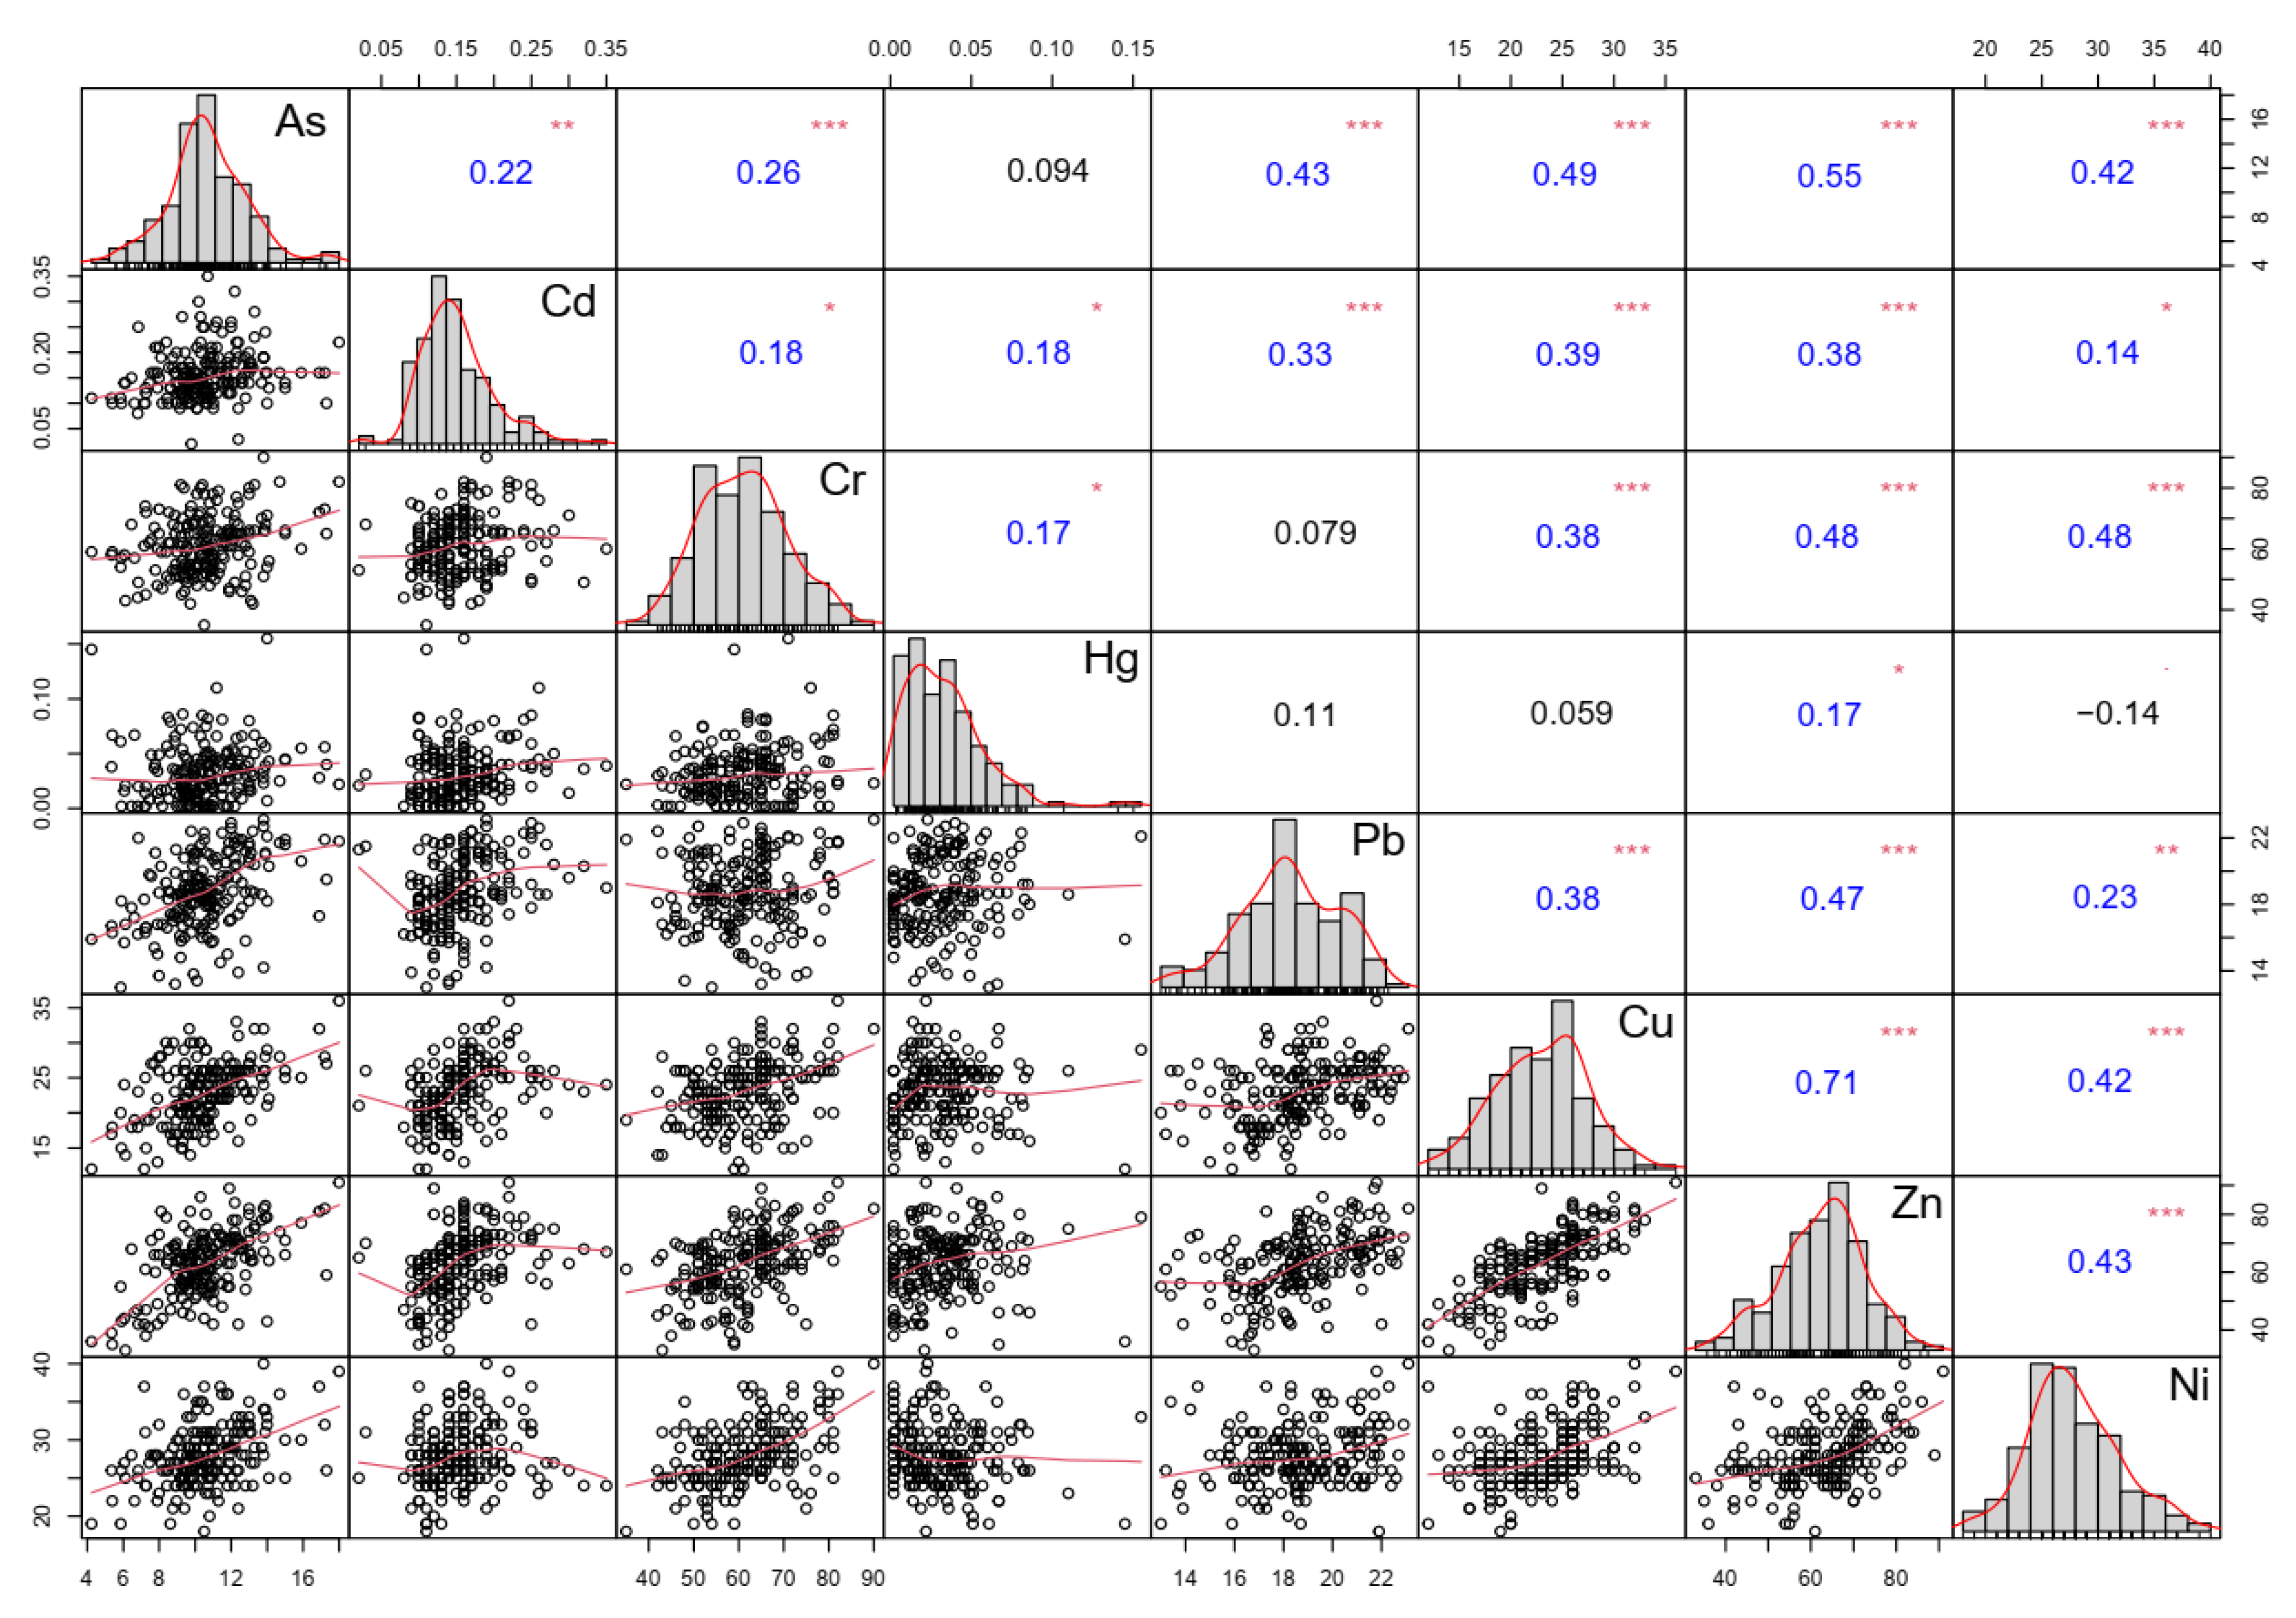
The Pearson correlation coefficients between heavy metals are shown in Figure 5, including the matrix scatter plot (lower left), histogram (diagonal), and correlation coefficient (upper right). The correlation coefficient and the fitted trend line of the scatter matrix showed a strong positive correlation (0.71) found between Cu and Zn, which confirmed the joint behavior of the two metals in Ningxia, as supported by the spatial deviation [17]. Pearson correlation coefficients indicated the positive correlations between most of the heavy metals in the soil samples of this study, demonstrating one or more common sources or influences [46]. However, the correlations between most of the heavy metals in this study were relatively weak (r < 0.60); Hg had the lowest correlation with the other heavy metals (r < 0.20), indicating a complex source of these soils due to the activities of human beings [16]. Furthermore, no significant negative correlation coefficients were found in the present study, implying that all the eight assessed heavy metals did not have antagonistic effects on each other [47].
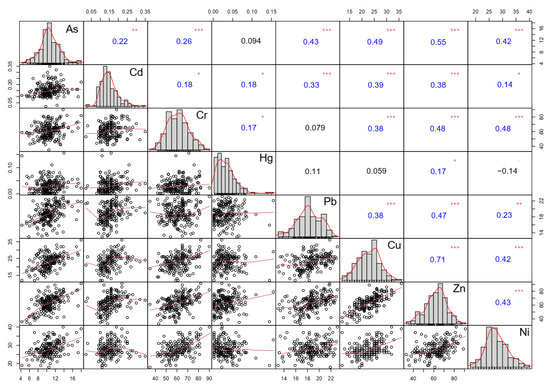
Figure 5.
Linear correlations between different heavy metals in soils, using scatter matrix analysis. Note: * meant the relevant level, *, p < 0.05; **, p < 0.01; ***, p < 0.001.
3.5. Quantify Sources of Soil Heavy Metals
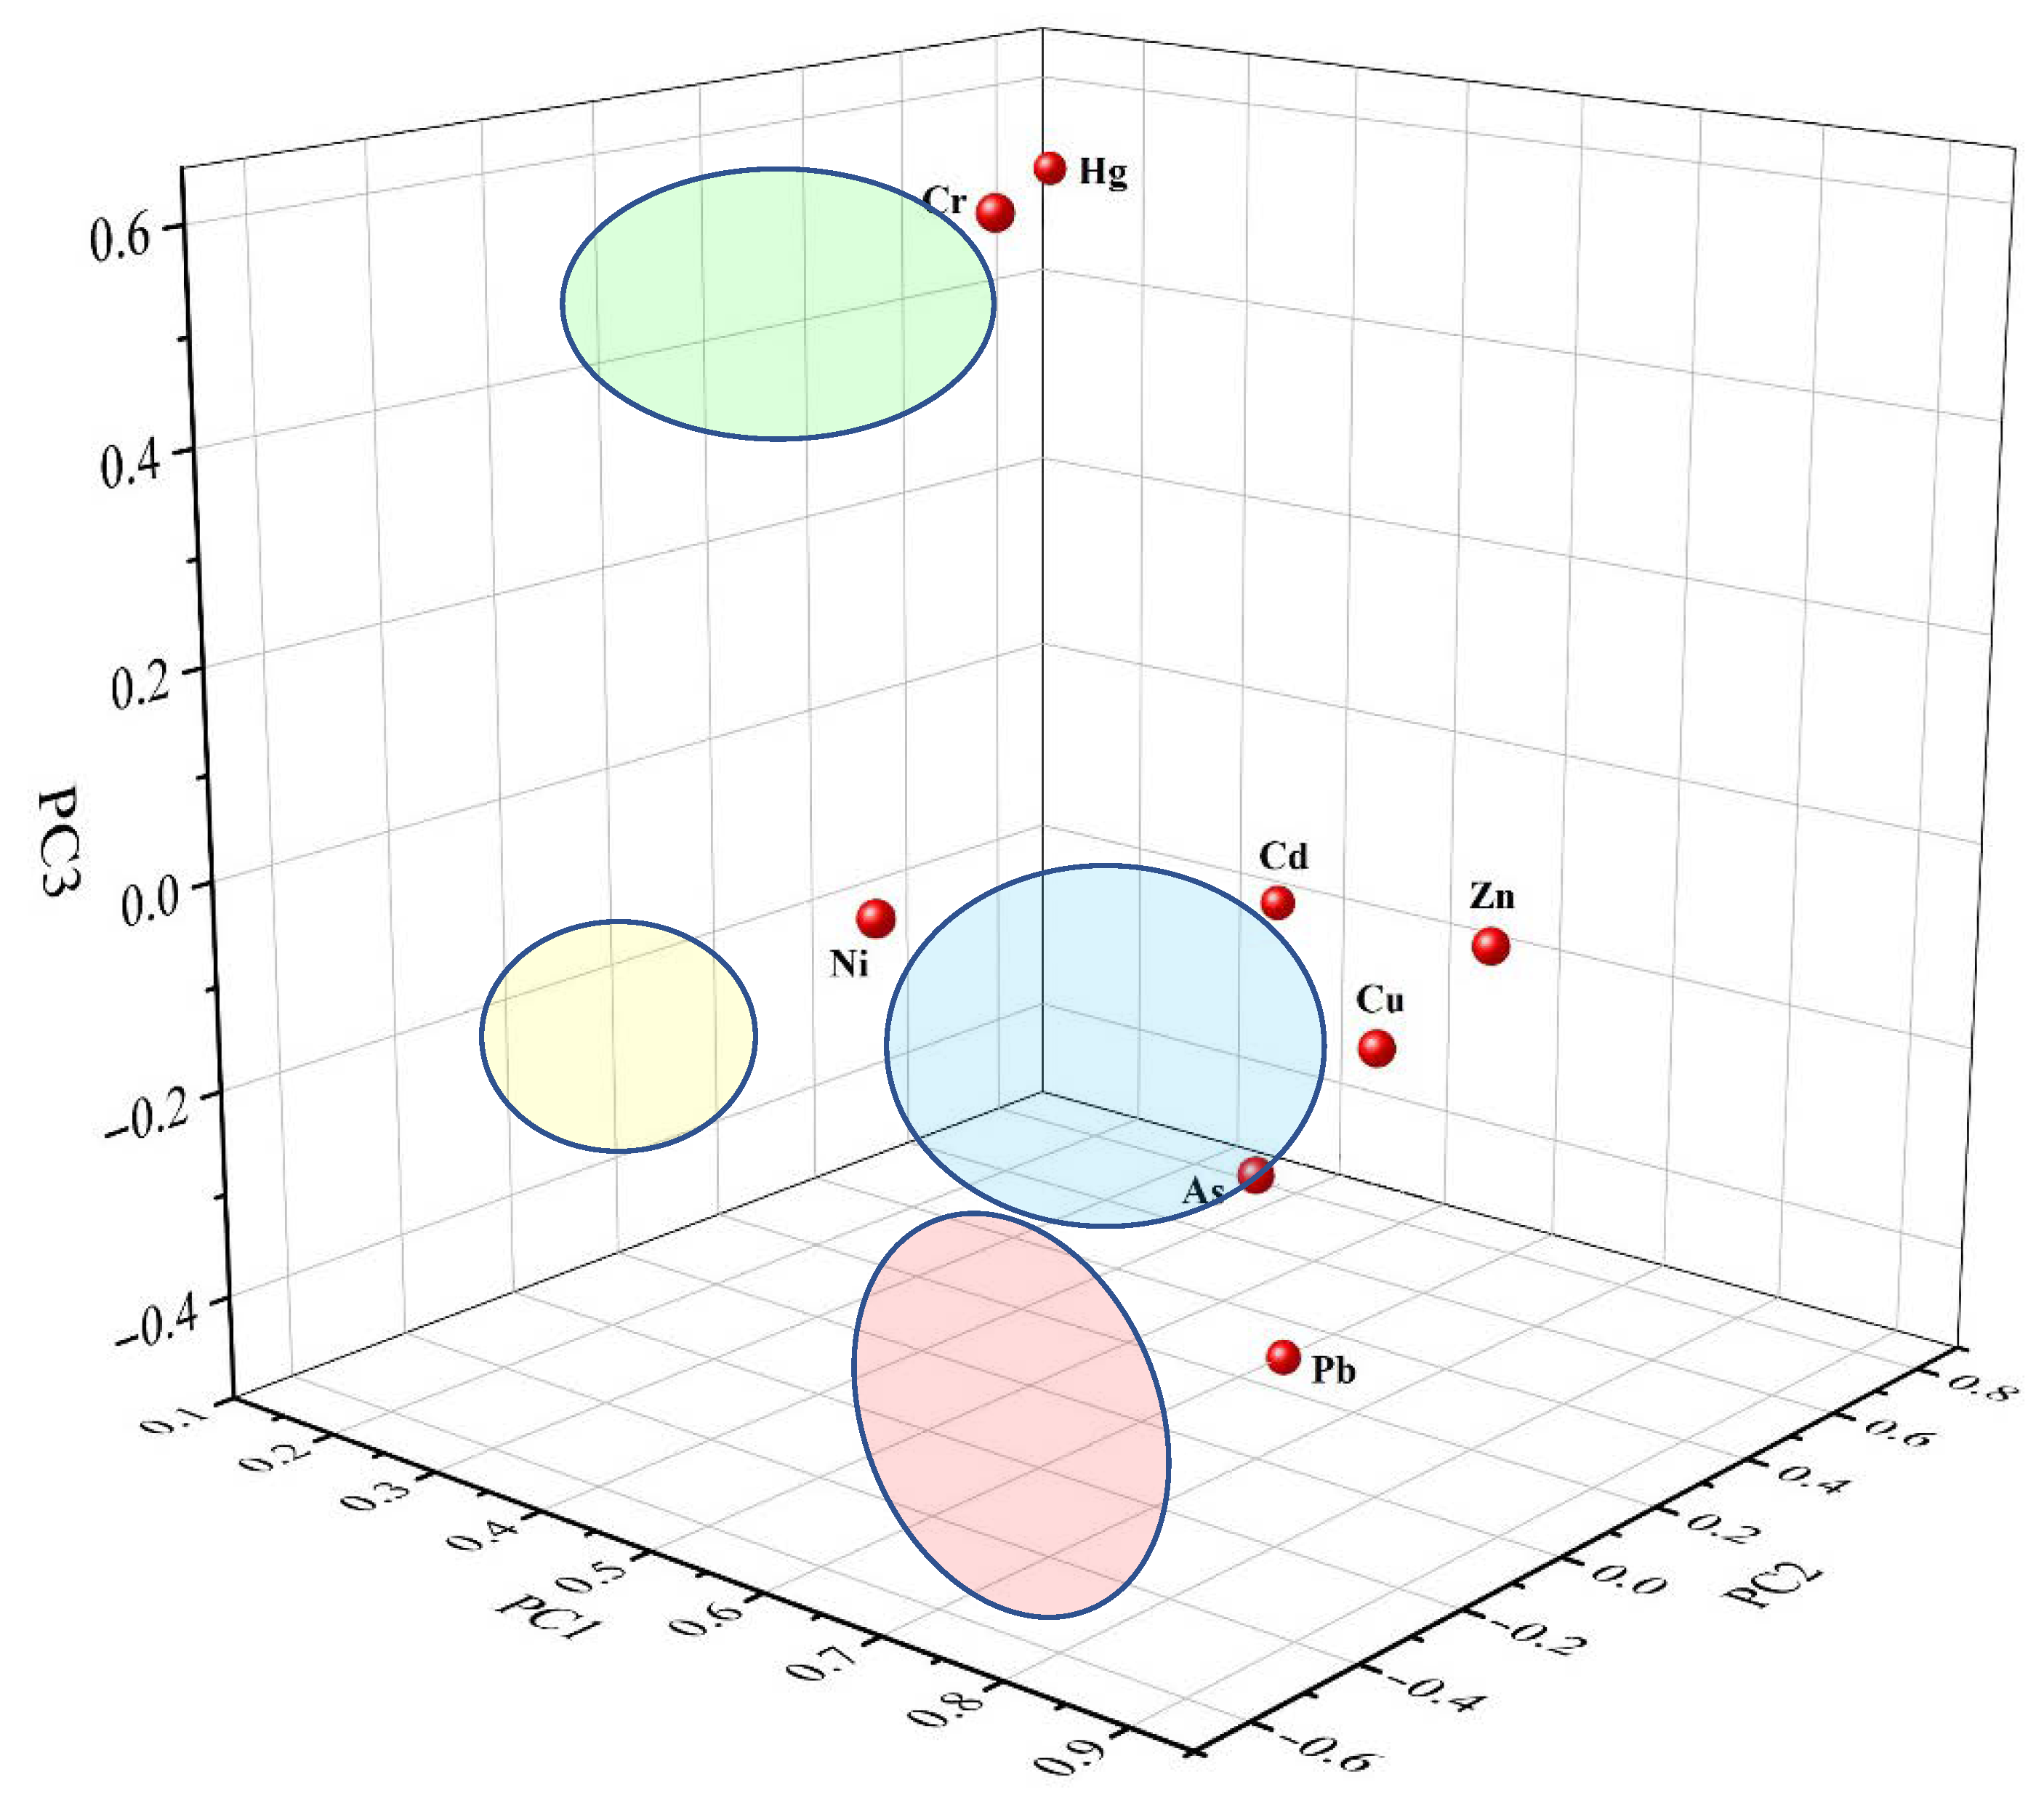
Although the positive correlations between heavy metals suggested that these elements have similar origins, the complex relationships between heavy metals were affected by various factors, so the conclusions of the correlation coefficients were not entirely comprehensive and precise [45]. To further investigate the relationships among heavy metals and the sources of each of them, we combined PCA and PMF models to determine the sources and contributions of soil heavy metal concentrations (Figure 6 and Supplementary Table S4). As a method of dimensionality reduction, a PCA using the nonrotational method was chosen to seek out the common characteristics of these heavy metal concentrations and to identify the sources [17]. PCA extracted three principal components which explained 69.69% of the overall variance.
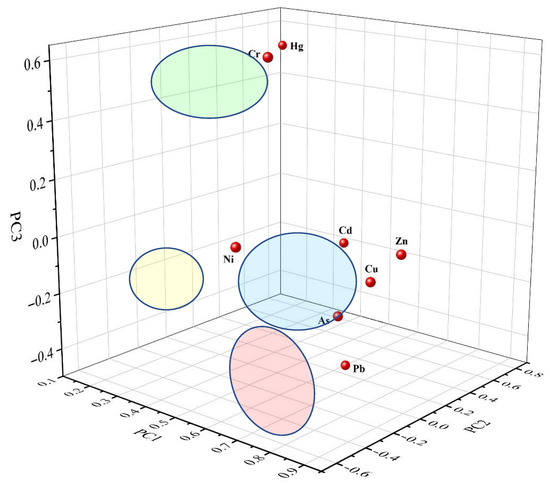
Figure 6.
Three-dimensional scatter loadings based on all principal components.
The first component (PC1) accounted for 41.93% of the overall variance, except for Hg, whose load is only 0.19; the loads of other heavy metals were greater than 0.50, and all heavy metals were positive loads. The second component (PC2) accounted for 15.03% of the overall variance, with a major loading on Hg (0.73) and moderate loadings on Cd (0.45) and Ni (−0.57). The third component (PC3) explained 12.73% of the overall variance, with a high loading on Cr (0.65), and it explained Hg (0.53) and Pb (−0.50) as moderate loadings. Variables with similar loadings are usually more strongly correlated with each other [19]. Based on the loadings and interrelationships of the factors, these eight heavy metals can be divided into Group 1 (Hg and Cr), Group 2 (Ni), Group 3 (As and Pb), and Group 4 (Zn, Cu, and Cd). For Group 1, the average concentrations of Hg and Cr in the soil were above their background values and obtained moderate pollution levels of Hg. Combined with the spatial distribution map (Figure 3), it can be observed that the enrichment of Hg and Cr was related to anthropogenic sources, especially to the Yellow River irrigation in Northern Ningxia. In Groups 2 and 3, the average concentrations of Ni, Pb, and As were lower than their background values and would be regarded as indicators of geochemical processing. In Group 4, the average concentrations of Zn, Cu, and Cd slightly over their background values and no-pollution-to-moderate-pollution levels of a few sites of Zn, Cu, and Cd were also obtained.
In general, there are two main pathways for the accumulation of heavy metals in soil, one is anthropogenic sources and the other is natural sources. Among the anthropogenic factors, agriculture, industry, and transportation account for a high proportion of heavy metal pollution of soil; meanwhile, among the natural sources, the largest contribution to soil heavy metal concentrations is made by the parent material of the soil and the soil formation process [22]. Moreover, PMF can be used to further quantitatively distinguish the sources of heavy metals and their contributions. In this study, most of the predicted residuals in the PMF model were appropriately located between −3.0 and 3.0, with predicted R2 > 0.65, which indicated that the factors selected can account for the source of information in the original data [24]. Therefore, the PMF model is suitable for explaining the sources of soil heavy metals in Ningxia farmland. The following four factors were derived (Figure 7A and Supplementary Figure S1).
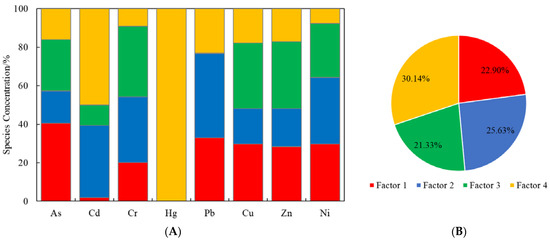
Figure 7.
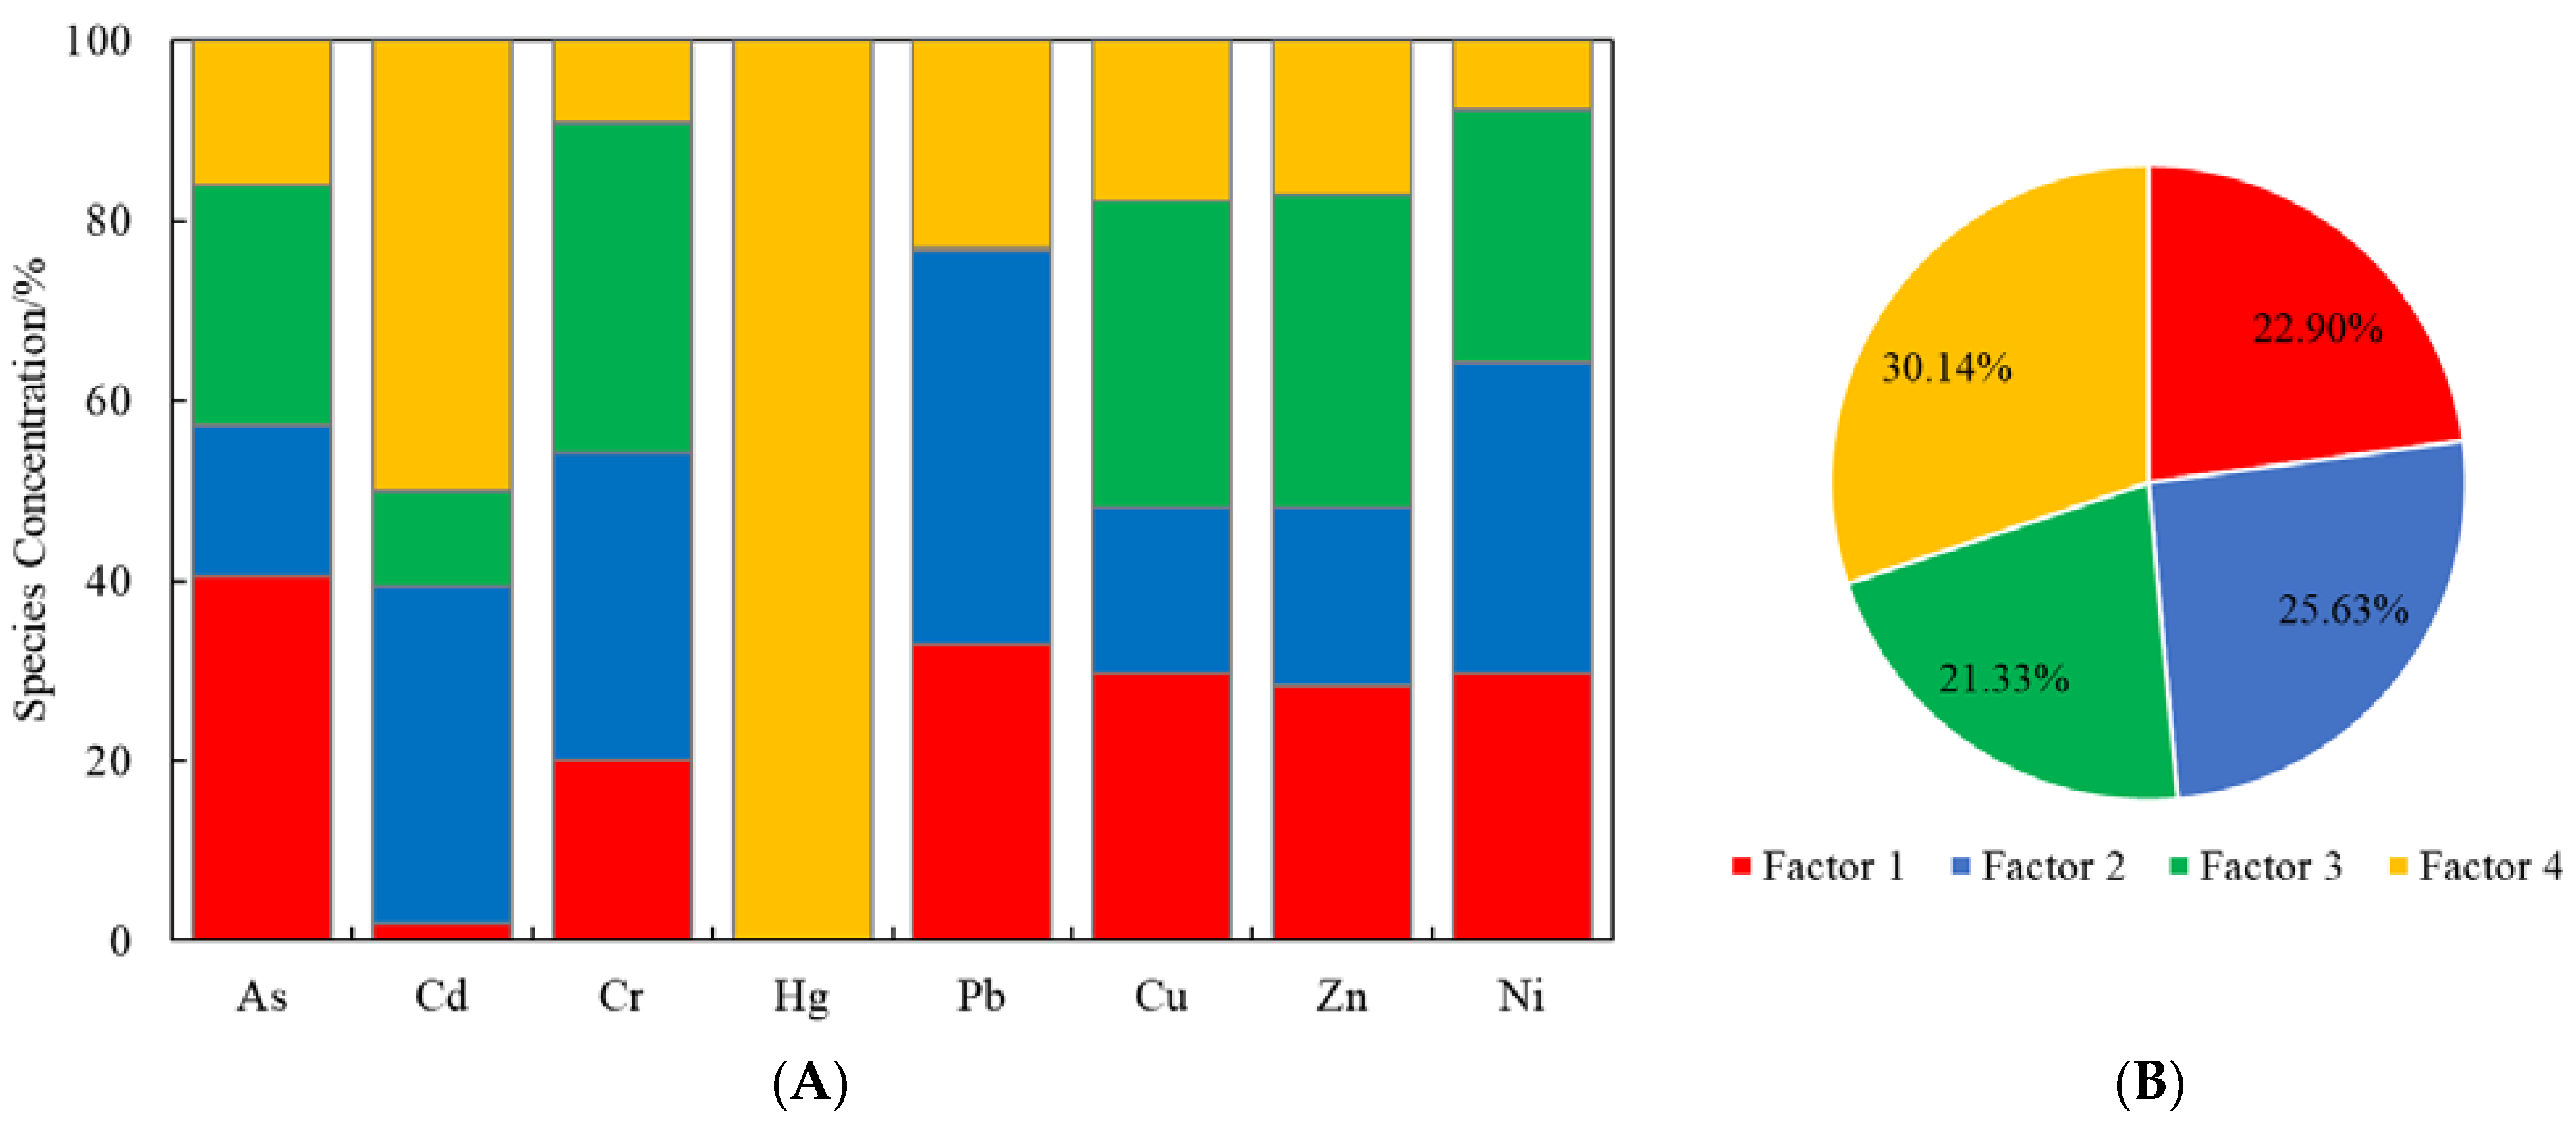
Results of soil heavy metals conducted by PMF model. Note: (A) is species concentrations of the heavy metals; (B) is the contribution of each source.
Factor 1 was dominated by As (40.53%). The As concentrations in most soil samples were approaching local natural soil background values, indicating that geochemical and geographic processes primarily control the spatial distribution of As. This was consistent with some research reporting that As in soils would mainly originate from soil parent materials [48]. Thus, Factor 1 was described as a natural source.
Factor 2 was mainly loaded on Pb (43.58%), Cd (37.60%), and Ni (34.62%). Generally, automobile exhaust emissions were a significant source of Pb. Despite the ban on the production, sale, and use of leaded gasoline in China since 2000, Pb from historical vehicle emissions is still present in the soils [49], and therefore atmospheric deposition is often labeled as a significant source of Pb accumulation in soils [50]. Furthermore, combustion emissions and coal mining could also be a significant contributor to atmospheric deposition of Pb [51], especially in Northern China, where it is customary to burn coal for heating in winter. The large Cd coefficient of variation (31.34%) may indicate a high anthropogenic influence, with an estimated 10-40% increase in Cd concentrations in agricultural soils since the late 1980s [52]. The highlighted contributing sites were the areas that surround the fly ash plants and mechanical forging plants and were therefore considered industrial sources [53]. Cd was often used as a plating layer on brake blocks to protect against corrosion [54], and several studies have shown that lubricants and petrochemicals can also contribute to an increased concentration of Cd in the environment [55], and thus Cd was considered to be a tracer of traffic exhaust [56]. A study by Duan et al. [57] found that soil Cd concentrations were significantly higher in farmland surrounding the enterprise than in farmland far from the enterprise, pointing to industrial activities and transport as important sources of heavy metals. Ni is used extensively in metallurgy, electroplating, and printing businesses [41,58]. Many studies have shown that Ni is derived from industrial activities such as steel production, ore smelting, and metal processing [49,59,60,61,62]. Combined with the spatial distribution maps of Cd, Ni, and Pb in Figure 3, there were many industrial facilities near most of the locations with high concentration values in 2021. In brief, Factor 2 was related to a comprehensive source of atmospheric deposition and industrial activities. However, it is difficult to distinguish between atmospheric deposition and industrial emissions that were considered potential sources by using the PMF model [50]. Therefore, further studies are needed at a later stage to distinguish industrial emission from atmospheric deposition [15].
Factor 3 was predominantly loaded on Cr (36.71%), Zn (34.60%), and Cu (33.82%). In China, agricultural activities are commonly emphasized as the main source of Zn and Cu accumulation in the soil [28]. In Ningxia, agriculture is the main source of revenue for local farmers, and therefore, the yields of agricultural products are often increased by using more chemical fertilizers, pesticides, and animal manure, which usually have high concentrations of Zn and Cu [61,63,64]. In addition, the study area is affected by a wide range of agricultural activities, including the application of sewage irrigation, especially to the north of Ningxia, which is a Yellow River irrigation area. These repeated agricultural activities continuously lead to high concentrations of Cu and Zn [19,65]. Zhang et al. [65], by collecting 464 published papers on Cr concentrations in China, found that the average concentration of Cr in agricultural soils was 78.94 mg kg−1, which has exceeded the national background value. This result suggests that human agricultural activities have led to an increase in Cr concentration in agricultural soils. Therefore, Factor 3 is related to agricultural activities.
The largest contribution of Hg (100.00%) was found in Factor 4. In previous studies, Hg was specifically singled out as a component of source analysis [66,67]. In particular, coal mining and coal combustion lead to the accumulation of Hg in soils [45]. One study found that about 40% of Hg in Chinese agricultural soils came from coal combustion, representing >70% of the overall atmospheric Hg input [68]. Mainly, the high volatility of Hg compared to other heavy metals makes it more likely to enter the flue gas during coal combustion [14,69], which eventually leads to the accumulation of Hg in soil through atmospheric deposition [67,70]. Thus, coal combustion is often considered the most prominent source of Hg in China [39,71]. According to the spatial distribution map, most of the monitored Hg enrichment sites are closely linked to coal industrial activity areas, which, combined with the high coefficient of variation (up to 77.51% for Hg in this study), can indicate that Hg accumulation is strongly influenced by industrial activities [72]. Therefore, Factor 4 can be considered as an industrial activity associated with coal.
The contribution of each source to the overall concentration of heavy metals in soils, as estimated by the PMF model, was greatest for coal-related industrial activities (30.14%), followed by atmospheric deposition and industrial activities (25.63%), natural sources (22.90%), and agricultural activities (21.33%) (Figure 7B), with a small difference in the percentage contribution of the four sources. However, it can be seen that heavy metal enrichment in farmland in Ningxia is mainly influenced by anthropogenic activities rather than natural processes, meaning that the accumulation of heavy metals in farmland in the region is dominated by anthropogenic sources rather than natural sources. In addition, although the classification of each heavy metal by the correlation analysis, PCA, and PMF was slightly different, several methods provided some basis for the discrimination of certain factors in determining the sources of heavy metals. It should also be noted that more precise methods, such as the isotope ratio analysis, can be used in future studies to improve the reliability of source classification.
4. Conclusions
In this study, the concentrations of eight heavy metals in the topsoil of Ningxia farmland were investigated, in which the average concentrations of Cd, Cr, Hg, Cu, and Zn were higher than the background values of Ningxia soil. The level of heavy metal contamination in farmland at the surveyed sites ranged from no to moderate contamination, with no heavy contamination.
In terms of spatial distribution, the concentration of heavy metals in farmland soils in the Yellow River irrigation area in Northern Ningxia was higher than that in the arid and semi-arid area in middle Ningxia and the Loess Hilly area in Southern Ningxia, which needs be paid attention to and monitored in future work.
The PMF model identified natural sources, atmospheric deposition and industrial activities, agricultural activities, and coal-related industrial activities as the main sources of heavy metals in Ningxia farmlands, and the contribution of these four sources was similar. We hope that the above research results will have reference significance for the prevention and management of heavy metal pollution in the agricultural soils of Ningxia.
Supplementary Materials
The following supporting information can be downloaded at https://www.mdpi.com/article/10.3390/su152115360/s1, Table S1: Evaluation criteria for Igeo values; Table S2: Descriptive statistics of soil physicochemical properties and heavy metals in different ecological zones in 2021; Table S3: Descriptive statistics of physicochemical properties and heavy metals in soils in 2017 and 2021; Table S4: Result of principal component analysis of soil heavy metal; Figure S1: Profiles and contributions of sources of heavy metals from PMF model.
Author Contributions
L.C., conceptualization, methodology, investigation, and writing—original draft; K.M., conceptualization, data curation, investigation, and writing—original draft. All authors have read and agreed to the published version of the manuscript.
Funding
This work was supported by the National Natural Science Foundation of China (32360423), the Key Research and Development Program of the Ningxia Hui Autonomous Region (2021BEG02005), and the Third Batch of Ningxia Youth Talents Supporting Program (TJGC2018068).
Informed Consent Statement
Not applicable.
Data Availability Statement
The corresponding author can provide access to the original datasets used and analyzed in this article upon receiving a reasonable request.
Conflicts of Interest
The author declares no competing interest.
References
- Zhang, M.; He, P.; Qiao, G.; Huang, J.; Yuan, X.; Li, Q. Heavy metal contamination assessment of surface sediments of the Subei Shoal, China: Spatial distribution, source apportionment and ecological risk. Chemosphere 2019, 223, 211–222. [Google Scholar] [CrossRef] [PubMed]
- Jia, X.; Fu, T.; Hu, B.; Shi, Z.; Zhou, L.; Zhu, Y. Identification of the potential risk areas for soil heavy metal pollution based on the source-sink theory. J. Hazard. Mater. 2020, 393, 122424. [Google Scholar] [CrossRef]
- Men, C.; Wang, Y.; Liu, R.; Wang, Q.; Miao, Y.; Jiao, L.; Shoaib, M.; Shen, Z. Temporal variations of levels and sources of health risk associated with heavy metals in road dust in Beijing from May 2016 to April 2018. Chemosphere 2021, 270, 129434. [Google Scholar] [CrossRef]
- Han, W.; Gao, G.; Geng, J.; Li, Y.; Wang, Y. Ecological and health risks assessment and spatial distribution of residual heavy metals in the soil of an e-waste circular economy park in Tianjin, China. Chemosphere 2018, 197, 325–335. [Google Scholar] [CrossRef] [PubMed]
- Burges, A.; Epelde, L.; Garbisu, C. Impact of repeated single-metal and multi-metal pollution events on soil quality. Chemosphere 2015, 120, 8–15. [Google Scholar] [CrossRef] [PubMed]
- Smith, D.B.; Cannon, W.F.; Woodruff, L.G.; Solano, F.; Kilburn, J.E.; Fey, D.L. Geochemical and mineralogical data for soils of the conterminous United States: U.S. Geol. Surv. Data Ser. 2013, 801, 19. [Google Scholar]
- Barsova, N.; Yakimenko, O.; Tolpeshta, I.; Motuzova, G. Current state and dynamics of heavy metal soil pollution in Russian Federation—A review. Environ. Pollut. 2019, 249, 200–207. [Google Scholar] [CrossRef]
- Zhang, F.; Li, G. China released the Action Plan on Prevention and Control of Soil Pollution. Front. Environ. Sci. Eng. 2016, 10, 19. [Google Scholar]
- Rinklebe, J.; Shaheen, S.M. Geochemical distribution of Co, Cu, Ni, and Zn in soil profiles of Fluvisols, Luvisols, Gleysols, and Calcisols originating from Germany and Egypt. Geoderma 2017, 307, 122–138. [Google Scholar] [CrossRef]
- Gabarrón, M.; Faz, A.; Acosta, J.A. Use of multivariable and redundancy analysis to assess the behavior of metals and arsenic in urban soil and road dust affected by metallic mining as a base for risk assessment. J. Environ. Manag. 2018, 206, 192–201. [Google Scholar] [CrossRef]
- Xue, P.; Zhao, Q.; Sun, H.; Geng, L.; Yang, Z.; Liu, W. Characteristics of heavy metals in soils and grains of wheat and maize from farmland irrigated with sewage. Environ. Sci. Pollut. Res. 2019, 26, 5554–5563. [Google Scholar] [CrossRef] [PubMed]
- Yadav, I.C.; Devi, N.L.; Singh, V.K.; Li, J.; Zhang, G. Spatial distribution, source analysis, and health risk assessment of heavy metals contamination in house dust and surface soil from four major cities of Nepal. Chemosphere 2019, 218, 1100–1113. [Google Scholar] [CrossRef] [PubMed]
- Wu, Q.; Hu, W.; Wang, H.; Liu, P.; Wang, X.; Huang, B. Spatial distribution, ecological risk and sources of heavy metals in soils from a typical economic development area, Southeastern China. Sci. Total Environ. 2021, 780, 146557. [Google Scholar] [CrossRef]
- Liu, P.; Wu, Q.; Wang, X.; Hu, W.; Liu, X.; Tian, K.; Fan, Y.N.; Xie, E.; Zhao, Y.; Huang, B.; et al. Spatiotemporal variation and sources of soil heavy metals along the lower reaches of Yangtze River, China. Chemosphere 2022, 291, 132768. [Google Scholar] [CrossRef] [PubMed]
- Hossain Bhuiyan, M.A.; Chandra Karmaker, S.; Bodrud-Doza, M.; Rakib, M.A.; Saha, B.B. Enrichment, sources and ecological risk mapping of heavy metals in agricultural soils of dhaka district employing SOM, PMF and GIS methods. Chemosphere 2021, 263, 128339. [Google Scholar] [CrossRef]
- Liu, H.; Zhang, Y.; Yang, J.; Wang, H.; Li, Y.; Shi, Y.; Li, D.; Holm, P.E.; Ou, Q.; Hu, W. Quantitative source apportionment, risk assessment and distribution of heavy metals in agricultural soils from southern Shandong Peninsula of China. Sci. Total Environ. 2021, 767, 144879. [Google Scholar] [CrossRef]
- Dong, B.; Zhang, R.; Gan, Y.; Cai, L.; Freidenreich, A.; Wang, K.; Guo, T.; Wang, H. Multiple methods for the identification of heavy metal sources in cropland soils from a resource-based region. Sci. Total Environ. 2019, 651, 3127–3138. [Google Scholar] [CrossRef]
- Liu, G.; Wang, J.; Liu, X.; Liu, X.; Li, X.; Ren, Y.; Wang, J.; Dong, L. Partitioning and geochemical fractions of heavy metals from geogenic and anthropogenic sources in various soil particle size fractions. Geoderma 2018, 312, 104–113. [Google Scholar] [CrossRef]
- Guan, Q.; Wang, F.; Xu, C.; Pan, N.; Lin, J.; Zhao, R.; Yang, Y.; Luo, H. Source apportionment of heavy metals in agricultural soil based on PMF: A case study in Hexi Corridor, northwest China. Chemosphere 2018, 193, 189–197. [Google Scholar] [CrossRef]
- Kashem, M.A.; Singh, B.R. Metal availability in contaminated soils: I. Effects of floodingand organic matter on changes in Eh, pH and solubility of Cd, Ni andZn. Nutr. Cycl. Agroecosyst. 2001, 61, 247–255. [Google Scholar] [CrossRef]
- Zhang, Q.; Zhang, X. Quantitative source apportionment and ecological risk assessment of heavy metals in soil of a grain base in Henan Province, China, using PCA, PMF modeling, and geostatistical techniques. Environ. Monit. Assess. 2021, 193, 655. [Google Scholar] [CrossRef] [PubMed]
- Wang, J.; Wu, H.; Wei, W.; Xu, C.; Tan, X.; Wen, Y.; Lin, A. Health risk assessment of heavy metal(loid)s in the farmland of megalopolis in China by using APCS-MLR and PMF receptor models: Taking Huairou District of Beijing as an example. Sci. Total Environ. 2022, 835, 155313. [Google Scholar] [CrossRef] [PubMed]
- Heidari, M.; Darijani, T.; Alipour, V. Heavy metal pollution of road dust in a city and its highly polluted suburb; quantitative source apportionment and source-specific ecological and health risk assessment. Chemosphere 2021, 273, 129656. [Google Scholar] [CrossRef] [PubMed]
- Luo, H.; Wang, Q.; Guan, Q.; Ma, Y.; Ni, F.; Yang, E.; Zhang, J. Heavy metal pollution levels, source apportionment and risk assessment in dust storms in key cities in Northwest China. J. Hazard. Mater. 2022, 422, 126878. [Google Scholar] [CrossRef] [PubMed]
- Xia, Z.S.; Bai, Y.R.; Wang, Y.Q.; Guo, X.L.; Ruan, X.A.; Zhong, Y.X. Spatial distribution and source analysis of soil heavy metals in a small watershed in the mountainous area of southern Ningxia based on PMF model. Environ. Sci. 2022, 43, 432–441. [Google Scholar]
- Li, Z.; Ma, Z.; van der Kuijp, T.J.; Yuan, Z.; Huang, L. A review of soil heavy metal pollution from mines in China: Pollution and health risk assessment. Sci. Total Environ. 2014, 468–469, 843–853. [Google Scholar] [CrossRef]
- Huang, C.-L.; Bao, L.-J.; Luo, P.; Wang, Z.-Y.; Li, S.-M.; Zeng, E.Y. Potential health risk for residents around a typical e-waste recycling zone via inhalation of size-fractionated particle-bound heavy metals. J. Hazard. Mater. 2016, 317, 449–456. [Google Scholar] [CrossRef]
- Yang, S.; Zhou, D.; Yu, H.; Wei, R.; Pan, B. Distribution and speciation of metals (Cu, Zn, Cd, and Pb) in agricultural and non-agricultural soils near a stream upriver from the Pearl River, China. Environ. Pollut. 2013, 177, 64–70. [Google Scholar] [CrossRef]
- Yuanan, H.; He, K.; Sun, Z.; Chen, G.; Cheng, H. Quantitative source apportionment of heavy metal(loid)s in the agricultural soils of an industrializing region and associated model uncertainty. J. Hazard. Mater. 2020, 391, 122244. [Google Scholar] [CrossRef]
- Mi, L.; Tian, J.; Si, J.; Chen, Y.; Li, Y.; Wang, X. Evolution of Groundwater in Yinchuan Oasis at the Upper Reaches of the Yellow River after Water-Saving Transformation and Its Driving Factors. Int. J. Environ. Res. Public Health 2020, 17, 1304. [Google Scholar] [CrossRef]
- Xu, J.; Wang, S.; Xiao, Y.; Xie, G.; Wang, Y.; Zhang, C.; Li, P.; Lei, G. Mapping the spatiotemporal heterogeneity of ecosystem service relationships and bundles in Ningxia, China. J. Clean. Prod. 2021, 294, 126216. [Google Scholar] [CrossRef]
- Du, J.; Yang, Z.; Yang, G.; Li, S.; Luo, Z. Driving Force Analysis of Agricultural Economic Growth Related to Water Utilization Effects Based on LMDI Method in Ningxia, Northwest China. Water 2021, 13, 3639. [Google Scholar] [CrossRef]
- Miao, J.; Zhang, X.; Zhao, Y.; Wei, T.; Yang, Z.; Li, P.; Zhang, Y.; Chen, Y.; Wang, Y. Evolution patterns and spatial sources of water and sediment discharge over the last 70 years in the Yellow River, China: A case study in the Ningxia Reach. Sci. Total Environ. 2022, 838, 155952. [Google Scholar] [CrossRef] [PubMed]
- Wang, X.; Zheng, W.; Tian, W.; Gao, Y.; Wang, X.; Tian, Y.; Li, J.; Zhang, X. Groundwater hydrogeochemical characterization and quality assessment based on integrated weight matter-element extension analysis in Ningxia, upper Yellow River, northwest China. Ecol. Indic. 2022, 135, 108525. [Google Scholar] [CrossRef]
- Wu, Y.; Dong, S.; Huang, H.; Zhai, J.; Li, Y.; Huang, D. Quantifying urban land expansion dynamics through improved land management institution model: Application in Ningxia-Inner Mongolia, China. Land Use Policy 2018, 78, 386–396. [Google Scholar] [CrossRef]
- Wu, M.; Pang, D.; Chen, L.; Li, X.; Liu, L.; Liu, B.; Li, J.; Wang, J.; Ma, L. Chemical composition of soil organic carbon and aggregate stability along an elevation gradient in Helan Mountains, northwest China. Ecol. Indic. 2021, 131, 108228. [Google Scholar] [CrossRef]
- NY/T 1121.5-2006; Soil Testing. Part 5: Method for Determination of Soil Cation Exchange Capacity in Calcareous Soil. Agriculture Industry Standard: Beijing, China, 2016.
- Lu, R. Analysis Method of Soil and Agricultural Chemistry; China Agricultural Science & Technology Press: Beijing, China, 2000. [Google Scholar]
- Lv, J.; Liu, Y. An integrated approach to identify quantitative sources and hazardous areas of heavy metals in soils. Sci. Total Environ. 2019, 646, 19–28. [Google Scholar] [CrossRef]
- China National Environmental Monitoring Centre. Background Values of Soil Elements in China; China Environmental Science Press: Beijing, China, 1990. [Google Scholar]
- Shi, W.; Li, T.; Feng, Y.; Su, H.; Yang, Q. Source apportionment and risk assessment for available occurrence forms of heavy metals in Dongdahe Wetland sediments, southwest of China. Sci. Total Environ. 2022, 815, 152837. [Google Scholar] [CrossRef]
- Guo, J.H.; Liu, X.J.; Zhang, Y.; Shen, J.L.; Han, W.X.; Zhang, W.F.; Christie, P.; Goulding, K.W.T.; Vitousek, P.M.; Zhang, F.S. Significant Acidification in Major Chinese Croplands. Science 2010, 327, 1008–1010. [Google Scholar] [CrossRef]
- Lv, J.; Wang, Y. Multi-scale analysis of heavy metals sources in soils of Jiangsu Coast, Eastern China. Chemosphere 2018, 212, 964–973. [Google Scholar] [CrossRef]
- Chi, Q.H.; Yan, M.C. Handbook of Elemental Abundance for Applied Geochemistry; Geology Press: Beijing, China, 2007. [Google Scholar]
- Sun, L.; Guo, D.; Liu, K.; Meng, H.; Zheng, Y.; Yuan, F.; Zhu, G. Levels, sources, and spatial distribution of heavy metals in soils from a typical coal industrial city of Tangshan, China. Catena 2019, 175, 101–109. [Google Scholar] [CrossRef]
- Jin, G.; Fang, W.; Shafi, M.; Wu, D.; Li, Y.; Zhong, B.; Ma, J.; Liu, D. Source apportionment of heavy metals in farmland soil with application of APCS-MLR model: A pilot study for restoration of farmland in Shaoxing City Zhejiang, China. Ecotoxicol. Environ. Saf. 2019, 184, 109495. [Google Scholar] [CrossRef] [PubMed]
- Ali, M.H.; Mustafa, A.-R.A.; El-Sheikh, A.A. Geochemistry and spatial distribution of selected heavy metals in surface soil of Sohag, Egypt: A multivariate statistical and GIS approach. Environ. Earth Sci. 2016, 75, 1257. [Google Scholar] [CrossRef]
- Mikkonen, H.G.; Dasika, R.; Drake, J.A.; Wallis, C.J.; Clarke, B.O.; Reichman, S.M. Evaluation of environmental and anthropogenic influences on ambient background metal and metalloid concentrations in soil. Sci. Total Environ. 2018, 624, 599–610. [Google Scholar] [CrossRef] [PubMed]
- Chen, T.; Chang, Q.; Liu, J.; Clevers, J.G.P.W.; Kooistra, L. Identification of soil heavy metal sources and improvement in spatial mapping based on soil spectral information: A case study in northwest China. Sci. Total Environ. 2016, 565, 155–164. [Google Scholar] [CrossRef]
- Hu, W.; Wang, H.; Dong, L.; Huang, B.; Borggaard, O.K.; Bruun Hansen, H.C.; He, Y.; Holm, P.E. Source identification of heavy metals in peri-urban agricultural soils of southeast China: An integrated approach. Environ. Pollut. 2018, 237, 650–661. [Google Scholar] [CrossRef]
- Liang, J.; Feng, C.; Zeng, G.; Gao, X.; Zhong, M.; Li, X.; Li, X.; He, X.; Fang, Y. Spatial distribution and source identification of heavy metals in surface soils in a typical coal mine city, Lianyuan, China. Environ. Pollut. 2017, 225, 681–690. [Google Scholar] [CrossRef]
- Zhao, F.-J.; Ma, Y.; Zhu, Y.-G.; Tang, Z.; McGrath, S.P. Soil Contamination in China: Current Status and Mitigation Strategies. Environ. Sci. Technol. 2015, 49, 750–759. [Google Scholar] [CrossRef]
- Zhu, X.; Yu, W.; Li, F.; Liu, C.; Ma, J.; Yan, J.; Wang, Y.; Tian, R. Spatio-temporal distribution and source identification of heavy metals in particle size fractions of road dust from a typical industrial district. Sci. Total Environ. 2021, 780, 146357. [Google Scholar] [CrossRef]
- Gunawardana, C.; Goonetilleke, A.; Egodawatta, P.; Dawes, L.; Kokot, S. Source characterisation of road dust based on chemical and mineralogical composition. Chemosphere 2012, 87, 163–170. [Google Scholar] [CrossRef]
- Vu, C.T.; Lin, C.; Shern, C.-C.; Yeh, G.; Le, V.G.; Tran, H.T. Contamination, ecological risk and source apportionment of heavy metals in sediments and water of a contaminated river in Taiwan. Ecol. Indic. 2017, 82, 32–42. [Google Scholar] [CrossRef]
- Lough, G.C.; Schauer, J.J.; Park, J.-S.; Shafer, M.M.; DeMinter, J.T.; Weinstein, J.P. Emissions of Metals Associated with Motor Vehicle Roadways. Environ. Sci. Technol. 2005, 39, 826–836. [Google Scholar] [CrossRef] [PubMed]
- Duan, K.; Zhao, B.; Zhang, S.; Ma, Y. Contamination characteristics, source analysis, and ecological risk assessment of toxic metals and metalloid in agricultural soil in Yuzhong, China. J. Environ. Qual. 2021, 50, 122–133. [Google Scholar] [CrossRef] [PubMed]
- Xia, F.; Qu, L.; Wang, T.; Luo, L.; Chen, H.; Dahlgren, R.A.; Zhang, M.; Mei, K.; Huang, H. Distribution and source analysis of heavy metal pollutants in sediments of a rapid developing urban river system. Chemosphere 2018, 207, 218–228. [Google Scholar] [CrossRef]
- Qu, M.-K.; Li, W.-D.; Zhang, C.-R.; Wang, S.-Q.; Yang, Y.; He, L.-Y. Source Apportionment of Heavy Metals in Soils Using Multivariate Statistics and Geostatistics. Pedosphere 2013, 23, 437–444. [Google Scholar] [CrossRef]
- Police, S.; Sahu, S.K.; Pandit, G.G. Chemical characterization of atmospheric particulate matter and their source apportionment at an emerging industrial coastal city, Visakhapatnam, India. Atmos. Pollut. Res. 2016, 7, 725–733. [Google Scholar] [CrossRef]
- Guan, Q.; Zhao, R.; Pan, N.; Wang, F.; Yang, Y.; Luo, H. Source apportionment of heavy metals in farmland soil of Wuwei, China: Comparison of three receptor models. J. Clean. Prod. 2019, 237, 117792. [Google Scholar] [CrossRef]
- Masto, R.E.; Singh, M.K.; Rout, T.K.; Kumar, A.; Kumar, S.; George, J.; Selvi, V.A.; Dutta, P.; Tripathi, R.C.; Srivastava, N.K. Health risks from PAHs and potentially toxic elements in street dust of a coal mining area in India. Environ. Geochem. Health 2019, 41, 1923–1937. [Google Scholar] [CrossRef]
- Yuan, Y.; Zeng, G.; Liang, J.; Huang, L.; Hua, S.; Li, F.; Zhu, Y.; Wu, H.; Liu, J.; He, X.; et al. Variation of water level in Dongting Lake over a 50-year period: Implications for the impacts of anthropogenic and climatic factors. J. Hydrol. 2015, 525, 450–456. [Google Scholar] [CrossRef]
- Weissengruber, L.; Möller, K.; Puschenreiter, M.; Friedel, J.K. Long-term soil accumulation of potentially toxic elements and selected organic pollutants through application of recycled phosphorus fertilizers for organic farming conditions. Nutr. Cycl. Agroecosyst. 2018, 110, 427–449. [Google Scholar] [CrossRef]
- Zhang, X.; Zhong, T.; Liu, L.; Zhang, X.; Cheng, M.; Li, X.; Jin, J. Chromium occurrences in arable soil and its influence on food production in China. Environ. Earth Sci. 2016, 75, 257. [Google Scholar] [CrossRef]
- Wang, C.; Yang, Z.; Zhong, C.; Ji, J. Temporal–spatial variation and source apportionment of soil heavy metals in the representative river–alluviation depositional system. Environ. Pollut. 2016, 216, 18–26. [Google Scholar] [CrossRef]
- Wang, Y.; Zhang, L.; Wang, J.; Lv, J. Identifying quantitative sources and spatial distributions of potentially toxic elements in soils by using three receptor models and sequential indicator simulation. Chemosphere 2020, 242, 125266. [Google Scholar] [CrossRef] [PubMed]
- Peng, H.; Chen, Y.; Weng, L.; Ma, J.; Ma, Y.; Li, Y.; Islam, M.S. Comparisons of heavy metal input inventory in agricultural soils in North and South China: A review. Sci. Total Environ. 2019, 660, 776–786. [Google Scholar] [CrossRef]
- Lv, J. Multivariate receptor models and robust geostatistics to estimate source apportionment of heavy metals in soils. Environ. Pollut. 2019, 244, 72–83. [Google Scholar] [CrossRef] [PubMed]
- Cai, L.-M.; Wang, Q.-S.; Wen, H.-H.; Luo, J.; Wang, S. Heavy metals in agricultural soils from a typical township in Guangdong Province, China: Occurrences and spatial distribution. Ecotoxicol. Environ. Saf. 2019, 168, 184–191. [Google Scholar] [CrossRef] [PubMed]
- Wu, Q.; Wang, S.; Li, G.; Liang, S.; Lin, C.-J.; Wang, Y.; Cai, S.; Liu, K.; Hao, J. Temporal Trend and Spatial Distribution of Speciated Atmospheric Mercury Emissions in China During 1978–2014. Environ. Sci. Technol. 2016, 50, 13428–13435. [Google Scholar] [CrossRef] [PubMed]
- Manta, D.S.; Angelone, M.; Bellanca, A.; Neri, R.; Sprovieri, M. Heavy metals in urban soils: A case study from the city of Palermo (Sicily), Italy. Sci. Total Environ. 2002, 300, 229–243. [Google Scholar] [CrossRef]

Disclaimer/Publisher’s Note: The statements, opinions and data contained in all publications are solely those of the individual author(s) and contributor(s) and not of MDPI and/or the editor(s). MDPI and/or the editor(s) disclaim responsibility for any injury to people or property resulting from any ideas, methods, instructions or products referred to in the content. |
© 2023 by the authors. Licensee MDPI, Basel, Switzerland. This article is an open access article distributed under the terms and conditions of the Creative Commons Attribution (CC BY) license (https://creativecommons.org/licenses/by/4.0/).