Article

Low-Carbon Economic Operation Optimization of Park-Level Integrated Energy Systems with Flexible Loads and P2G under the Carbon Trading Mechanism

1
School of Electrical Engineering, Changchun Institute of Technology, Changchun 130012, China
2
Institute of Oceanographic Instrumentation, Qilu University of Technology (Shandong Academy of Sciences), Qingdao 266075, China
3
Department of Mechanical and Energy Engineering, Southern University of Science and Technology, Shenzhen 518055, China
*
Authors to whom correspondence should be addressed.
Sustainability 2023, 15(21), 15203; https://doi.org/10.3390/su152115203
Submission received: 27 September 2023 / Revised: 19 October 2023 / Accepted: 20 October 2023 / Published: 24 October 2023

Abstract

:
Against the background of the “30 × 60” target, low-carbon policies and technologies have become the new starting point and destination of energy conservation and emission reduction in energy systems. Power-to-Gas (P2G), as a new energy conversion mode, provides a new way of consuming energy and reducing carbon emissions. An optimal dispatching model of a park-level integrated energy system considering flexible load and power-to-gas (P2G) participation in the carbon trading market is proposed. Firstly, a comprehensive demand response model for electricity and heat is established according to the system’s flexible load characteristics, adding power-to gas equipment and a combined heat and power (CHP) unit to the system. Secondly, against the background of the carbon trading mechanism and considering the incentive effect of P2G on the carbon trading mechanism, a systematic comprehensive carbon trading cost model is established. Finally, the operation objectives of the low-carbon economy, with minimum energy purchase costs, carbon emission costs, and operating costs, are constructed using a CPLEX commercial solver. The results verify the importance of considering the operational cost of P2G and the feasibility of considering both operating economy and wind power accommodation ability together in integrated energy systems.

1. Introduction

To address global climate warming, countries around the world are actively promoting energy system energy conservation and emission reduction [1,2,3,4]. China is actively implementing the new development concept of “peak carbon dioxide emissions and carbon neutrality”. With the transformation of the energy system and the continuous progress of energy conservation and emission reduction, park-level integrated energy systems (PIES) have become an effective approach to achieving “dual carbon” goals, due to their advantages in multiple energy flow complementarity. With the gradual growth of power-to-gas (P2G) technology, it is of great significance to explore how we may utilize the hydrogen and thermal energy generated in the P2G process, promoting the complementary coupling of multiple energies and achieving cascaded and efficient utilization of energy [5].
Most current research has focused on the economics of PIES, ignoring their huge potential to save energy and reduce emissions [6,7]. The energy sector accounts for a large proportion of carbon emissions, and is the main force of carbon reduction [8]. In order to ensure the sustainable development of the system, it is necessary to introduce the carbon trading mechanism to improve the system’s low-carbon economic operation capacity. In the literature [9], considering the carbon trading mechanism, an optimal scheduling model with minimum life cycle costs and carbon trading costs is proposed, and the influences of carbon trading price, carbon trading interval length, and other parameters on the multi-stage programming model are discussed. With the development of P2G equipment, renewable energy consumption has become a new approach due to its ability to convert electricity into natural gas. In the literature [10], via constructing a collaborative mechanism of carbon capture and the conversion of power plant electricity to gas, and constructing an optimal scheduling model including a virtual power plant, it was verified that this mechanism can effectively reduce the cost and carbon emissions of virtual power plants, and can increase the consumption of renewable energy. In the literature [11], a P2G response characteristic model was constructed, and the economic cost of the system and the output of the unit were analyzed in the case of wind power uncertainty. It was verified that the model can strengthen the coupling relationship between P2G equipment and the system, and improve the economy of the system. However, the above study only considered the operation of the participating system under a single condition, and did not consider the impact of the two systems’ PIES on the economy and low carbon of the system, meaning the advantages of PIES in energy saving and emission reduction could not be maximized. As an important dispatching resource of PIES, demand-side response greatly enhances the flexibility of the load-side [12], enabling the load side to flexibly select the energy demand according to the time-of-use price and carbon emission mechanism, which has positive significance for energy conservation and emission reduction within regional comprehensive energy systems in parks. In the literature [13], a low-carbon scheduling model of wind power coordinated using demand-side response and an energy storage device was studied, and carbon emission and economy were taken as the dual objectives for optimization. In the literature [14], the load side is modeled in detail by category, and the electrical loads are divided into transferable, transferable, and reducible loads according to the types of participating demands; the economic compensation and carbon emission impact induced by the demand response are analyzed. P2G as another important dispatching resource in integrated energy system parks. In another study [15], P2G was refined into a two-stage process: electric hydrogen production and electric natural gas production. The literature [16] presents a comprehensive energy system optimization and scheduling method for the coupled operation of a flexible carbon capture and storage (CCS) system and power-to-gas (P2G) devices. In this context, this paper investigates an optimization and scheduling method for the coupled operation of a CCS system and P2G devices based on flexible operation. The advantages of P2G emission reduction in the context of the ladder electricity price mechanism are analyzed. All the above studies are used to optimize the system in the context of the carbon-trading mechanism or the constraints of PIES-controlled resources, but they all focus on a certain aspect, without combining the demand side of the comprehensive energy system with P2G, and without discussing the behavior characteristics of the user side in the context of the dual-carbon target.
Against the background of the current research literature, in order to further study the role of user-side flexible load, power-to-gas devices and the carbon trading mechanism collaborative optimization in energy conservation and emission reductions in park systems, a low-carbon optimization scheduling model of a comprehensive park energy system (including flexible load and power-to-gas under the carbon trading mechanism) was proposed. Firstly, according to the coupling characteristics of the system, the operation model of each piece of equipment in the park was established, including the energy production side, CHP unit, P2G unit, gas grid model, etc. Secondly, according to the characteristics of the user side load, the load was divided into transferable, transferable and reducible types. Secondly, the carbon emission reduction capacity of P2G was quantified, and a comprehensive carbon trading cost model was constructed to achieve the operation goals of a low-carbon economy with minimal operating costs, energy costs and carbon emission costs. Finally, the low-carbon optimal scheduling model of the park-level integrated energy system with flexible load and power-to-gas in the context of the carbon trading mechanism was verified using simulation examples; it can achieve load peak cutting and valley filling, promote the consumption of wind power, and achieve the coordination of the low-carbon economy. The effectiveness of the proposed model in reducing system carbon emissions and improve the system’s economy was verified.
The main contributions of the article are as follows:
  • Introduction of the carbon trading mechanism: The article proposes a tiered carbon trading mechanism that sets different carbon trading prices based on energy consumption. This mechanism considers the economic cost of carbon emissions, effectively incentivizing the park-level integrated energy system to reduce carbon emissions and promote low-carbon economic operation.
  • Proposal of a flexible load management method: The article adopts flexible load management technology to optimize the utilization and smooth scheduling of renewable energy by adjusting the elasticity of electricity demand. This method can effectively reduce the peak-to-valley difference in the energy system, improving system efficiency and stability.
  • Achieving the coupled operation of flexible loads and power-to-gas: This research focuses on the coordination of flexible loads and power-to-gas devices to improve the overall efficiency of the energy system. By combining flexible loads with power-to-gas devices, it is possible to better cope with fluctuations in electricity supply and demand, and to increase system flexibility.
In summary, the main contributions of this article lie in proposing methods for optimizing the low-carbon economic operation of park-level integrated energy systems in the context of the carbon trading mechanism, considering the coupled operation of flexible loads and power-to-gas devices. These research results are of great significance for promoting the development of a low-carbon economy and achieving sustainable energy utilization.

2. Low-Carbon Operation Mechanism of a Park Multi-Energy Coupling Integrated Energy System with Electricity-to-Gas and Flexible Loads

PIES with multi-energy coupling can meet the energy needs of the park through a variety of energy sources and pieces of energy supply equipment. In this section, an architectural diagram of a park-level integrated energy system is first presented, and the effectiveness of the combined operation of electron gas, hydrogen fuel cells, and cogeneration in optimizing the multi-energy coupling of the park-level integrated energy system is analyzed. Then, a model of each piece of unit equipment in the park is built, to which the carbon trading mechanism is introduced, and the low-carbon operation of the power-to-gas device and flexible load system is considered.

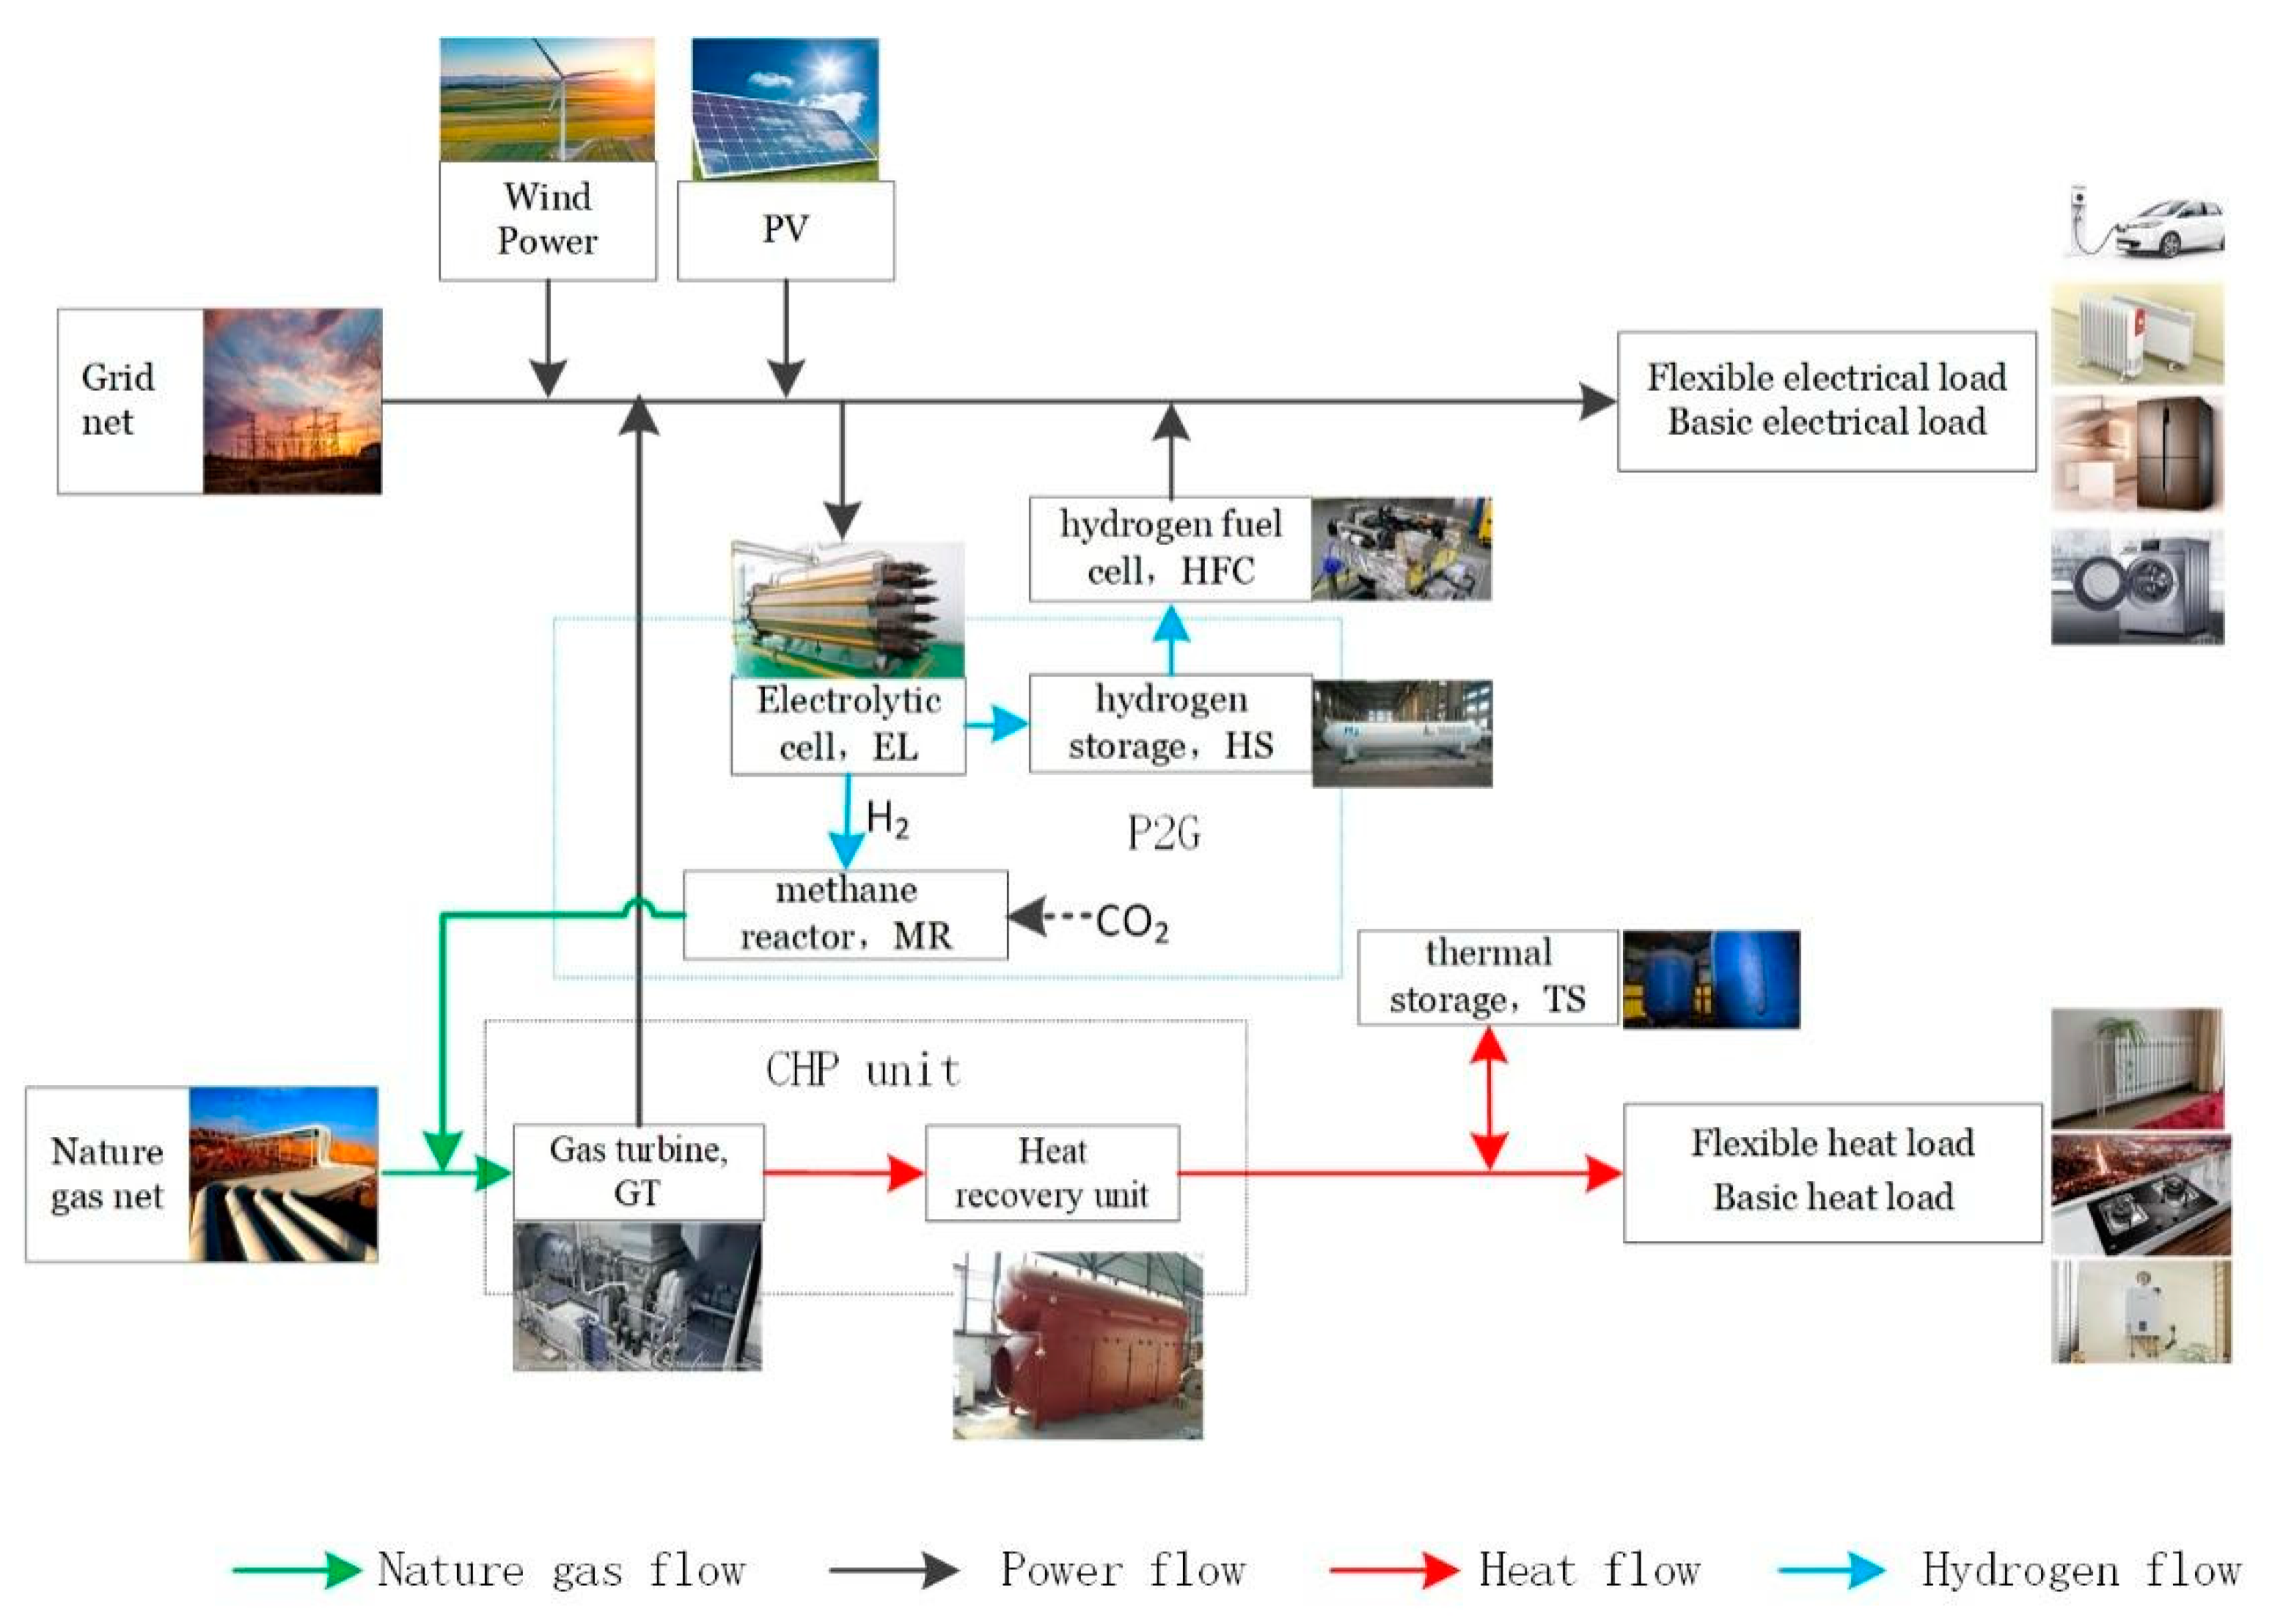
2.1. Park-Level Integrated Energy System Architecture

Park-level integrated energy systems aim to meet the electrical and thermal load demands of users on the demand side, and is composed of multiple energy inputs, and multiple types of energy conversion equipment and coupling equipment [16,17].
The PIES constructed in this paper is shown in Figure 1. The energy supply of the comprehensive energy system of the park not only comes directly from the distribution network and gas distribution network, but also has a large number of photovoltaic panels and fans installed inside, which can generate electricity from renewable energy sources to meet part of the energy supply of the park, thereby reducing the carbon emissions and energy purchase costs of the park. The energy conversion equipment of the park’s integrated energy system includes a typical combined heating and power (CHP) unit composed of a gas turbine (GT) and waste heat boiler, and the power-togas (power-to-gas, P2G) and hydrogen fuel cell (HFC) equipment. The energy storage equipment includes thermal storage (TS) and hydrogen storage (HS). The load includes basic electricity, heat load and flexible electricity, heat load.
Distributed energy provides renewable clean energy for the park system; electrolyzers (ELs) convert electrical energy into hydrogen energy, and hydrogen energy is further converted into natural gas via a methane reactor (MR). It can also be directly fed to HFC for hydrogen electricity production, reducing the cascade consumption of energy and improving the energy utilization rate. As energy conversion equipment, gas turbines consume part of the natural gas of the gas network to provide electric energy for the power grid. The heat generated goes into the waste heat recovery device to heat the park system. The excess heat can go into the heat storage tank, and the energy storage equipment in the park can store energy to achieve the time shift of energy. The CO2 absorption or emissions involved in the operation of each piece of equipment are eventually traded through the carbon trading market.

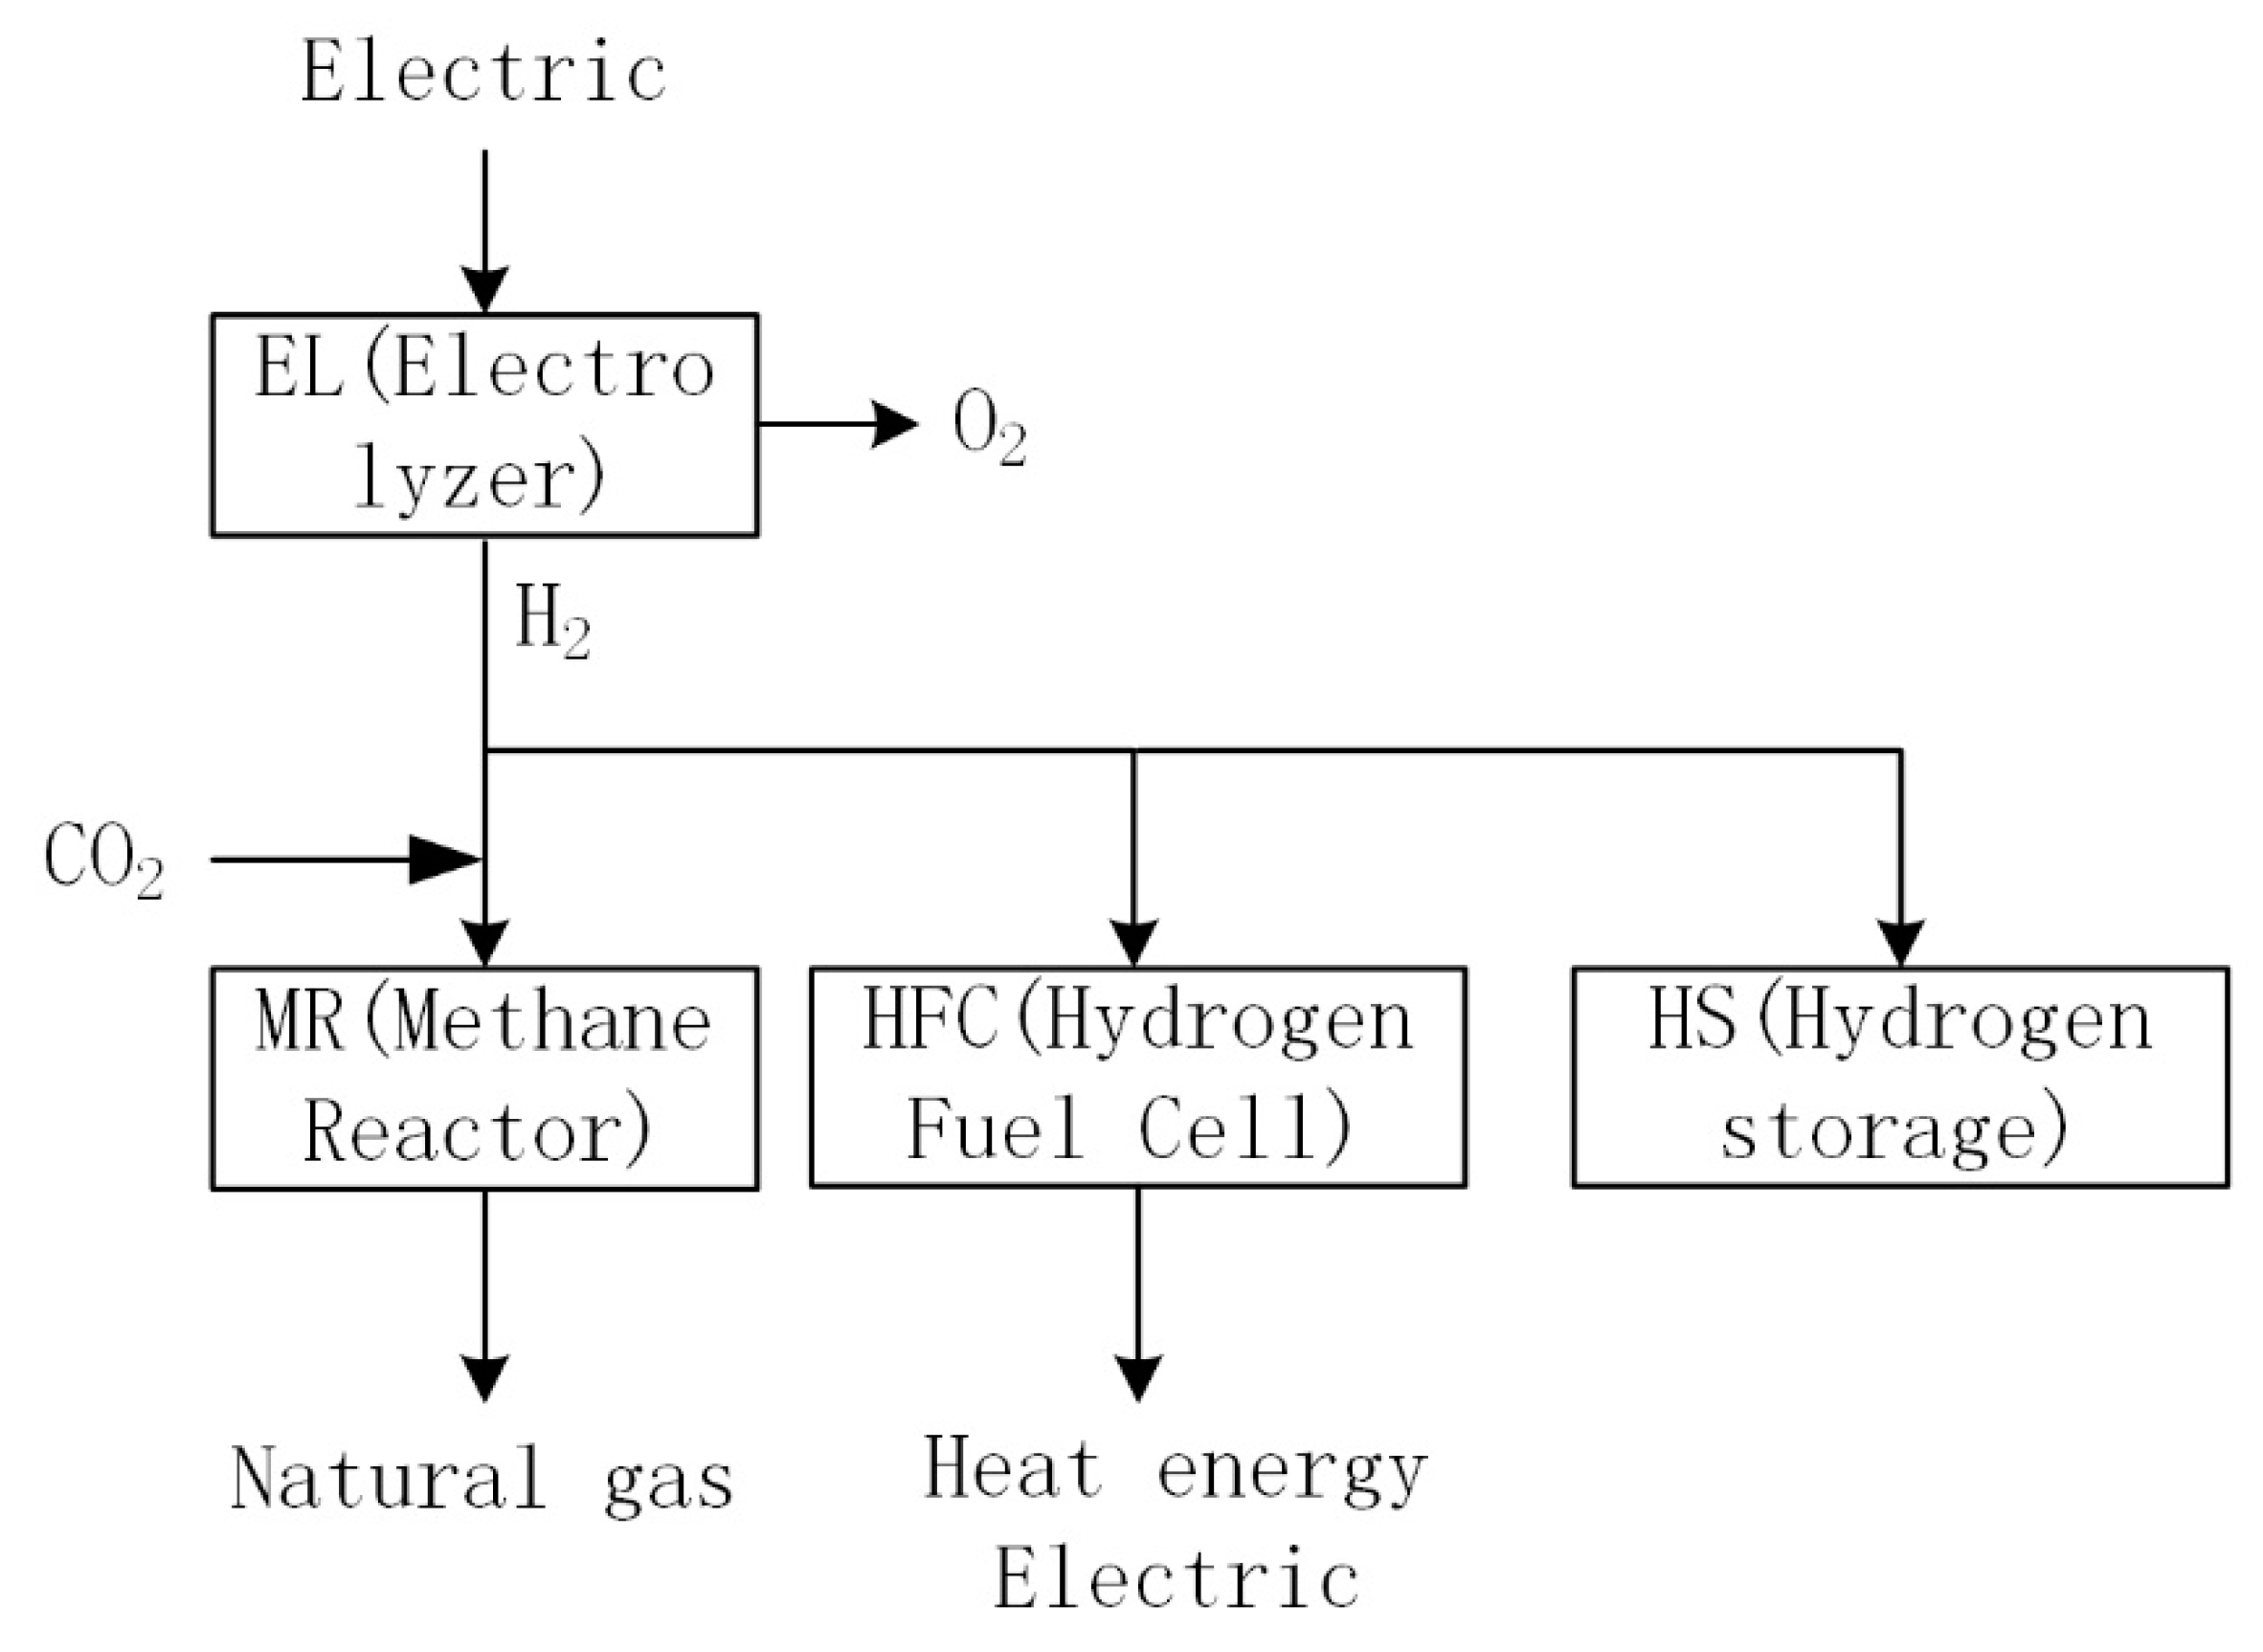
2.2. P2G Two-Stage Working Model and Constraints

As a pure and efficient new energy, hydrogen energy has great application potential in comprehensive energy systems, such as hydrogen energy vehicles, fuel cells, and so on. P2G technology refers to the direct use of hydrogen or natural gas by converting electric energy into hydrogen through electrolysis of water or further transforming hydrogen into natural gas through the catalytic reaction of Sabatier. P2G equipment in the system greatly enhances the degree of coupling between electricity and natural gas in the PIES. The working principles of P2G equipment are as follows (Figure 2):
Electricity-to-gas (P2G) technology consists of two chemical processes: an electrolytic water reaction and a methane synthesis reaction. In the first step, electricity is converted into hydrogen energy by an electrolytic cell (EL), which can then be stored for use. In the second step, carbon dioxide is added to the hydrogen gas. Synthetic natural gas (SNG) generated by a methane synthesizer (MR) can be directly stored or transported on a large scale. In this process, carbon dioxide needs to be absorbed, which is conducive to energy conservation and emission reduction. Alternatively, hydrogen in the hydrogen fuel cell (HFC) can be converted into electricity, which, compared with the traditional conversion of gas to electricity by a gas turbine or boiler power supply, reduces intermediate energy loss; hydrogen’s energy efficiency is higher than that of natural gas. In the PIES, when too much wind abandoning leads to high wind abandoning costs or excessive carbon emissions lead to excessive carbon trading costs, P2G will increase production efforts, thus reducing the economic cost of the PIES. Its mathematical model [18] is shown as follows:
P2G’s consumption of electric energy to produce natural gas is shown in Equation (1):
E P 2 G , t , g a s = η P 2 G × P i , P 2 G , t
The generated natural gas energy and volume are converted according to the high calorific value, as shown in Equation (2):
f P 2 G , t , g a s = 1 N E P 2 G , t , g a s C H V g a s
The natural gas quantity shall meet the upper and lower limit constraints of Equation (3):
0 P i , P 2 G , t P i , P 2 G , t ¯
where E P 2 G , t , g a s is the energy obtained after switching from electricity to gas at time t , and P i , P 2 G , t is the power required by the moment-to-moment electron gas process, which is considered an electrical load in power networks. t   η P 2 G is the conversion efficiency of the P2G equipment; f P 2 G , t , g a s is the natural gas flow rate after electricity to gas at time t ; C H V g a s is the high calorific value of natural gas, and its value is constant; and N is the number of pieces of power-to-gas equipment in the park system.
The energy density of methane produced by converting electricity to natural gas is four times that of hydrogen, and it can be directly fed into the natural gas pipeline network for use. At the same time, CO2 is consumed to synthesize methane, so it has a good low-carbon capacity. Therefore, P2G in this paper specifically refers to the category of converting power to natural gas [19]. Equations (1) and (2) of the chemical reaction above can therefore be obtained. When a certain volume is generated, the consumption can be expressed as [20]:
f P 2 G , t , g a s C O 2
M C O 2 = f P 2 G , t , g a s f P 2 G , t , g a s m M C O 2 m
where f P 2 G , t , g a s m , M C O 2 m are the molar gas and molar mass of methane, respectively; C O 2   M C O 2 is the amount consumed to produce a given volume of methane gas. The carbon emission reduction capacity of electricity to gas can be quantified using Equations (2) and (4).
The operation cost of electricity to gas includes fixed costs such as initial investment, and later, equipment maintenance and variable costs required to generate unit natural gas. Variable costs include the cost of electricity and the cost of feedstock, which mainly refers to the cost of carbon dioxide. Different sources of carbon dioxide (carbon capture technology, biogas, etc.) require different costs between 10 ~ 1000 $ / t . The variable cost of P2G via PIES, with its electricity consumption and gas production, directly affects the economy of day-ahead scheduling.
At the current technical level, the comprehensive energy conversion efficiency of P2G is about 45%~60%. Due to the fast reaction rate of electrolytic water, P2G can rapidly utilize the excess electric energy to produce gas and increase the consumption of renewable energy in cases of excess renewable energy, making it a good development prospect.

2.3. Hydrogen Fuel Cells

The good electric heating characteristics of hydrogen fuel cells can be combined with a traditional cogeneration unit to form a new type of cogeneration system, so that the electric heating output of hydrogen fuel cells can be fully utilized, which not only realizes the high grade utilization of hydrogen energy, but also provides a clean power source for the comprehensive energy system. Hydrogen fuel cells can efficiently and without pollution convert the chemical energy stored in hydrogen storage tanks, natural gas, methanol and other hydrogen-containing fuels, and can convert oxygen into electric energy. The principle of electricity generation is to use the electric potential generated by the movement of electrons during the REDOX reaction to send the electric energy generated by the reactor reaction to the power grid after DC/AC conversion and transformer boost voltage.
As fuel cells are the main micro-power source for electric energy scheduling, their thermal energy utilization is not considered for the time being [21]. Because cogeneration gives full play to the electric heating characteristics of hydrogen fuel cells, it can be approximated that the total thermoelectric efficiency is equal to a certain value within the technical upper limit, so that when the electrical efficiency changes, the thermal efficiency also changes. The external power output scheduling model of hydrogen fuel cells [5] is as follows:
P H F C , e , t ( t ) = η H F C , e , t P H F C , i n , t
η H F C , e , t = a H F C ( P H F C , e , t P H F C , r ) 5 + b H F C ( P H F C , e , t P H F C , r ) 4 + c H F C ( P H F C , e , t P H F C , r ) 3 + d H F C ( P H F C , e , t P H F C , r ) 2 + e H F C ( P H F C , e , t P H F C , r ) + f H F C
η H F C , e , t < η H F C , max
P H F C , min P H F C , i n , t P H F C , max
Δ P H F C , min P H F C , i n , t + 1 P H F C , i n , t Δ P H F C , max
where P H F C , e , t ( t ) is the electric energy output power of HFC in the time period t ; η H F C , e , t is the electricity generation efficiency of HFC in the time period t ; P H F C , i n , t is the input power of HFC in the time period t ; P H F C , r is the rated output power of the fuel cell; a H F C ,   b H F C ,   c H F C ,   d H F C ,   e H F C ,   f H F C are the efficiency function coefficients; η H F C , max is the maximum efficiency of the fuel cell; P H F C , min ,   P H F C , max are the minimum and maximum input power of the fuel cell; and  Δ P H F C , max ,   Δ P H F C , min are, respectively, the upper and lower climbing limits of the fuel cells.

2.4. Hydrogen Storage

Using hydrogen storage to generate electricity is not only helpful in solving the problem of peak cutting and valley filling of power grid, but also can significantly reduce carbon emissions and improve the energy utilization rate [22]. Part of the hydrogen generated by the electrolytic cell is used to feed the hydrogen load, and part is used to convert electricity to natural gas. Hydrogen storage tanks are the key equipment used to accomplish the transfer of excess wind energy to the period of high load, and are also the fuel providers of hydrogen fuel cells. The hydrogen storage tank model [23] is as follows:
E H S , t = E H S , t 1 + E H S , i n , t E H S , o u t , t
E H S , min E H S , t E H S , max
where  E H S , t is the gas storage capacity of the hydrogen storage tank during the time period t ; k m o l   E H S , max ,   E H S , min are, respectively, the upper and lower limits of the hydrogen storage tank’s capacity; E H S , i n , t is the amount of hydrogen injected into the hydrogen storage tank during the time period t ; and k m o l   E H S , o u t , t is the output hydrogen in the hydrogen storage tank, k m o l .

2.5. Cogeneration Model and Constraints

The core of the combined heating and power (CHP) system is the gas turbine and waste heat recovery unit. The high-grade heat energy during natural gas combustion drives the gas turbine to generate electricity, and the discharged high-temperature waste heat gas is supplied by the waste heat recovery device.
The mathematical model of the CHP unit can be established and approximated using the following formula [24]:
P G T , e , t = η G T P G T , g , t
ξ = P G T , g , t P G T , e , t
where P G T , e , t is the electric power generated by gas turbine at time t ; P G T , g , t is the gas turbine power consumption at time t ; η G T is the power generation efficiency coefficient of the gas turbine; and ξ represents a fixed proportional relationship between power generation and heat production. The gas turbine generates a lot of heat energy in the process of generating electricity, which is absorbed by the waste heat recovery device and then supplied to the user. Waste heat recovery devices are generally composed of waste heat boilers (EB), and their mathematical model is as follows:
P E B , h , t = P G T , e , t ( 1 η G T η G T , s ) η G T η E B C O E B
where P E B , h , t is the heating power output of waste heat boiler at time t ; η G T , s is the heat dissipation coefficient of gas turbine, generally 0.03; η E B is the heat recovery efficiency of the waste heat boiler; and C O E B is the energy efficiency ratio of the waste heat boiler.
The power and climbing constraints of the CHP unit are as follows [25]:
{ P G T , g , min P G T , g , t P G T , g , max Δ P G T , d o w n P G T , t P G T , t 1 Δ P G T , u p
where P G T , g , min ,   P G T , g , max are the lower limit and upper limit of the gas turbine’s power consumption, respectively; Δ P G T , d o w n ,   Δ P G T , u p are, respectively, the maximum speed of the downslope and upslope of the gas turbine.

2.6. Heat Storage Tank

In the comprehensive energy system, the heat storage tank plays an important role in the inhibition of the output fluctuation of new energy. During the operation of thermal energy storage, the energy can be dynamically absorbed and timely released, which can smooth the volatility of the wind output and indirectly expand the capacity of PIES to absorb renewable energy. The dynamic mathematical model of the heat storage tank can be expressed as follows:
H t T S = ( 1 μ T S , l o s s ) H t 1 T S + [ Q t T S , c h η t , c h Q t T S , d i s η t , d i s ] Δ t
where H t T S is the heat storage capacity of the heat storage tank in the time period t ; μ T S , l o s s is the heat dissipation loss rate of the heat storage tank; Q t T S , c h ,   Q t T S , d i s are the heat absorption and heat release power of the heat storage tank in the time period t ; and η t , c h ,   η t , d i s , respectively, are the heat absorption and release efficiency of the heat storage tank t .
Constraints of energy storage equipment:
{ H min T S H t T S H max T S 0 Q t T S , c h δ t T S , c h Q max T S , c h 0 Q t T S , d i s δ t T S , d i s Q max T S , d i s δ t T S , c h + δ t T S , d i s 1 H 1 = H T
where H min T S ,   H max T S , is the lower limit and upper limit of the heat storage of the thermal energy storage equipment; and δ t T S , c h ,   δ t T S , d i s are the 0–1 variables of the heat storage and heat release state, respectively. A value of 1 refers to the heat storage or heat release of the energy storage device; a value of 0 means that the energy storage device has stopped working. According to the fourth row inequality constraint, we know that only one of heat storage or heat release can be carried out therein. The fifth equation indicates that the heat energy at the initial moment of the energy storage device is equal to the heat energy at the end of the cycle.

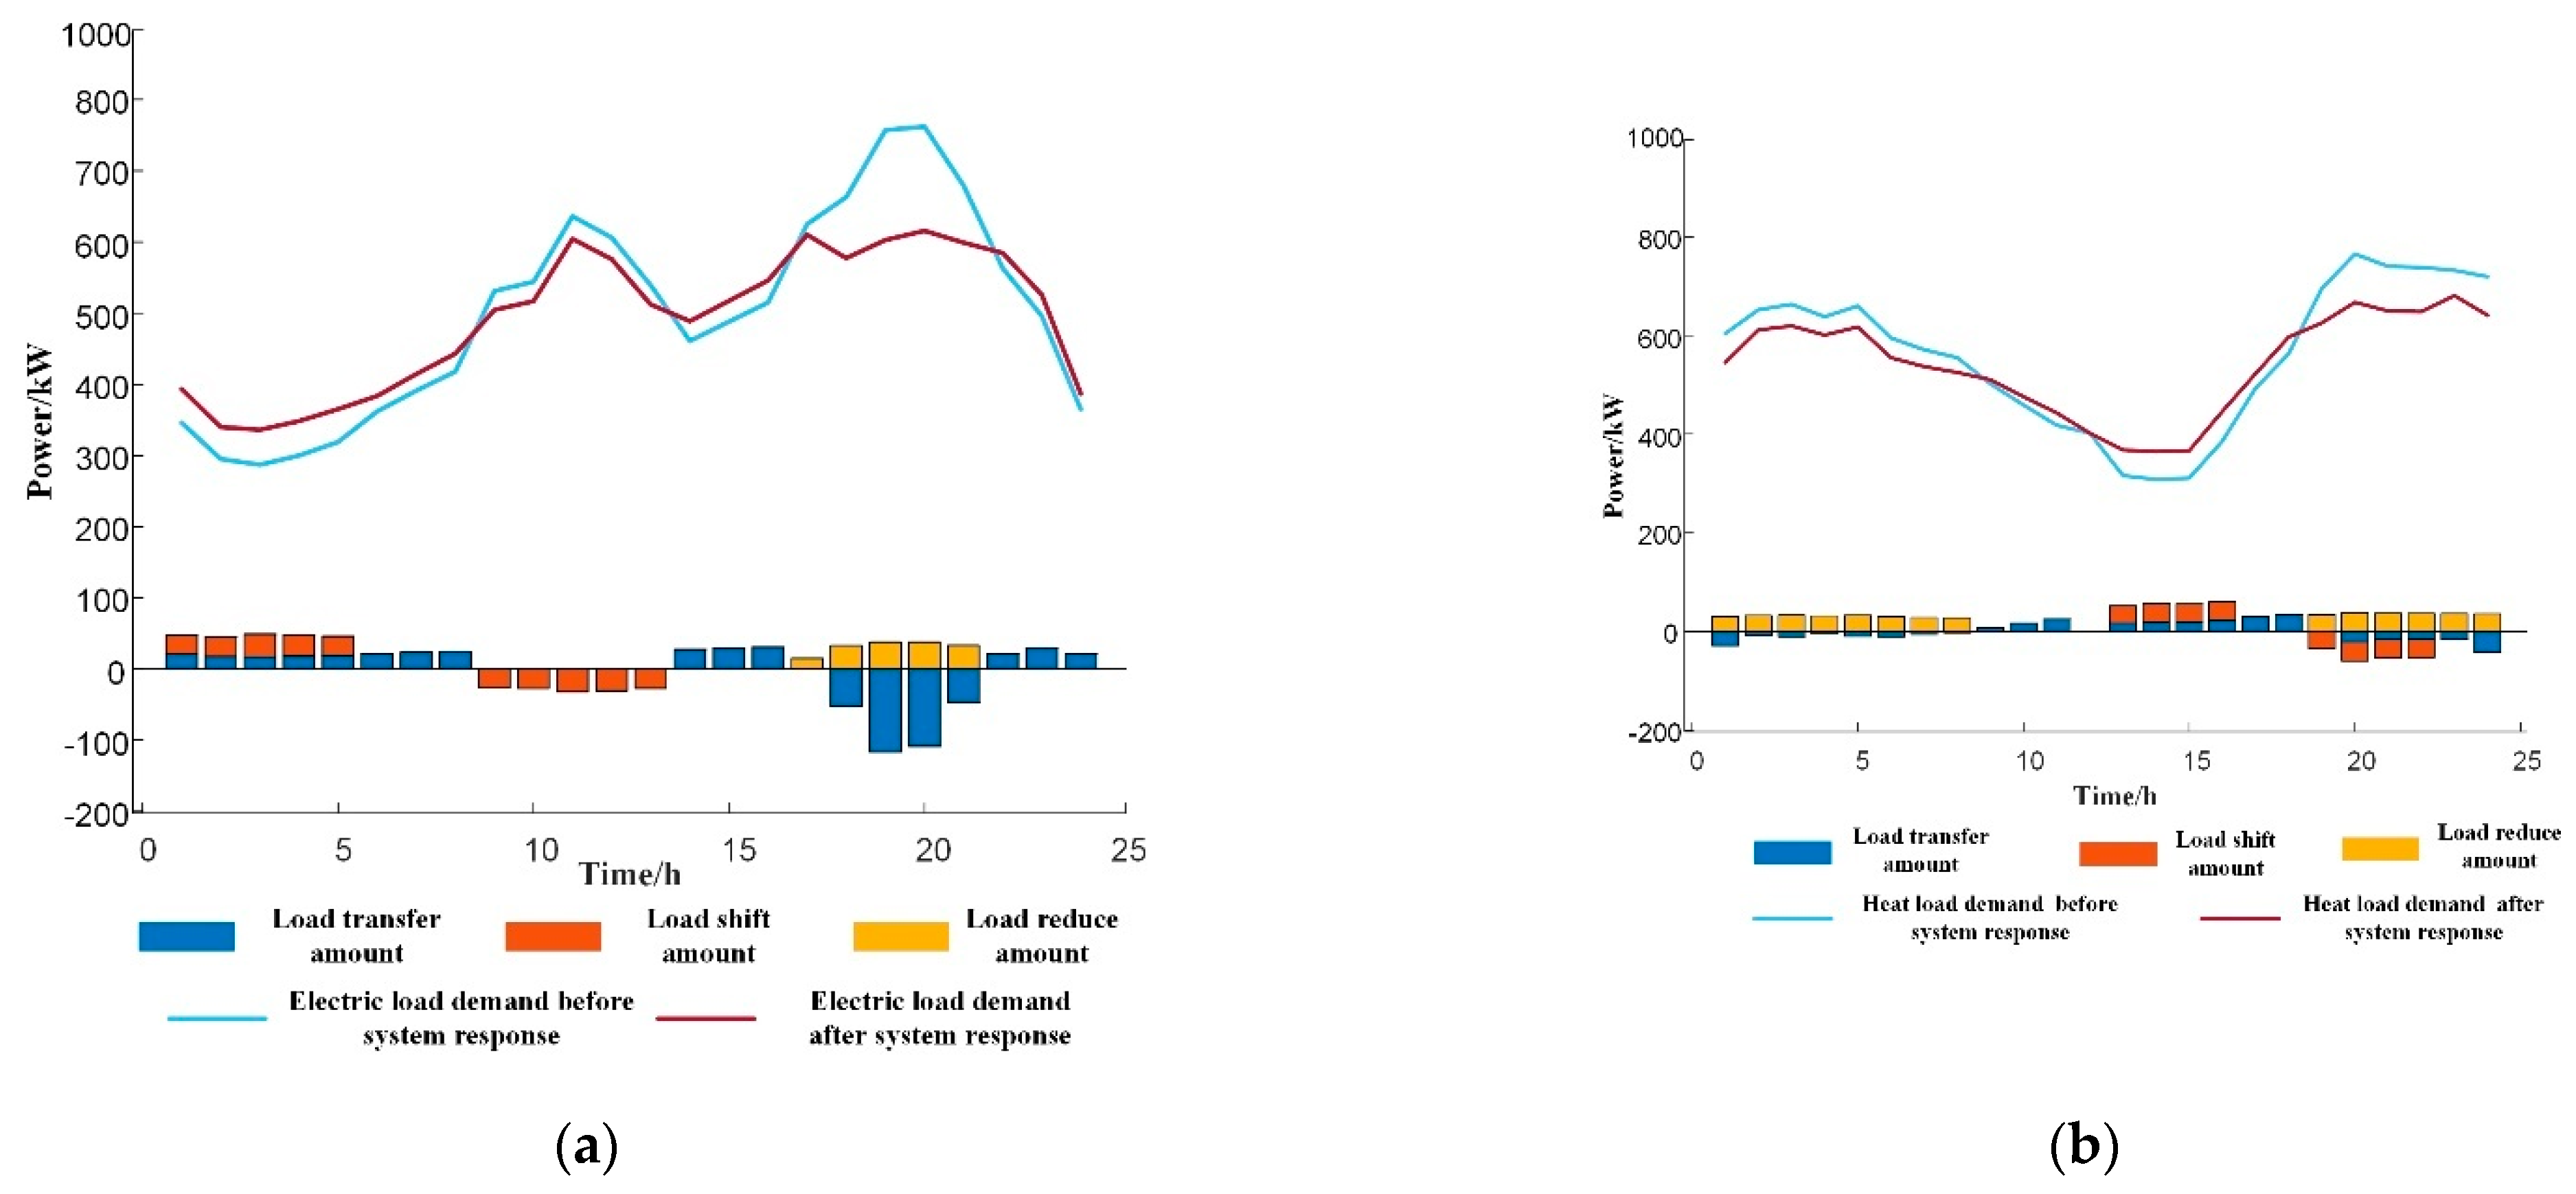
2.7. Analysis of Flexible Load Response Characteristics of the Park Demand Side

The scheduling of flexible load is beneficial for reducing the peak valley difference in load. According to the ability to participate in flexible regulation [26], flexible loads can be divided into three category PIES: shiftable load, transferable load, and reducible load. (1) Shiftable load: the load power supply time can be changed as planned, the load needs to be shifted as a whole, and the power consumption time spans multiple scheduling periods. (2) Transferable load: the electricity consumption in each period can be adjusted flexibly, but the total load in the whole cycle after the transfer should remain unchanged frmo that before the transfer. (3) Reducible load can withstand a certain interruption or power reduction, and reduce the time of the operation of the load according to the supply and demand of its partial or full reduction.

2.7.1. Shiftable Load

Power supply time can be changed according to the plan, and shift load scheduling can span multiple periods, but the load needs to shift the whole. In order to ensure the rationality of load translation, it is necessary to set the constraint of shift period. Assuming that the interval of shiftable time period within the scheduling cycle is [ t s f , t s f + ] , and the duration of shiftable load is t D , then the set of shiftable initial time period [27] is S s h i f t :
S s h i f t = [ t s f , t s f + t D + 1 ]
The compensation cost of shifting load is as follows:
F s h i f t = F cos t s h i f t τ = 1 T P τ s h i f t
where F cos t s h i f t is the load translation compensation coefficient, taking 1 h as the unit for scheduling period, P τ s h i f t is the translation power of time period τ , and T is the total number of time slots in a scheduling cycle, 24 h.

2.7.2. Transferable Load

Under the premise that the total load can be satisfied in the whole cycle, the energy used in each period can be adjusted flexibly. Within the scheduling period, the transferable period range is [ t t r , t t r + ] . Considering the particularity of user-side heating demand, this paper excludes the transferable load characteristics of heat load [25]. In order to prevent the problem of the frequent starting and stopping of the equipment in each period, it is necessary to set the minimum continuous running time constraint of the transferable load, and also to restrict its transfer power.
τ = t t + T min t r a n 1 z τ t r a n T min t r a n
z τ t r a n P min t r a n P τ t r a n z τ t r a n P max t r a n
where T τ t r a n  is the minimum continuous operation time of transferable load; 0–1 is the transfer state of variable marking period z τ t r a n , where 0 is no transfer and 1 is transfer; τ   P τ t r a n is the power transferred during the time period τ ; and  P min t r a n ,   P max t r a n are, respectively, the lower limit and upper limit of transferred power.
The compensation cost of the transferable load is as follows:
F t r a n = F cos t t r a n τ = 1 T P τ t r a n
where F cos t t r a n is the compensation coefficient of load transfer, and P τ t r a n is the transfer power of the load in the time period τ .

2.7.3. Load Reduction

This type of load can withstand power reduction, time reduction, or operation interruption to a certain extent, and can be reduced according to scheduling requirements. In order to ensure reasonable load reduction, the upper and lower limits for the length of reduction and the number of reduction must be constrained:
T min c u t τ = 1 t + T k p 1 z τ c u t T max c u t
τ = 1 T z τ c u t N max
where T k p  is the load reduction time; T min c u t ,   T max c u t are the lower limit and upper limit of the continuous load reduction time; 0–1 is the reduction state of the variable marking period  z τ c u t , in which 1 indicates reduction and 0 indicates no reduction; and τ   N max is the maximum number of load reductions.
The compensation cost that can reduce the load is as follows:
F c u t = F cos t c u t τ = 1 T P τ c u t
where F cos t c u t is load reduction compensation coefficient, and P τ c u t is the cut power of the load in the period τ .

3. Considering P2G and the Flexible Load of the PIES Low-Carbon Economy Optimization Scheduling Model

The carbon trading mechanism is a mechanism that trades carbon emission rights as commodity PIES in the carbon trading market for the purpose of controlling carbon emissions [28]. At present, China mainly adopts the method of free carbon emission allocation, that is, in the carbon trading market, the market will allocate corresponding free carbon emission credits to each carbon emission source. If the carbon emission of the carbon emission source exceeds the allocated free carbon emission credits, the excess emission credits need to be purchased from the market. If the carbon emission allowance is less than the source’s own free carbon emission quota, it can sell certain carbon emission allowance to obtain revenue [20].

3.1. An Integrated Carbon Trading Model

At present, the initial carbon allocation is mainly divided into three categories: auction allocation, free allocation, and mixed allocation. This paper mainly adopts the method of free allocation to allocate carbon quota. The baseline method is adopted to determine the free carbon quota in PIES. Firstly, it is considered that the main equipment emitting carbon dioxide in PIES includes two parts: a conventional generator set mainly composed of coal-fired power plants and a CHP unit burning natural gas. Then, the initial allocation of carbon emission rights is carried out according to these two parts. The allocation method [29] is as follows:
C p = C g r i d + C C H P
{ C g r i d = γ e P b u y t C C H P = γ h ( δ P G T t + H W H B t )
where C p is the total carbon emission allocation of the park system; C g r i d ,   C C H P are, respectively, the free carbon emission quota of the external power grid purchasing and CHP units; γ e , γ h are, respectively, the 0.728 and 0.102 carbon emission quotas for unit electricity and unit heat; t / ( M W h )   t / G J   P b u y t represents the amount of electricity purchased by the park system from the outsourced power grid; δ represents the conversion coefficient of electricity generation converted into heat supply, which is 6; M J / ( k W h )   H W H B t represents the thermal power output of the waste heat boiler; and  P G T t represents the electrical power output of the gas turbine [30].
On the basis of the traditional carbon trading scheme, a step carbon trading scheme with an incentive coefficient is introduced in this paper. When the carbon emission is less than the free carbon quota, the energy supply enterprise can sell the excess carbon emission quota and obtain part of the incentive subsidy; otherwise, it needs to buy the sufficient carbon emission rights. The larger the carbon emission range, the higher the corresponding carbon trading price. The stepped carbon trading model with rewards and punishments is as follows:
F c o 2 = { c ( 1 + 2 μ ) ( C c h C p ) C p C c h c ( 1 + 2 μ ) h c ( 1 + μ ) ( E c C p ) C c h C p C c c ( C c C p ) C c < C p C c + h c h + c ( 1 + λ ) ( C p C c h ) C c + h < C p C c + 2 h c ( 2 + λ ) h + c ( 1 + 2 λ ) ( C p C c 2 h ) C c + 2 h < C p C c + 3 h c ( 3 + 3 λ ) h + c ( 1 + 3 λ ) ( C p C c 3 h ) C c + 4 h < C p
where F c o 2 is the carbon trading cost of the park system; C c is the actual carbon emissions of the park system; c is the unit carbon trading price; μ ,   λ are the penalty coefficient and reward coefficient, respectively; and h represents the length of carbon emission interval.
The actual carbon emission of the conventional generator set is 1.08 t / M W h ; The actual carbon emissions of CCHP and GB are 0.065   t / G J [31].
The park system contains P2G equipment, but it is not regarded as a carbon emission source. The amount of carbon dioxide absorbed during its operation can be regarded as the income obtained by the park system operators through selling corresponding carbon emission rights on the carbon trading market. The conversion of electricity to gas within the carbon trading mechanism is conducive to reducing the operating costs of the park system. Therefore, when considering the participation of power-to-gas in the carbon trading market, the carbon emission cost of P2G can be expressed as follows:
F P 2 G , C O 2 = c τ = 1 T ( α P 2 G α 2 ) E P 2 G , t , g a s
where F P 2 G , C O 2 is the amount of CO2 consumed by P2G under unit electricity, which can be obtained from Equation (4); and α P 2 G   α 2 is the carbon emission quota of the electricity of the unit’s P2G operation. Because it is not regarded as a carbon emission source, it is 0; E P 2 G , t , g a s is the output power of P2G.
To sum up, the carbon trading cost of the integrated energy system can be expressed as follows:
F c = F C O 2 + F P 2 G , C O 2

3.2. PIES Low-Carbon Economy Operation Model Function and System Constraints

To maximize the benefits of the park’s integrated energy system, wind power, photovoltaic, power-to-gas systems and CHP units are scheduled and optimized.

3.2.1. Objective Function

Due to the randomness and uncertainty of wind power and photovoltaic power output, the integrated energy system of the park will inevitably have power shortages or surpluses. When the power is insufficient, the corresponding power should be purchased from the main network to make up the shortage. When the power is surplus, wind and light will be abandoned. Therefore, the dispatching model of the park system comprehensively considers the daily equipment investment costs, equipment operation and maintenance costs, carbon trading costs, and the energy costs converted by each investor, and represents the construction of a low-carbon economic dispatching model with minimal total costs, as follows:
F = min ( F i n v + F o m + F c + F e c )
(1)
Operation and maintenance costs:
F o m = τ = 1 T [ x W P W , t + x P V P P V , t + x P 2 G P P 2 G , t + x G T P G T , t + x H F C P H F C , t + x H S P H S , , t + x T S P T S , t + x E B P E B , t ]
where F o m is the unit maintenance cost of each equipment in the park system = {wind power, photovoltaic, P2G, gas turbine, hydrogen fuel cell, hydrogen storage tank, heat storage tank, waste heat boiler}; x i   i   P is the output power of each equipment = {wind power, photovoltaic, P2G, gas turbine, hydrogen fuel cell, hydrogen storage tank, heat storage tank, waste heat boiler} in the period i   t .
(2)
Conversion to the daily equipment investment cost F i n v :
F i n v = i C i i n v C i c a p 365 r ( 1 + r ) N i ( 1 + r ) N i 1
where C i i n v ,   C i c a p ,   N i are the unit capacity investment cost, capacity to be configured, and the service life of the equipment (={wind power, photovoltaic, P2G, gas turbine, hydrogen fuel cell, hydrogen storage tank, heat storage tank, waste heat boiler}), respectively; i   i   r is the discount rate.
(3)
Comprehensive carbon trading costs are shown in Equation (30).
(4)
Energy costs F e c :
Energy costs mainly include electricity purchasing costs, gas purchasing costs, and the penalty costs of energy abandonment.
F e c = τ = 1 T α t P e , b u y , t + τ = 1 T β t P g , b u y , t + σ D G τ = 1 T P D G , c u t , t
where P e , b u y , t ,   P g , b u y , t  are the purchased electricity quantity and gas quantity, respectively; t   α t ,   β t are, respectively, the electricity price and the gas price of the time period t ; σ D G is the penalty cost of unit energy abandonment; and  P D G , c u t , t is the energy abandonment power of the time period t .
The P2G operation cost described in this paper mainly includes the electricity costs and raw material costs [32]. Among them, the electricity cost is proportional to the power consumption, which should be considered in the constraints of the system operation. Therefore, the purchase of raw material cost [33] is mainly considered here.

3.2.2. Constraints on System Operation

In order to ensure the safe and efficient operation of the integrated energy system in the park, it is necessary to constrain the relevant boundary conditions of the system and unit operation.
(1)
Electric power balance constraints:
The power consumption and power generation in the PIES should maintain an instantaneous balance. Meanwhile, photovoltaic modules and fan modules should be considered, as well as wind and light abandonment:
{ P e , b u y , t + P e , t w i n d + P e , t P V + P G T , t + P H F C , o u t , t = P e , l o a d , t + P P 2 G , t + P c u t , t P V + P c u t , t w i n d P e , t w i n d + P c u t , t w i n d = P t w i n d P e , t P V + P c u t , t P V = P t P V
where P e , l o a d , t is the electric load power of time period t ; P e , b u y max is the power purchase limit of each time period; P H F C , o u t , t is the output electric power of the hydrogen fuel cell; and P c u t , t P V ,   P c u t , t w i n d are the power of light and wind abandonment.
(2)
Thermal power constraints.
P C H P , h , t + P G B , h , t = P h , l o a d , t + P T S , h , t
where P h , l o a d , t is the thermal load power of the time period t , and P T S , h , t is the power input heat storage for the time period t .
(3)
Natural gas system constraints:
The natural gas network is mainly composed of natural gas sources, natural gas pipelines, pressurized stations, gas storage equipment, and natural gas loads. Similar to the power system, the natural gas system also has node energy balance and pipeline flow constraints [2].
The constraint of node energy balance is as follows:
k G ( m ) G k , t s ( m n ) G ( m ) G L m n , t + r ( m n ) G ( m ) G L m n , t + a G ( m ) G a , t = i G ( m ) G i , t
where G ( m )   m represents the set of devices connected to the node; s ( m n ) , r ( m n ) represent the natural gas pipeline sending the bus or node, or receiving the bus or node; G k , t is the air output of the air source connected with the node at time k   t ; and G i , t is the gas consumption of the gas turbine connected to the node at time i   t .
Natural gas pipeline flow constraints:
The flow of the natural gas pipeline is related to the physical characteristics such as the pressure at both ends of the pipeline, and the relationship is nonlinear. The Weymouth equation is used to describe the relationship between the airflow in the pipeline and the air pressure at both ends, as follows:
{ G L m n , t = S G N ( π m , t π n , t ) K m n | π m , t 2 π n , t 2 | S G N ( π m , t π n , t ) = { 1 , π m , t π n , t 1 , π m , t < π n , t π m min π m , t π m max
where π m , t   m is the air pressure of the natural gas node; K m n is the Weymouth characteristic parameter of the natural gas pipeline; and π m min ,   π m max are the minimum and maximum limit of gas node pressure m .
Pressure station constraints:
In the process of natural gas pipeline transmission, there is gas loss due to wall friction and terrain changes. It is necessary to add pressure stations along the gas pipeline to make up for the gas loss. Ignoring the energy consumption of the pressurizing station itself, only the booster relationship between the inlet and outlet and the capacity limit of the pressurizing station are considered. The constraint of the pressurizing station is as follows:
π m , t Γ c π n , t
where Γ c > 1 is the compression constant, making the natural gas flow from the low pressure node to the high pressure node.
(4)
Hydrogen equilibrium constraint:
P H 2 , E L , t = P H 2 , M R , t + P H 2 , H F C , t + P H 2 , H S , t
where P H 2 , H S , t is the input power of hydrogen storage during the time period t , and P H 2 , E L , t  is the hydrogen power decomposed from the time cell t .
(5)
Contact line constraints:
0 | p e x , t | p e x max
where p e x max is the upper limit of transmission power of the contact line between the PIES and the power grid.
Constraints on other equipment in the park system have been described above, so they will not be repeated here.

3.3. Solution of the PIES’ Low-Carbon Scheduling Model Function

In order to achieve multi-objective optimal scheduling model of the gas–electric interconnection system, the dispatching center will input the collected electricity load curve, gas load curve, and wind power forecast information into the solving model, and make scheduling arrangements for the next day for thermal power units, gas units, P2G, natural gas sources and grid-connected new energy sources, according to the optimization results. The optimization results give consideration to system economy, pollution emissions and wind power consumption. The PIES low-carbon economic dispatching model built in this paper, considering power-to-gas and flexible load, is a mixed integer nonlinear model [34,35,36]. Therefore, it is necessary to transform the above model into a mixed integer linear model, and then use YALMIP to invoke a CPLEX commercial solver for solving.

4. Example Analysis

In order to verify the effectiveness of the proposed low-carbon economic scheduling strategy, a case study of a northeast park-level integrated energy system was carried out. Briefly, 24 h a day was set as the optimal scheduling cycle, and the unit scheduling time was set at 1 h. All the flue gas discharged from the gas turbine was supplied to the waste heat recovery device.

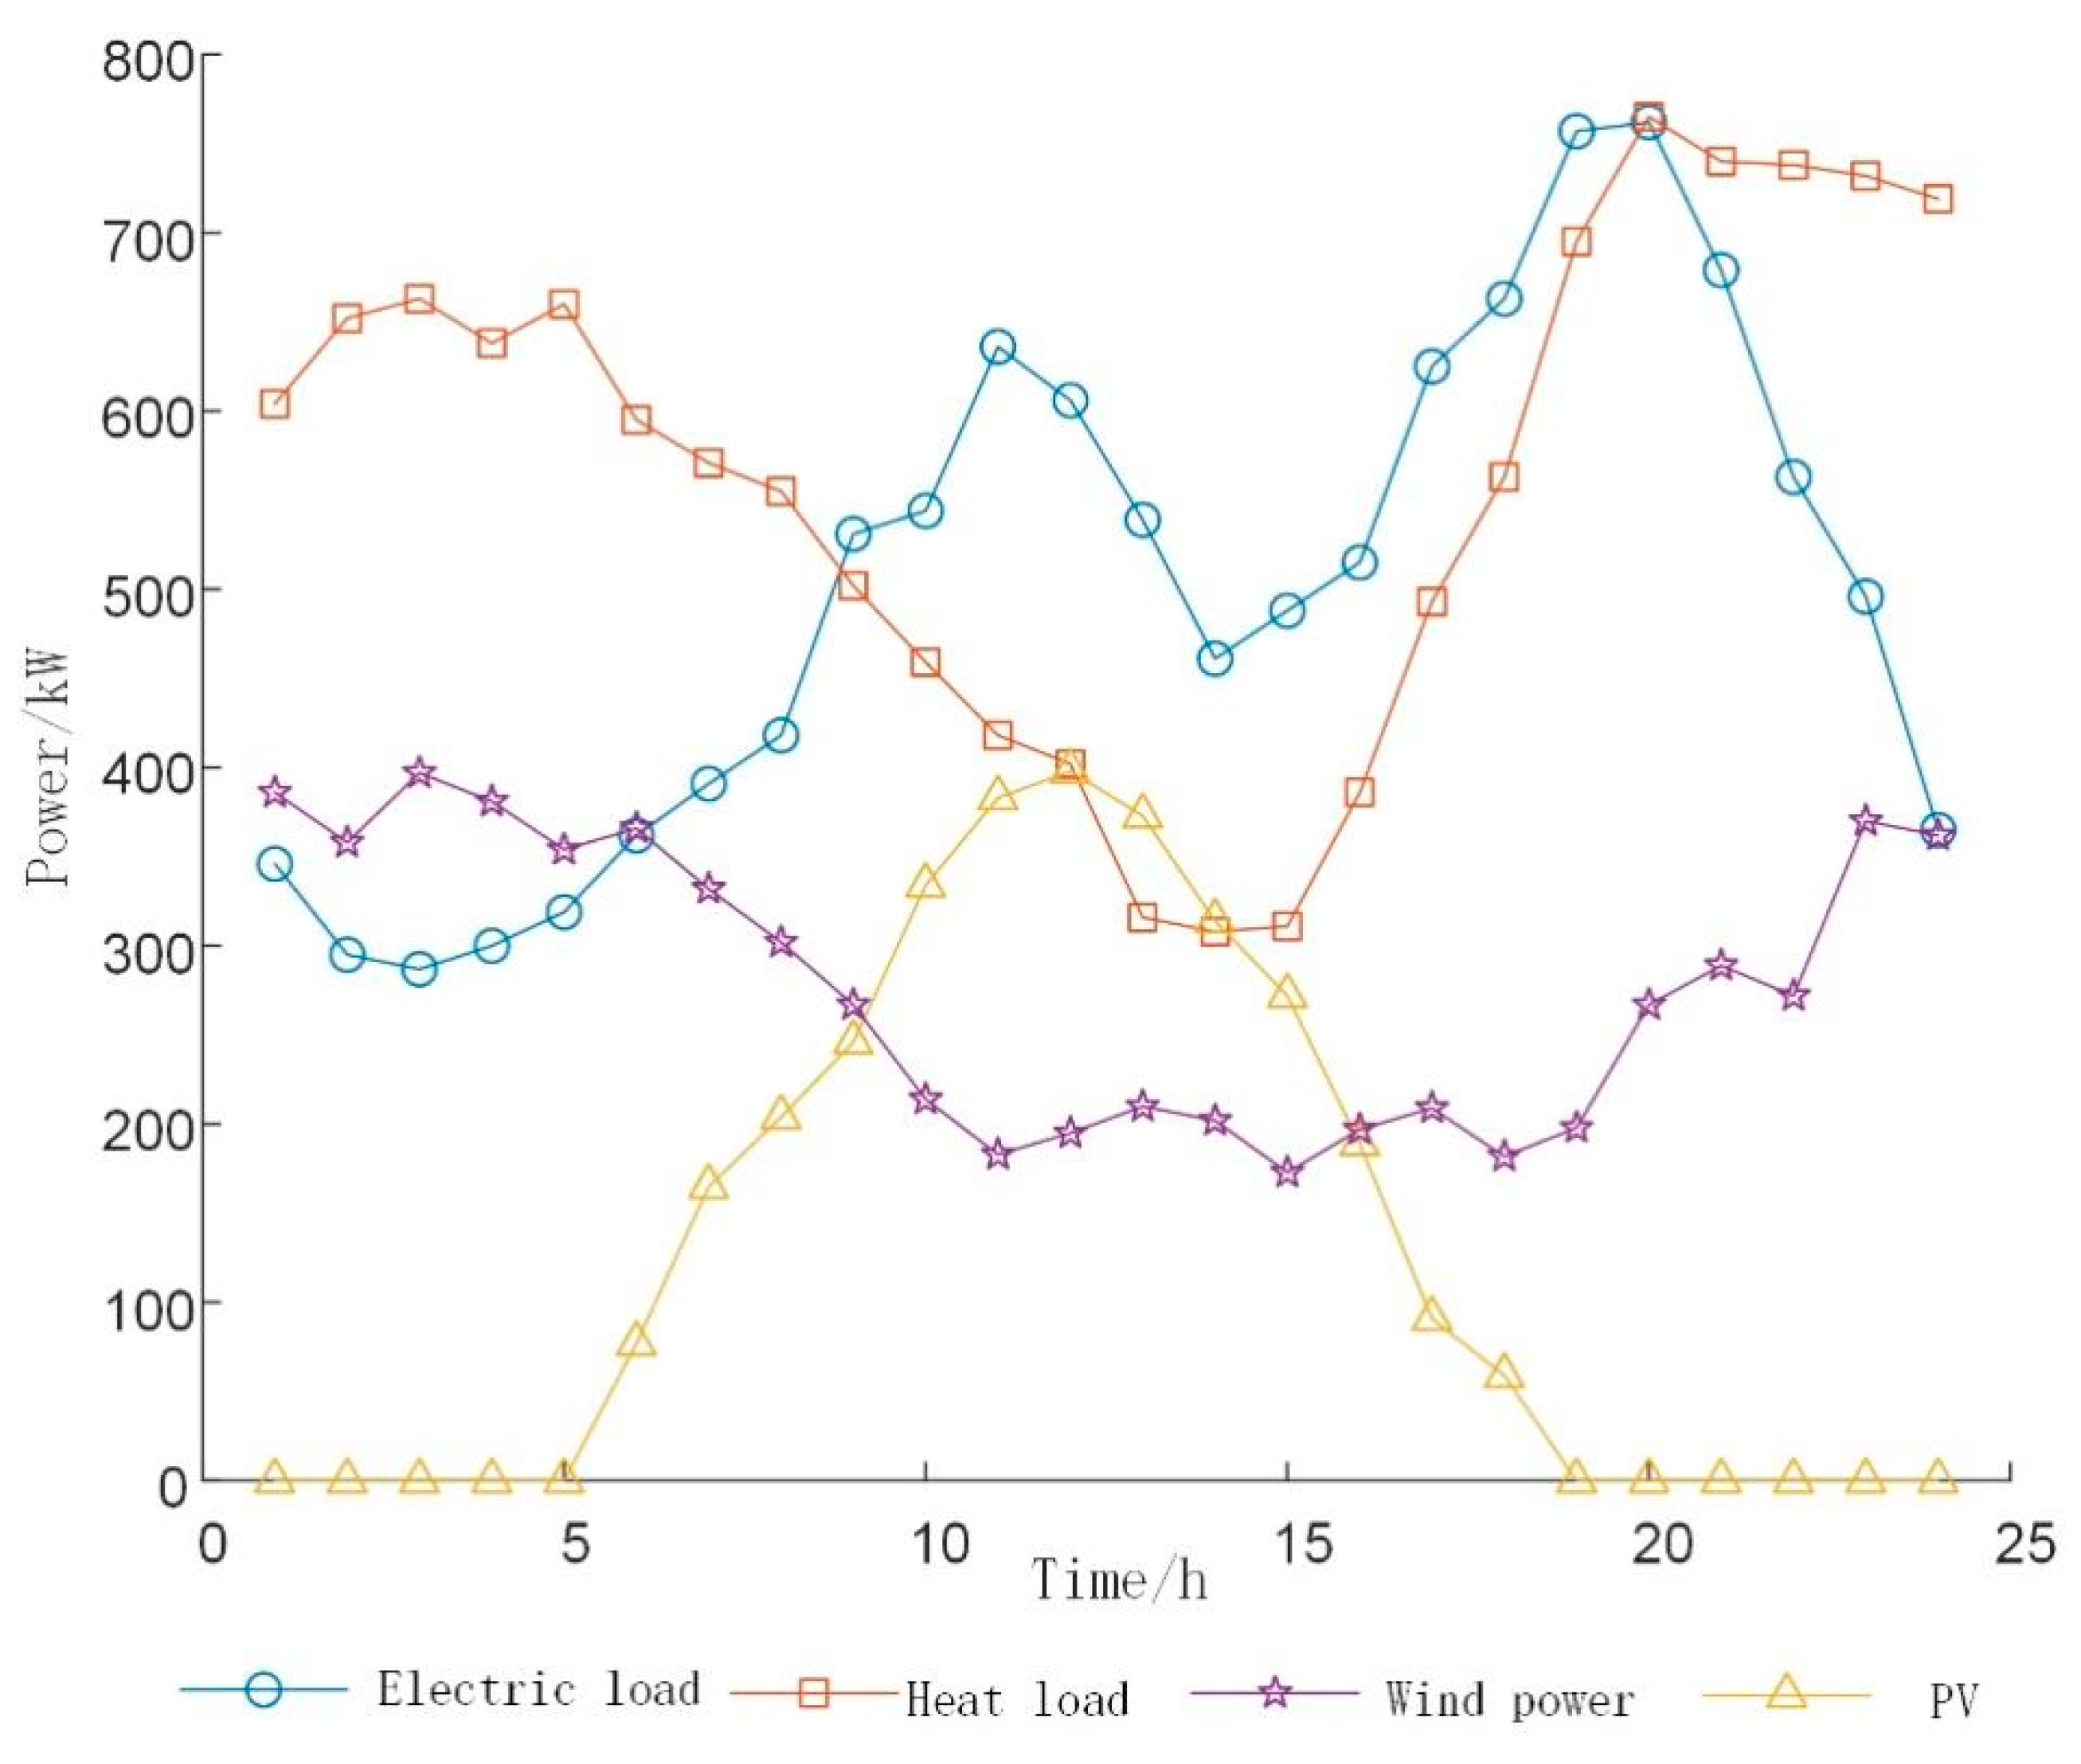
4.1. Basic Data of the Example

According to the natural conditions of the region and the actual energy load level of each region, the power supply capacity of a typical day is used to predict the user’s typical daily load demand, as shown in Appendix A. The parameters and constraints of equipment in the park are shown in Table 1. The price of natural gas is CNY 2.54, and the calorific value of natural gas is 9.7 m3kW·h/m3. The price of electricity is shown in Table 2.
The other parameters of the system are as follows: the efficiency of the waste heat recovery device is 0.75; oxygen price is CNY 2.5 /Nm3. The rated hydrogen production of a single electrolytic cell is 1.941 Nm3/(kW·h), and hydrogen production per kilowatt hour is 0.19 Nm3. The capacity of a single hydrogen storage tank is 10 m3. The rated pressure is 10 MPa, and the hydrogen storage capacity is 1000 Nm under the standard pressure3. The storage efficiency is 0.95; A single fuel cell is rated at 2 kW, and uses 0.8 Nm of hydrogen per kilowatt of electricity produced3.

4.2. Scenario Settings for Example

In order to verify the effectiveness of the proposed low-carbon economic scheduling model of the park-level integrated energy system considering power-to-gas and flexible load, four scenarios were set up for analysis, taking multi-energy conversion equipment, flexible load, and the carbon trading model as variable factors.
As shown in Table 3, Scenario 1 and Scenario 2 were compared to verify the economic benefits of flexible load and power-to-gas participation in system operations. Scenario 1 and Scenario 3 were compared to examine the different economic and environmental benefits generated by the carbon trading model and flexible load participation in system operations. Scenario 2 and Scenario 3 were compared to validate the environmental benefits in carbon emissions’ reduction and the economic performance of the system after the synergistic effect of power-to-gas and carbon trading. Scenario 4 involved the combined application of all three factors in a comprehensive energy system analysis to determine the optimal performance achieved.

4.3. Analysis of System Optimization Results

Concerning the four different scenarios set up above, the practical simulation results of the PIES’ low-carbon optimization operation were analyzed and discussed. The scheduling results of four scenarios are shown in Table 4.

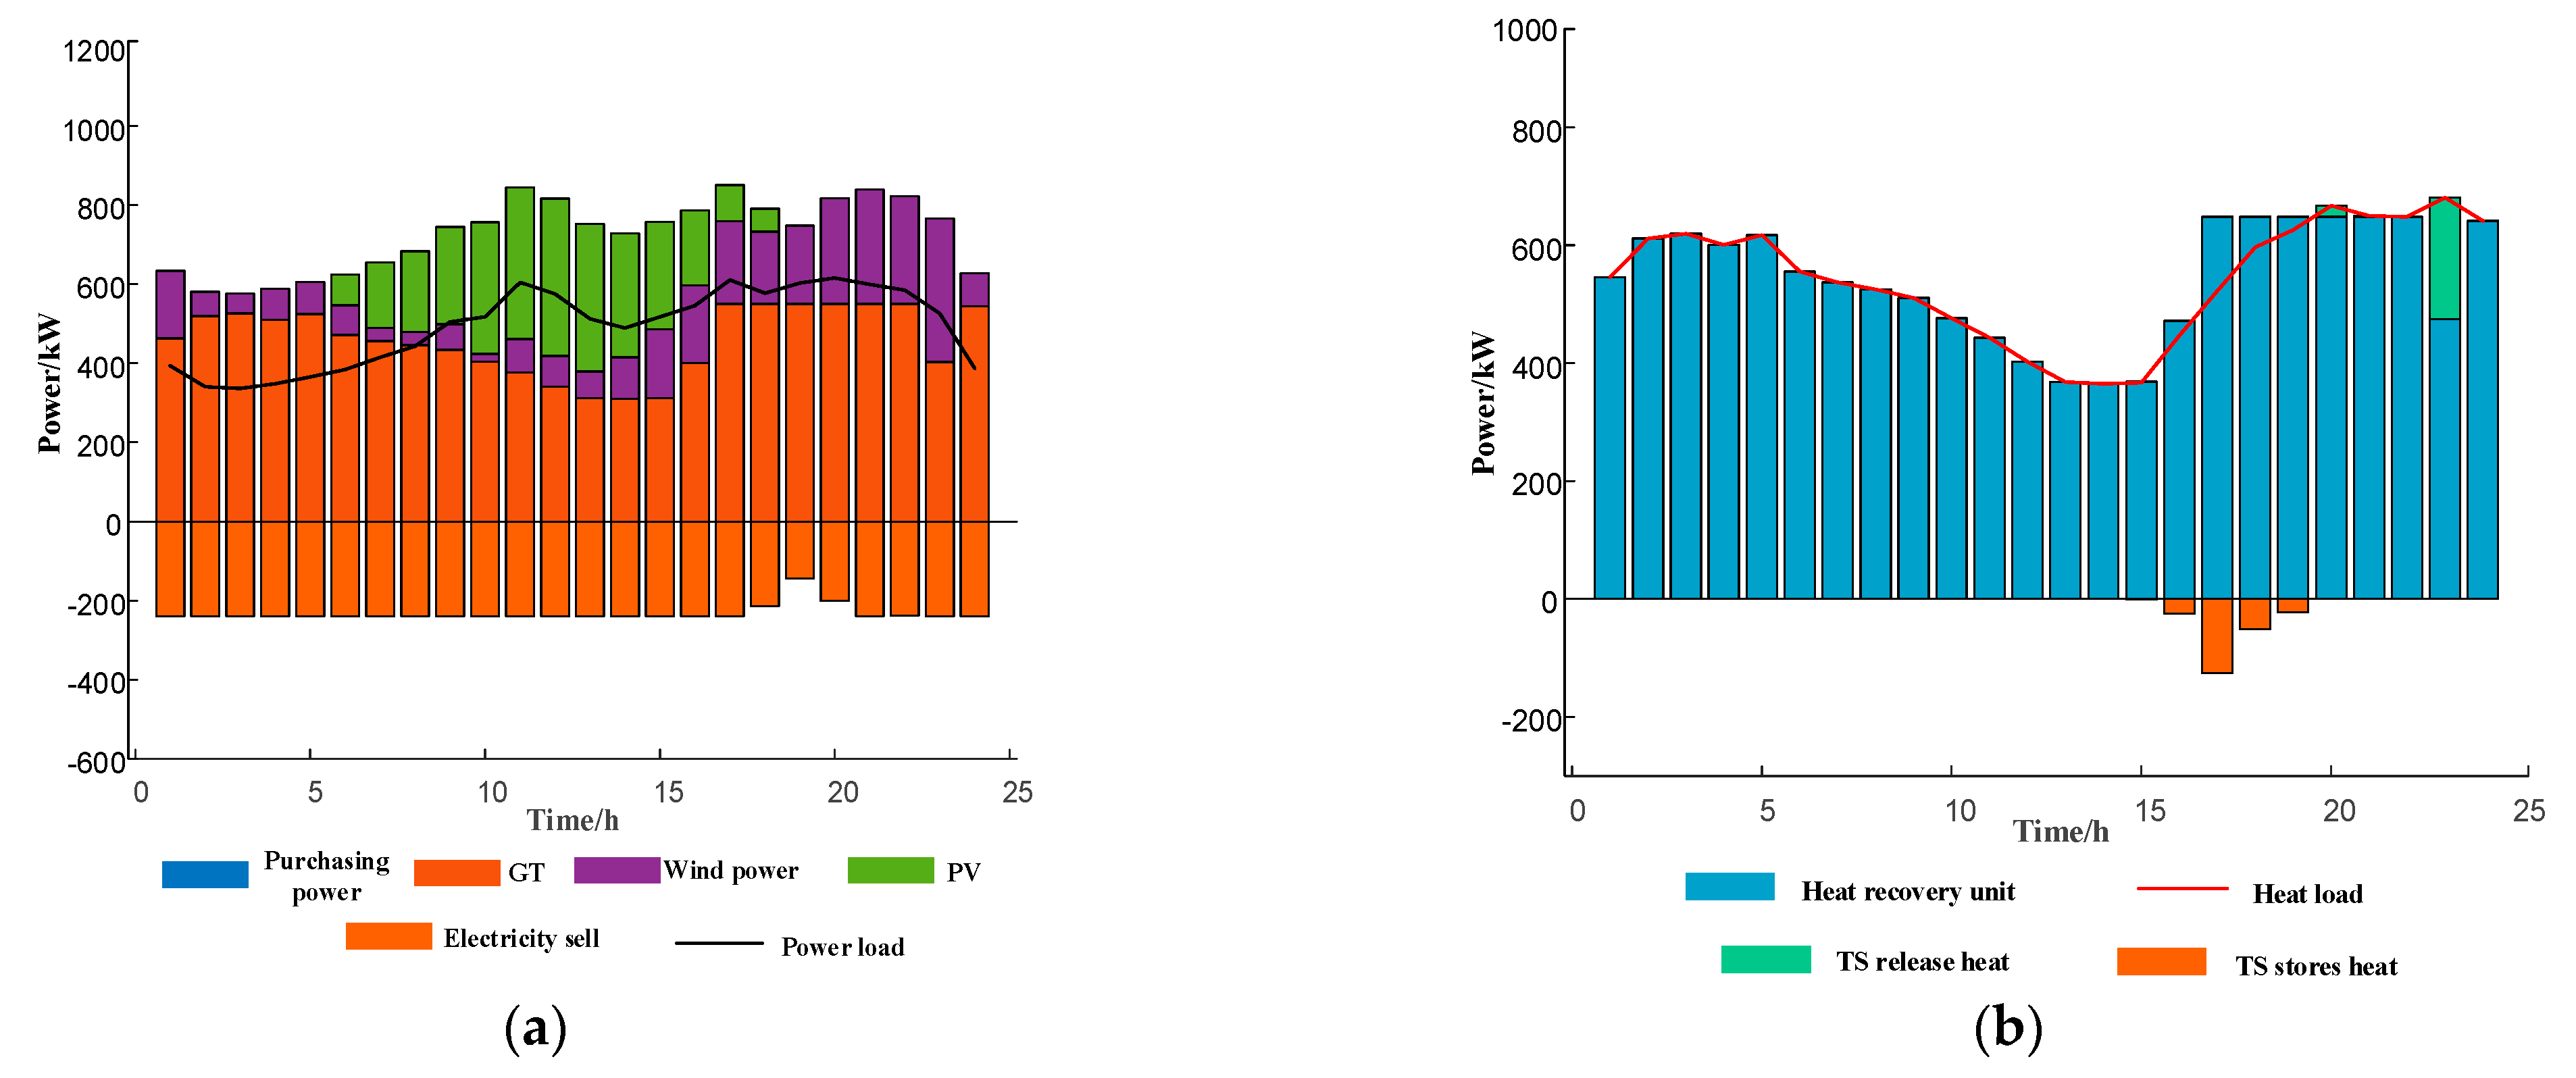
4.3.1. Flexible Load Is Not Involved in the Runtime System Optimization

Scenario 1 is the basic scenario, and the system does not consider the flexible load and carbon trading model to participate in the optimization operation. The scheduling results are shown in Figure 3.
Scenario 1 is set as the basic scenario, which does not consider the flexible load and carbon trading model participating in the system operation. In this scenario, the power load is mainly interactively supplied by the upper power grid, wind power, photovoltaic gas turbine, and fuel cell. The heat load is supplied by the CHP unit waste heat recovery system, which absorbs the heat from the gas turbine and the heat storage tank. As can be seen from the power dispatching situation in Figure 3a, in the off-peak period (22:00–05:00), clean energy such as gas turbine and wind power is mainly used to meet the power load at the user side. The excess power can be sold to the superior power grid for profit, or decomposed by electrolytic cells. Photovoltaic and wind power are added to supply power to the side load of users during the peak period (10:00–12:00, 18:00–21:00), and assisted by gas turbines and hydrogen fuel cells to reduce electricity sales to the superior grid and electricity consumption of electrolytic cells during this period. As can be seen from the thermal power output of each equipment in Figure 3b, the thermal energy storage combined with the waste heat recovery device of the CHP unit provides heat for users at the same time during the peak heating price period (00:00–08:00, 19:00–24:00). The waste heat recovery device provides heat during the period of low heat use, while the heat storage tank collects the excess heat and releases the heat to supply energy to the user during the peak time of heat price and heat use. In scenario 1, the economic and environmental benefits of the system are shown in Table 4.

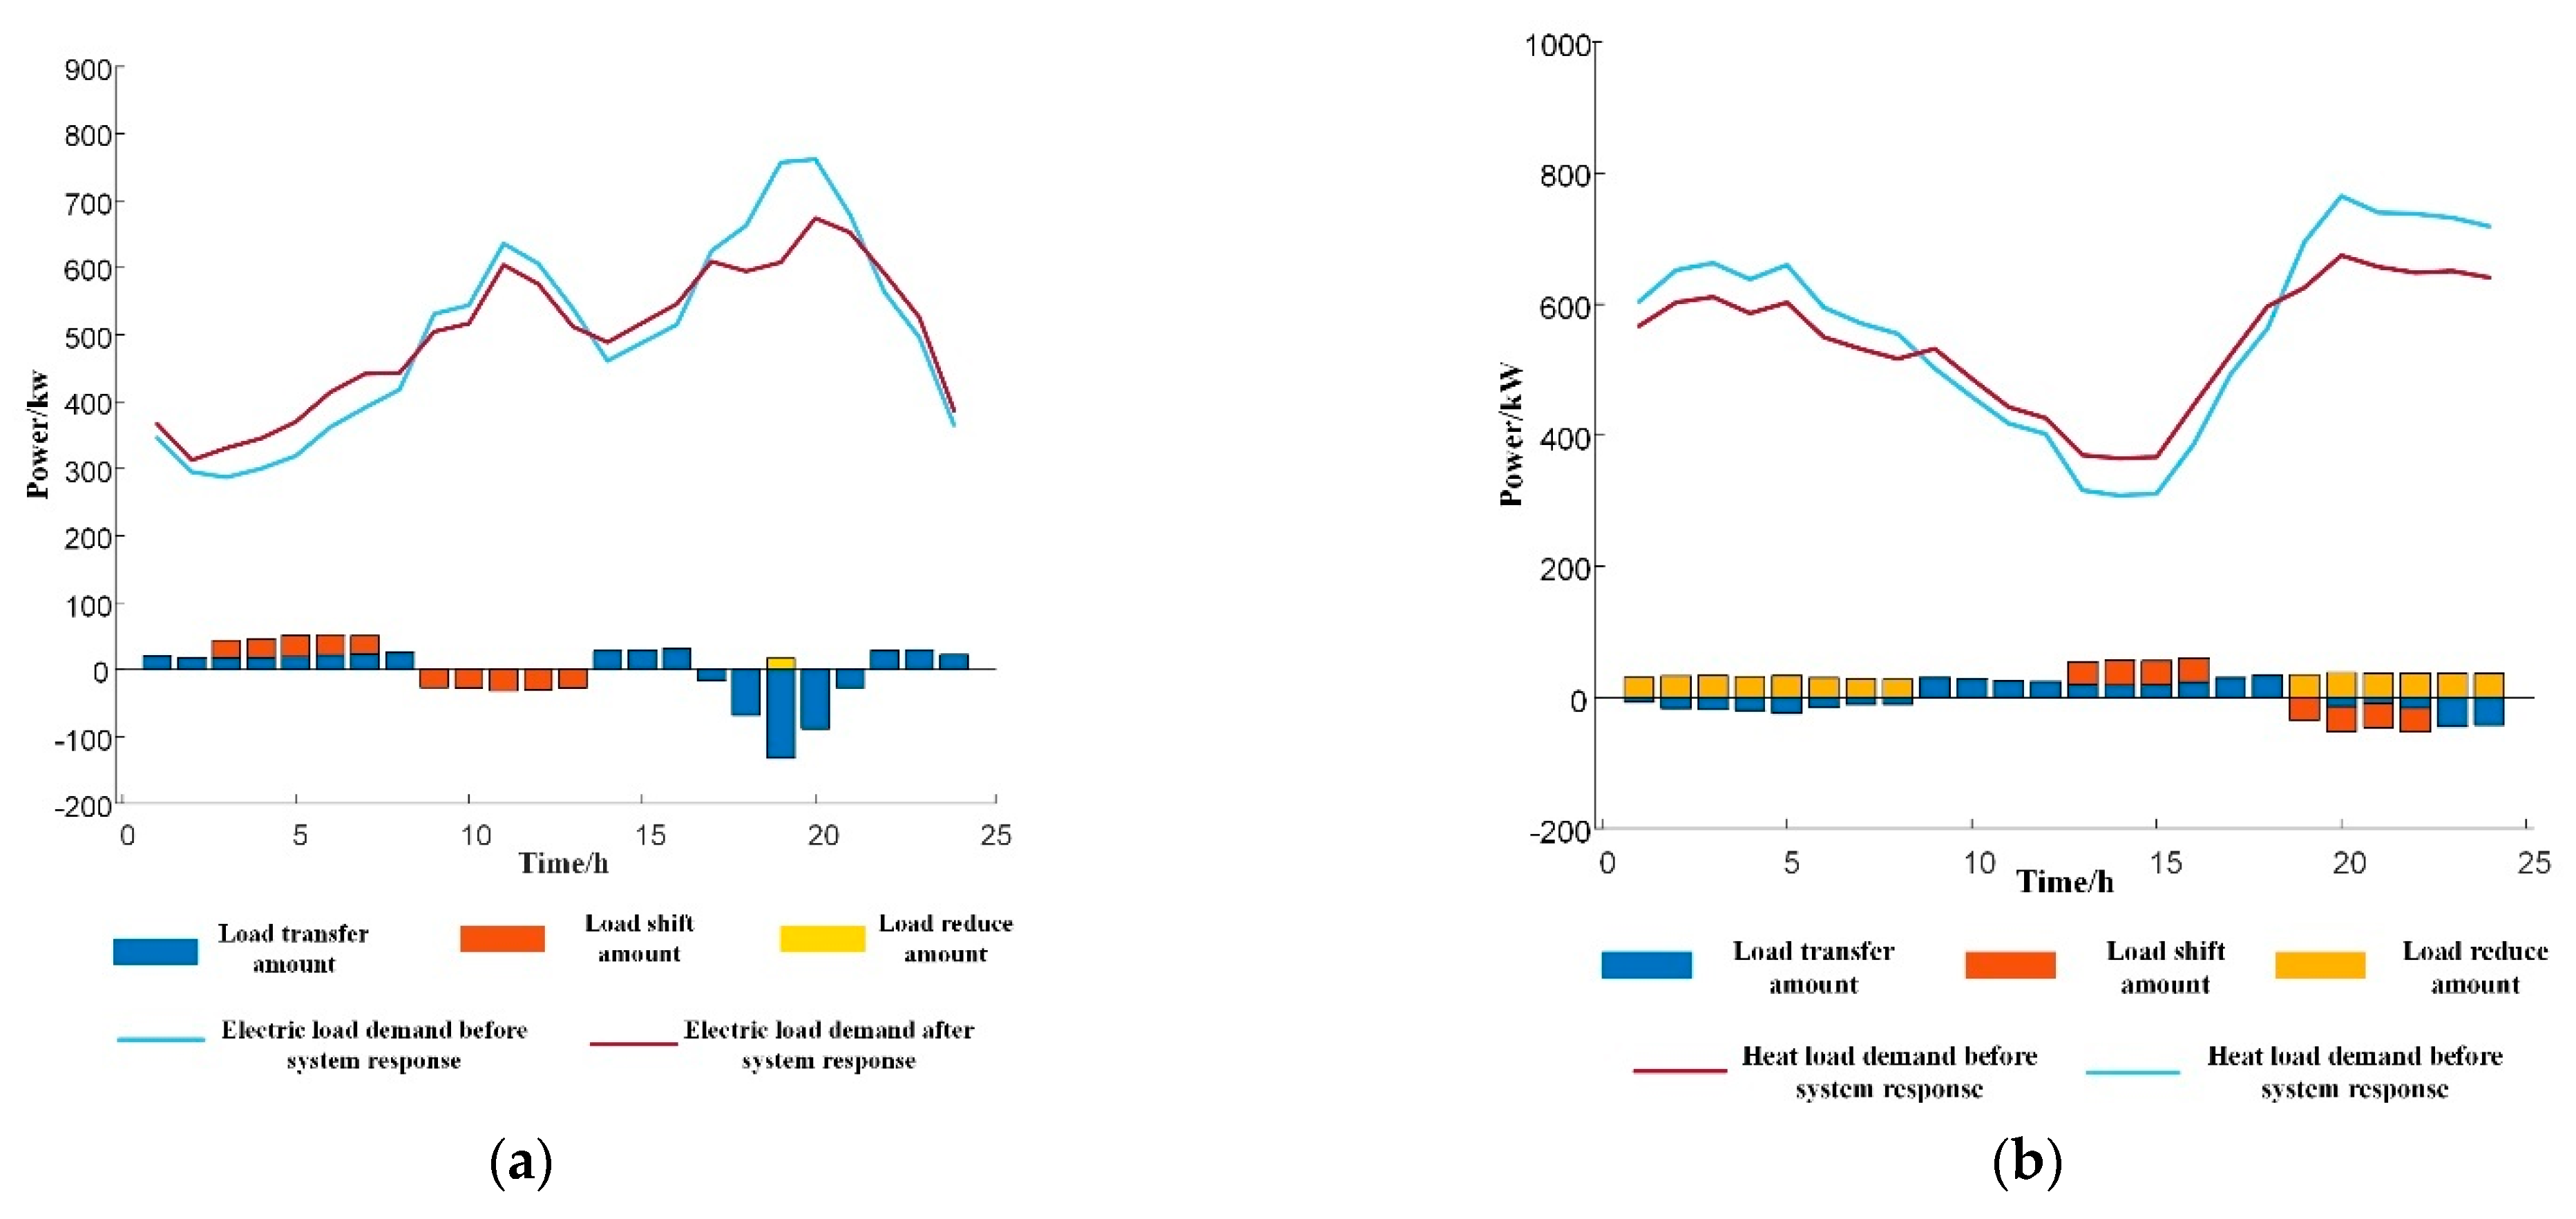
4.3.2. Flexible Load Participates in System Optimization Operation

Scenario 2 is different from Scenario 1, in that flexible load is added to the system to participate in the optimization operation. The scheduling results are shown in Figure 4 and Figure 5; we will now proceed with their analysis.
After the flexible load is added to the system in Scenario 2, the comparison between Figure 3a and Figure 4a shows that the total output power of the system decreases during the peak power consumption period (10:00–12:00, 15:00–20:00), and the power of the system decreases by 200–400 kW. This is because the system considers the participation of flexible load, load reduction, and shift or transfer behavior occurring in the peak period of electricity consumption; then, the load will shift or transfer to the peak period of electricity consumption. This not only reduces the energy supply pressure of the system, but also promotes the wind power absorption capacity at night to a certain extent. The excess electricity can be sold to the superior power grid to increase the operating efficiency of the park system. By comparison with Figure 3b and Figure 4b, the gas turbine is in a quasi-full power state during 00:00–07:00. Under the gas turbine’s heat fixed power mode, the waste heat recovery device can absorb enough heat to meet the user side heat load without the need for a heat storage tank. In general, the heat load of scenario 2 is provided by the CHP waste heat recovery device, the excess heat is absorbed by the heat storage tank from 16:00 to 19:00, and the heat is replanted at night.
As can be seen from the optimized flexible thermal load distribution curve of scenario 2 in Figure 5a, the peak value of system electricity consumption decreases while the valley value increases. Adding flexible load can play a role in calming load fluctuation, reducing the peak difference, and then reduce the adverse impact of system fluctuation. For the same reason, as shown in Figure 5b, the distribution curve after optimization of thermal load shows that the addition of flexible thermal load decreases the peak thermal value and increases the peak thermal pressure. The economic and environmental benefits of Scenario 2 in the system are shown in Table 5.
By comparing Table 4 and Table 5, it can be seen that in Scenario 2, the equivalent daily value of P2G and investment cost is higher than that in Scenario 1, because P2G equipment is invested in in Scenario 1, while there is no investment in Ccenario 2. Therefore, Scenario 3 was introduced, and P2G equipment was invested in for analysis, based on Scenario 2.

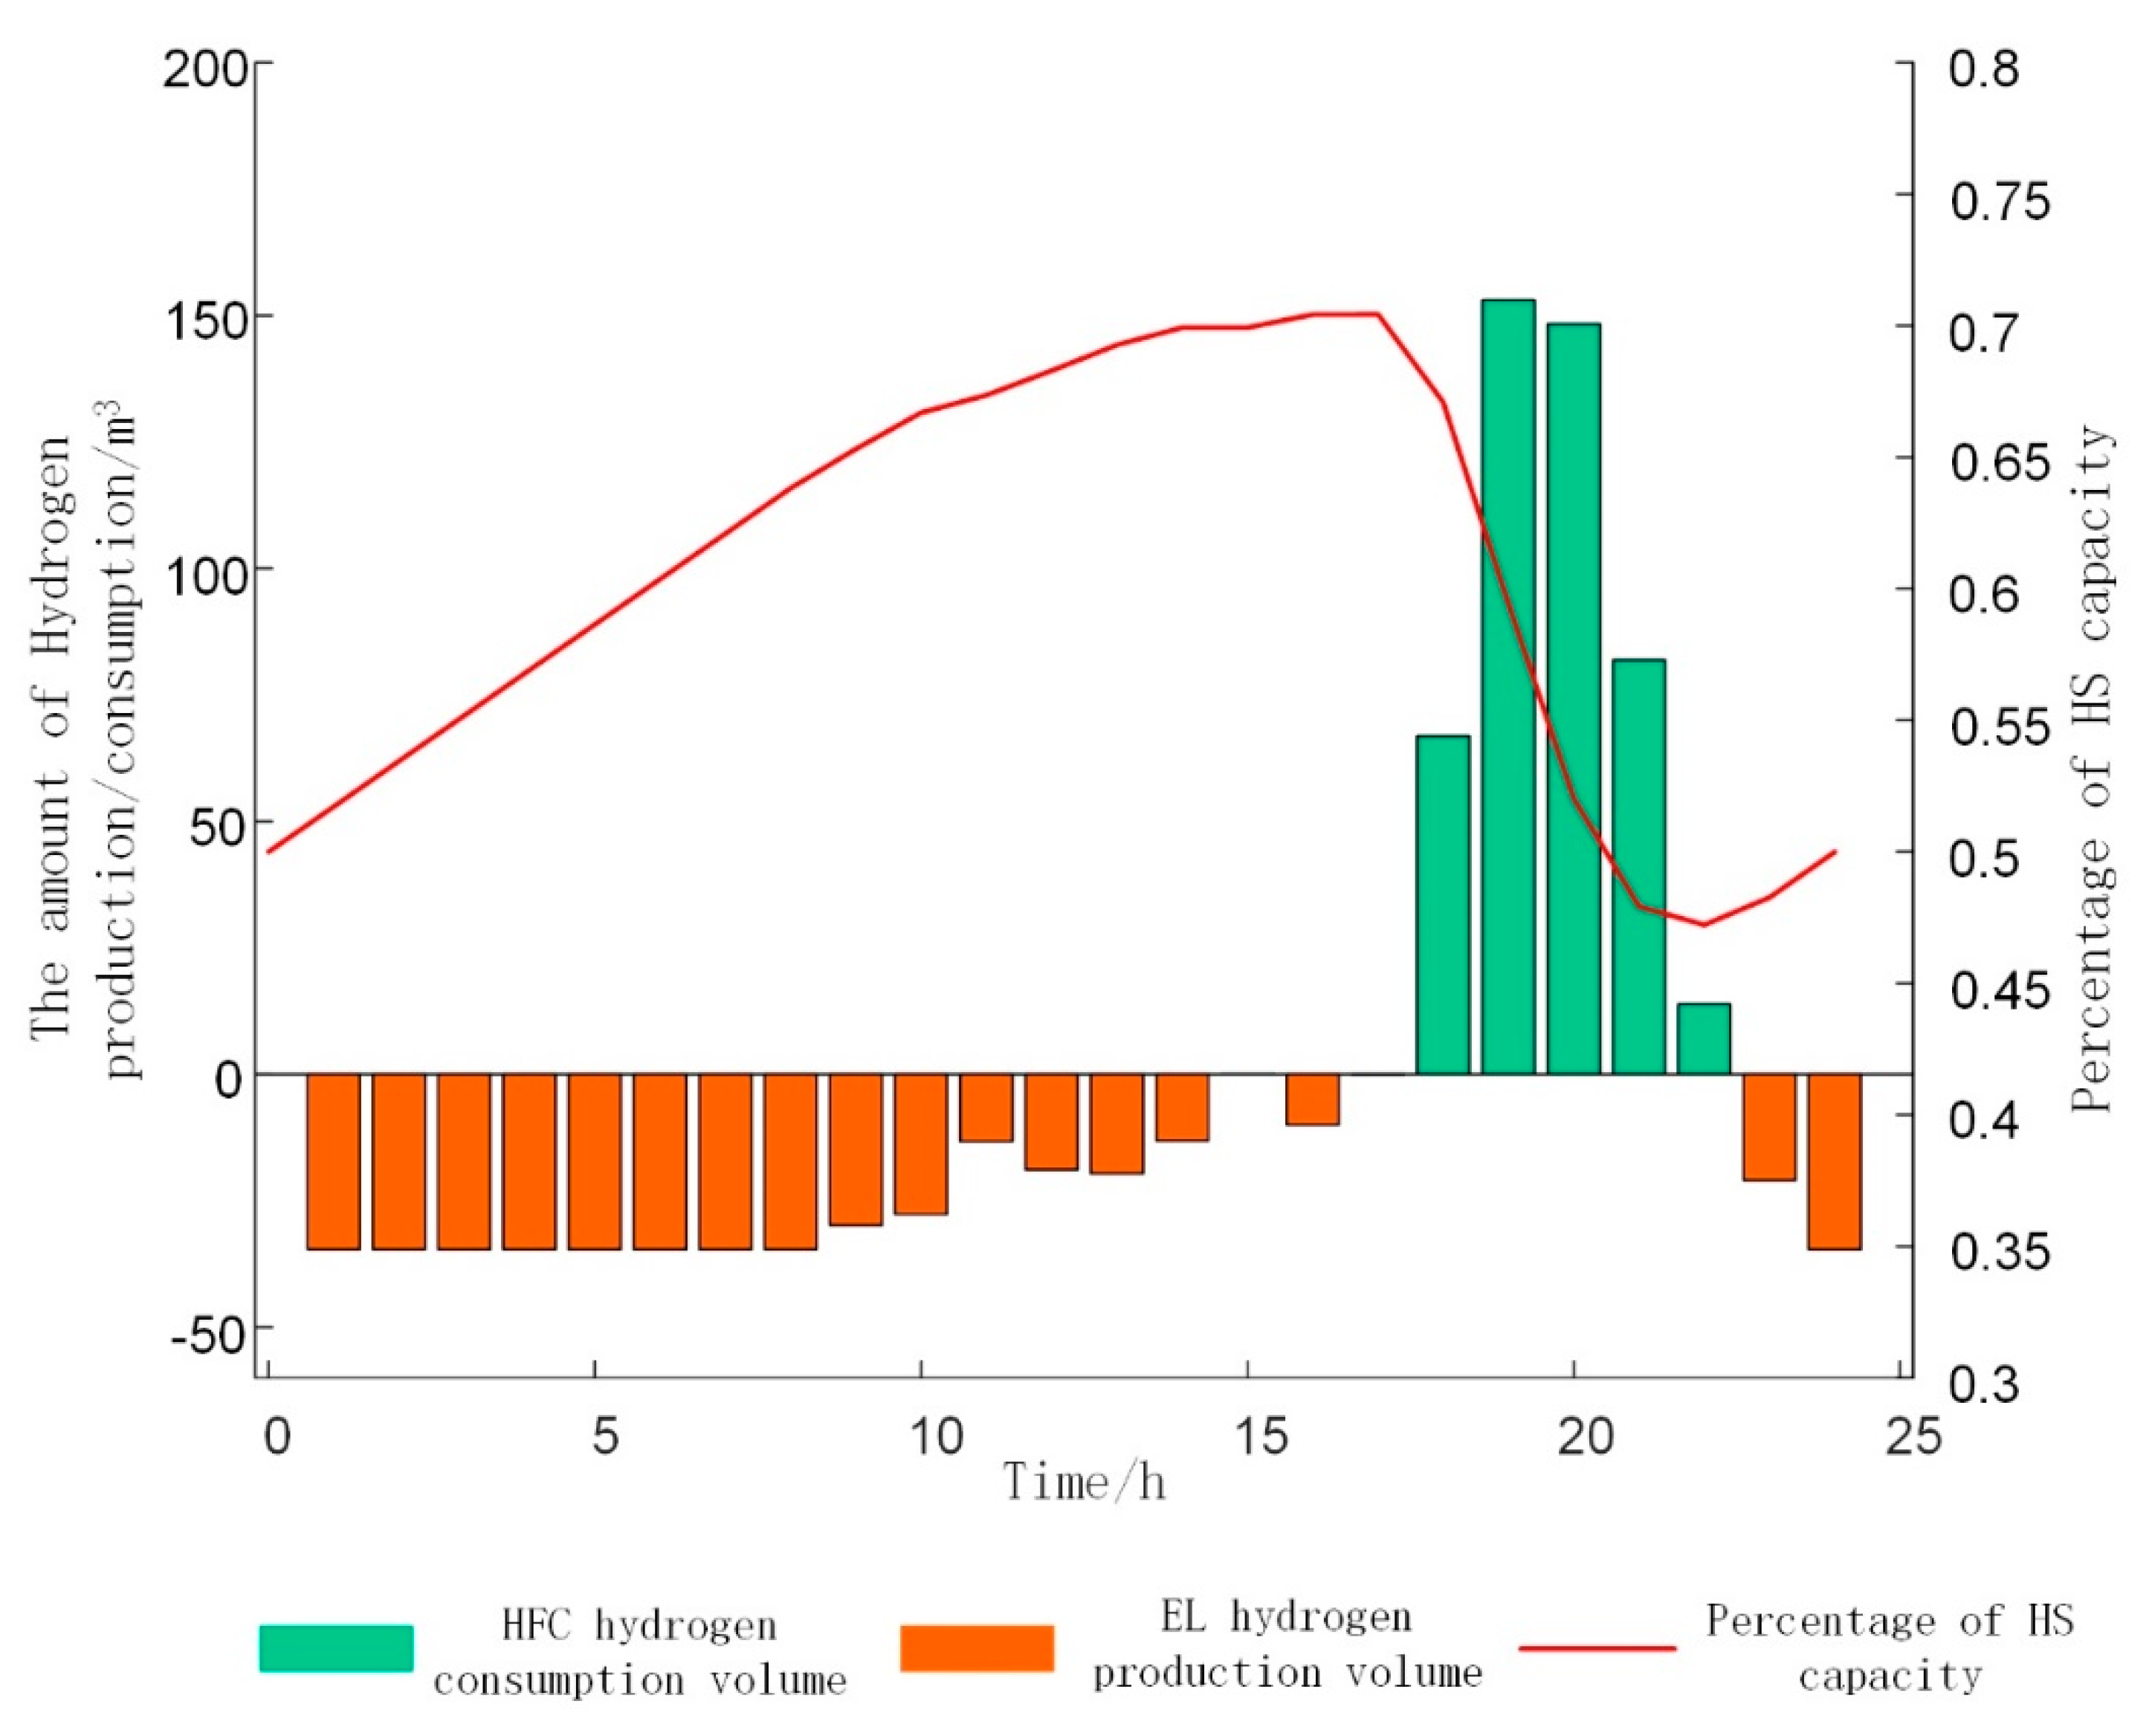
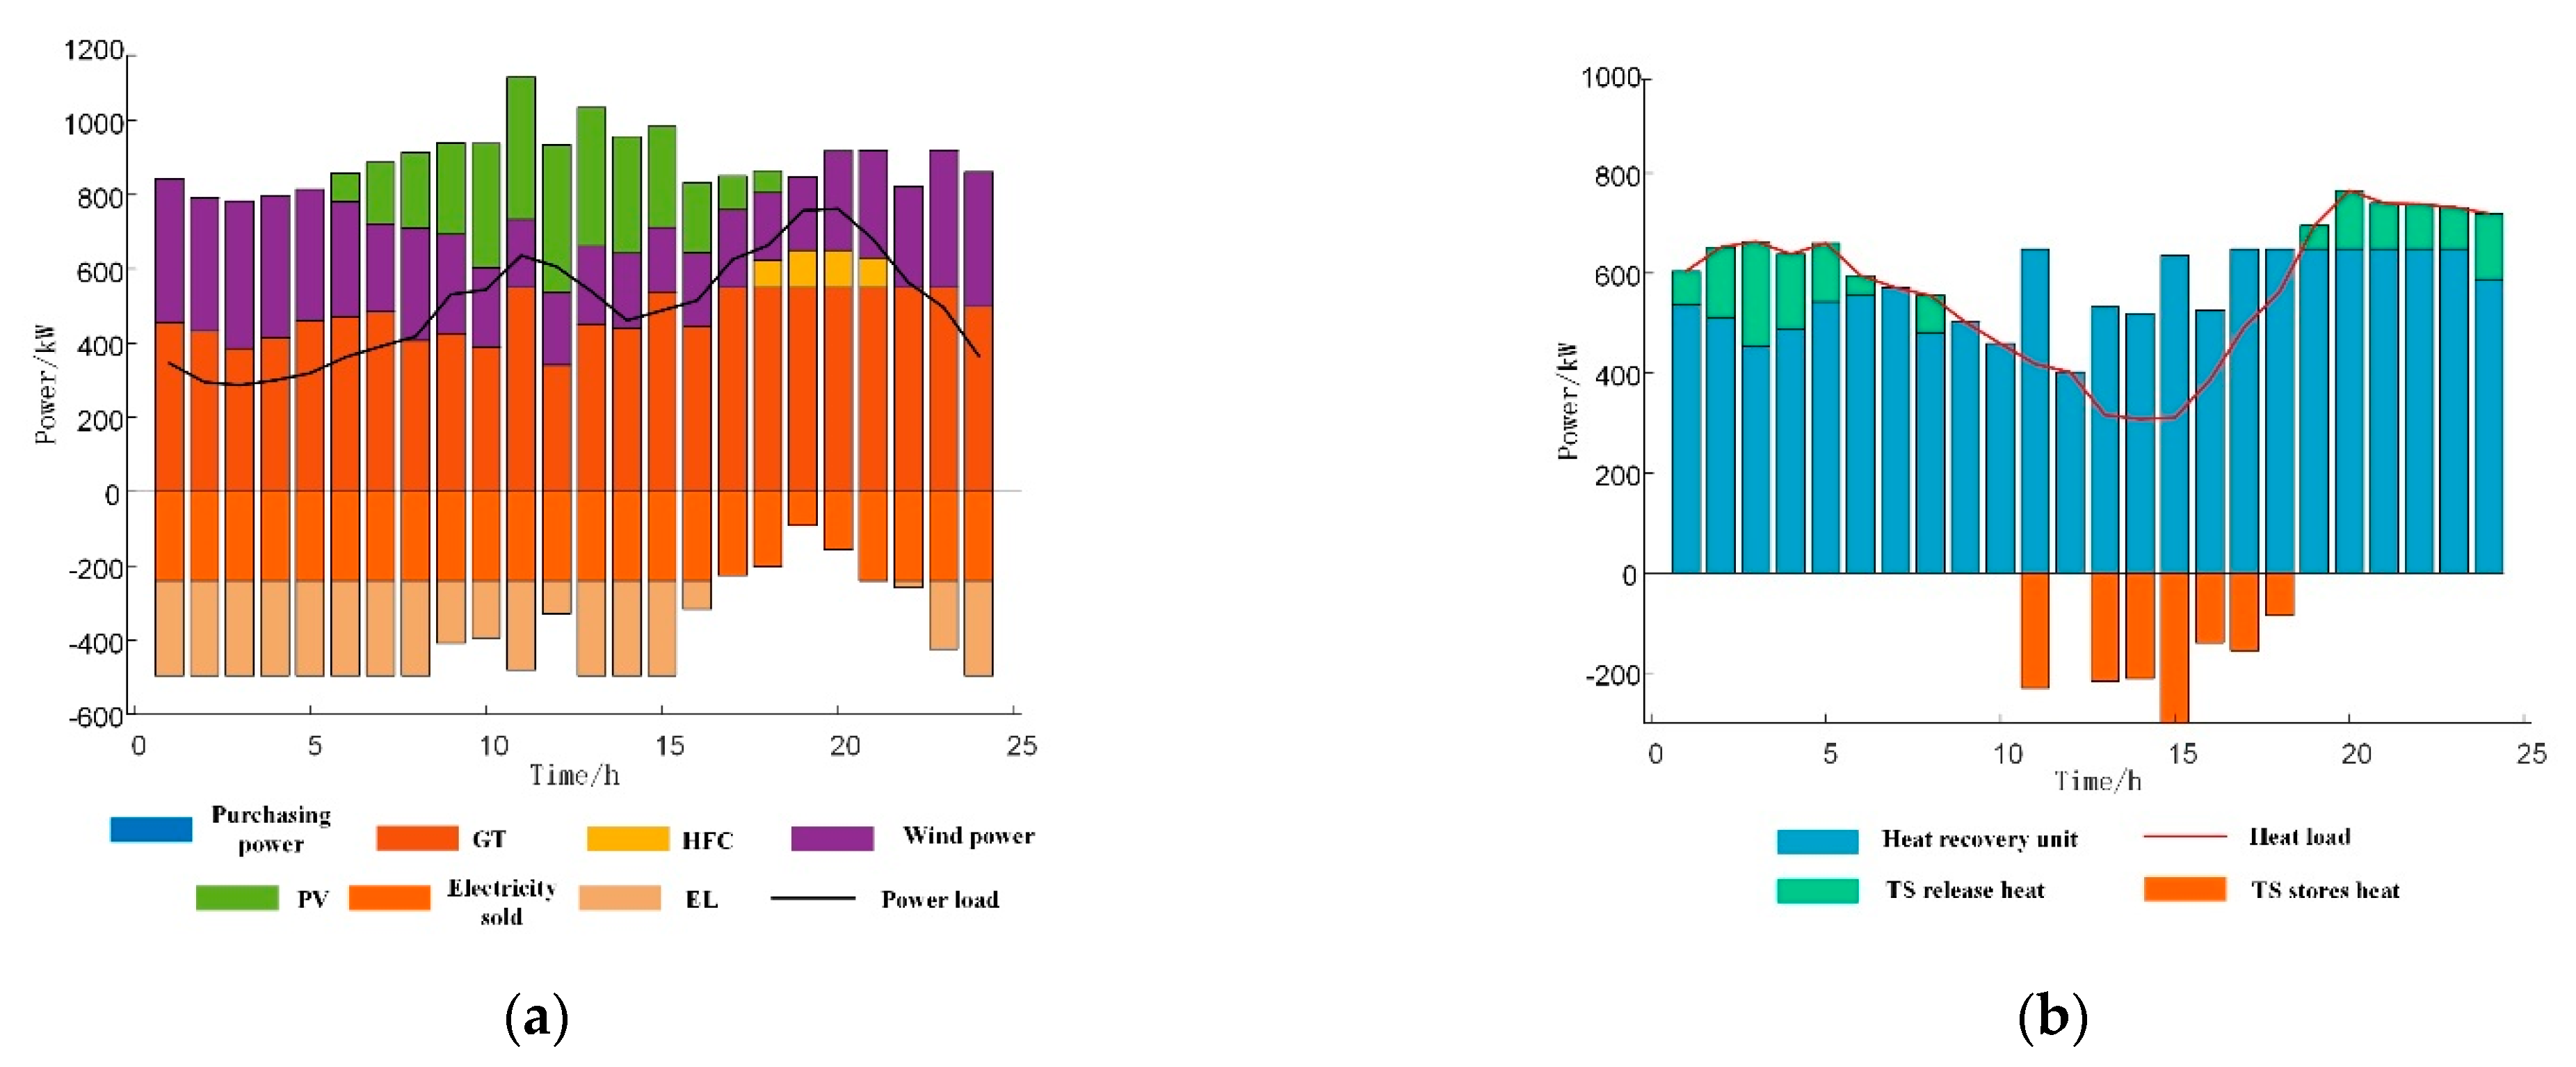
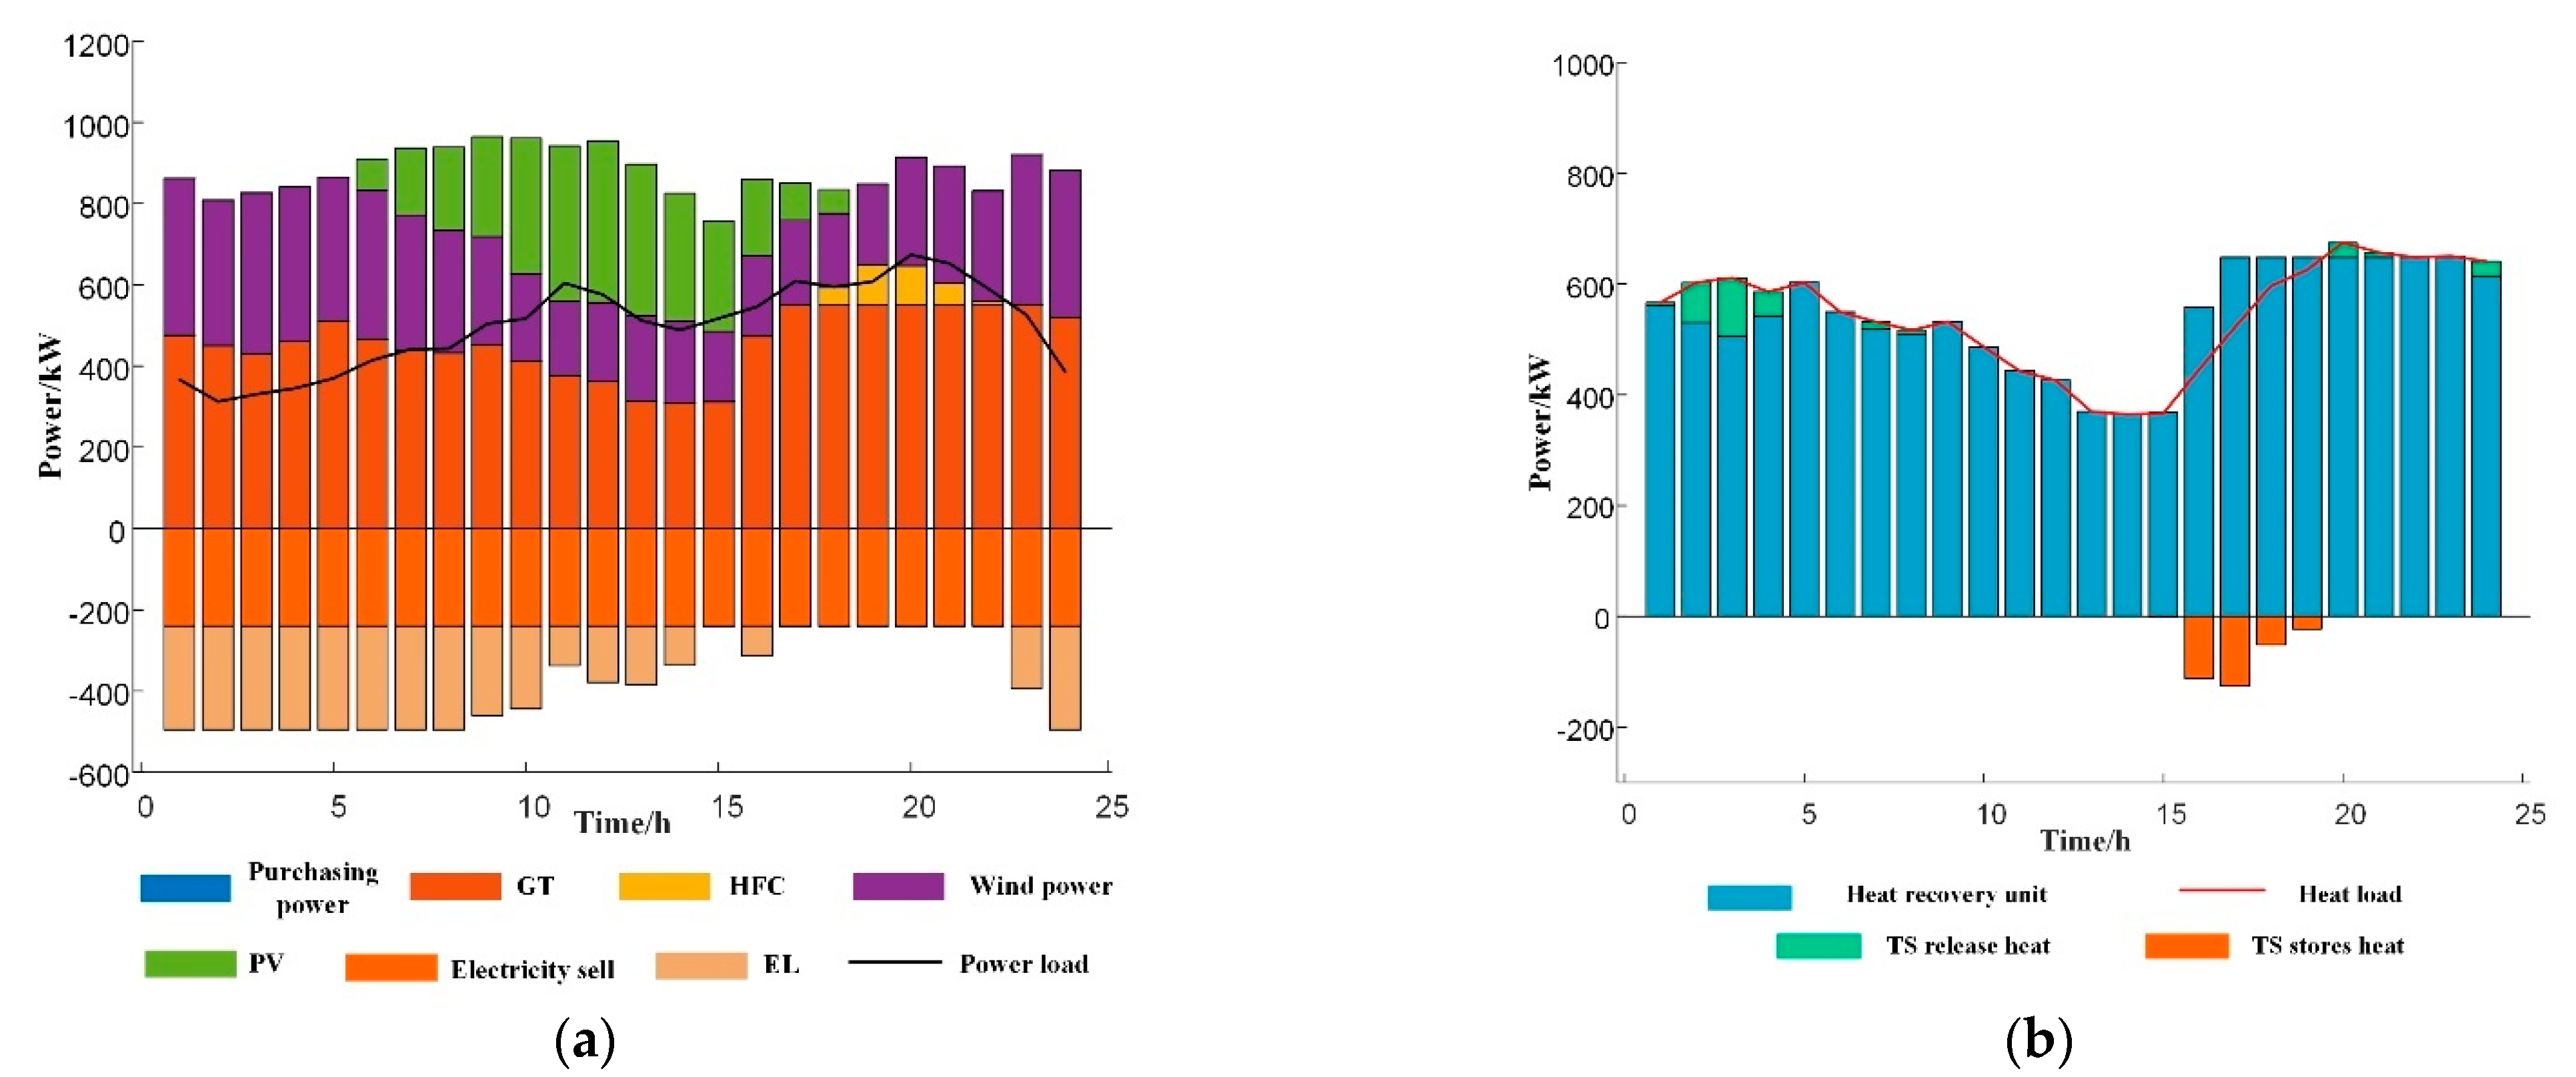
4.3.3. Flexible Load and P2G Technology Cooperate to Participate in the System Optimization Operation

Scenario 3 is based on Scenario 2 in that power-to-gas equipment was added, that is, the influence of the synergistic effect of flexible load and power-to-gas on the optimal operation of the system is considered. See Figure 6 and Figure 7 for the results.
Figure 6 shows the electrical and thermal output results of Scenario 3 after system optimization operation. It can be seen from Figure 6a that the electric load is low and the heat load is high at night, which requires the gas turbine to work at full load and provide heat for the waste heat recovery device to meet the heat load demand of users. Due to the large consumption of the gas turbine, the system cannot fully absorb wind power, and wind abandonment occurs. In Scenario 3, after the P2G equipment is added to the system, the surplus wind power is absorbed through the electrolytic cell to convert the electricity into natural gas or into the hydrogen storage tank. According to Figure 8 and the percentage of the real-time capacity of the hydrogen storage tank, we can see that with the increasing consumption of wind power and photovoltaic power, the hydrogen storage capacity keeps rising. The percentage of hydrogen storage tank capacity starts to decline from 17:00. During this period, the electric load increases, the gas turbine is at full capacity, and the wind power is completely absorbed by the system and assisted by hydrogen fuel cells for power generation. From the perspective of clean energy utilization, P2G equipment can effectively reduce discarded energy and improve the effective utilization rate of clean energy. Although P2G equipment cannot directly reduce the discarded energy of clean energy, it can indirectly promote the utilization efficiency of clean energy by absorbing gas converted by P2G equipment. As shown in Figure 6b, the heat load at the user side is mainly heated by the waste heat recovery device and replenished by the heat storage tank. The gas turbine is in a full-power state at night, and the heat load demand at night is high. The gas turbine works in the heat fixed-power mode to meet the heat load demand at night.
As shown in Figure 7a, the number of flexible electrical loads participating in load translation and transfer increases during the period of 03:00 to 07:00. This period is the electricity trough period, and there will be load transfer or translation in the peak period of electricity consumption into this period, so as to reduce system pressure and smooth system fluctuations. Similarly, the flexible load will participate in reduction or transfer behavior during another peak period. In Figure 7b, it can be seen that during the peak of heat load at night, the flexible heat load, accompanied by high-frequency transfer, reduction or translation behavior, enters a low stage of heat load under the condition of reasonable capacity. The addition of flexible load strengthens the wind power absorption capacity of the system, flattens the load curve, and reduces the load peak difference. In Scenario 3, the economic and environmental benefits of the system are shown in Table 6.
As can be seen from Table 6, the synergistic effect of flexible load and electricity-to-gas conversion can greatly promote the wind power consumption of the system and increase the economic operation capacity of the system. In addition, although the operation cost is increasing, the system economy and the user economy achieve a win-win effect.

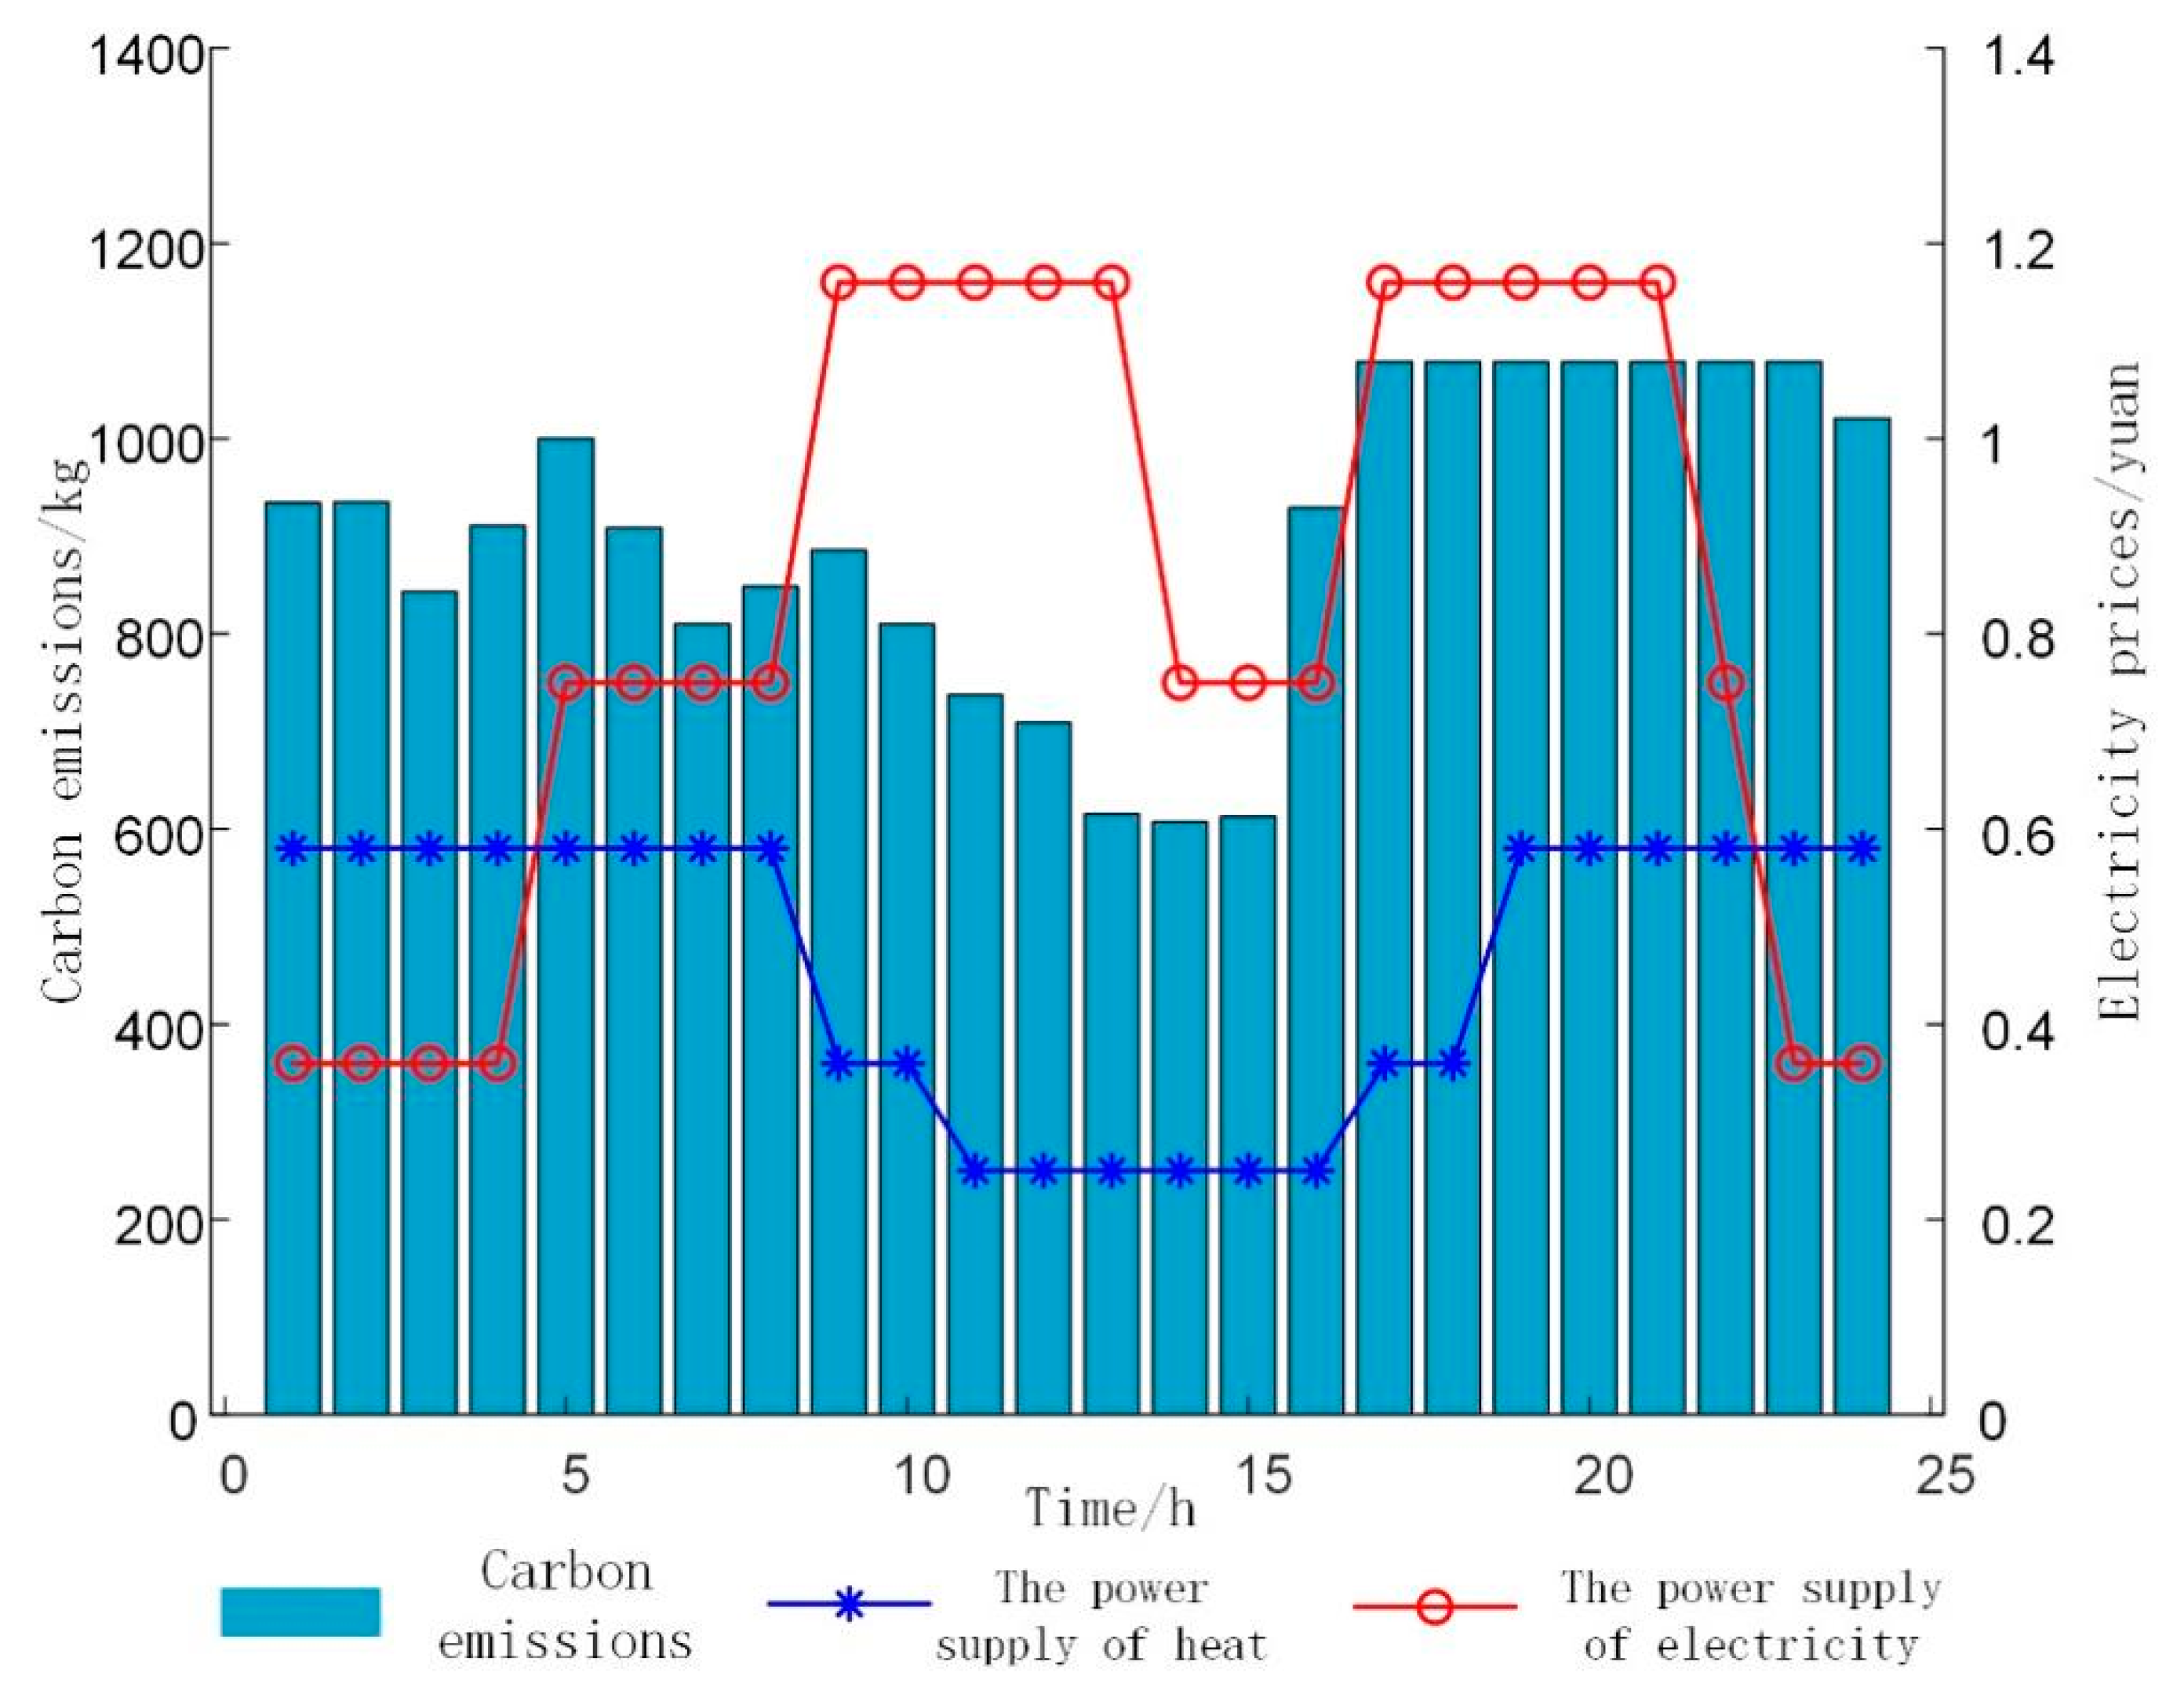
4.3.4. Analysis of System Optimization Operation under the Carbon Trading Mechanism

Scenario 4 is the optimal model chosen for the model in this paper. Considering the electric–gas equipment and flexible load participating in the optimization operation of the system, the carbon trading model is added, and the positive role of the model selected in this paper on the economic and low-carbon operation of the system is comprehensively analyzed. The economic and environmental benefits of the system under the four scenarios are compared in Table 7.
From the comparative analysis of Table 7, it can be seen from the economic perspective that with the cooperative operation of flexible load, P2G equipment, and carbon trading model, the total cost is continuously reduced until it is optimal. In Scenario 3, compared with Scenario 1, flexible load is added into the model to participate in operation. Although there is a certain compensation for load reduction, flexible load improves the system’s capacity to absorb wind power, reduces the amount of purchasing from the external grid, and reduces the system’s carbon emissions to a certain extent, thus saving economic costs. From the perspective of clean energy utilization, Scenario 3 adds P2G equipment on the basis of Scenario 2, which greatly reduces the wind abandonment situation of the system. As can be seen from Table 7, limited by the total amount of energy abandoned, the hydrogen storage equipment capacity, P2G equipment investment, system operation and maintenance and other factors, P2G input is not guaranteed to have a proportional relationship with revenue, nor an inverse relationship with the volume of air abandoned. First, with the continuous improvement of the P2G capacity, system investment and operation and maintenance costs will continue to increase. Second, due to the limitation of the total amount of clean energy abandoned, the clean energy converted by P2G equipment is limited, and the capacity of hydrogen storage tank is limited.
From the perspective of carbon trading model, Scenario 4 and Scenario 3 are compared. Since the carbon trading model is added in Scenario 4, the demand response ability of the user side can be effectively brought into play, reducing the energy purchase cost of the user and carbon emission at the same time. The reason is that when wind power is surplus, it can cooperate with user demand response to increase the consumption of wind power and reduce carbon emissions. When the energy price is too high, the user-side energy price flexible load takes the dominant position and reduces the user-side load. It is the ladder carbon trading mechanism that gives full play to the characteristics of user-side demand response, changing it from being guided by traditional power prices to being guided by both energy price and carbon trading price; this means greater initiative for users, and provides good performance in terms of comprehensive park economy and carbon emission.
In summary, the joint optimization of P2G and flexible load is of great significance in achieving the dual-carbon goal. Meanwhile, against the background of “dual-carbon” goals, the demand response behavior of user-side energy use also changes to some extent. The PIES optimization model based on the carbon trading mechanism and the cooperative participation of P2G combines the factors of wind power, time-of-use electricity price, gas price, and real-time load. While adjusting its own thermoelectric ratio to achieve energy supply balance, the PIES reduces the operation cost of the system, and gives play to the initiative of energy conservation and the reduction of emissions.

5. Conclusions

For a park-level integrated energy system, a PIES optimization operation model including flexible load, a P2G device, and a carbon trading model was established. Four scenarios are compared and analyzed, and the influence of the cooperative optimization of flexible load and the P2G device on the system is discussed, respectively. On this basis, the energy-saving and emission reduction ability of the system economic dispatch after adding a carbon trading model is studied. Upon comparison with other relevant studies, this article has several innovations and unique features: firstly, the introduction of a tiered carbon trading mechanism that enhances the economic viability of the energy system; secondly, the coupled operation of flexible load and P2G devices, which enables the coordinated optimization of the energy system; thirdly, the proposed method of flexible load management, which effectively schedules renewable energy.
This paper mainly completed the following objectives.
(1)
To deepen the energy saving and emission reduction potential of PIES users and park operators, the paper divided the user-side flexible load into transferable load, transferable load, and reducible load. In addition, P2G equipment was added to the park system for collaborative optimization.
(2)
Adding flexible load to the system to participate in operation is conducive to reducing the load peak-valley difference, calming load fluctuations, and improving the economy and flexibility of the system. The introduction of a P2G device, considering the two-stage operation of converting electricity to gas to promote the consumption of wind power, can give play to the time-shift advantages of hydrogen storage and can also reduce the step loss of energy.
(3)
With the gradual introduction of flexible load and P2G equipment into the PIES’ system, the optimized configuration capacity of the gas turbine keeps decreasing, the optimized configuration capacity of photovoltaic wind power keeps increasing, and the total amount of wind power and other clean energy that the system can absorb keeps increasing. At the same time, after the introduction of carbon trading model, the total operating cost and total carbon emission of the system are continuously reduced.
(4)
The comprehensive energy system of a typical electric heating park is simulated and analyzed. The simulation results show that the operation optimization model established in this paper can realize the optimal operation of the integrated energy system in the park under different price mechanisms. Compared with traditional operation conditions, the scenario considering the grid demand response has obvious advantages in improving the system energy efficiency, improving the utilization rate of key equipment, and reducing operating costs.
The next step is to study the influence of P2G capacity configuration, energy storage configuration, and the stepped carbon trading mechanism on system scheduling for a class of integrated cold-source systems containing cold heat electricity. The paper does not consider the costs of hydrogen transportation, oxygen transportation, system equipment installation labor costs, transmission losses and other costs, which may lead to a certain deviation between the calculated costs in the paper and the actual operating cost. However, this deviation can be effectively controlled within a reasonable range.

Author Contributions

Conceptualization, H.S. methodology, L.K.; software, X.S.; validation, W.K., L.K. and X.S.; formal analysis, X.S.; investigation, H.S.; resources, H.S.; data curation, W.K., L.K. and X.S.; writing—original draft preparation, W.K.; writing—review and editing, L.K. and X.S.; visualization, W.K.; supervision, H.S.; project administration, X.S.; funding acquisition, H.S. All authors have read and agreed to the published version of the manuscript.

Funding

This work was supported in part by the Scientific and Technological Planning Project of Jilin Province (YDZJ202201ZYTS642), the Shandong Provincial Natural Science Foundation (ZR2023QF036), the Basic Research Projects of Science, Education and Industry Integration Pilot Project of Qilu University of Technology (Shandong Academy of Sciences) (No. 2023PX081), and the Talent Research Project of Qilu University of Technology (Shandong Academy of Sciences) (No. 2023RCKY054).

Institutional Review Board Statement

Not applicable.

Informed Consent Statement

Not applicable.

Data Availability Statement

Not applicable.

Conflicts of Interest

The authors declare no conflict of interest.

Appendix A

Figure A1. Load and new energy forecast curve.
Sustainability 15 15203 g0a1

Appendix B

Figure A2. Electricity and heating prices and carbon emissions.
Sustainability 15 15203 g0a2

Appendix C

Figure A3. Percentage of HS capacity.
Sustainability 15 15203 g0a3

References

  1. Wan, W.; Ji, Y.; Yin, L.; Wu, H. The application and prospect of carbon trading in the planning and operation of integrated energy systems. Electr. Meas. Instrum. 2021, 58, 39–48. [Google Scholar]
  2. Zeng, H.; Liu, T.; He, C. Multi-objective optimization of gas-electricity interconnection integrated energy system with electricity-to-gas equipment. Electr. Meas. Instrum. 2019, 56, 99–107. [Google Scholar]
  3. Bhardwaj, S.; Patil, S.; Joshi, V.V. Applicability of double power law model for the statistical analysis of meteorological wind velocity time series data. Int. J. Comput. Sci. Math. 2023, 18, 152–161. [Google Scholar] [CrossRef]
  4. Kou, L.; Wu, J.; Zhang, F.; Ji, P.; Ke, W.; Wan, J.; Liu, H.; Li, Y.; Yuan, Q. Image encryption for Offshore wind power based on 2D-LCLM and Zhou Yi Eight Trigrams. Int. J. Bio-Inspired Comput. 2023, 22, 53–64. [Google Scholar] [CrossRef]
  5. Simatupang, D.P.; Choi, J. Integrated Photovoltaic Inverters Based on Unified Power Quality Conditioner with Voltage Compensation for Submarine Distribution System. Energies 2018, 11, 2927. [Google Scholar] [CrossRef]
  6. An, J.; Xu, L.; Fan, Z.; Wang, K.; Deng, Q.; Kang, Q. PSO-based optimal online operation strategy for multiple chillers energy conservation. Int. J. Bio-Inspired Comput. 2021, 18, 229–238. [Google Scholar] [CrossRef]
  7. Sang, J.; Sun, H.; Kou, L. Deep Reinforcement Learning Microgrid Optimization Strategy Considering Priority Flexible Demand Side. Sensors 2022, 22, 2256. [Google Scholar] [CrossRef]
  8. Sheng, S.; Wu, H.; Gu, Q. Low-carbon economic operation of electrical integrated energy system with carbon capture device. Electr. Meas. Instrum. 2021, 58, 82–90. [Google Scholar]
  9. Chen, Z.; Hu, Z.; Weng, C. Multi-stage planning of the comprehensive energy system of the park based on the stepped carbon trading mechanism. Electr. Power Autom. Equip. 2021, 41, 148–155. [Google Scholar]
  10. Sun, H.; Liu, Y.; Peng, C. Optimal scheduling of virtual power plants with carbon capture and waste incineration considering power-to-gas synergy. Power Grid Technol. 2021, 45, 3534–3545. [Google Scholar]
  11. Gao, H.; Li, Z. Coordinated dispatch of electric-gas integrated energy system considering the response characteristics of power to gas and the uncertainty of wind power output. Electr. Power Autom. Equip. 2021, 41, 24–30. [Google Scholar]
  12. Wang, H.; Yang, Y.; Yu, X.; Geng, L.; Lu, Z. Wind power accommodation low-carbon economic dispatch of the integrated electrical and heating systems based on demand response. J. Yanshan Univ. 2021, 45, 142–152. [Google Scholar]
  13. Wang, B. Research on consumers’ response characterics and ability under smart grid: Research on consumers’ response characterics and ability under Smart Grid: A mechanical survey. Proc. CSEE 2014, 34, 3654–3663. [Google Scholar]
  14. Liu, R.; Ma, T.; Gao, Y.; Liang, Y.; Zhu, Y.; Liu, H. Low-carbon Economic Dispatch of Community Integrated Energy System Based on Demand Side Cooperative Response. J. Shanghai Univ. Electr. Power 2020, 36, 421–430. [Google Scholar]
  15. Chen, J.; Hu, Z.; Chen, Y.; Chen, J.; Chen, W.; Gao, M.; Lin, M.; Du, Y. Thermoelectric optimization of integrated energy system considering ladder-type carbon trading mechanism and electric hydrogen production. Electr. Power Autom. Equip. 2021, 41, 48–55. [Google Scholar]
  16. Hamid, K.; Shahram, J. Optimal microgrid operation scheduling by a novel hybrid multi-objective and multi-attribute decision-making. Enengy 2019, 186, 115912. [Google Scholar]
  17. Lim, Y.S.; Koh, S.L.; Hau, L.C.; San Liew, S.M. Business opportunitPIES for grid integrated energy storage systems in Malaysia based on a real case Study. J. Energy Storage 2019, 26, 101028. [Google Scholar] [CrossRef]
  18. Zhang, R.; Jiang, T.; Li, G.; Chen, H.; Li, X.; Ning, R. Two-layer Optimal Scheduling of Power-gas Integrated Energy System Considering the conversion of power to gas to Wind Power Consumption. Proc. CSEE 2018, 38, 5668–5678+5924. [Google Scholar]
  19. Mehrpooya, M.; Mohammadi, M.; Ahmadi, E. Techno-economic-environmental study of hybrid power supply system: A case study in Iran. Sustain. Energy Technol. Assess. 2018, 25, 1–10. [Google Scholar] [CrossRef]
  20. Zhu, X.; Liu, M.; Jiang, Q.; Luo, H.; Long, W.; Wen, H. Low-Carbon Economic Scheduling of P2G Integrated Energy System Considering Demand Response and Carbon Trading. Electr. Instrum. Meas. 2022, 1–9. Available online: http://kns.cnki.net/kcms/detail/23.1202.TH.20220524.1603.003.html (accessed on 6 November 2022).
  21. Pandian, M.S.; Anwari, M.; Husodo, B.Y.; Hiendro, A. Efficiency and economics analysis of Proton Exchange Membrane fuel cell. In Proceedings of the 2010 Conference Proceedings IPEC, Singapore, 27–29 October 2010; pp. 875–880. [Google Scholar]
  22. Li, J.; Li, G.; Ma, S.; Song, J. Hydrogen storage and transportation technology present situation and its typical applications in power systems. Mod. Power 2021, 38, 1–12. [Google Scholar]
  23. Zhu, L.; Wang, J.; Tang, L.; Liu, X.; Huang, C. Robust Stochastic Optimal Scheduling of Integrated Energy System with power-to-gas Refined Model. Power Grid Technol. 2019, 43, 116–126. [Google Scholar] [CrossRef]
  24. Wu, J.; Degejizhifu; Tan, Z.; Zhang, S. Multi-objective Collaborative Optimization Model of integrated energy System considering P2G and CCHP technology. Electr. Meas. Instrum. 2021, 58, 20–30. [Google Scholar] [CrossRef]
  25. Jiang, W.; Yan, Z.; Cao, J.; Xu, X. Multi-objective comprehensive Optimal Scheduling of Energy Hub with Flexible Load. Electr. Meas. Instrum. 2018, 55, 31–39. (In Chinese) [Google Scholar]
  26. Yang, S.; Tong, X.Q.; Liu, J.; Zhang, X.Q. Combined Optimization Model and Solution of Multi-objective Safety Constrained Unit Considering Flexible Load. Power Grid Technol. 2017, 41, 1904–1912. (In Chinese) [Google Scholar] [CrossRef]
  27. Xue, K.; Chu, Y.; Ling, Z.; Li, Z. Considering the integrated energy system of flexible load optimal dispatch of low carbon economy. J. Renew. Energy 2019, 5, 1206–1213. [Google Scholar] [CrossRef]
  28. Zhao, W.; Liu, Y.; Hou, J.; Liu, L. Impact of Carbon Trading Mechanism Considering Blockchain Technology on the Evolution of New Energy Vehicle Industry in the Post-Subsidy Era. Sustainability 2023, 15, 13190. [Google Scholar] [CrossRef]
  29. Wang, J.; Ren, Y.; Guo, Z.; Zhang, Y. Optimal Scheduling of integrated energy system based on comprehensive Demand response and reward and punishment ladder carbon trading. Energy Storage Sci. Technol. 2022, 2177–2187. [Google Scholar] [CrossRef]
  30. Zhang, X.H.; Liu, X.Y.; Zhong, J.Q. Integrated energy system planning considering a reward and punishment ladder-type carbon trading and electric-thermal transfer load uncertainty. Chin. Soc. Electr. Eng. 2020, 40, 6132–6142. [Google Scholar]
  31. Wei, Z.; Zhang, S.; Sun, G.; Xu, X.; Chen, S.; Chen, S. Carbon trading based low-carbon economic operation for integrated electricity and natural gas energy system. Autom. Electr. Power Syst. 2016, 40, 9–16. [Google Scholar]
  32. Liu, W.; Wen, F.; Xue, Y. Power-to-gas technology in energy systems: Current status and prospects of potential operation strategPIES. J. Mod. Power Syst. Clean Energy 2017, 5, 439–450. [Google Scholar] [CrossRef]
  33. Dong, S.; Wang, C.; Liang, J.; Dong, X.; Liang, Z.; Li, H. Multi-objective optimal day-ahead dispatch of integrated energy system considering power-to-gas operation cost. Autom. Electr. Power Syst. 2018, 42, 8–15. (In Chinese) [Google Scholar]
  34. Qin, T.; Liu, H.; Wang, J. Low-carbon economic dispatching of power-heat-gas integrated energy system based on carbon trading. Autom. Electr. Power Syst. 2018, 42, 8–13, 22. [Google Scholar]
  35. Shobana, S.; Gnanavel, B. Optimised coordinated control of hybrid AC/DC microgrids along PV-wind-battery: A hybrid based model. Int. J. Bio-Inspired Comput. 2022, 20, 193–208. [Google Scholar] [CrossRef]
  36. Suman, S.; Chatterjee, D.; Mohanty, R. Power quality improvement for microgrid-connected PV-based converters under partial shading conditions using mixed optimisation algorithms. Int. J. Bio-Inspired Comput. 2023, 21, 123–136. [Google Scholar] [CrossRef]
Figure 1. Structure of the park-level integrated energy system.
Sustainability 15 15203 g001
Figure 2. Two-stage process of P2G.
Sustainability 15 15203 g002
Figure 3. Power output of each device in Scenario 1. (a) Electric power dispatching. (b) Heat power dispatching.
Sustainability 15 15203 g003
Figure 4. Power output of each device in Scenario 2. (a) Electric power dispatching. (b) Heat power dispatching.
Sustainability 15 15203 g004
Figure 5. Scenario 2’s flexible load distribution. (a) Flexible electric load (b) Flexible heat load.
Sustainability 15 15203 g005
Figure 6. Power output of each device in Scenario 3. (a) Electric power dispatching. (b) Heat power dispatching.
Sustainability 15 15203 g006
Figure 7. Scenario 3’s flexible load distribution. (a) Flexible electric load. (b) Flexible heat load.
Sustainability 15 15203 g007
Figure 8. Percentage of real-time capacity of hydrogen storage tank.
Sustainability 15 15203 g008
Table 1. Equipment parameters.
EquipmentCapacityEfficiency Parameters
P2G equipment25 × 1.941 Nm3/(kW·h)0.75
Hydrogen storage2 × 1000/Nm30.95
A fuel cell50 × 2/kW0.55
CHP unit500/kW0.35
Thermal storage tank2000/kW0.98
link240/kW-
Table 2. Comprehensive conversion of power, heat, and gas prices.
CategoryTime SegmentPeriod of TimePrice (CNY kW/h)
Electricity priceValley period23:00–04:000.36
Peak period09:00–13:00
17:00–21:00
1.16
Ordinary periodOther time0.75
Caloric valueValley period11–16:000.25
Peak period19:00–08:000.58
Ordinary periodOther time0.36
Gas priceAll the time00:00–24:00CNY 2.54/m3
Table 3. Four different scenarios.
CategoryEnergy Production EquipmentEnergy Conversion EquipmentFlexible
Load
Carbon Trading
Model
Wind PowerPhotovoltaic CHPP2G
Scenario 1xx
Scenario 2xx
Scenario 3x
Scenario 4
Note: The symbol x means not participating in the collaborative operation, while the symbol √ means participating in the collaborative operation.
Table 4. Economic and environmental benefits under scenario 1.
CategoryPrice/CNY
Energy costs4513.741
Operational costs2895.8464
Wind and light penalty fee53.1553
The investment cost is equivalent to daily8418.2358
Table 5. Economic and environmental benefits of Scenario 2.
CategoryPrice/CNY
Energy costs4082.06
Operational costs1667.76
Wind and solar energy abandoned penalty costs1199.99
Daily investment cost 2673.52
Table 6. Economic and environmental benefits under Scenario 3.
CategoryPrice/CNY
Energy costs3905.8602
Operational costs2626.7489
Wind and light penalty fee10.2817
The investment cost is equivalent to daily8418.2358
Table 7. Multi-scenario comparison results.
ScenarioScenario 1Scenario 2Scenario 3Scenario 4
Category
Wind power abandonment/kW·h151.93428.500
Carbon transaction cost/CNY885.2854.7810.4736.7
Carbon emissions/kg13,310.412,850.112,185.511,077.7
Reduce load compensation costs/CNY117.454.254.2
Oxygen sale proceeds/CNY 711.4610.8610.8
Total cost/CNY15,169.69740.814,394.313,657.6
Disclaimer/Publisher’s Note: The statements, opinions and data contained in all publications are solely those of the individual author(s) and contributor(s) and not of MDPI and/or the editor(s). MDPI and/or the editor(s) disclaim responsibility for any injury to people or property resulting from any ideas, methods, instructions or products referred to in the content.

