
Pixel-Based Soil Loss Estimation and Prioritization of North-Western Himalayan Catchment Based on Revised Universal Soil Loss Equation (RUSLE)

 ,
, 
 and
and
Abstract
:1. Introduction
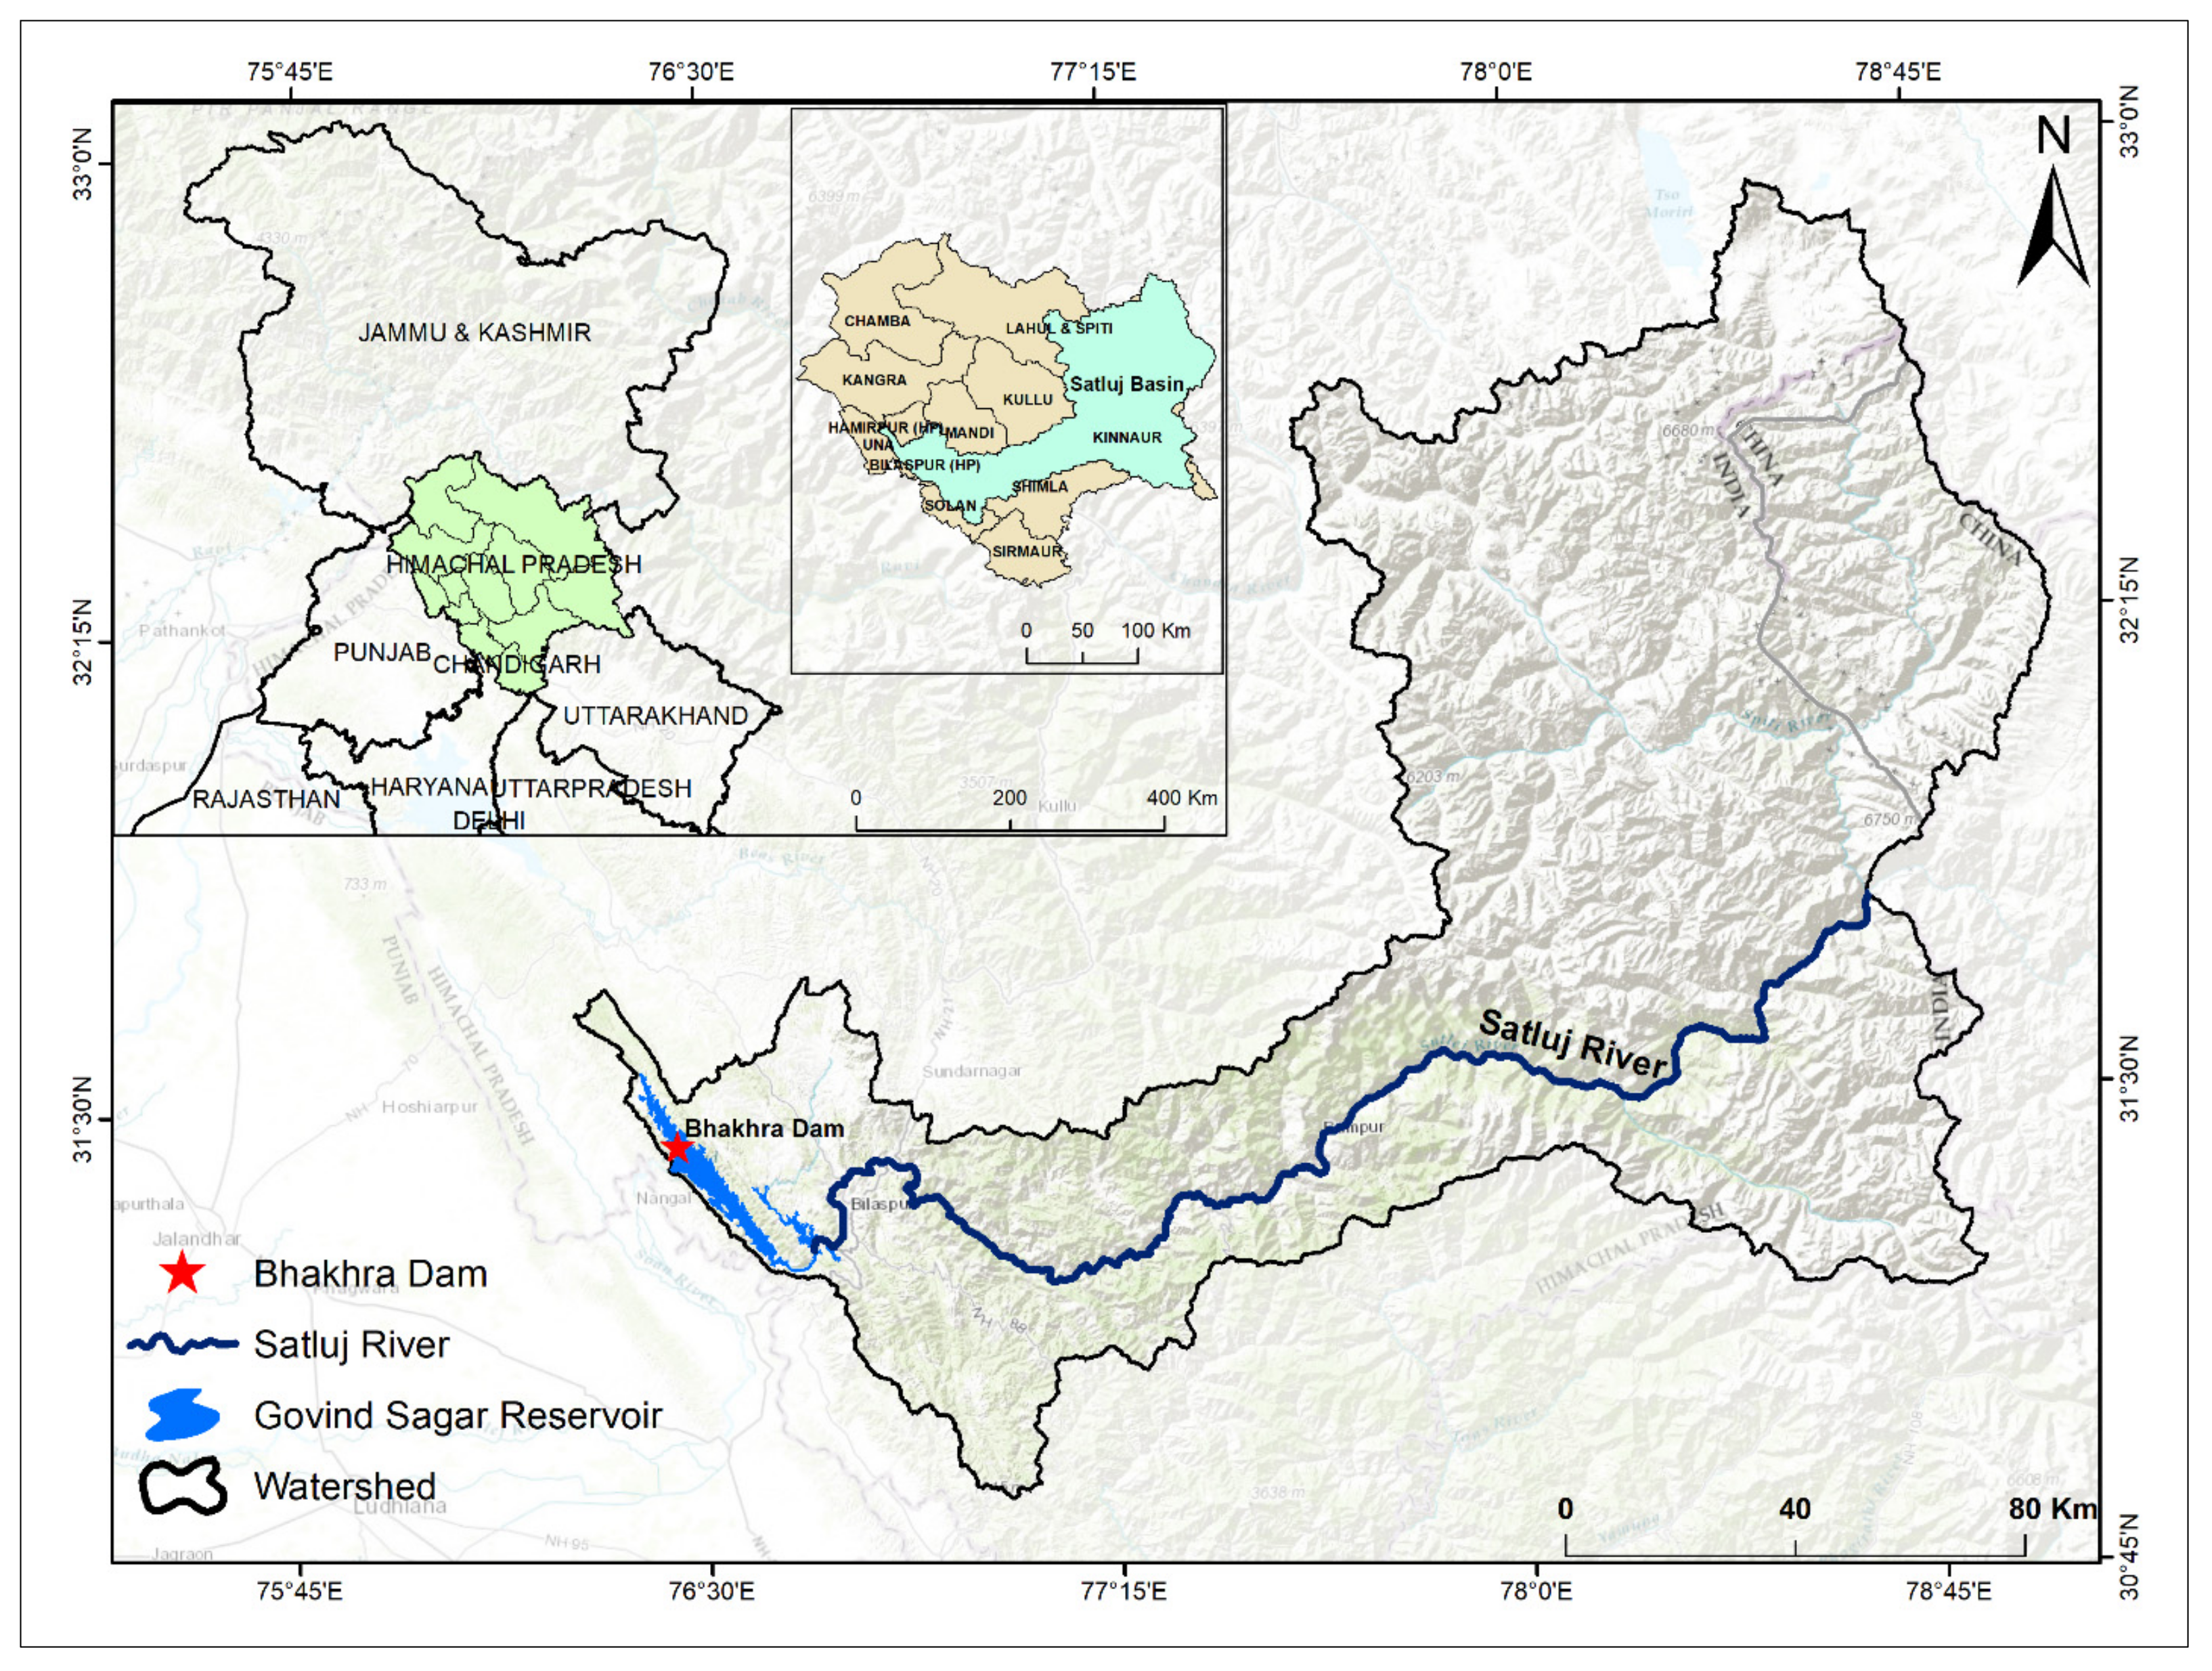
2. Study Area and Datasets
2.1. Hydrogeology of Sutlej Basin
2.2. Soil of Sutlej Basin
2.3. Climate of the Sutlej Basin
2.4. Data Availability
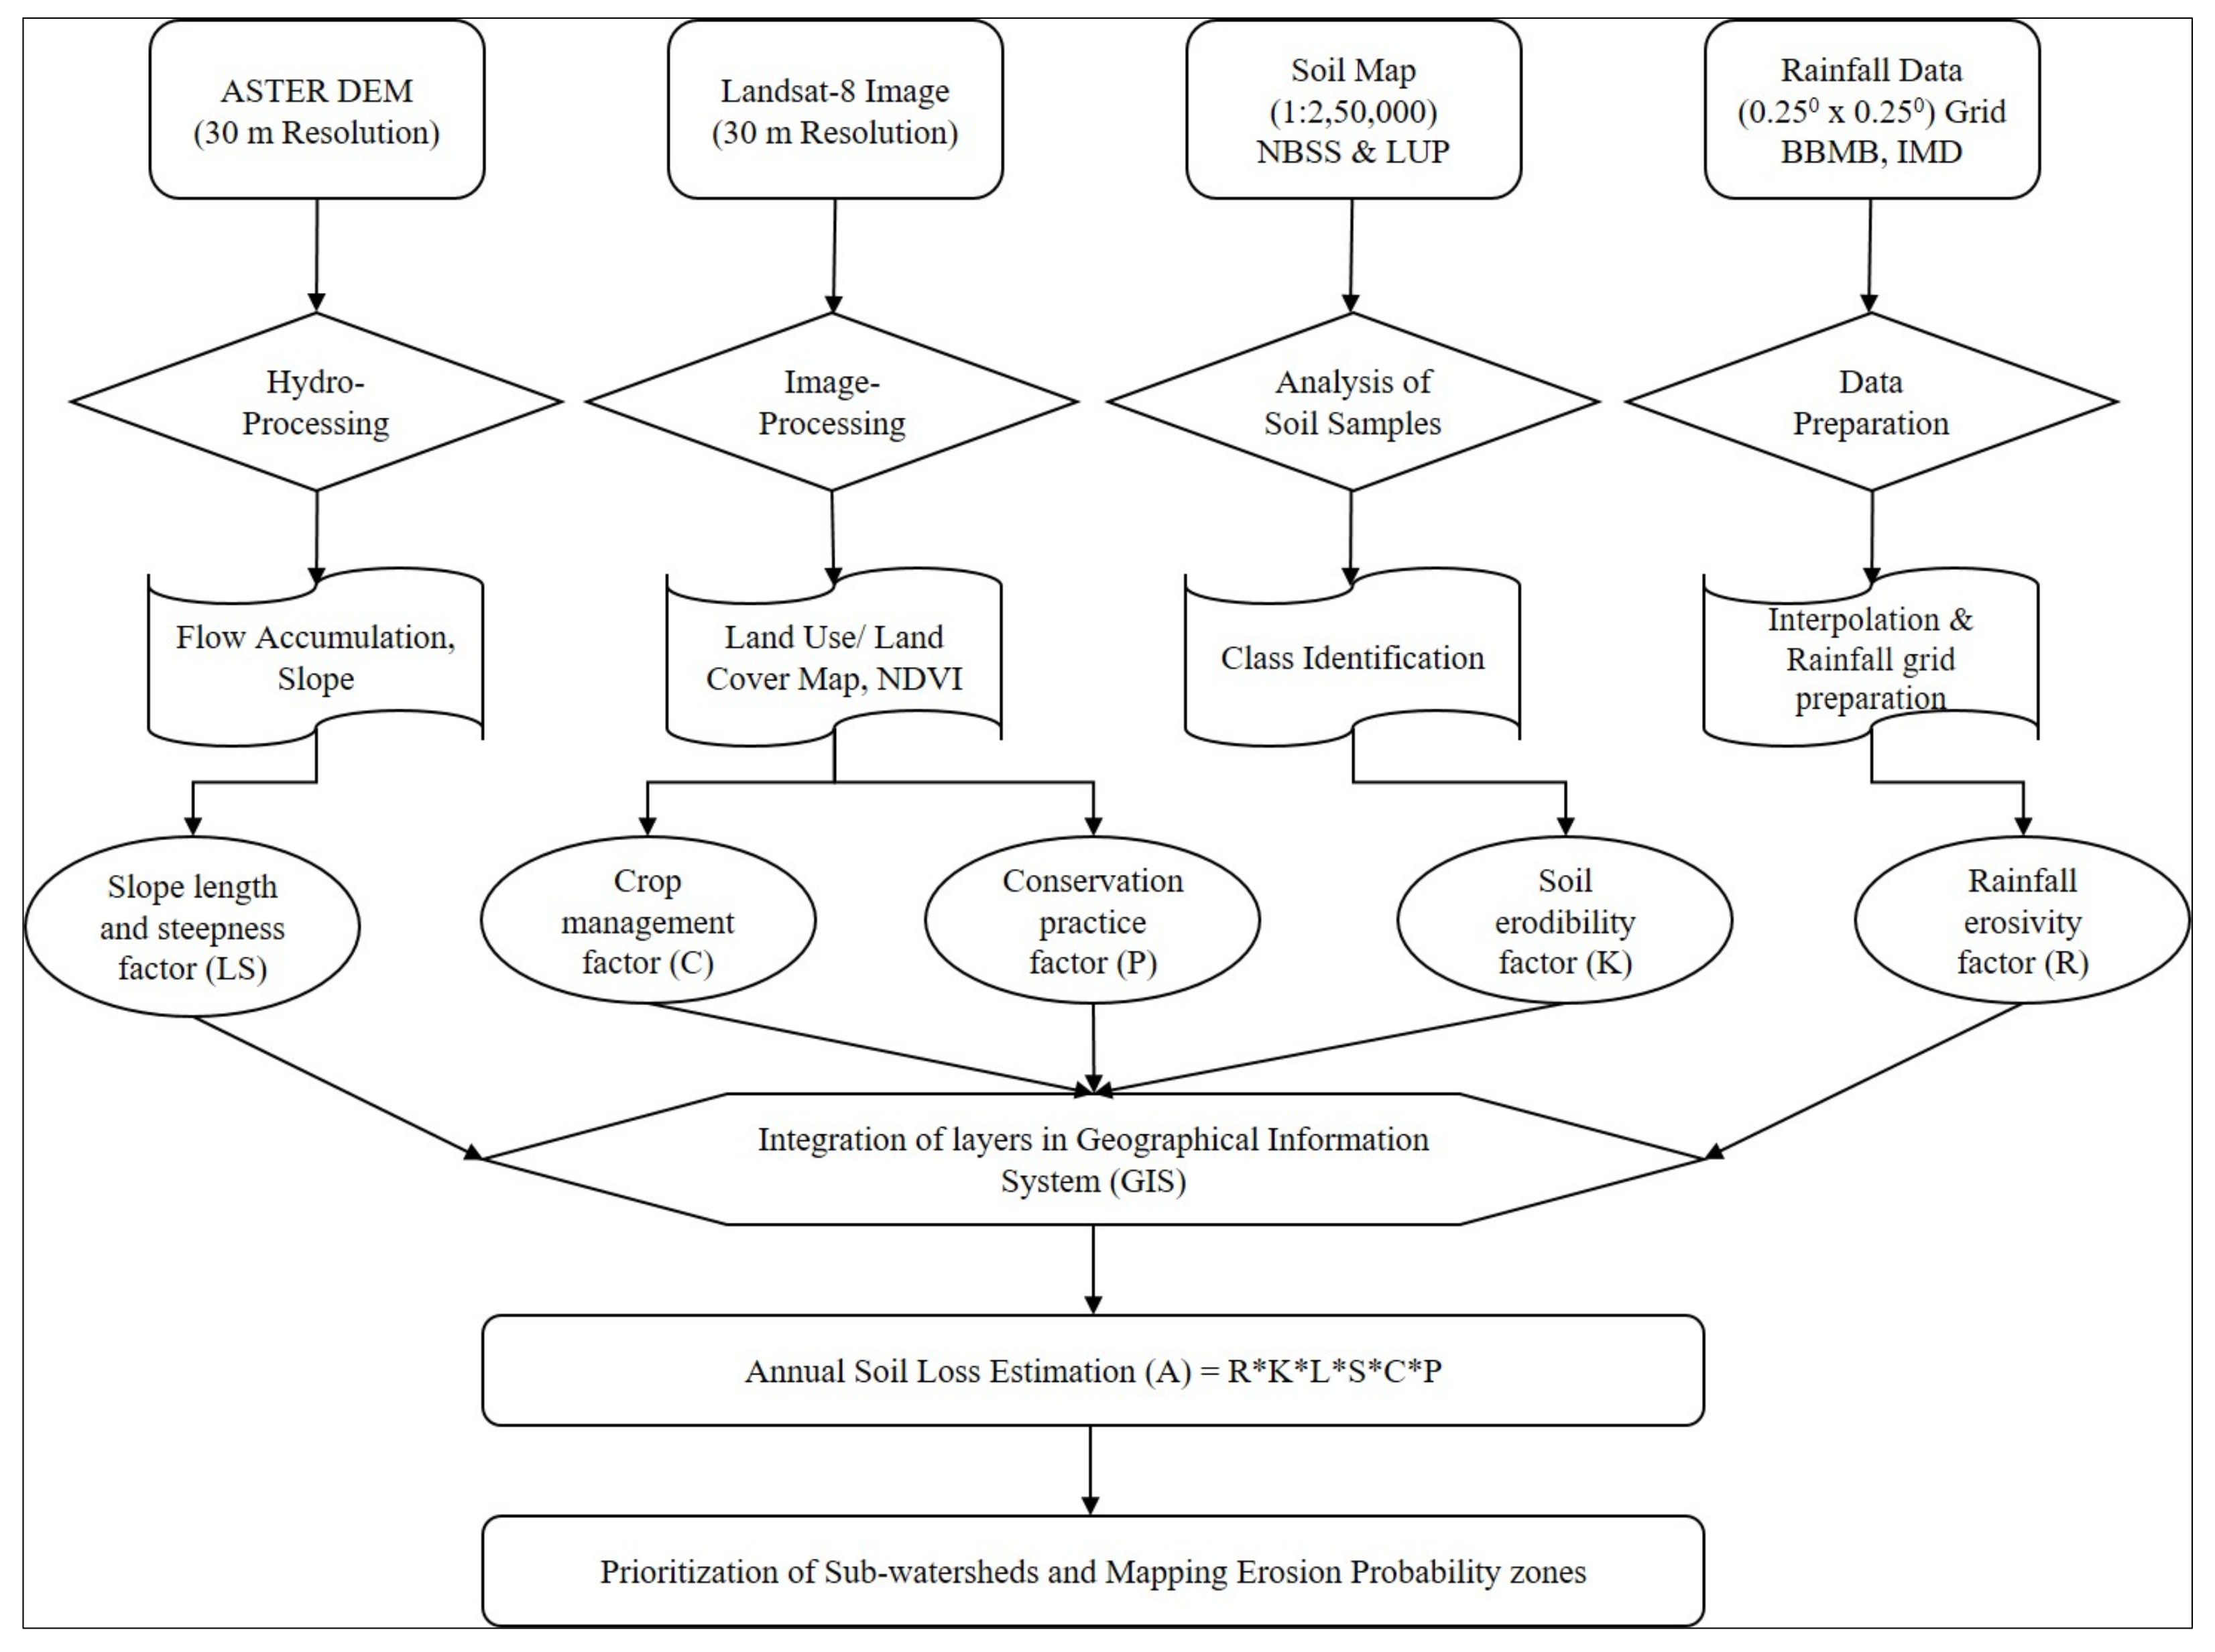
3. Methodology
3.1. Observed Sediment Data
3.2. Estimation of Soil Loss in the Sutlej Basin
3.3. Data Processing and RUSLE Parameter Estimation
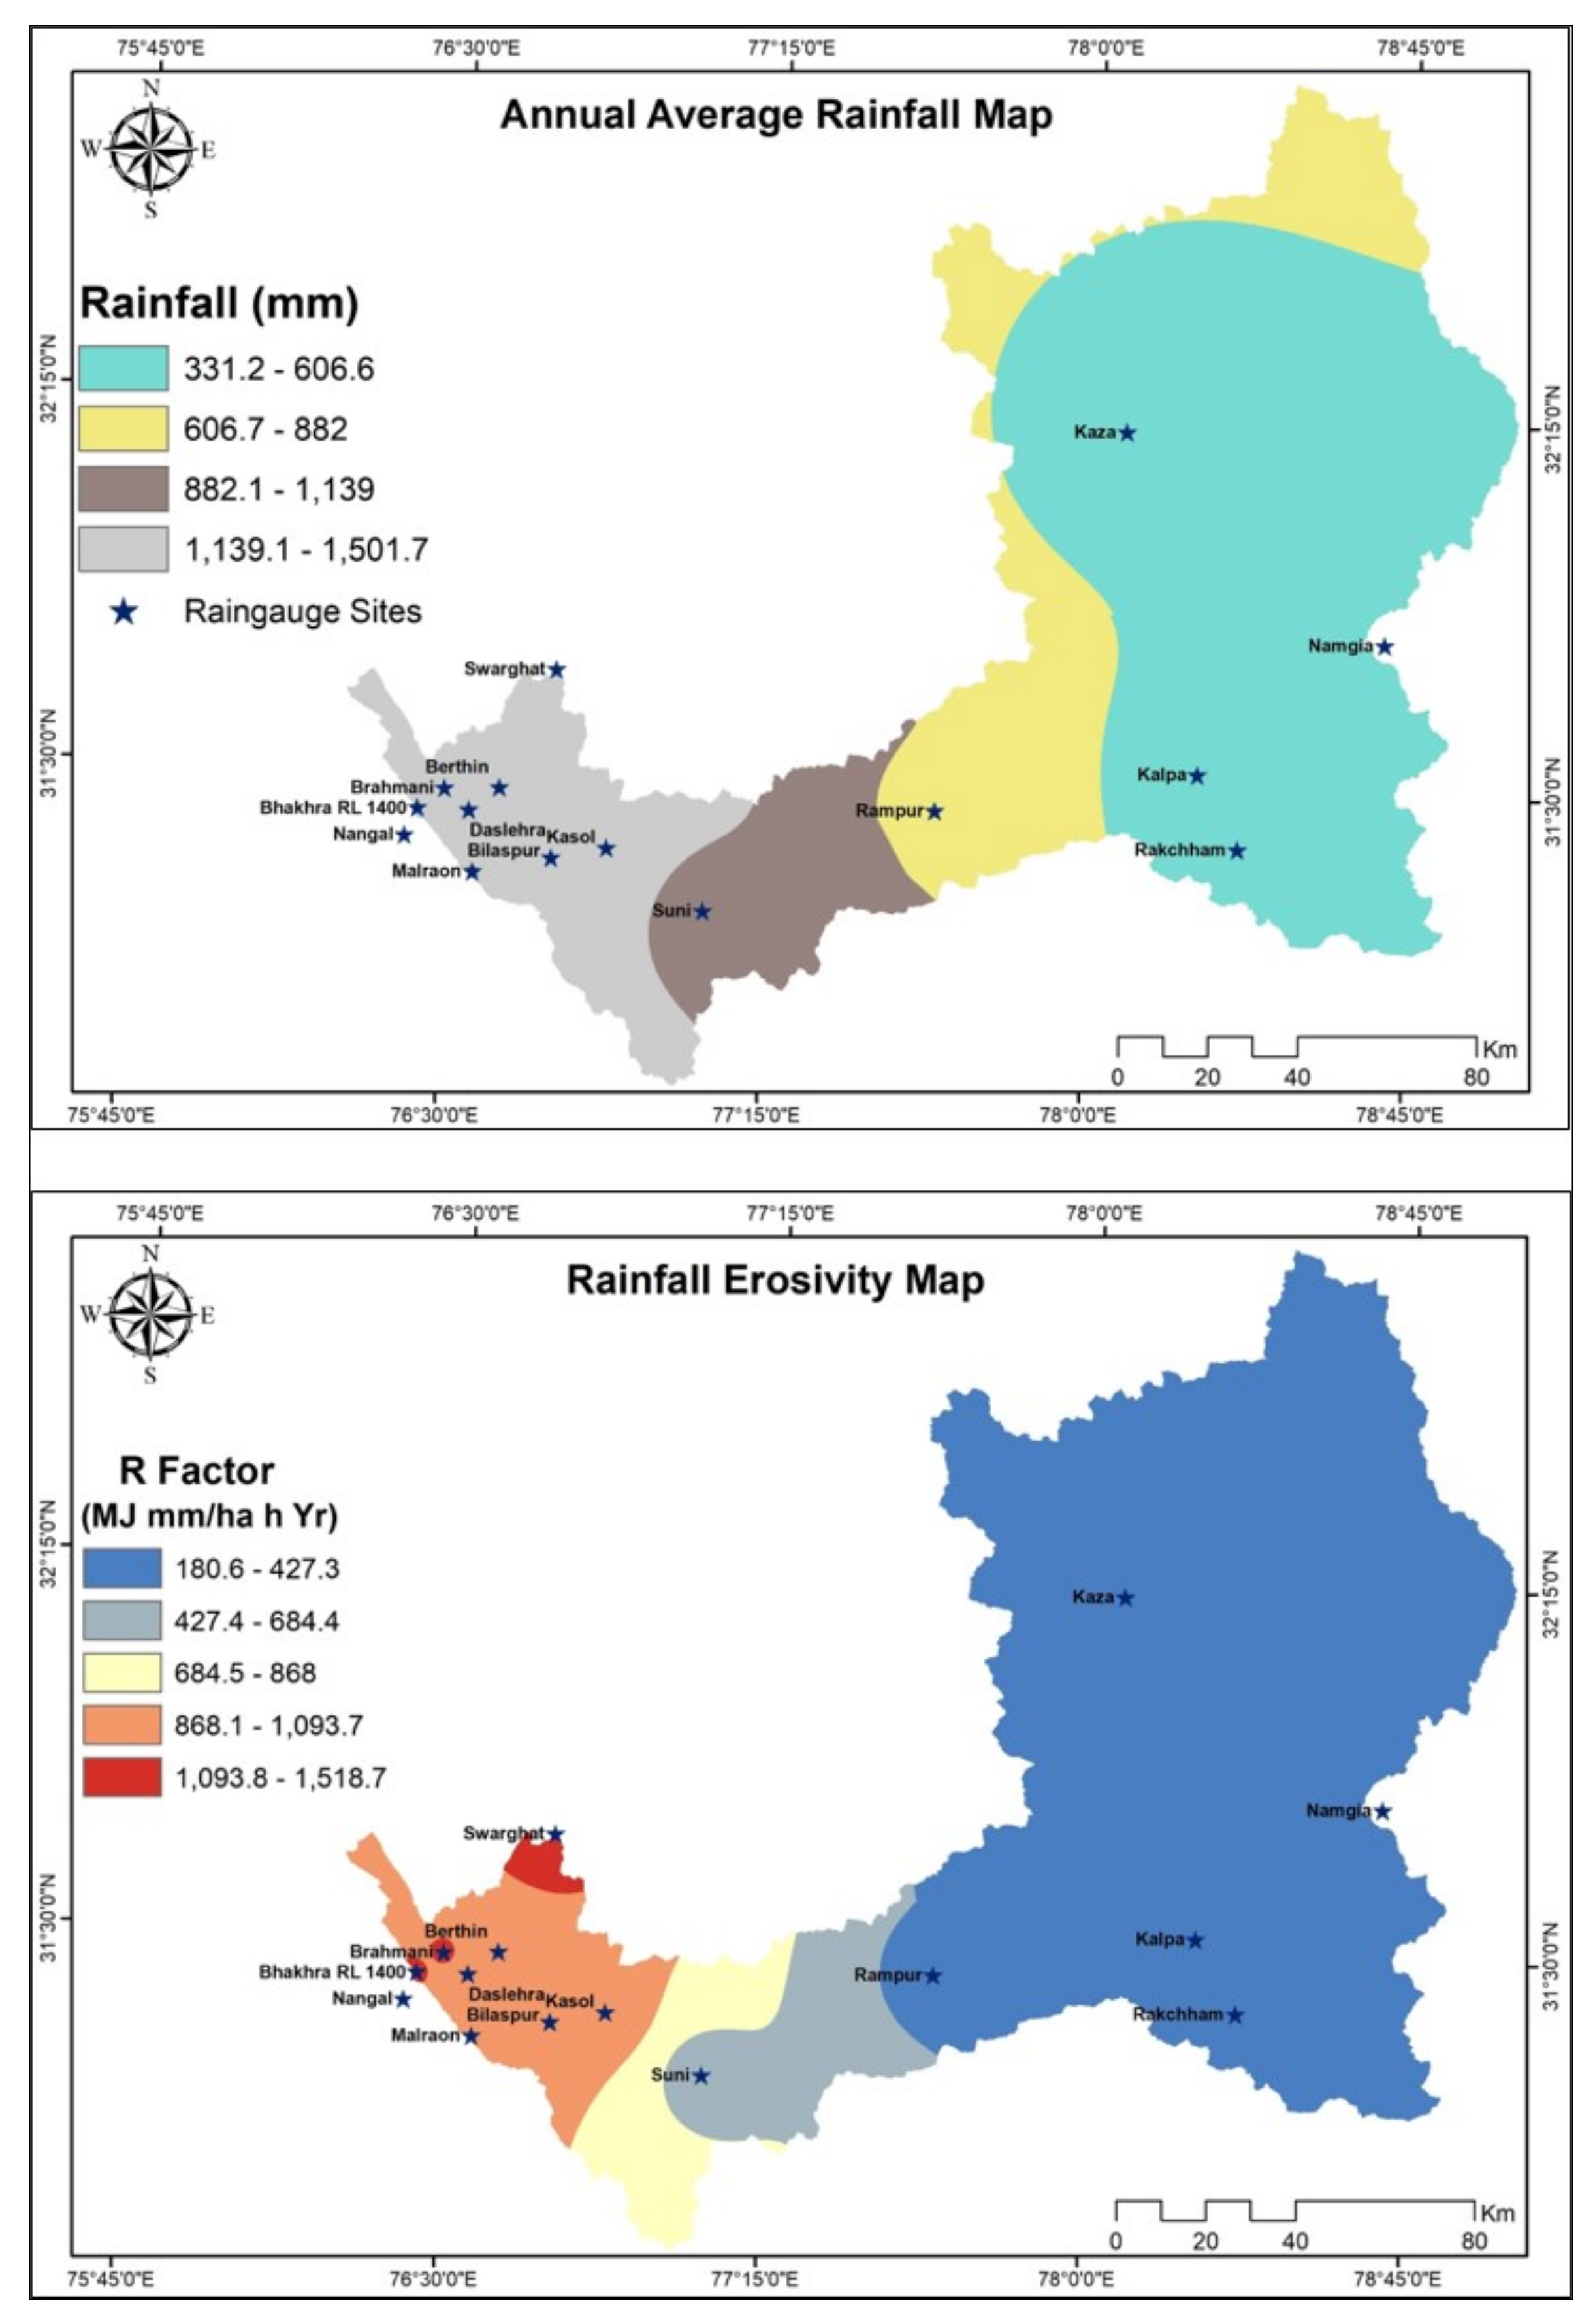
3.3.1. Rainfall Erosivity Factor (R)
3.3.2. Soil Erodibility Factor (K)
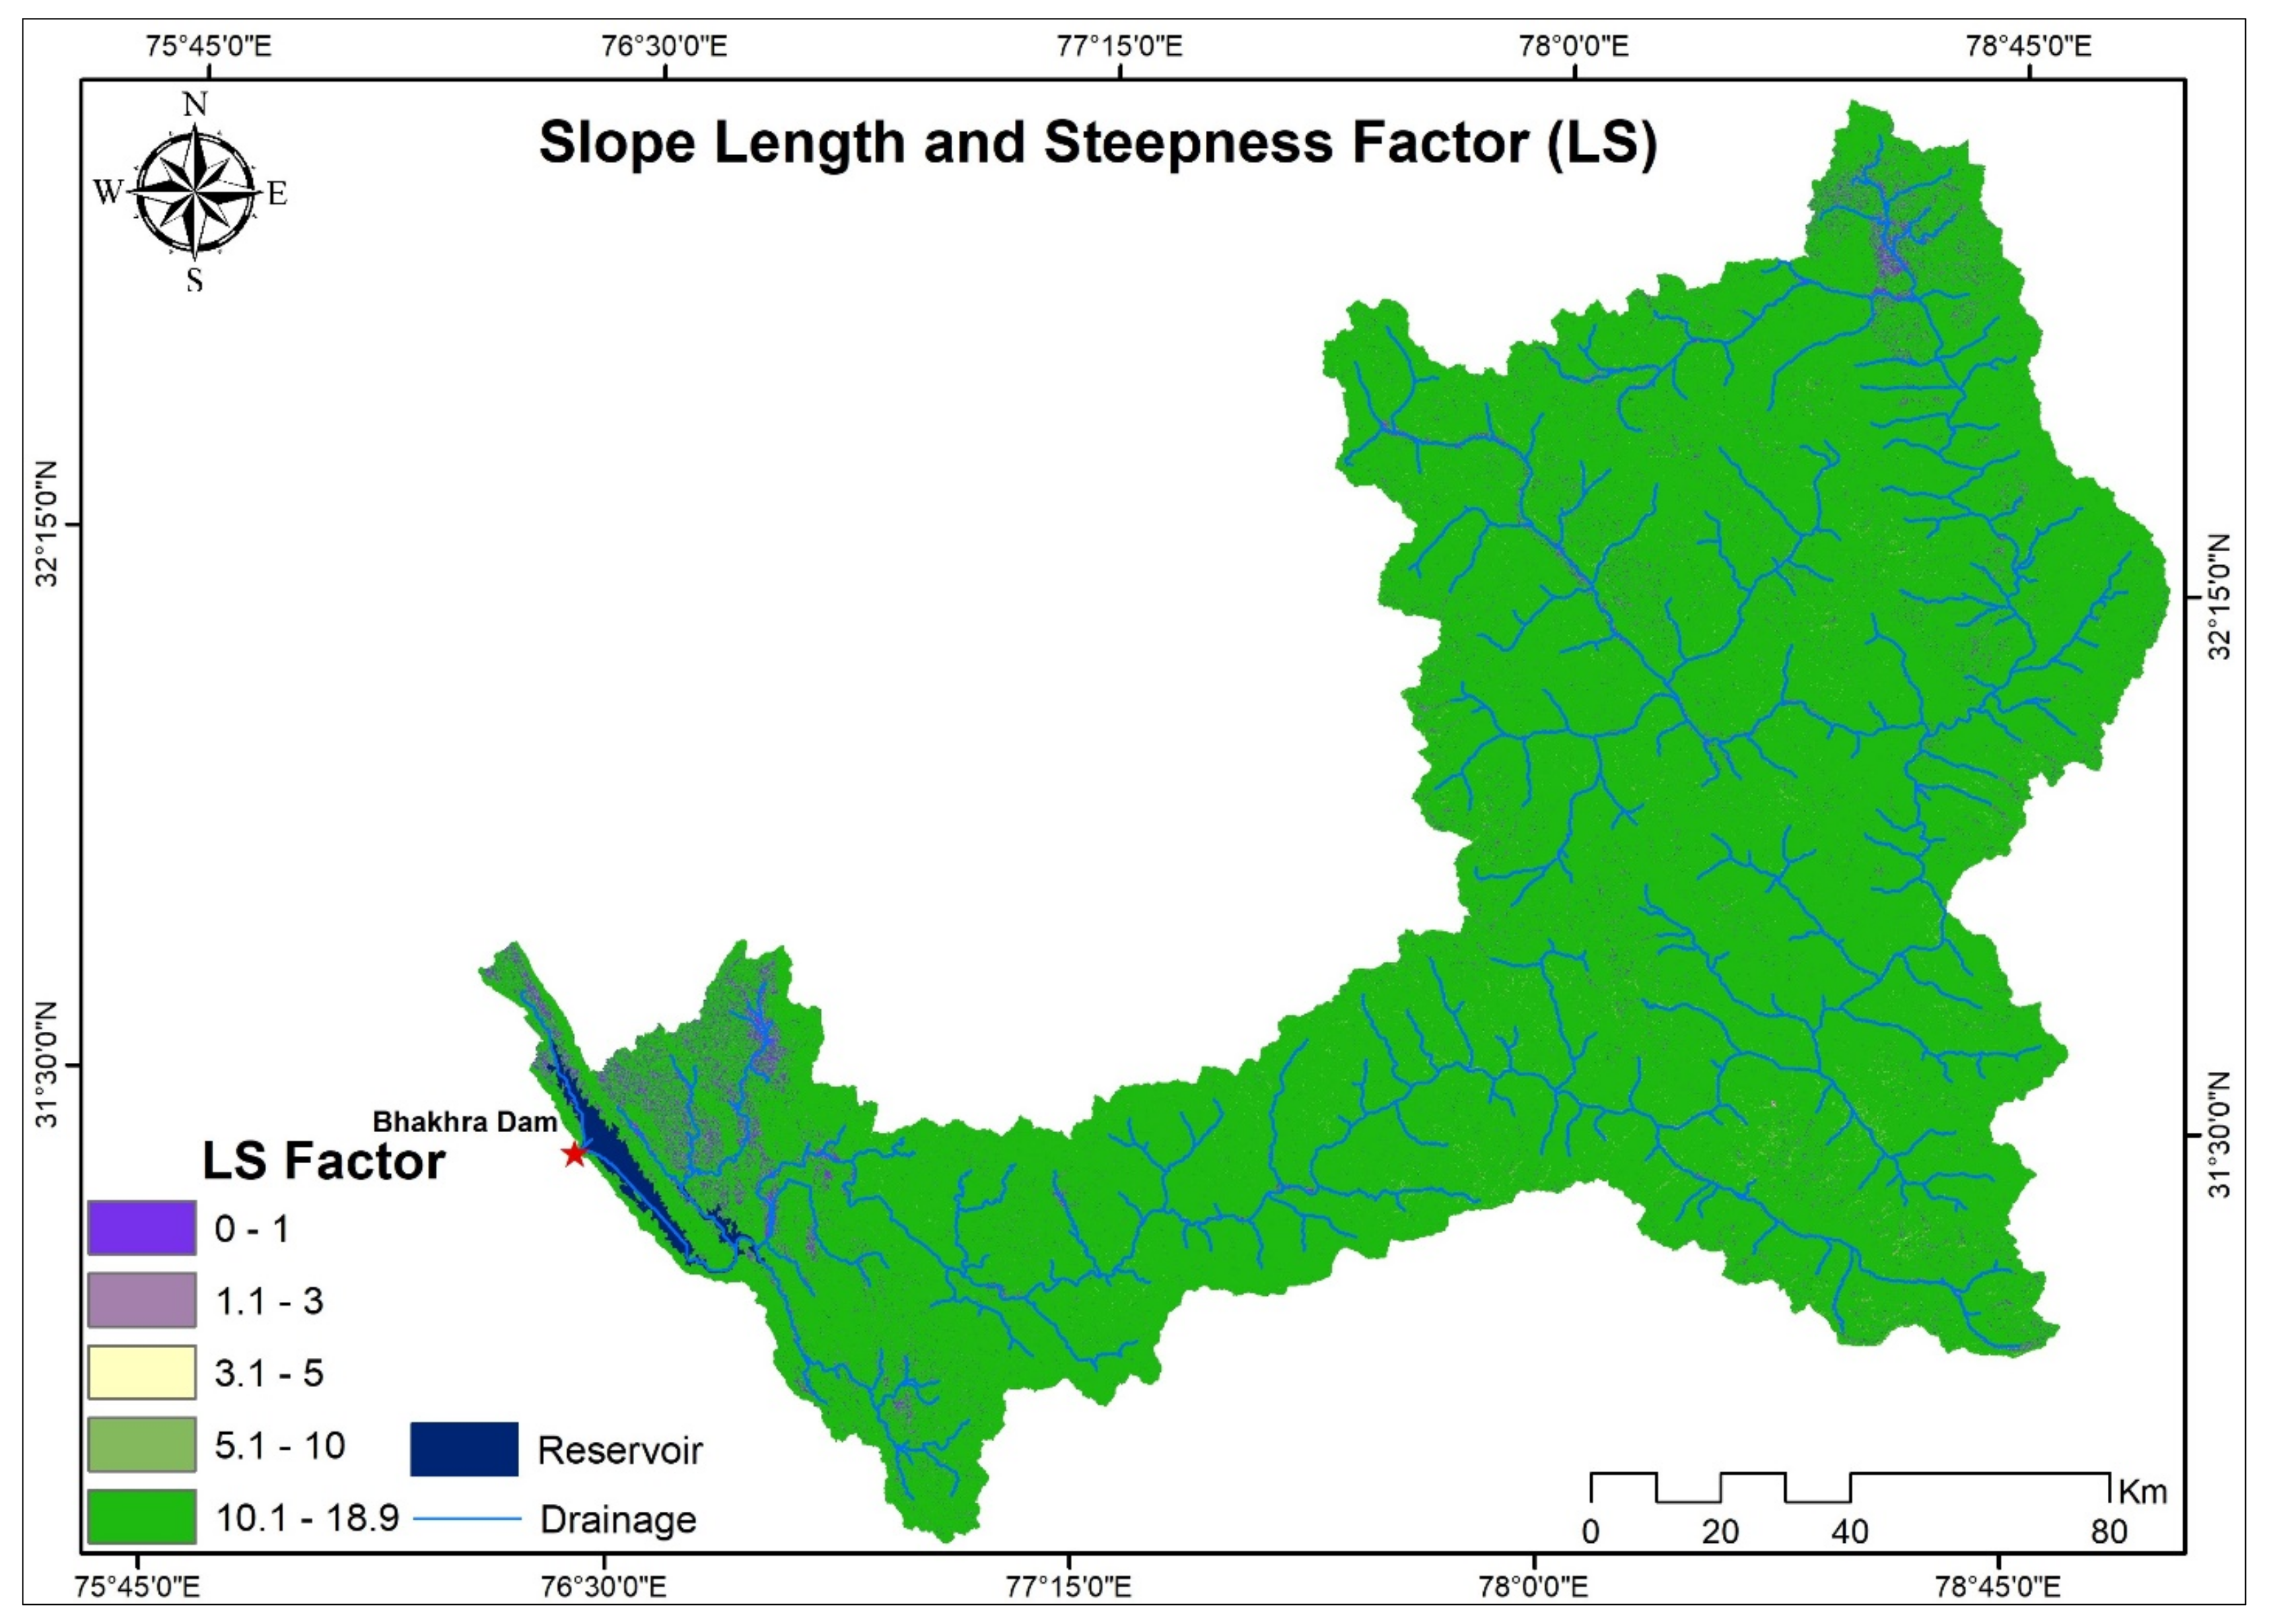
3.3.3. Slope Length and Slope Steepness Factor (LS)
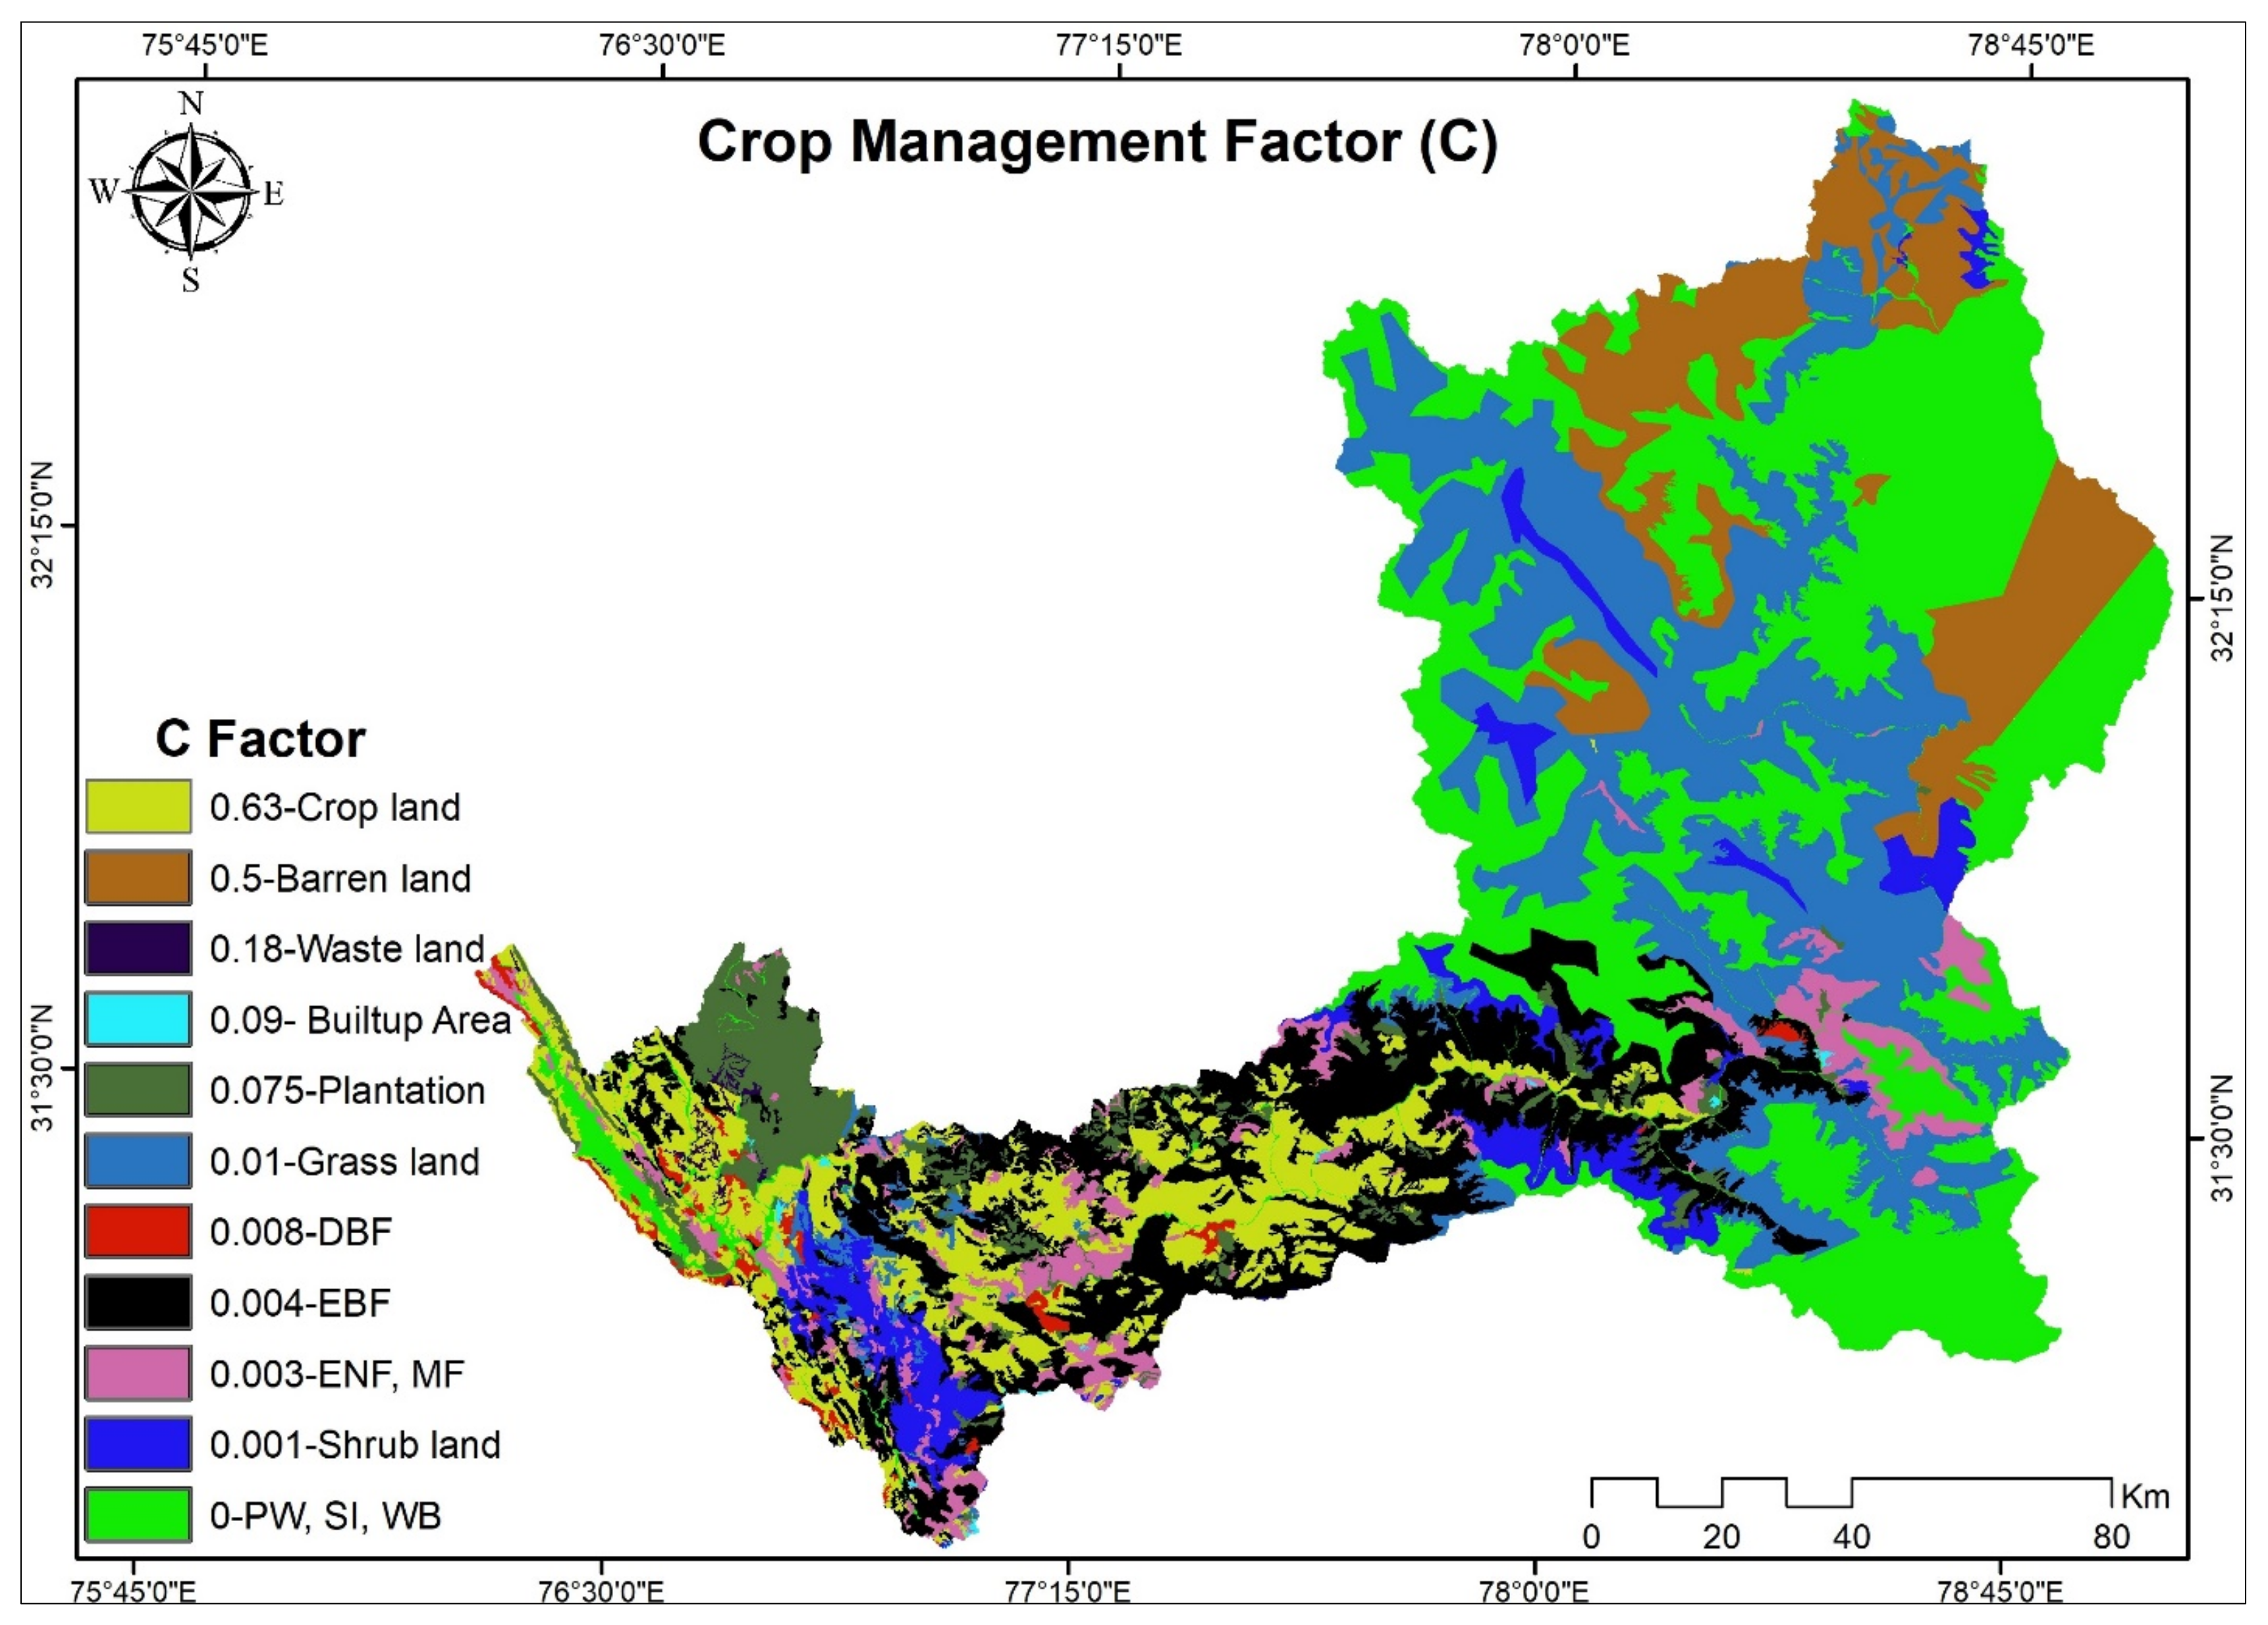
3.3.4. Crop Management Factor (C)
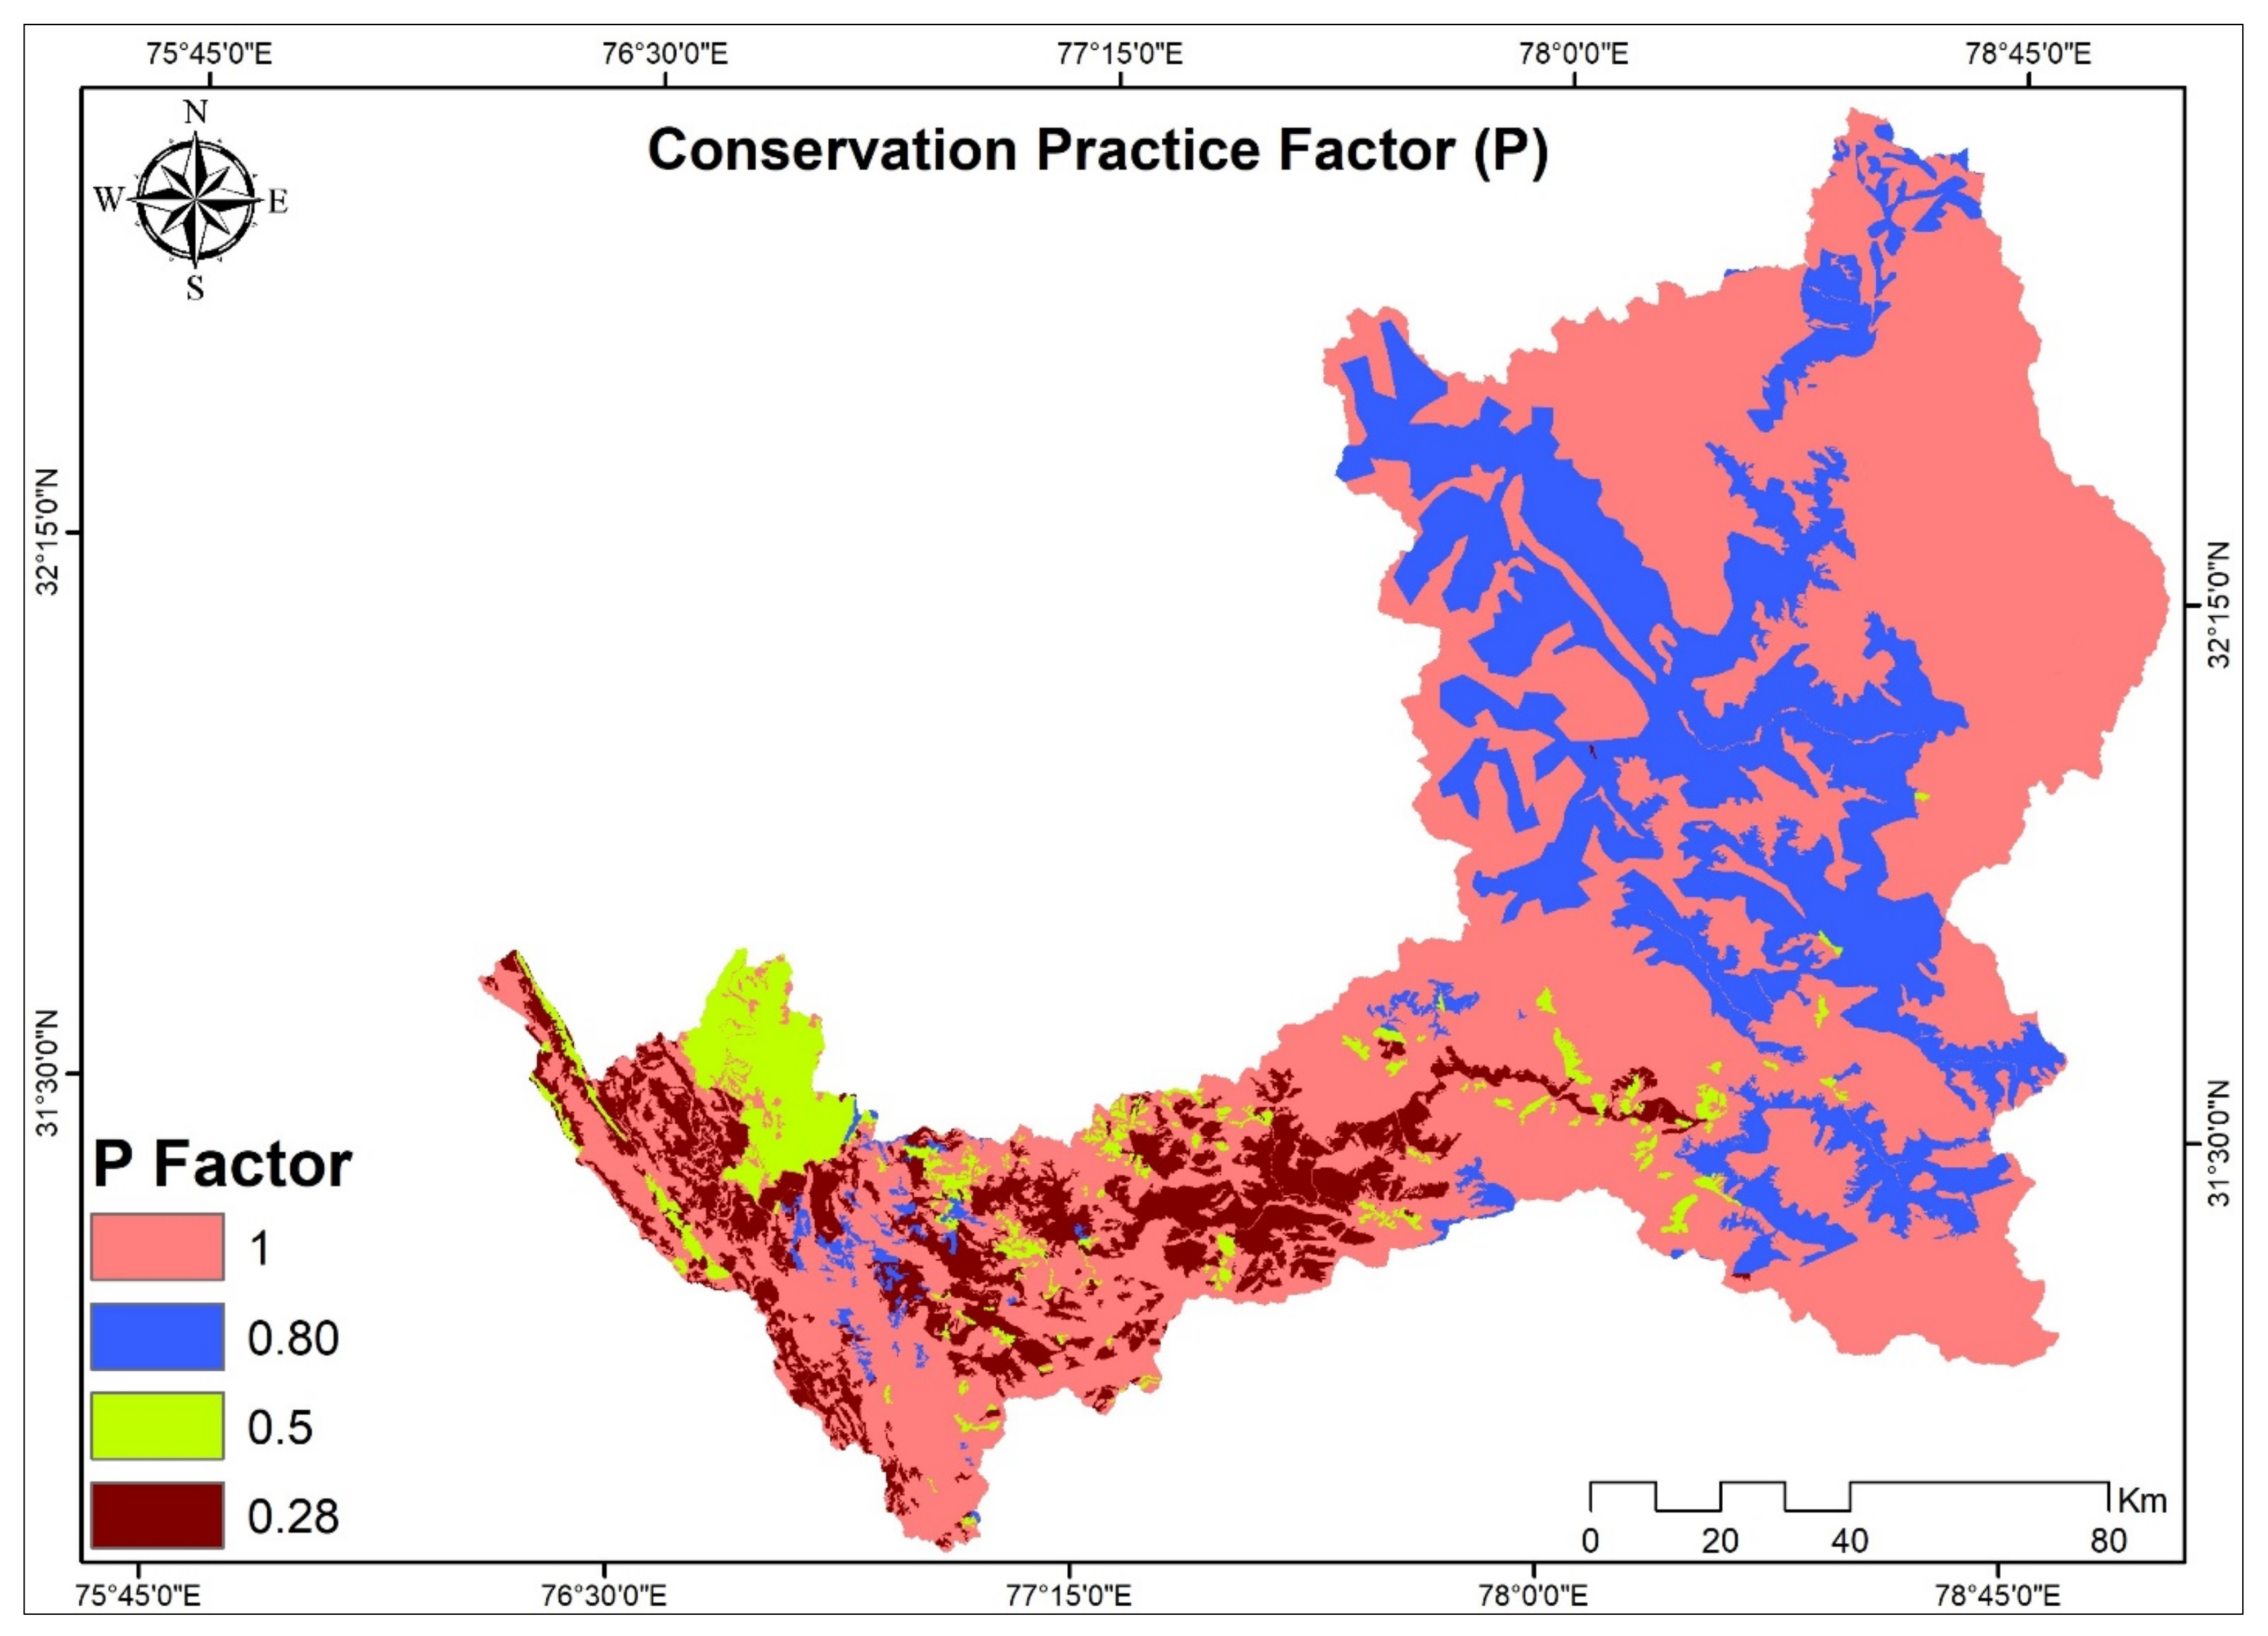
3.3.5. Conservation Practice Factor (P)
4. Results and Discussion
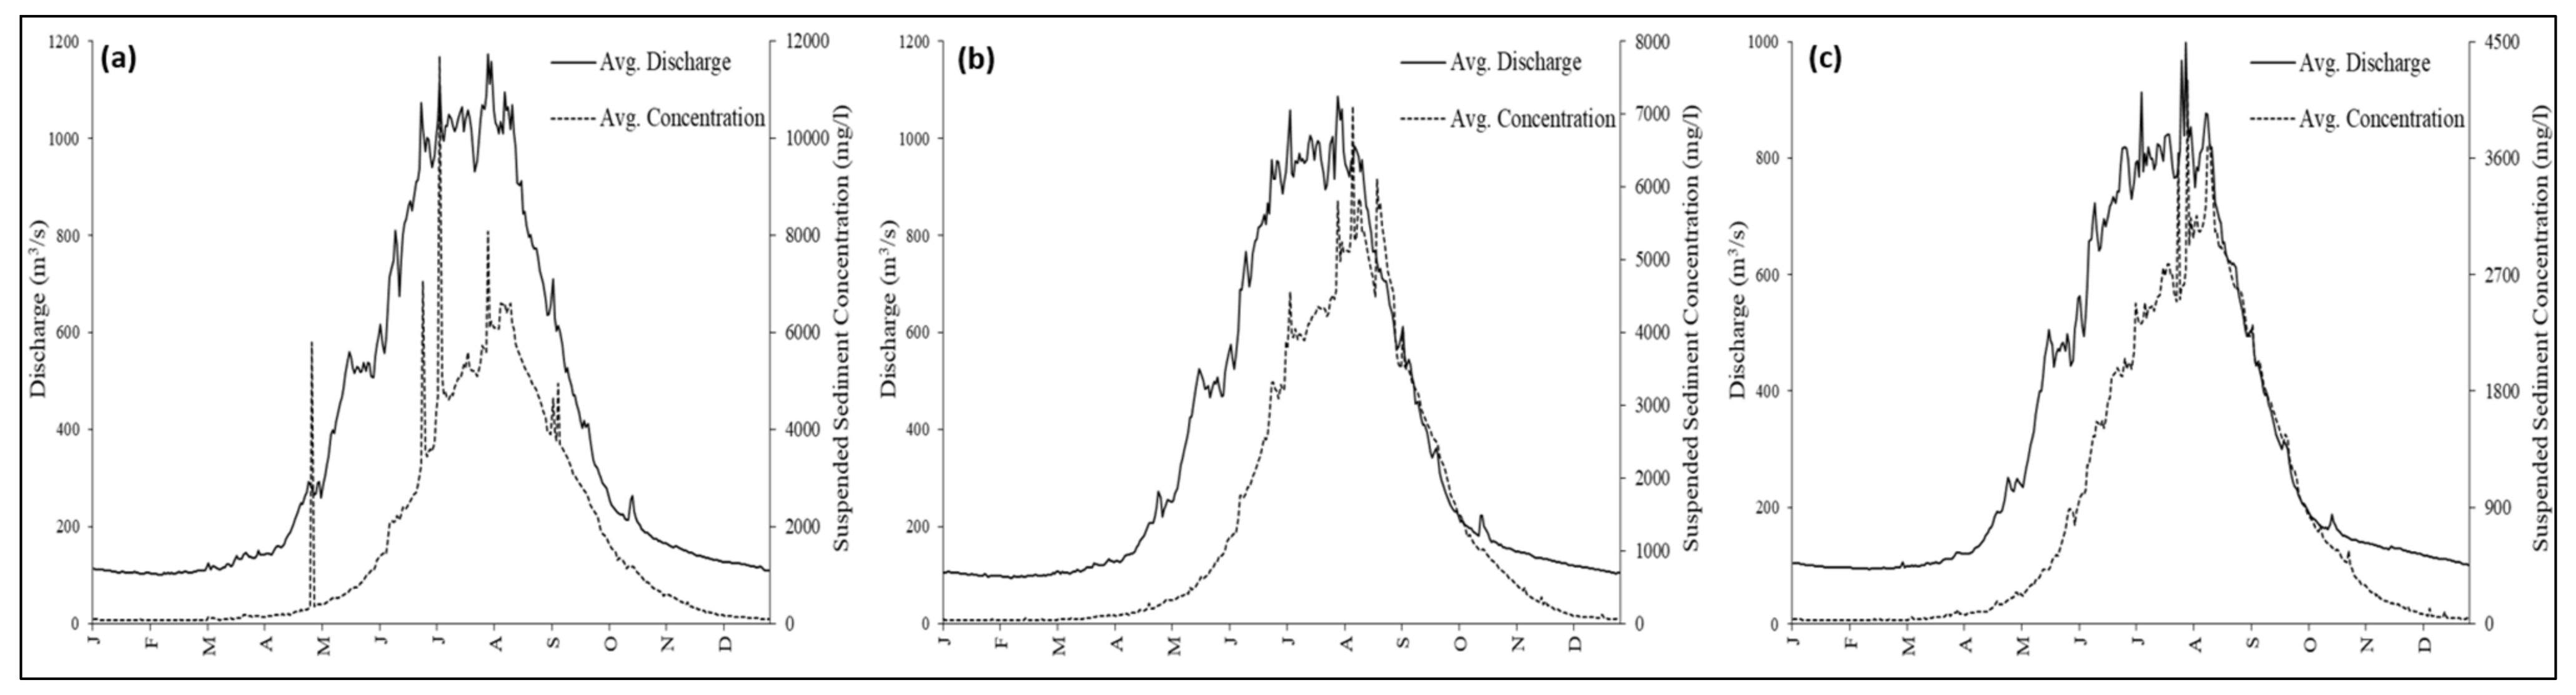
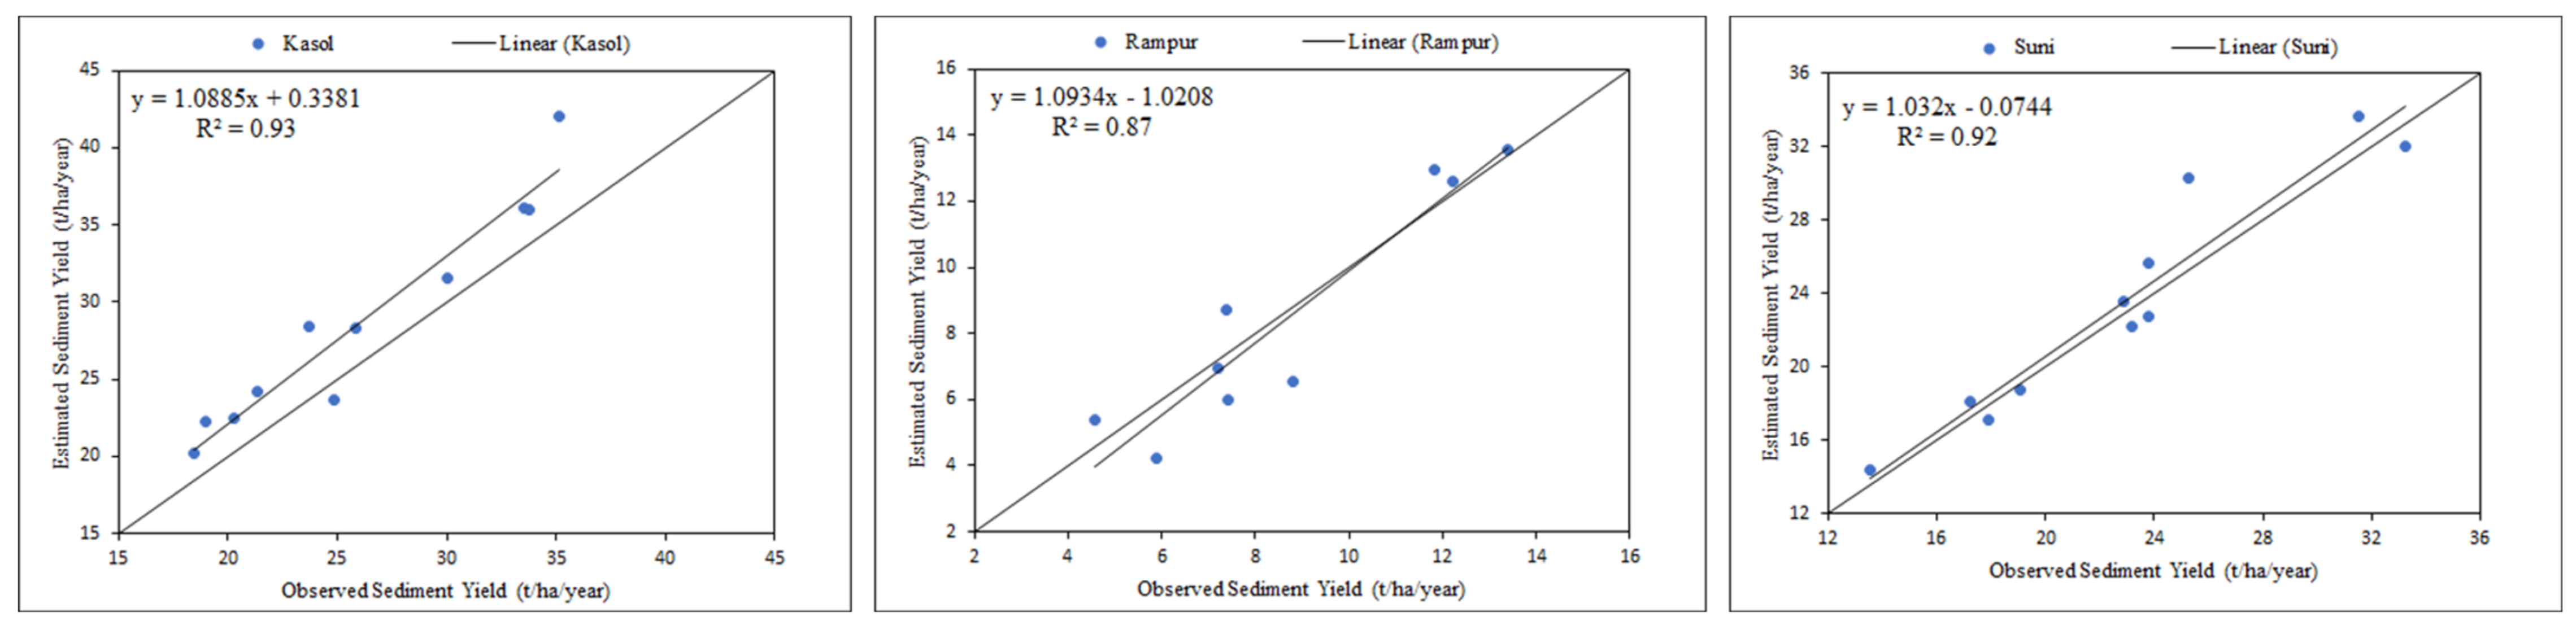
4.1. Suspended Sediment Concentration in the Sutlej Basin
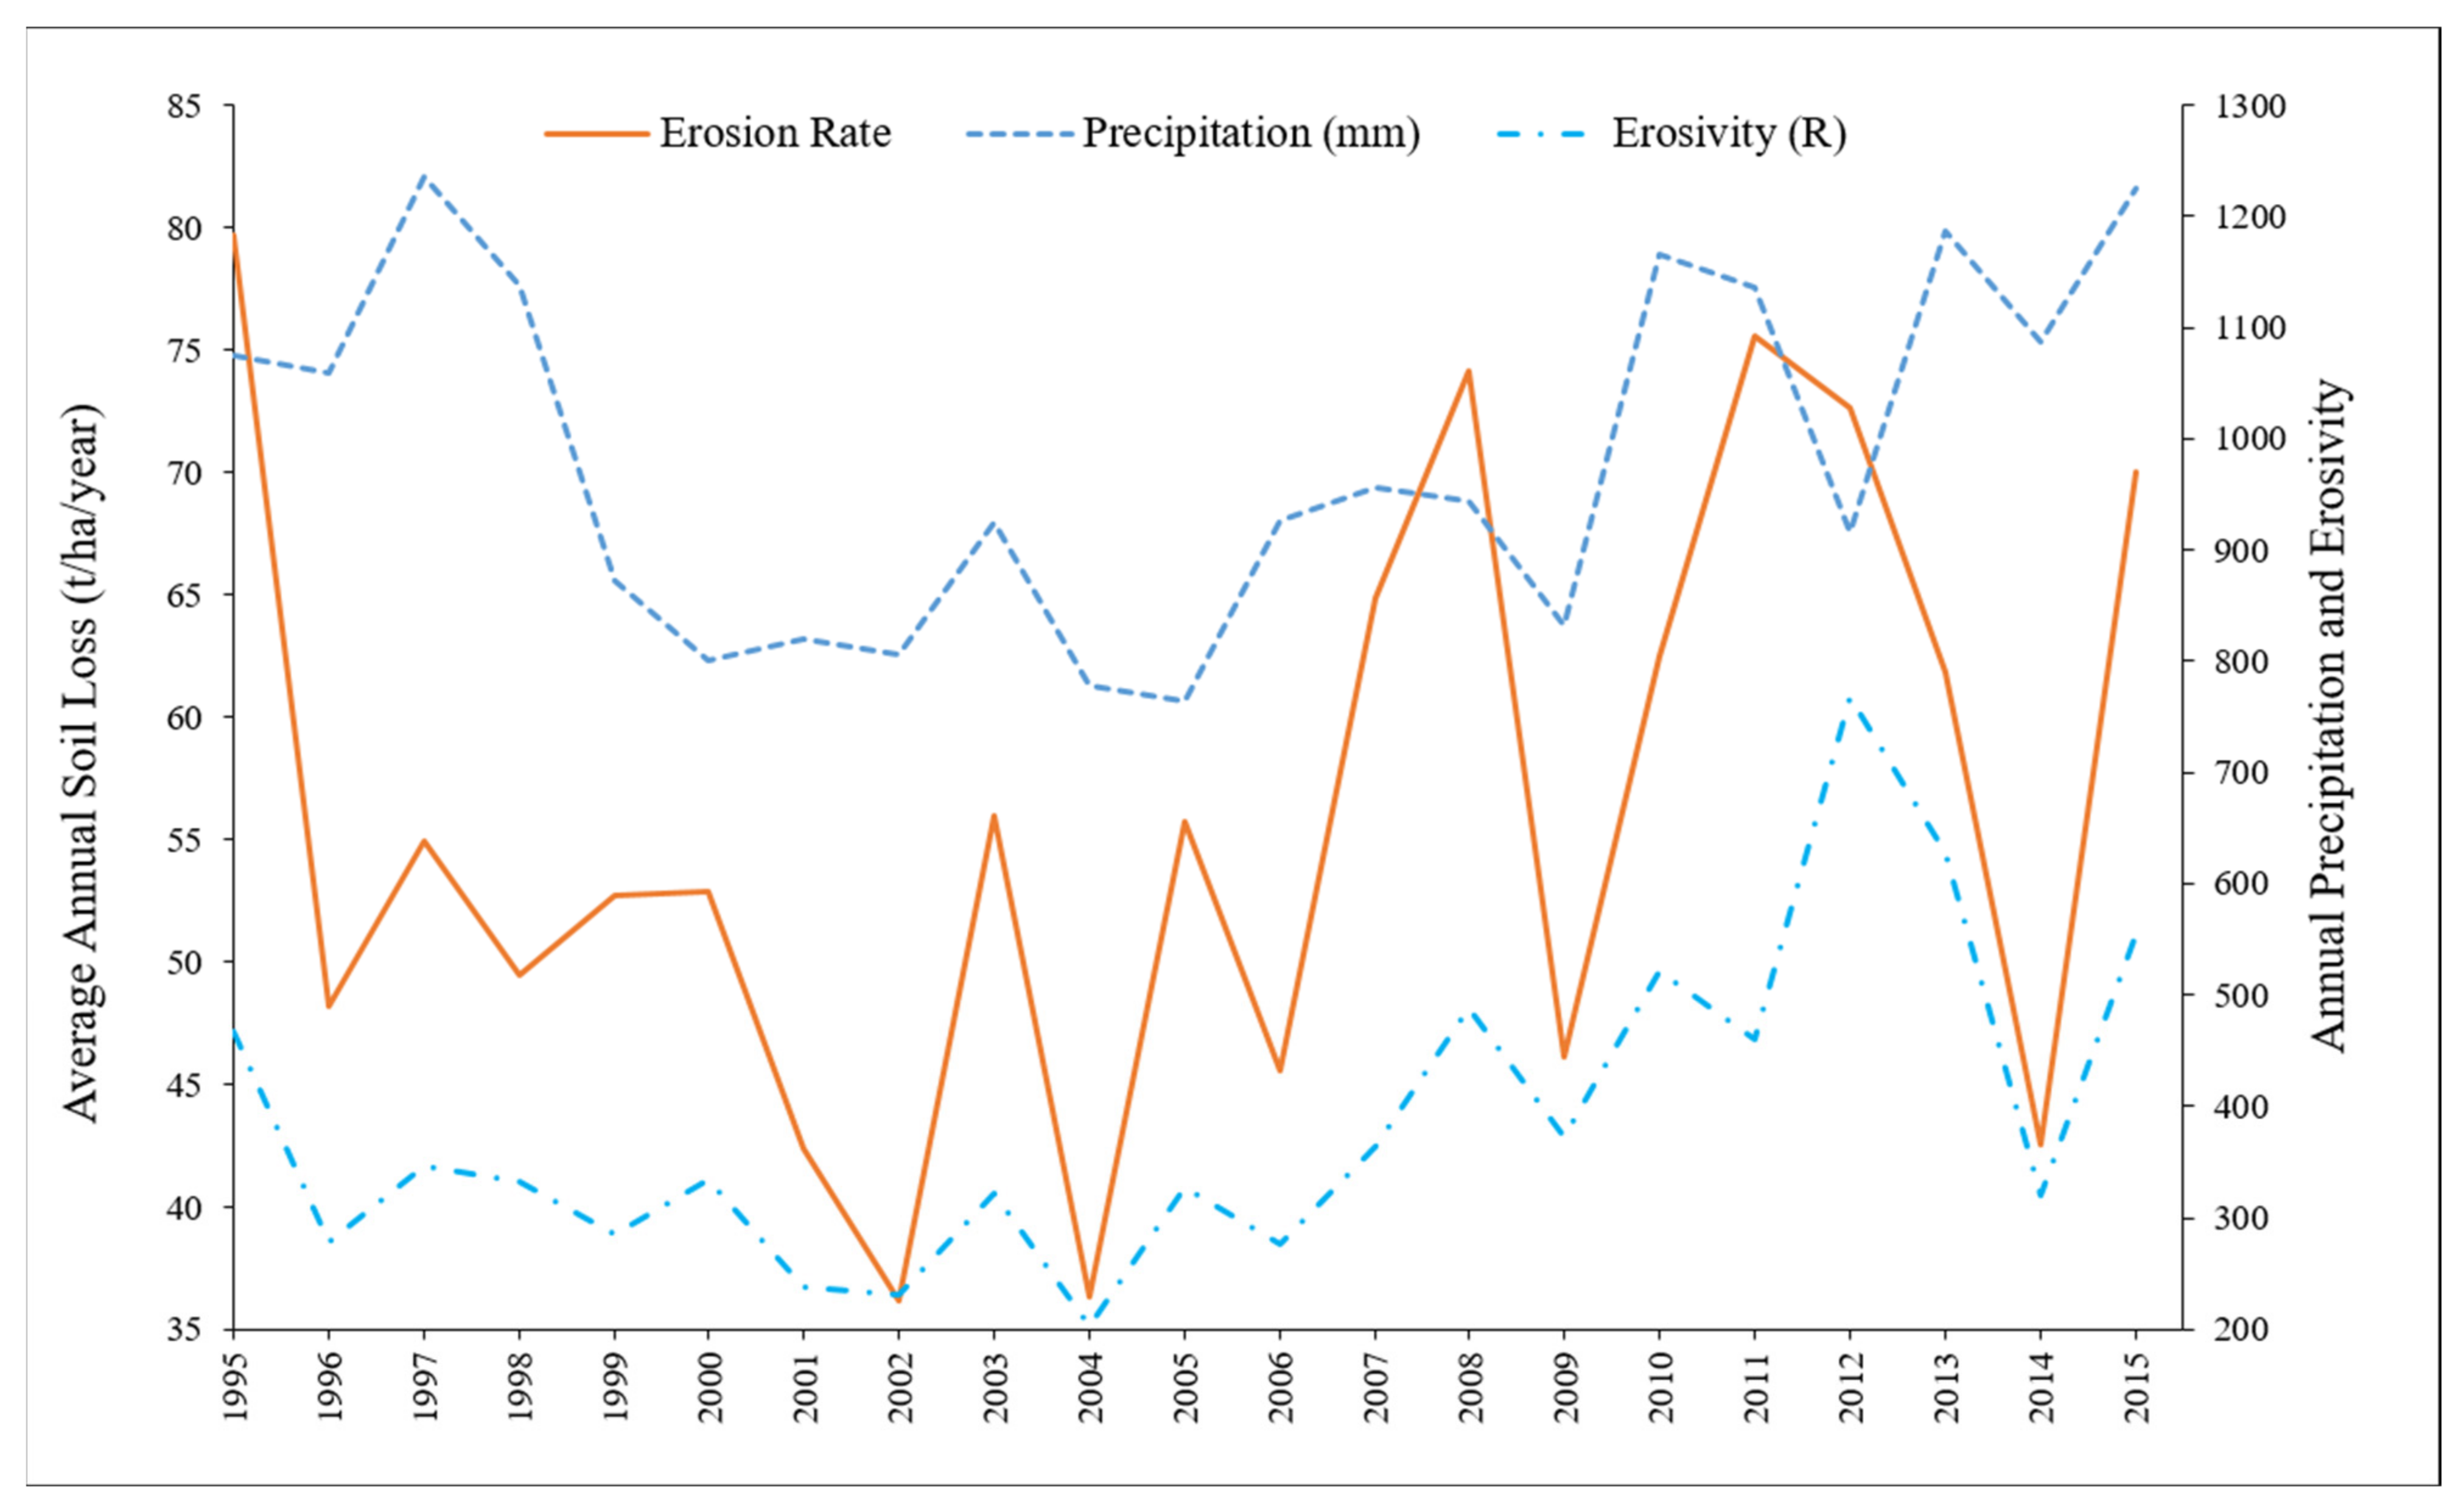
4.2. Erosion Potential Map
4.2.1. Variation of Factors (R, K, LS)
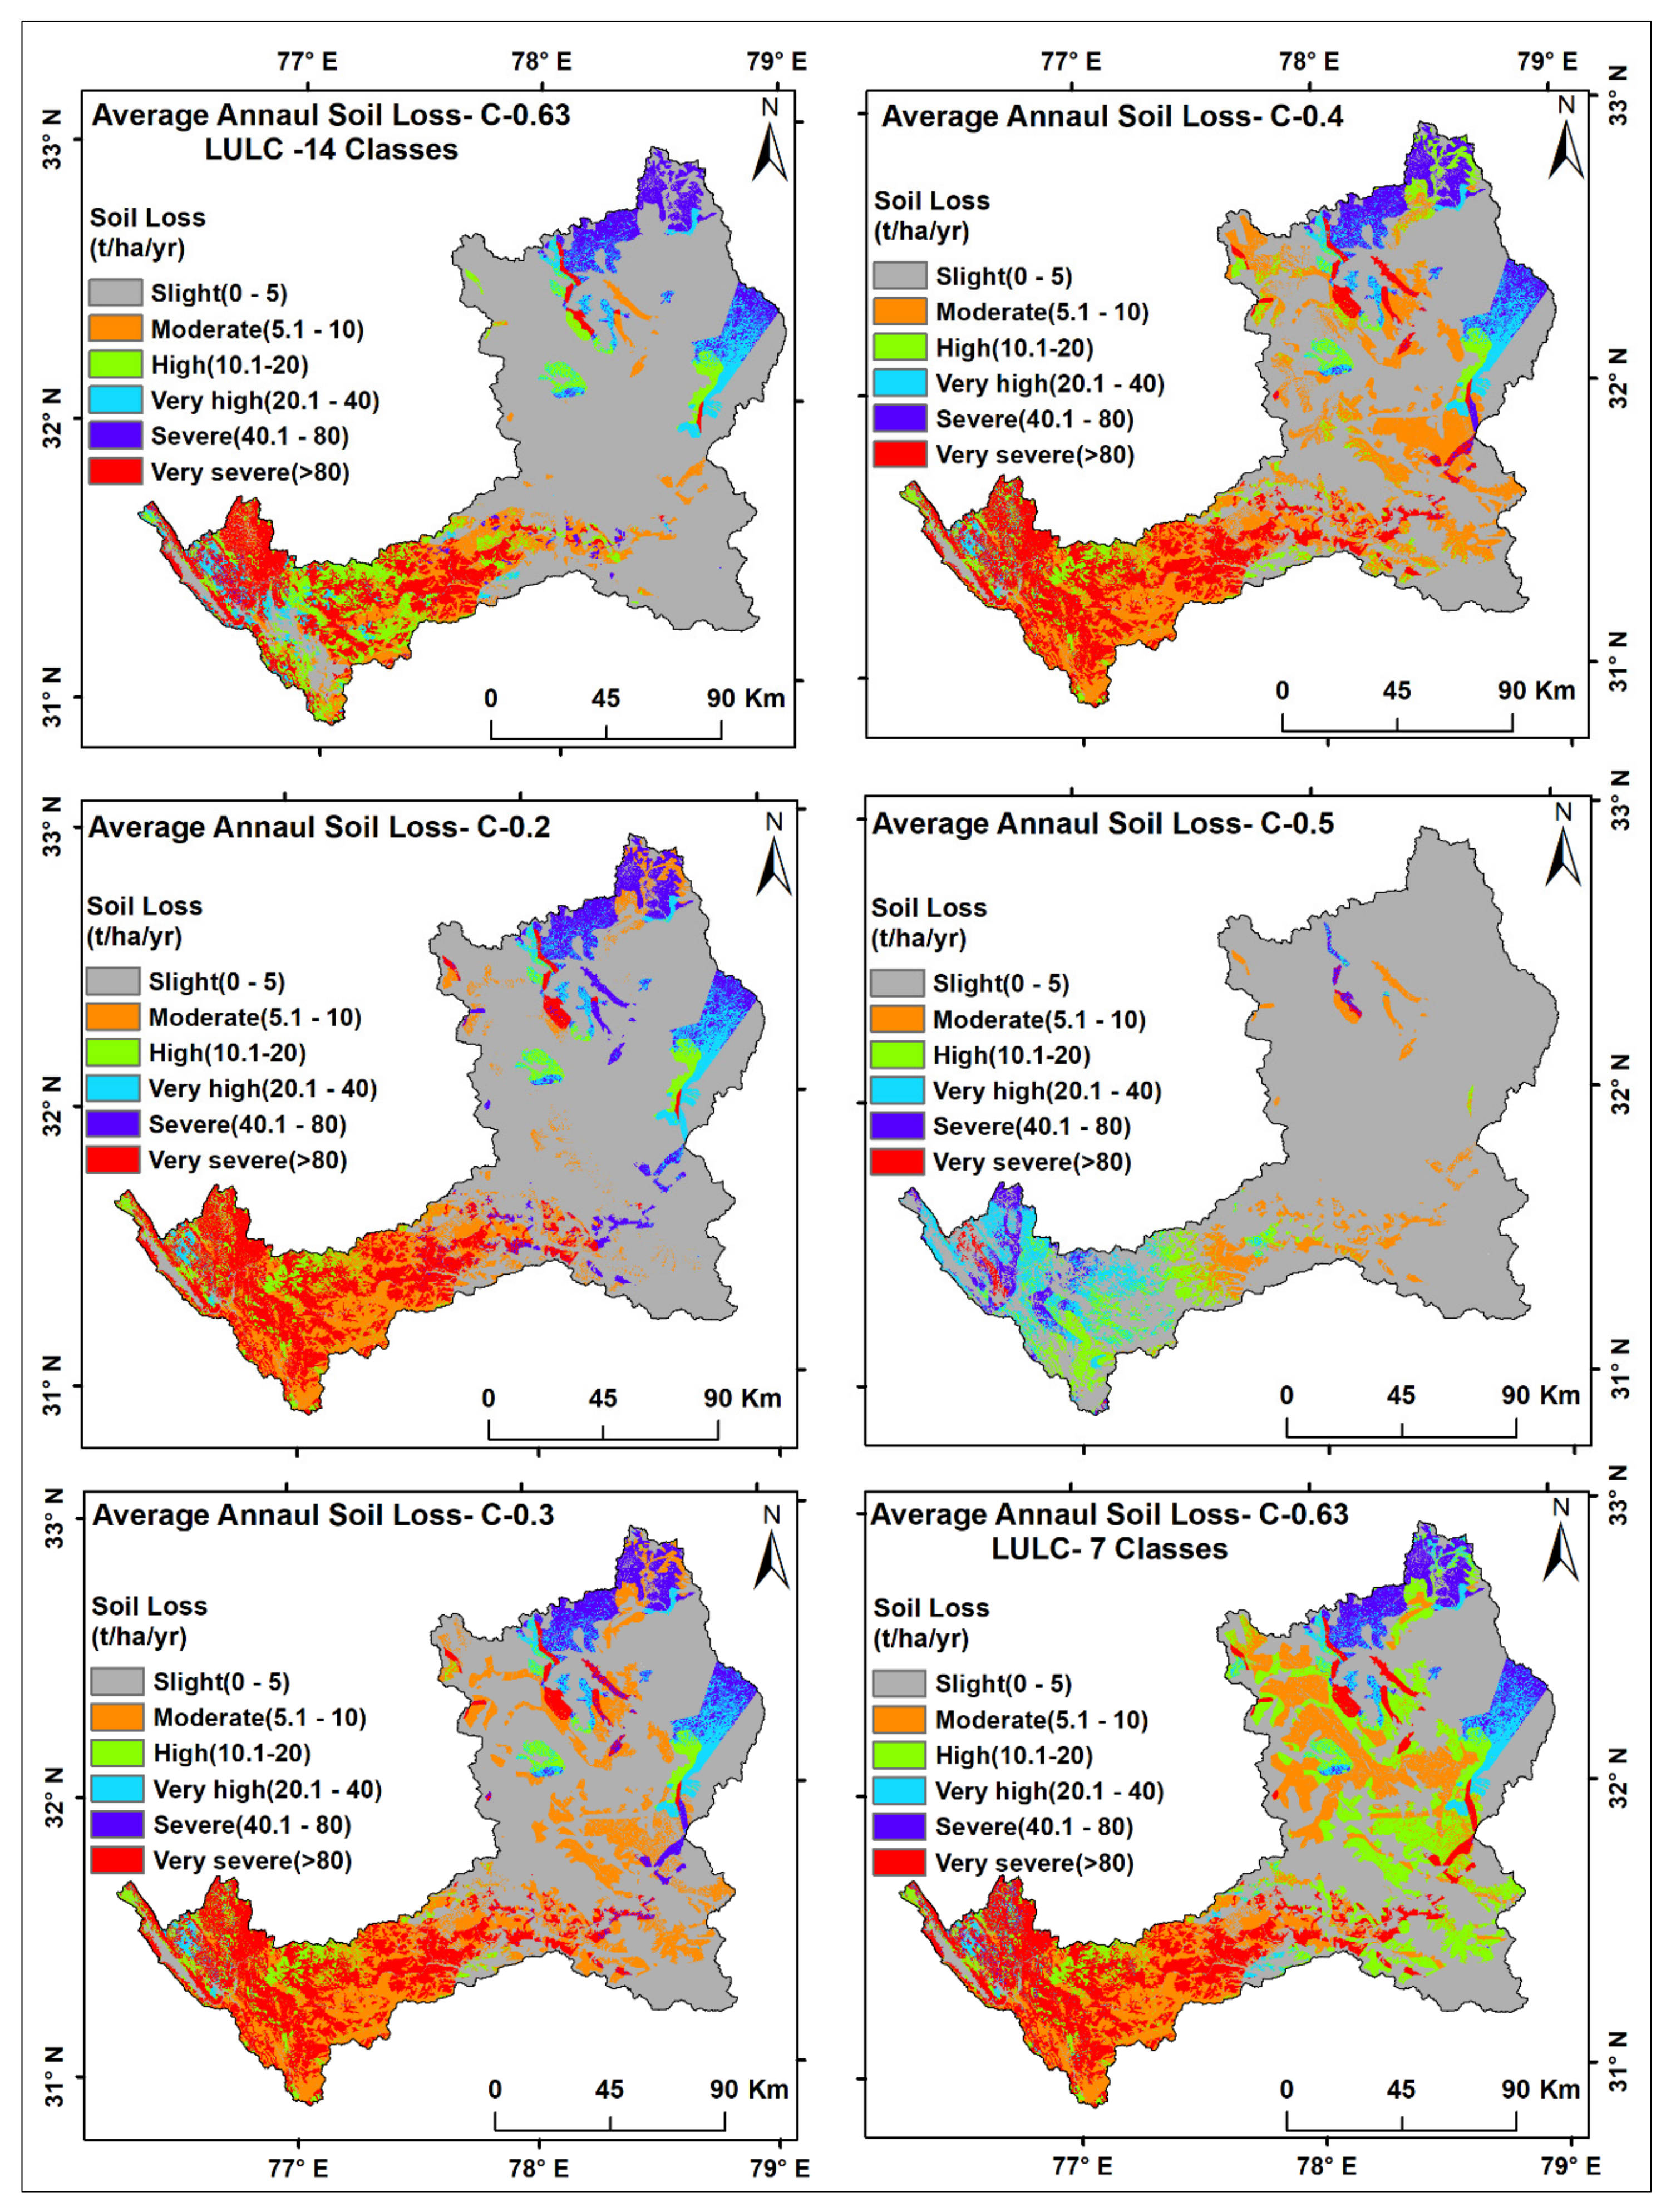
4.2.2. Optimization of Crop Management Factor (C) and LULC Classes
4.2.3. Variation of Conservation Practice Factor (P)
4.3. Land Use/Land Crop Change Effect on Soil Erosion
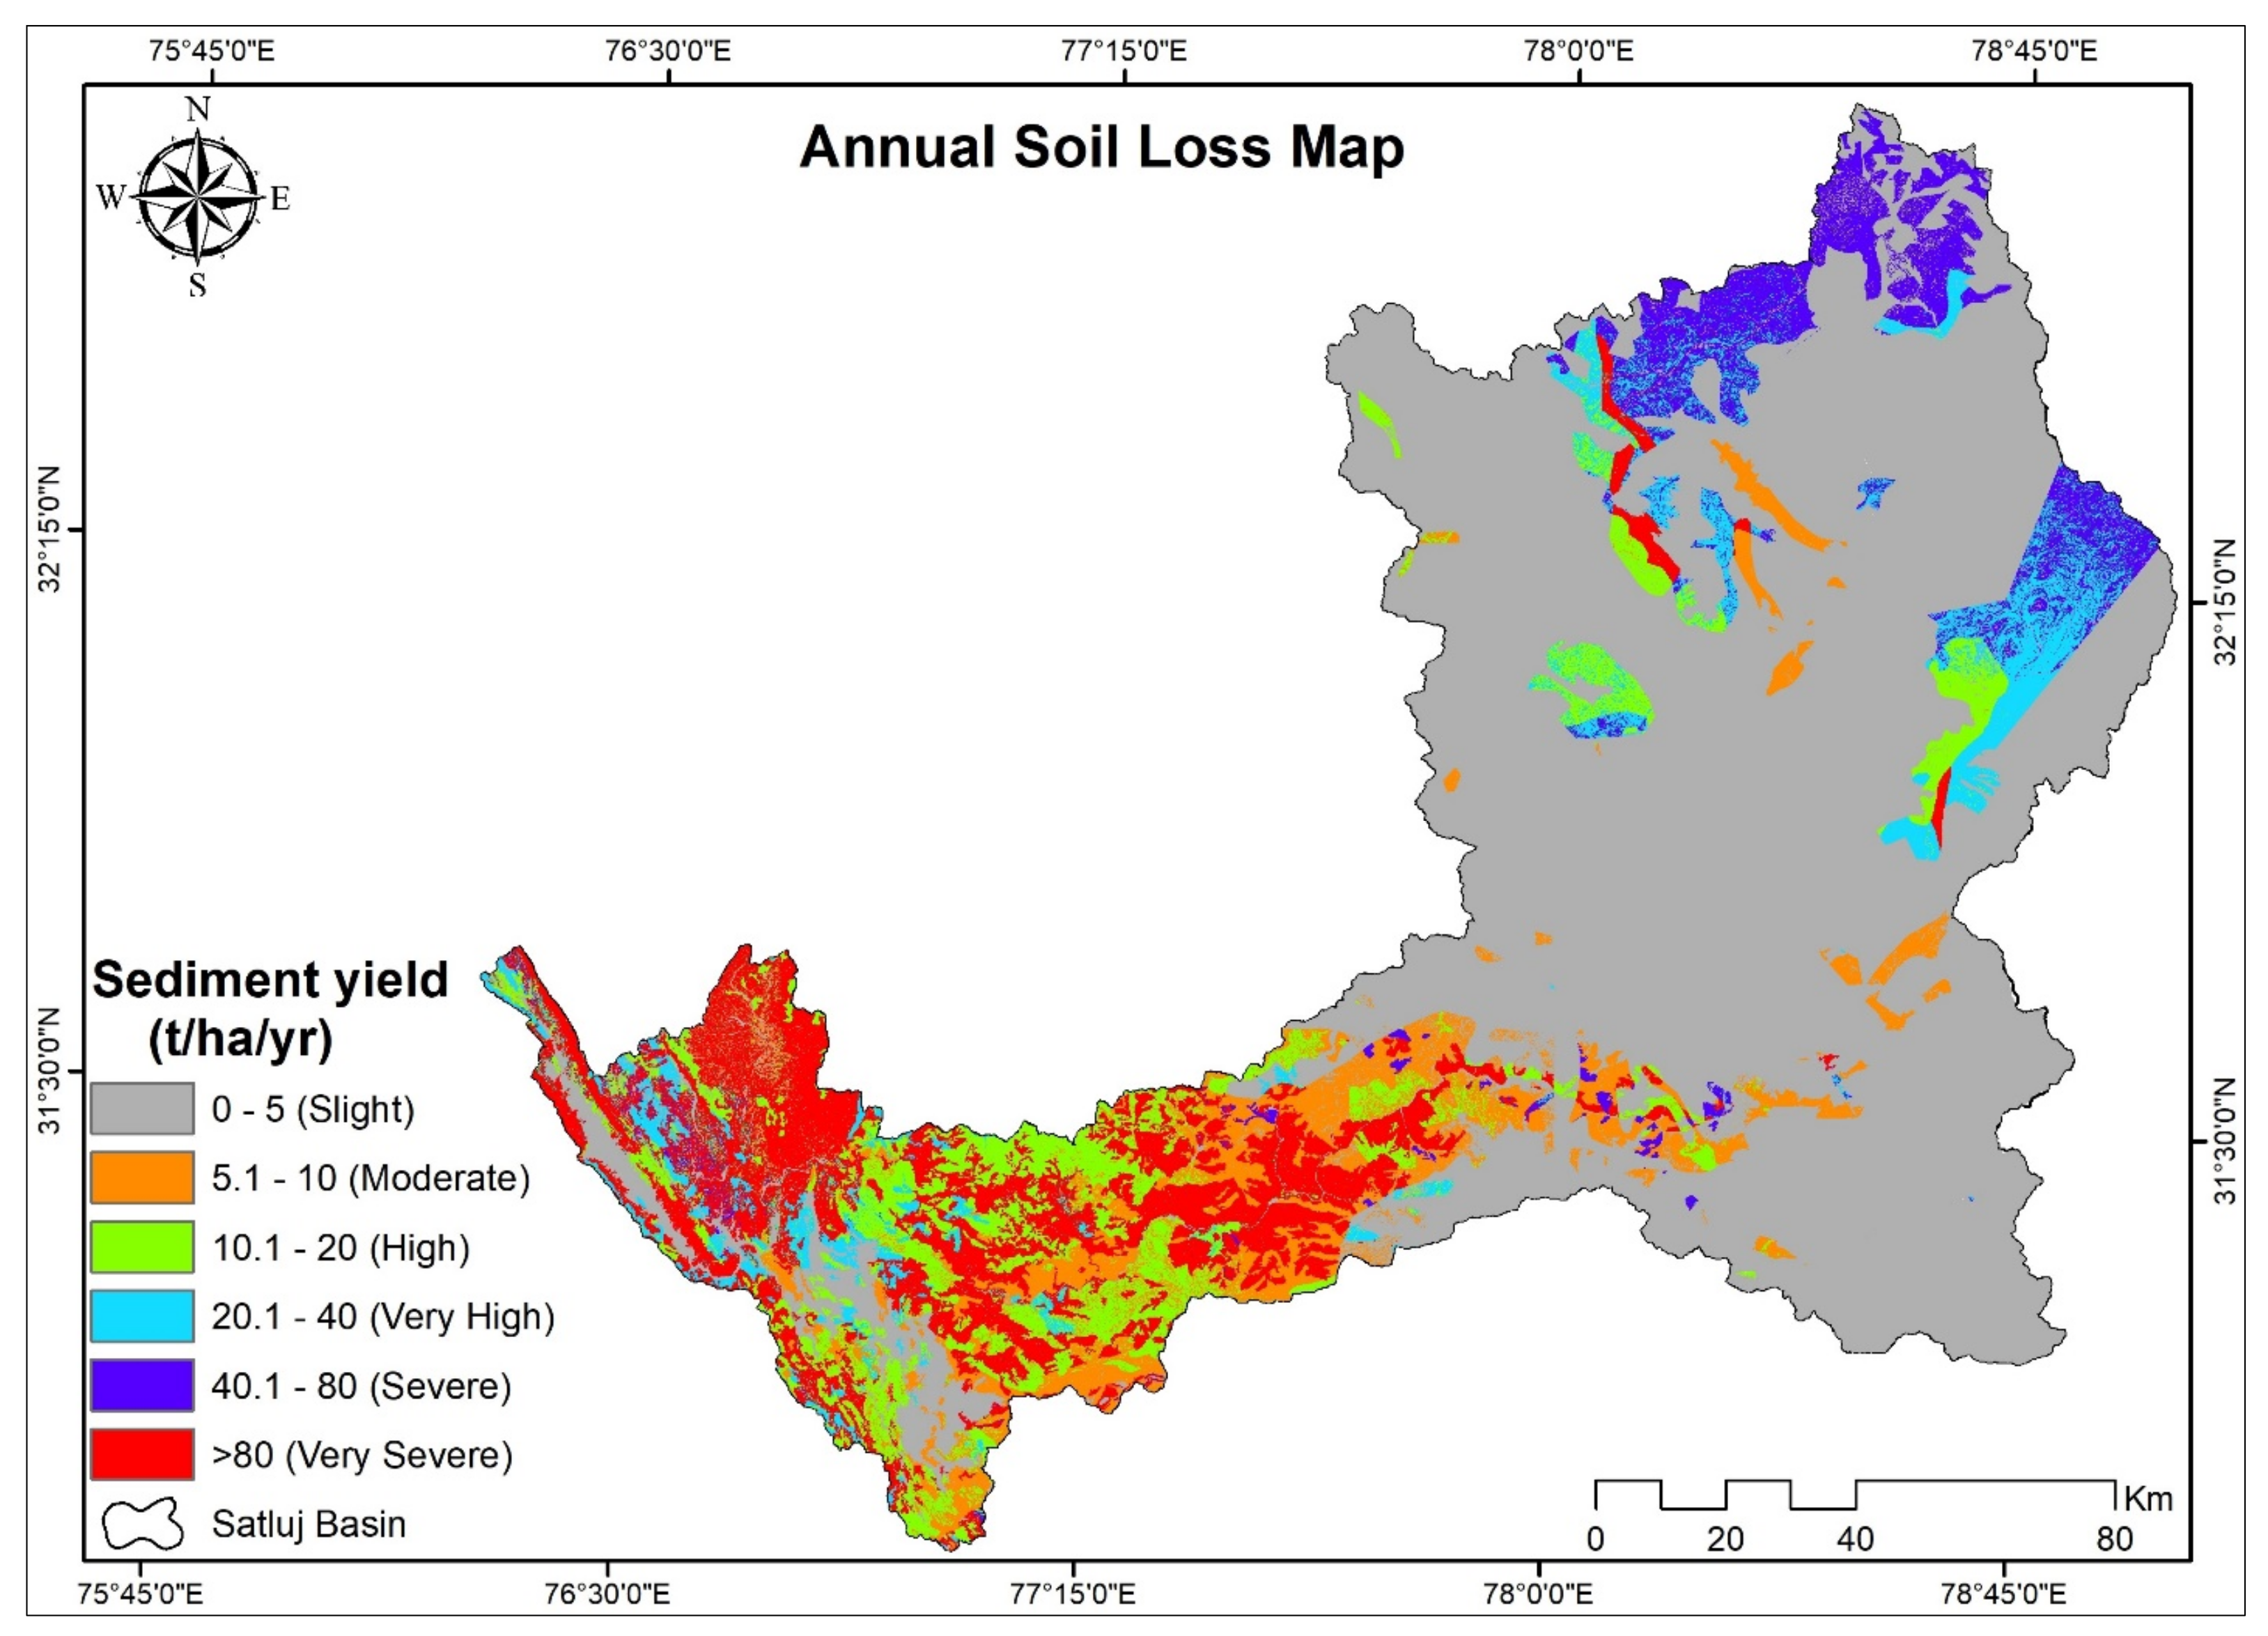
4.4. Identification of Priority Areas in the Sutlej Basin and Erosion Probability Zones
5. Conclusions
Author Contributions
Funding
Institutional Review Board Statement
Informed Consent Statement
Data Availability Statement
Conflicts of Interest
References
- Jain, M.K.; Das, D. Estimation of Sediment Yield and Areas of Soil Erosion and Deposition for Watershed Prioritization using GIS and Remote Sensing. Water Resour. Manag. 2010, 24, 2091–2112. [Google Scholar] [CrossRef]
- Pandey, A.; Chowdary, V.M.; Mal, B.C. Identification of critical erosion prone areas in the small agricultural watershed using USLE, GIS and remote sensing. Water Resour. Manag. 2007, 21, 729–746. [Google Scholar] [CrossRef]
- Ganasri, B.P.; Ramesh, H. Assessment of soil erosion by RUSLE model using remote sensing and GIS—A case study of Nethravathi Basin. Geosci. Front. 2016, 7, 953–961. [Google Scholar] [CrossRef]
- Narayana, D.V.V.; Babu, R. Estimation of Soil Erosion in India. J. Irrig. Drain. Eng. 1983, 109, 419–434. [Google Scholar] [CrossRef]
- Jain, S.K.; Singh, P.; Seth, S.M. Assessment of sedimentation in Bhakra Reservoir in the western Himalayan region using remotely sensed data. Hydrol. Sci. J. 2002, 47, 203–212. [Google Scholar] [CrossRef]
- Senthil Kumar, A.R.; Ojha, C.S.P.; Goyal, M.K.; Singh, R.D.; Swamee, P.K. Modeling of Suspended Sediment Concentration at Kasol in India Using ANN, Fuzzy Logic, and Decision Tree Algorithms. J. Hydrol. Eng. 2012, 17, 394–404. [Google Scholar] [CrossRef]
- Peng, W.; Zhang, Z.; Zhang, K. Hydrodynamic characteristics of rill flow on steep slopes: Hydrodynamic Characteristics of Rill Flow on Steep Slopes. Hydrol. Process. 2015, 29, 3677–3686. [Google Scholar] [CrossRef]
- Sharma, P.D.; Goel, A.K.; Minhas, R.S. Water and Sediment Yields into the Sutlej River from the High Himalaya. Mt. Res. Dev. 1991, 11, 87. [Google Scholar] [CrossRef]
- Das, B.; Paul, A.; Bordoloi, R.; Tripathi, O.P.; Pandey, P.K. Soil erosion risk assessment of hilly terrain through integrated approach of RUSLE and geospatial technology: A case study of Tirap District, Arunachal Pradesh. Model. Earth Syst. Environ. 2018, 4, 373–381. [Google Scholar] [CrossRef]
- Pandey, A.; Mishra, S.; Gautam, A.K. Soil Erosion Modeling Using Satellite Rainfall Estimates. J. Water Resour. Hydraul. Eng. 2015, 4, 318–325. [Google Scholar] [CrossRef]
- Poesen, J.; Nachtergaele, J.; Verstraeten, G.; Valentin, C. Gully erosion and environmental change: Importance and research needs. CATENA 2003, 50, 91–133. [Google Scholar] [CrossRef]
- Tejwani, K.G. Sedimentation of Reservoirs in the Himalayan Region: India. Mt. Res. Dev. 1987, 7, 323. [Google Scholar] [CrossRef]
- Katiyar, R.; Garg, P.K.; Jain, S.K. Watershed Prioritization and Reservoir Sedimentation Using Remote Sensing Data. Geocarto Int. 2006, 21, 55–60. [Google Scholar] [CrossRef]
- Sharma, K.D.; Singh, S. Satellite remote sensing for soil erosion modelling using the ANSWERS model. Hydrol. Sci. J. 1995, 40, 259–272. [Google Scholar] [CrossRef]
- Singh, P.K.; Bhunya, P.K.; Mishra, S.K.; Chaube, U.C. A sediment graph model based on SCS-CN method. J. Hydrol. 2008, 349, 244–255. [Google Scholar] [CrossRef]
- Winchell, M.F.; Jackson, S.H.; Wadley, A.M.; Srinivasan, R. Extension and validation of a geographic information system–based method for calculating the Revised Universal Soil Loss Equation length-slope factor for erosion risk assessments in large watersheds. J. Soil Water Conserv. 2008, 63, 7. [Google Scholar] [CrossRef]
- Demirci, A.; Karaburun, A. Estimation of soil erosion using RUSLE in a GIS framework: A case study in the Buyukcekmece Lake watershed, northwest Turkey. Environ. Earth Sci. 2012, 66, 903–913. [Google Scholar] [CrossRef]
- Karaburun, A. Estimation of C factor for soil erosion modeling using NDVI in Buyukcekmece watershed. Ozean J. Appl. Sci. 2010, 3, 77–85. [Google Scholar]
- Jain, M.K.; Kothyari, U.C. Estimation of soil erosion and sediment yield using GIS. Hydrol. Sci. J. 2000, 45, 771–786. [Google Scholar] [CrossRef]
- Wischmeier, W.H.; Smith, D.D. (Eds.) Predicting Rainfall Erosion Losses: A Guide to Conservation Planning; US Department of Agriculture: Washington, DC, USA, 1978. [Google Scholar]
- Wischmeier, W.H.; Smith, D.D. Rainfall Energy and Its Relationship to Soil Loss. Trans. AGU 1958, 39, 285. [Google Scholar] [CrossRef]
- Renard, K.G.; Foster, G.R.; Weesies, G.A.; Porter, J.P. Revised universal soil loss equation. J. Soil Water Conserv. 1991, 46, 4. [Google Scholar]
- Belasri, A.; Lakhouili, A. Estimation of Soil Erosion Risk Using the Universal Soil Loss Equation (USLE) and Geo-Information Technology in Oued El Makhazine Watershed, Morocco. J. Geogr. Inf. Syst. 2016, 8, 98–107. [Google Scholar] [CrossRef]
- McHugh, M.; Harrod, T.; Morgan, R. The extent of soil erosion in upland England and Wales. Earth Surf. Process. Landforms 2002, 27, 99–107. [Google Scholar] [CrossRef]
- Shi, Z.H.; Ai, L.; Fang, N.F.; Zhu, H.D. Modeling the impacts of integrated small watershed management on soil erosion and sediment delivery: A case study in the Three Gorges Area, China. J. Hydrol. 2012, 438–439, 156–167. [Google Scholar] [CrossRef]
- Shi, Z.H.; Cai, C.F.; Ding, S.W.; Wang, T.W.; Chow, T.L. Soil conservation planning at the small watershed level using RUSLE with GIS: A case study in the Three Gorge Area of China. CATENA 2004, 55, 33–48. [Google Scholar] [CrossRef]
- Renard, K.G. (Ed.) Predicting soil erosion by water: A guide to conservation planning with the revised universal soil loss equation (RUSLE). In Agriculture Handbook; US Department of Agriculture, Agricultural Research Service: Washington, DC, USA, 1997. [Google Scholar]
- Duarte, L.; Teodoro, A.C.; Gonçalves, J.A.; Soares, D.; Cunha, M. Assessing soil erosion risk using RUSLE through a GIS open source desktop and web application. Environ. Monit. Assess. 2016, 188, 351. [Google Scholar] [CrossRef]
- Haiyan, F.; Liying, S. Modelling soil erosion and its response to the soil conservation measures in the black soil catchment, Northeastern China. Soil Tillage Res. 2017, 165, 23–33. [Google Scholar] [CrossRef]
- Kim, J.B.; Saunders, P.; Finn, J.T. Rapid Assessment of Soil Erosion in the Rio Lempa Basin, Central America, Using the Universal Soil Loss Equation and Geographic Information Systems. Environ. Manag. 2005, 36, 872–885. [Google Scholar] [CrossRef]
- Shalini Tirkey, A.; Pandey, A.C.; Nathawat, M.S. Use of Satellite Data, GIS and RUSLE for Estimation of Average Annual Soil Loss in Daltonganj Watershed of Jharkhand (India). J. Remote Sens. Technol. 2013, 1, 20–30. [Google Scholar] [CrossRef]
- Terranova, O.; Antronico, L.; Coscarelli, R.; Iaquinta, P. Soil erosion risk scenarios in the Mediterranean environment using RUSLE and GIS: An application model for Calabria (southern Italy). Geomorphology 2009, 112, 228–245. [Google Scholar] [CrossRef]
- Zhang, K.; Lian, L.; Zhang, Z. Reliability of soil erodibility estimation in areas outside the US: A comparison of erodibility for main agricultural soils in the US and China. Environ. Earth Sci. 2016, 75, 252. [Google Scholar] [CrossRef]
- Kefi, M.; Yoshino, K.; Setiawan, Y. Assessment and mapping of soil erosion risk by water in Tunisia using time series MODIS data. Paddy Water Environ. 2012, 10, 59–73. [Google Scholar] [CrossRef]
- Kumar, S.; Gupta, S. Geospatial approach in mapping soil erodibility using CartoDEM—A case study in hilly watershed of Lower Himalayan Range. J. Earth Syst. Sci. 2016, 125, 1463–1472. [Google Scholar] [CrossRef]
- Basistha, A.; Arya, D.S.; Goel, N.K. Spatial Distribution of Rainfall in Indian Himalayas—A Case Study of Uttarakhand Region. Water Resour. Manag. 2008, 22, 1325–1346. [Google Scholar] [CrossRef]
- Gupta, A.; Dimri, A.P.; Thayyen, R.; Jain, S.; Jain, S. Meteorological trends over Satluj River Basin in Indian Himalaya under climate change scenarios. J. Earth Syst. Sci. 2020, 129, 161. [Google Scholar] [CrossRef]
- Kumar, S. Santosh Spatial Distribution of Rainfall with Elevation in Satluj River Basin: 1986–2010, Himachal Pradesh, India. Int. Lett. Chem. Phys. Astron. 2015, 57, 163–175. [Google Scholar] [CrossRef]
- Chorley, R. Horton, R.E. 1945: Erosional development of streams and their drainage basins: Hydrophysical approach to quantitative morphology. Bulletin of the Geological Society of America 56, 275-370. Prog. Phys. Geogr. 1995, 19, 533–554. [Google Scholar] [CrossRef]
- Horton, R.E. Erosional Development of Streams and Their Drainage Basins: Hydrophysical Approach to Quantitative Morphology. Geol. Soc. Am. Bull. 1945, 56, 275. [Google Scholar] [CrossRef]
- Gajbhiye, S.; Mishra, S.K.; Pandey, A. Prioritizing erosion-prone area through morphometric analysis: An RS and GIS perspective. Appl. Water Sci. 2014, 4, 51–61. [Google Scholar] [CrossRef]
- Renard, K.G.; Yoder, D.C.; Lightle, D.T.; Dabney, S.M. Universal Soil Loss Equation and Revised Universal Soil Loss Equation. In Handbook of Erosion Modelling; Morgan, R.P.C., Nearing, M.A., Eds.; John Wiley & Sons, Ltd.: Chichester, UK, 2011; pp. 135–167. [Google Scholar] [CrossRef]
- Arnoldus, H.M.J. An Approximation of the Rainfall Factor in the Universal Soil Loss Equation. In Assessment of Erosion; De Boodt, M., Gabriels, D., Eds.; John Wiley and Sons: New York, NY, USA, 1980; pp. 127–132. [Google Scholar]
- McCool, D.K.; Brown, L.C.; Foster, G.R.; Mutchler, C.K.; Meyer, L.D. Revised Slope Steepness Factor for the Universal Soil Loss Equation. Trans. ASAE 1987, 30, 1387–1396. [Google Scholar] [CrossRef]
- McCool, D.K.; George, G.O.; Freckleton, M.; Douglas, C.L.; Papendick, R.I. Topographic Effect on Erosion from Cropland in the Northwestern Wheat Region. Trans. ASAE 1993, 36, 771–775. [Google Scholar] [CrossRef]
- Liu, B.Y.; Nearing, M.A.; Shi, P.J.; Jia, Z.W. Slope Length Effects on Soil Loss for Steep Slopes. Soil Sci. Soc. Am. J. 2000, 64, 1759. [Google Scholar] [CrossRef]
- Moore, I.D.; Wilson, J.P. Length-slope factors for the Revised Universal Soil Loss Equation: Simplified method of estimation. J. Soil Water Conserv. 1992, 47, 423–428. [Google Scholar]
- Sheikh, A.H.; Palria, S.; Alam, A. Integration of GIS and Universal Soil Loss Equation (USLE) for Soil Loss Estimation in a Himalayan Watershed. Recent Res. Sci. Technol. 2011, 3, 51–57. [Google Scholar]


| S. No. | Soil Classes | Area (km2) | Area (%) | K Factor |
|---|---|---|---|---|
| 1 | Glaciers | 141.06 | 0.65 | 0 |
| 2 | Sandy | 924.18 | 4.28 | 0.44 |
| 3 | Loamy skeletal | 2215.60 | 10.26 | 0.19 |
| 4 | Glaciers and rock outcrops | 4338.80 | 20.09 | 0.01 |
| 5 | Loamy | 4422.39 | 20.48 | 0.27 |
| 6 | Rock outcrops | 9554.31 | 44.24 | 0.02 |
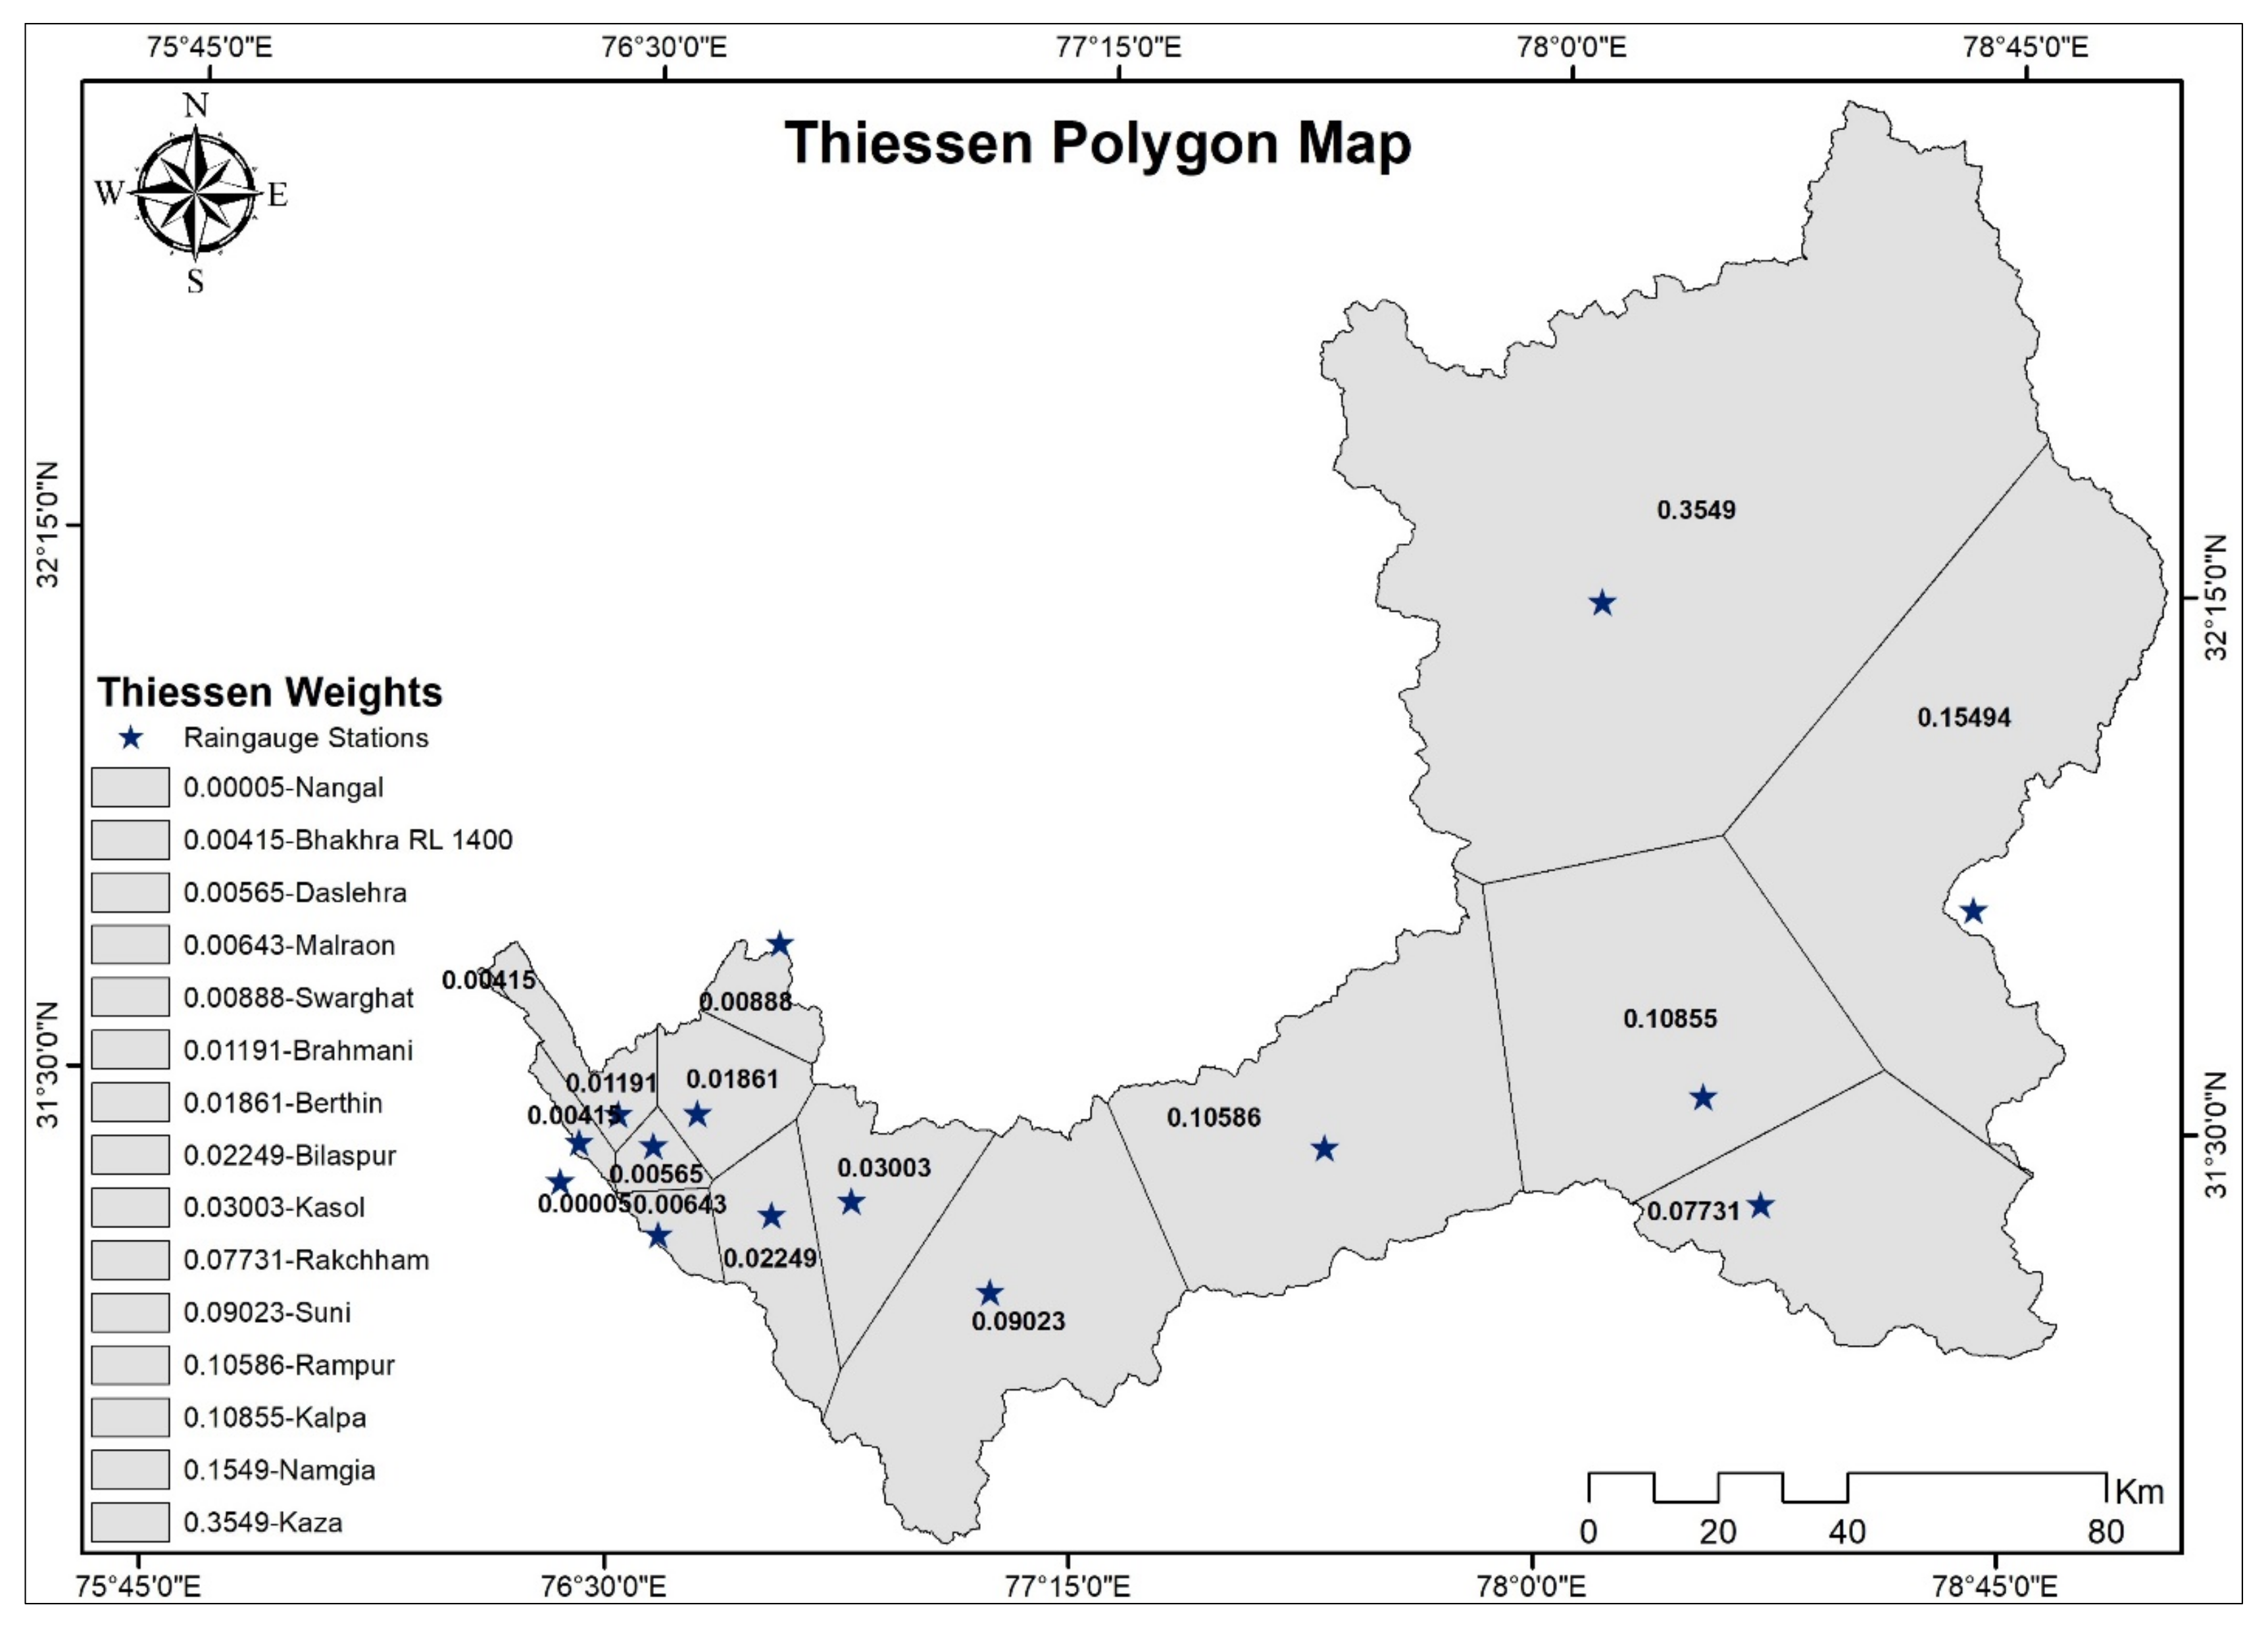
| S. No. | Site Name | Longitude (E) | Latitude (N) | Area (km2) | TW |
|---|---|---|---|---|---|
| 1 | Berthin | 76.622 | 31.471 | 401.94 | 0.01861 |
| 2 | Bhakhra | 76.432 | 31.424 | 89.73 | 0.00416 |
| 3 | Bilaspur | 76.750 | 31.333 | 485.58 | 0.02249 |
| 4 | Brahmani | 76.495 | 31.465 | 257.21 | 0.01191 |
| 5 | Daslehra | 76.553 | 31.423 | 122.04 | 0.00565 |
| 6 | Kalpa | 78.258 | 31.540 | 2344.13 | 0.10855 |
| 7 | Kasol | 76.878 | 31.357 | 648.43 | 0.03003 |
| 8 | Kaza | 78.072 | 32.225 | 7664.24 | 0.3549 |
| 9 | Malraon | 76.567 | 31.300 | 138.89 | 0.00643 |
| 10 | Namgia | 78.692 | 31.808 | 3346.01 | 0.15494 |
| 11 | Nangal | 76.404 | 31.368 | 1.133 | 0.00005 |
| 12 | Rakchham | 78.356 | 31.392 | 1669.53 | 0.07731 |
| 13 | Rampur | 77.644 | 31.454 | 2286.05 | 0.10586 |
| 14 | Suni | 77.108 | 31.238 | 1948.60 | 0.09023 |
| 15 | Swarghat | 76.746 | 31.713 | 191.86 | 0.00888 |
| Type of Data | Data Source | Summary |
|---|---|---|
| Digital Elevation Model (DEM) | www.usgs.gov (accessed on 30 April 2023) | ASTER DEM (30 m Spatial Resolution) |
| Satellite Image | www.usgs.gov (accessed on 30 April 2023) | Landsat-8 Image (with 30 m Spatial Resolution) |
| Soil Data | National Bureau of Soil Survey and Land Utilization Planning (NBSS and LUP), India | Soil map of 2010. Six classes were found on the basis of their texture |
| Rainfall Data | Bhakhra-Beas Management Board (BBMB) and Indian Meteorological Department (IMD), India | Rainfall data for a period of 13 years (1995–2007) provided by BBMB and for 8 years (2008–2015) provided by IMD with 15 rain gauge stations |
| S. No. | LULC Class | Area (ha) | Area (%) | C-Factor | P-Factor |
|---|---|---|---|---|---|
| 1 | Barren Land | 2244.23 | 10.40 | 0.5 | 1 |
| 2 | Built-up | 21.82 | 0.10 | 0.09 | 1 |
| 3 | Crop Land | 1872.21 | 8.67 | 0.63 | 0.28 |
| 4 | Deciduous Broad Leaf Forest | 158.63 | 0.73 | 0.008 | 1 |
| 5 | Evergreen Broad Leaf Forest | 2960.61 | 13.71 | 0.004 | 1 |
| 6 | Evergreen Needle Leaf Forest | 20.80 | 0.10 | 0.003 | 1 |
| 7 | Grassland | 4927.63 | 22.83 | 0.01 | 0.8 |
| 8 | Mixed Forest | 888.56 | 4.12 | 0.003 | 1 |
| 9 | Permanent Wetland | 1.25 | 0.01 | 0 | 1 |
| 10 | Plantation | 913.81 | 4.23 | 0.075 | 0.5 |
| 11 | Shrub Land | 990.60 | 4.59 | 0.001 | 1 |
| 12 | Sown and Ice | 6276.08 | 29.07 | 0 | 1 |
| 13 | Waste Land | 52.80 | 0.24 | 0.18 | 1 |
| 14 | Water Bodies | 259.00 | 1.20 | 0 | 1 |
| Classification Data | BL | BU | CL | DBLE | EBLF | ENLF | GL | MF | PW | P | SL | S&I | WL | WB |
|---|---|---|---|---|---|---|---|---|---|---|---|---|---|---|
| BL | 67 | 0 | 0 | 0 | 0 | 0 | 3 | 0 | 0 | 0 | 6 | 0 | 0 | 0 |
| BU | 0 | 78 | 3 | 0 | 0 | 0 | 0 | 0 | 0 | 2 | 0 | 0 | 0 | 0 |
| CL | 0 | 1 | 108 | 1 | 0 | 0 | 0 | 1 | 2 | 0 | 0 | 3 | 0 | 2 |
| DBLE | 0 | 0 | 1 | 67 | 0 | 0 | 0 | 0 | 0 | 1 | 0 | 0 | 0 | 0 |
| EBLF | 4 | 0 | 0 | 1 | 48 | 0 | 0 | 0 | 3 | 0 | 0 | 0 | 2 | 0 |
| ENLF | 0 | 0 | 0 | 0 | 4 | 53 | 0 | 1 | 1 | 0 | 0 | 0 | 0 | 0 |
| GL | 0 | 0 | 0 | 0 | 0 | 0 | 34 | 4 | 0 | 0 | 3 | 0 | 0 | 0 |
| MF | 0 | 0 | 5 | 0 | 0 | 0 | 0 | 89 | 0 | 0 | 0 | 0 | 0 | 5 |
| PW | 3 | 5 | 0 | 0 | 0 | 0 | 0 | 0 | 27 | 0 | 1 | 3 | 0 | 0 |
| P | 0 | 0 | 0 | 0 | 0 | 1 | 6 | 0 | 0 | 53 | 0 | 0 | 0 | 0 |
| SL | 0 | 0 | 0 | 0 | 5 | 0 | 0 | 0 | 0 | 0 | 46 | 0 | 0 | 0 |
| S&I | 0 | 0 | 6 | 0 | 0 | 0 | 0 | 0 | 1 | 0 | 0 | 56 | 0 | 15 |
| WL | 2 | 0 | 0 | 0 | 0 | 0 | 0 | 0 | 1 | 0 | 0 | 0 | 37 | 0 |
| WB | 0 | 0 | 0 | 1 | 0 | 0 | 2 | 0 | 0 | 0 | 0 | 0 | 0 | 59 |
| Year | Average Soil Loss (t/ha/Year) |
|---|---|
| 1995 | 79.67 |
| 1996 | 48.14 |
| 1997 | 54.93 |
| 1998 | 49.42 |
| 1999 | 52.68 |
| 2000 | 52.85 |
| 2001 | 42.34 |
| 2002 | 36.16 |
| 2003 | 55.95 |
| 2004 | 36.37 |
| 2005 | 55.71 |
| 2006 | 45.55 |
| 2007 | 64.84 |
| 2008 | 74.11 |
| 2009 | 46.08 |
| 2010 | 62.44 |
| 2011 | 75.55 |
| 2012 | 72.64 |
| 2013 | 61.78 |
| 2014 | 42.54 |
| 2015 | 70.02 |
| S. No. | LULC Class | Area (ha) | Area (%) | C-Factor | P-Factor |
|---|---|---|---|---|---|
| 1 | Agriculture | 8699.81 | 40.30 | 0.63 | 0.28 |
| 2 | Barren Land | 2246.87 | 10.41 | 0.5 | 1 |
| 3 | Built-up | 21.81 | 0.10 | 0.09 | 1 |
| 4 | Forest | 4023.95 | 18.64 | 0.003 | 1 |
| 5 | Snow and Ice | 6282.35 | 29.10 | 0 | 1 |
| 6 | Waste Land | 52.63 | 0.24 | 0.18 | 1 |
| 7 | Water Bodies | 259.58 | 1.20 | 0 | 1 |
| S. No. | Rate or Erosion (t/ha/Year) | Area (ha) | Area (%) | Class of Priority |
|---|---|---|---|---|
| 1 | 0–5 | 13,580.12 | 62.91 | Slight |
| 2 | 5–10 | 1601.17 | 7.42 | Moderate |
| 3 | 10–20 | 1672.00 | 7.75 | High |
| 4 | 20–40 | 1157.47 | 5.36 | Very high |
| 5 | 40–80 | 1109.78 | 5.14 | Severe |
| 6 | >80 | 2465.75 | 11.42 | Very Severe |
| S. No. | Sub-Watershed | Soil Erosion Class | Rank |
|---|---|---|---|
| 1 | SW1 | Very high | 6 |
| 2 | SW2 | Very high | 5 |
| 3 | SW3 | Slight | 9 |
| 4 | SW4 | Moderate | 7 |
| 5 | SW5 | Slight | 8 |
| 6 | SW6 | Severe | 4 |
| 7 | SW7 | Very severe | 2 |
| 8 | SW8 | Very severe | 3 |
| 9 | SW9 | Very severe | 1 |
Disclaimer/Publisher’s Note: The statements, opinions and data contained in all publications are solely those of the individual author(s) and contributor(s) and not of MDPI and/or the editor(s). MDPI and/or the editor(s) disclaim responsibility for any injury to people or property resulting from any ideas, methods, instructions or products referred to in the content. |
© 2023 by the authors. Licensee MDPI, Basel, Switzerland. This article is an open access article distributed under the terms and conditions of the Creative Commons Attribution (CC BY) license (https://creativecommons.org/licenses/by/4.0/).
Share and Cite
Gupta, S.; Ojha, C.S.P.; Singh, V.P.; Adeloye, A.J.; Jain, S.K. Pixel-Based Soil Loss Estimation and Prioritization of North-Western Himalayan Catchment Based on Revised Universal Soil Loss Equation (RUSLE). Sustainability 2023, 15, 15177. https://doi.org/10.3390/su152015177
Gupta S, Ojha CSP, Singh VP, Adeloye AJ, Jain SK. Pixel-Based Soil Loss Estimation and Prioritization of North-Western Himalayan Catchment Based on Revised Universal Soil Loss Equation (RUSLE). Sustainability. 2023; 15(20):15177. https://doi.org/10.3390/su152015177
Chicago/Turabian StyleGupta, Shishant, Chandra Shekhar Prasad Ojha, Vijay P. Singh, Adebayo J. Adeloye, and Sanjay K. Jain. 2023. "Pixel-Based Soil Loss Estimation and Prioritization of North-Western Himalayan Catchment Based on Revised Universal Soil Loss Equation (RUSLE)" Sustainability 15, no. 20: 15177. https://doi.org/10.3390/su152015177
APA StyleGupta, S., Ojha, C. S. P., Singh, V. P., Adeloye, A. J., & Jain, S. K. (2023). Pixel-Based Soil Loss Estimation and Prioritization of North-Western Himalayan Catchment Based on Revised Universal Soil Loss Equation (RUSLE). Sustainability, 15(20), 15177. https://doi.org/10.3390/su152015177