Article

Insights into Opposite and Positive Effects of Biochar and Organic Fertilizer on Red Soil Properties and Growth of Pennisetum giganteum

1
Soil and Fertilizer Research Institute, Guizhou Academy of Agricultural Sciences, Guiyang 550006, China
2
School of Pharmacy, Zunyi Medical University, Zunyi 563006, China
3
Faculty of Food Science and Engineering, Foshan University, Foshan 258000, China
4
Biological Technology Research Institute, Qiandongnan Academy of Agricultural Sciences, Kaili 556000, China
5
Key Laboratory for New Technology Research of Vegetable, Vegetable Research Institute, Guangdong Academy of Agricultural Sciences, Guangzhou 510640, China
6
School of Agriculture, Sun Yat-sen University, Shenzhen 518107, China
*
Author to whom correspondence should be addressed.
Sustainability 2023, 15(20), 15142; https://doi.org/10.3390/su152015142
Submission received: 12 June 2023 / Revised: 21 August 2023 / Accepted: 12 October 2023 / Published: 23 October 2023
(This article belongs to the Special Issue Advanced Methods and Technologies in Soil Metal Pollution Removal)

Abstract

:
Biochar (BC) and organic fertilizers (OFs) are both organic soil amendments that can be used to improve soil quality, but their effects on soil physicochemical properties and microbial structures may be different. Comparative studies can help us understand the advantages and disadvantages of different types of soils. In the current research, five treatments, including a control group (CK), two concentrations of biochar (2% BC and 4% BC), and two concentrations of organic fertilizer (2% OF and 4% OF) and their effects on soil properties, enzyme activities, and bacterial diversity were evaluated. The BC and OF significantly increased the soil EC, pH, and soil nutrients (p < 0.05). The 2% BC increased the biomass of Pennisetum giganteum by 41.7%. The 4% BC and OF reduced the biomass of P. giganteum. Furthermore, the observed decrease in the P. giganteum yield following the application of the 4% BC can be attributed to reductions in the available phosphorus (AP) and CaCl2-P, as well as alterations in the soil enzyme activity. However, the negative impact of OFs on crop yield may be associated with an increased EC, elevated abundance of soil-borne pathogens, and decreased levels of beneficial microorganisms. In summary, a comparative study of the effects of BC and OF on the growth of P. giganteum in acidic soil is of great significance for improving the soil quality, promoting the development of organic agriculture, protecting the environment, and promoting land reclamation.

1. Introduction

Red soil, constituting nearly 50% of the world’s arable land, plays a crucial role in global agriculture [1,2]. However, the inherent nutrient deficiencies, poor water-holding capacity, and high acidity often lead to suboptimal crop productivity [3,4,5,6]. To address these challenges, the incorporation of soil amendments has emerged as a promising approach to enhance soil quality and boost crop yields.
Among the various soil amendments available, biochar and organic fertilizers have gained significant attention due to their proven efficacy in improving soil properties and promoting plant growth [7,8,9]. Biochar, a carbon-rich material produced through the pyrolysis of biomass, has unique properties such as a large specific surface area and high porosity, making it a valuable candidate for soil improvement [10,11]. Biochar not only enhances the soil structure, reducing compaction and erosion risks, but also exhibits a high water-holding capacity, contributing to better soil-moisture management [12,13,14]. Moreover, its introduction into the soil environment fosters increased microbial activity, improving soil fertility and nutrient cycling [15,16,17]. Warnock et al. [18] found that a biochar addition increased soil N retention and availability, leading to improved plant growth and yield. Noyce et al. [19] found that a biochar amendment increased soil phosphatase activity and improved plant phosphatase uptake and growth. Organic fertilizers, on the other hand, are renowned for their nutrient-rich composition, promoting microbial activity, enriching microbial diversity, and restoring soil fertility [20,21,22]. They enhance the soil structure and water-holding capacity by increasing the soil organic matter content [23,24], providing essential nutrients like nitrogen, phosphorus, and potassium that are crucial for optimal plant growth [25,26,27]. Cooperband et al. [28] found that the application of chicken manure increased soil nitrogen and phosphorus availability, leading to the increased growth and yield of maize plants.
While numerous studies have independently investigated the benefits of biochar and organic fertilizers, there remains a lack of direct comparison between the two amendments regarding their distinct mechanisms of improving the soil quality and promoting crop productivity. To address this gap, the current study aims to comprehensively compare the effects of biochar and organic fertilizer on the growth of Pennisetum giganteum, a high-value crop extensively cultivated worldwide for feed production and edible fungus cultivation [29,30]. Additionally, we seek to elucidate the mechanisms, reactions, and kinetics of these materials in enhancing the red soil quality.
This study employs a pot experiment with five treatments, including a control group (CK), two concentrations of biochar (2% BC and 4% BC), and two concentrations of organic fertilizer (2% OF and 4% OF), applied separately to the soil. By assessing the soil properties, enzyme activities, and bacterial diversity, we aim to determine the optimal application rate of each material to achieve significant soil improvement and maximize crop productivity. This research contributes to the existing knowledge by directly comparing the effects of biochar and organic fertilizers on red soil improvement under the same application amount. This study provides insights into the mechanisms, reactions, and kinetics of these materials. By assessing their effects on soil properties, enzyme activities, and bacterial diversity, this study offers a comprehensive understanding of the impacts of biochar and organic fertilizers on red soil and crop growth.

2. Materials and Methods

2.1. Site Description, Soil Sampling, and Amendments

A pot experiment with P. giganteum using biochar and organic fertilizer was conducted in the Kangxilai modern agricultural industry park greenhouse in Sanshui District, Foshan City, Guangdong Province, China (23°3′40″ N, 112°50′13″ E). During the experiment, the average maximum and minimum temperatures were 20 °C and 8 °C, respectively, and the average relative humidity was 30%. The 0–20 cm soil was collected from the cultivated land of the Kangxilai modern agricultural industry park, which was acidic sandy loam soil, pH 5.98, EC 44.3 μS cm−1, organic matter (OM) 13.61 g kg−1, available phosphorus (AP) 84.28 mg kg−1, nitrate nitrogen (NO3-N) 1.96 mg kg−1, ammonium nitrogen (NH4+-N) (3.98 mg kg−1). The soil samples were mixed thoroughly, air-dried, and sieved through a 2 mm mesh. P. giganteum was sown in plastic pots with a bottom inner diameter of 12 cm, top inner diameter of 13.5 cm, and height of 5 cm. The biochar and organic fertilizer were mixed evenly with the soil and loaded into the pots, which were managed by using local traditional methods. Organic fertilizer is made from chicken manure compost and is widely used in local vegetables and crops and is provided by Guangdong Runtian Fertilizer Co., Ltd. in Yunfu, China, pH 8.09, EC 6280 μS cm−1, TN 1.98 g kg−1, OM 860 g kg−1. The biochar was produced by Henan Haosen Environmental Protection Technology Co., Ltd. in China from rice straw by fast pyrolysis at 600 °C, pH 9.62, EC 850 μS cm−1, TN 3.79 g kg−1, OM 480 g kg−1.

2.2. Experimental Setup

In our previous study, the amount of fertilizer applied in the field was 0.9% (when the soil depth was 20 cm and the bulk density was 1.2 g cm−3) [31,32]. To ensure the growth of P. giganteum, we used two doses of 2% and 4%. This study comprised five treatments with three replicates: a blank control (CK), 2% (w/w) biochar (2% BC), 4% (w/w) biochar (4% BC), 2% (w/w) organic fertilizer (2% OF), and 4% (w/w) organic fertilizer (4% OF). Uniform management measures (watering 20 mL per day) were employed across all treatments. Each treatment involved growing ten plants of P. giganteum and retaining three uniformly grown plants for the following analysis. Soil samples were collected by using a five-point sampling method (0–15 cm) and were mixed to form each repeated soil sample. In total, 100 g of each soil sample was stored at −80 °C for microbial detection. After drying the remaining soil, half is used for measuring the physical and chemical properties and the other half is used for measuring the soil enzyme activity. The P. giganteum was harvested on 10 February 2023, and the entire plant was cleaned and air-dried naturally before measuring the plant height and stem diameter and being placed in a plastic bag to obtain the fresh weight. Finally, the bags were oven-dried at 105 °C for one hour to kill the fresh tissues and then dried at 65 °C until a constant weight was reached [33].

2.3. Soil Physicochemical Properties

The electrical conductivity (EC) and pH values of the soil were measured by using a pH/conductivity benchtop meter (Thermo, Scientific OrionA215, Waltham, MA, USA) with a 1:5 (w/v) suspension in water [34]. The determination of available phosphorus (AP), phosphorus fractionation (Al-P, Fe-P, Ca-P), NO3-N, and NH4+-N in soil was performed following the methods described in “Soil Chemical Analysis” (3rd edition). The AP was extracted with 0.5 mol L−1 NaHCO3 (pH 8.5) and was determined by molybdenum antimony colorimetry. We performed phosphorus fractionation with modified methods [35,36,37]. For the determination of NO3-N, 2 mL of the filtrate obtained by extracting 5 g of fresh soil with 2 mol L−1 KCl was mixed with 0.4 mL of the catalyst (CuSO4, ZnSO4), 0.4 mL of 1 mol L−1 NaOH, and 0.4 mL of hydrazine monohydrochloride and was heated at 33 °C for 10 min. Then, 1.2 mL of sulfanilamide and 0.4 mL of NED were added, and the NO3-N content was measured by colorimetry at 540 nm [38]. Simultaneously, 4 mL of the filtrate was mixed with 0.5 mL of phenol and 0.5 mL of sodium hypochlorite, and after standing at room temperature for 30 min, 0.1 mL of a masking agent was added, and the NH4+-N content was determined at 625 nm [38]. CaCl2-P was performed by extracting 4 g of air-dried soil with 20 mL of 0.01 mol L−1 CaCl2, shaking for 15 min, and taking 5 mL of the filtrate. Then, 1 mL of the molybdenum antimony reagent was added, and after adding 4 mL of ultrapure water, the mixture was measured at 880 nm [38,39].

2.4. Soil Enzyme Activity

The activity of soil enzymes including invertase (INV), catalase (CAT), β-glucosidase (β-GC), acid phosphatase (ACP), and alkaline phosphatase (ALP) was determined according to the methods described as follows: INV activity was expressed as milligrams of glucose per gram of soil after 24 h. INV activity was determined by incubating 5 g of air-dried soil with 15 mL of 8% sucrose solution at 37 °C for 24 h. The filtrate was reacted with 3,5-dinitrosalicylic acid and the absorbance was measured at 508 nm [38]. The CAT activity was expressed as milliliters of 0.1 N potassium permanganate per gram of soil after 20 min [40]. The soil was incubated with 40 mL of distilled water and 5 mL of 0.3% hydrogen peroxide for 20 min at room temperature, followed by titration with 0.1 N of potassium permanganate solution to a faint pink endpoint. β-GC activity was expressed as milligrams of 2-hydroxybenzyl alcohol per gram of soil after 24 h [41]. The soil was incubated with 10 g of air-dried soil, 1.5 mL of toluene, 10 mL of D (-)-salicin, and 20 mL of a pH 6.2 acetate buffer at 37 °C for 24 h. The filtrate was reacted with 2,6-dibromoquinone-4-chlorimide and absorbance was measured at 578 nm. The ACP and ALP activities were both expressed as milligrams of phenol per gram of soil after 24 h [42]. The soil was incubated with 5 g of air-dried soil, 2.5 mL of toluene, and 20 mL of 0.5% phenyl phosphate (the acidity phosphatase used a pH 5 acetate buffer and the alkaline phosphatase used a pH 9.4 borate buffer) at 37 °C for 24 h. The filtrate was reacted with a 0.3% aluminum sulfate solution followed by a reaction with 2,6-dibromoquinone-4-chlorimide and a colorimetric measurement at 660 nm by using a spectrophotometer.

2.5. Microbial Diversity Detection

We selected the most important and representative treatments, including the CK, 2% OF, and 2% BC, to analyze the microbial diversity detection. Samples of rhizosphere soil were sent to Shanghai Majorbio Bio-pharm Technology Co. (Shanghai, China) with dry ice to extract, multiply, and sequence bacterial DNA. DNA was extracted from the soil samples, and the extracted genomic DNA was detected by 1% agarose gel electrophoresis and then amplified and sequenced on the Illumina MiSeq platform. The V3–V4 hypervariable region of the 16s rRNA gene was amplified by using the universal primers 338F (5′-ACTCCTACGGGAGGCAGCA-3′) and 806R (5′-GGACTACHVGGGTWTCTAAT-3′) (GeneAmp 9700, ABI, USA (Los Angeles, CA, USA)).
The data were analyzed on the online platform of the Majorbio Cloud Platform. In all nine samples, nonredundant sequences (excluding singletons) were clustered into operational taxonomic units (OTUs) based on 97% similarity, and chimeras were removed during clustering to obtain representative sequences for each OTU. All the optimized sequences were mapped to the representative sequences of the OTUs, and the sequences with a similarity of over 97% were selected to generate the OTU table. The bacterial database Silva “http://www.arb-silva.de (accessed on 10 March 2023)” was used to classify the sequences by measuring the composition and diversity of the bacterial communities in the control soil and under different treatments. Sequencing was then evaluated by using bioinformatics, and the processed data were assessed for species composition, species difference, connection with environmental parameters, and function prediction analysis.

2.6. Data Statistical Analysis

In this study, the data of the P. giganteum growth index, soil physical and chemical properties, and enzyme activity involved were analyzed by using the Excel plugin XLSTAT for an analysis of variance (ANOVA). A single-factor ANOVA was used to analyze the height, stem diameter, fresh weight, dry weight, and soil physical and chemical enzyme properties. Differences among the means were determined by using the least significant difference (LSD or Tukey HSD) test (p < 0.05) when indicated by different letters. Origin 2018 was used to plot the data, including the height, stem diameter, fresh weight, dry weight, pH, and EC. The corrplot package in the R language was adopted to calculate the correlation coefficient, and the plot was drawn by using ggplot2 in R 4.0.2.

3. Results

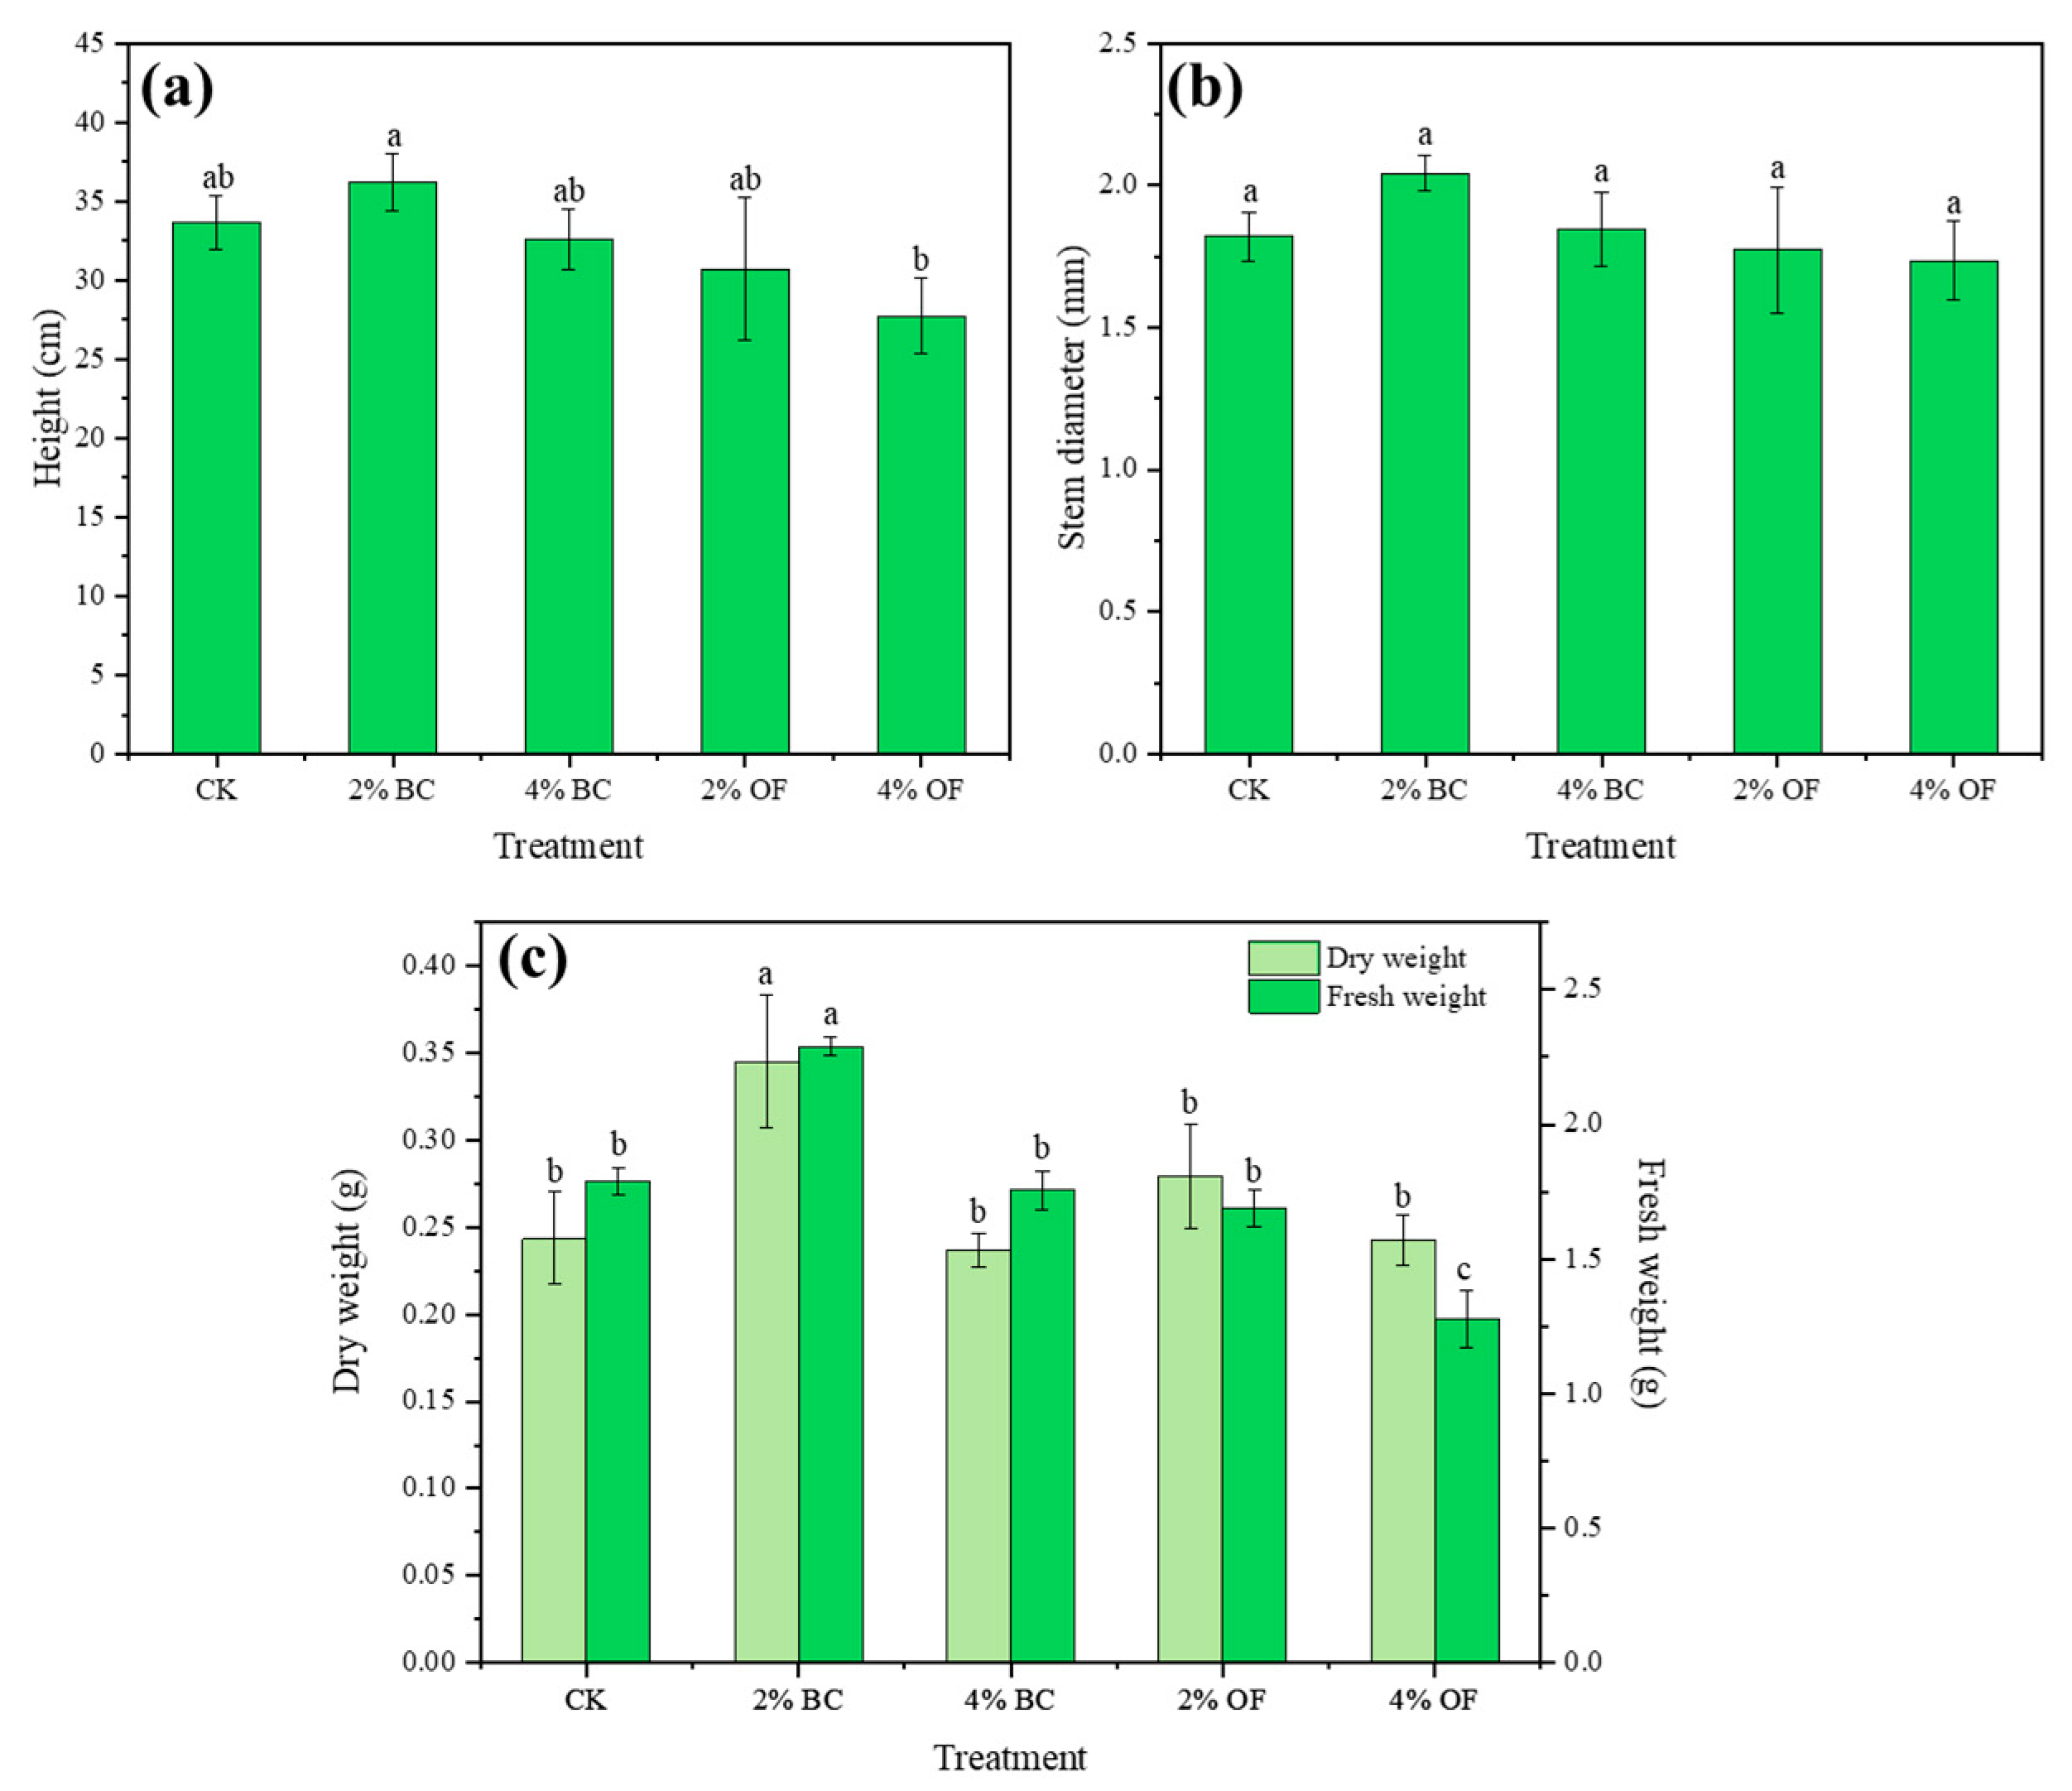
3.1. Analysis of the Growth of P. giganteum

Significant differences in the growth parameters were observed among the treatments (Figure 1). Specifically, compared to the CK, P. giganteum showed a 7.5% increase in plant height and a 12.1% increase in stem diameter after receiving the 2% BC treatment (Figure 1a,b). However, compared to the control (CK), the 4% BC, 2% OF, and 4% OF treatments all resulted in a reduced plant height of P. giganteum. The stem diameter of P. giganteum was higher in the 2% BC and 4% BC treatments than in the CK, whereas in the 2% OF and 4% OF treatments, the stem diameter was lower than in the CK.
The fresh weight and dry weight of P. giganteum showed a similar trend (Figure 1c), and the dry weight of the biomass showed a significant difference ( p < 0.05 ). Remarkably, the 2% BC treatment exhibited a substantial and favorable impact with an impressive 41.7% increase compared to the control group. Conversely, elevated concentrations of biochar (4% BC) and organic fertilizer (2% OF and 4% OF) exerted adverse effects on the dry weight of P. giganteum, leading to varying degrees of biomass reduction.

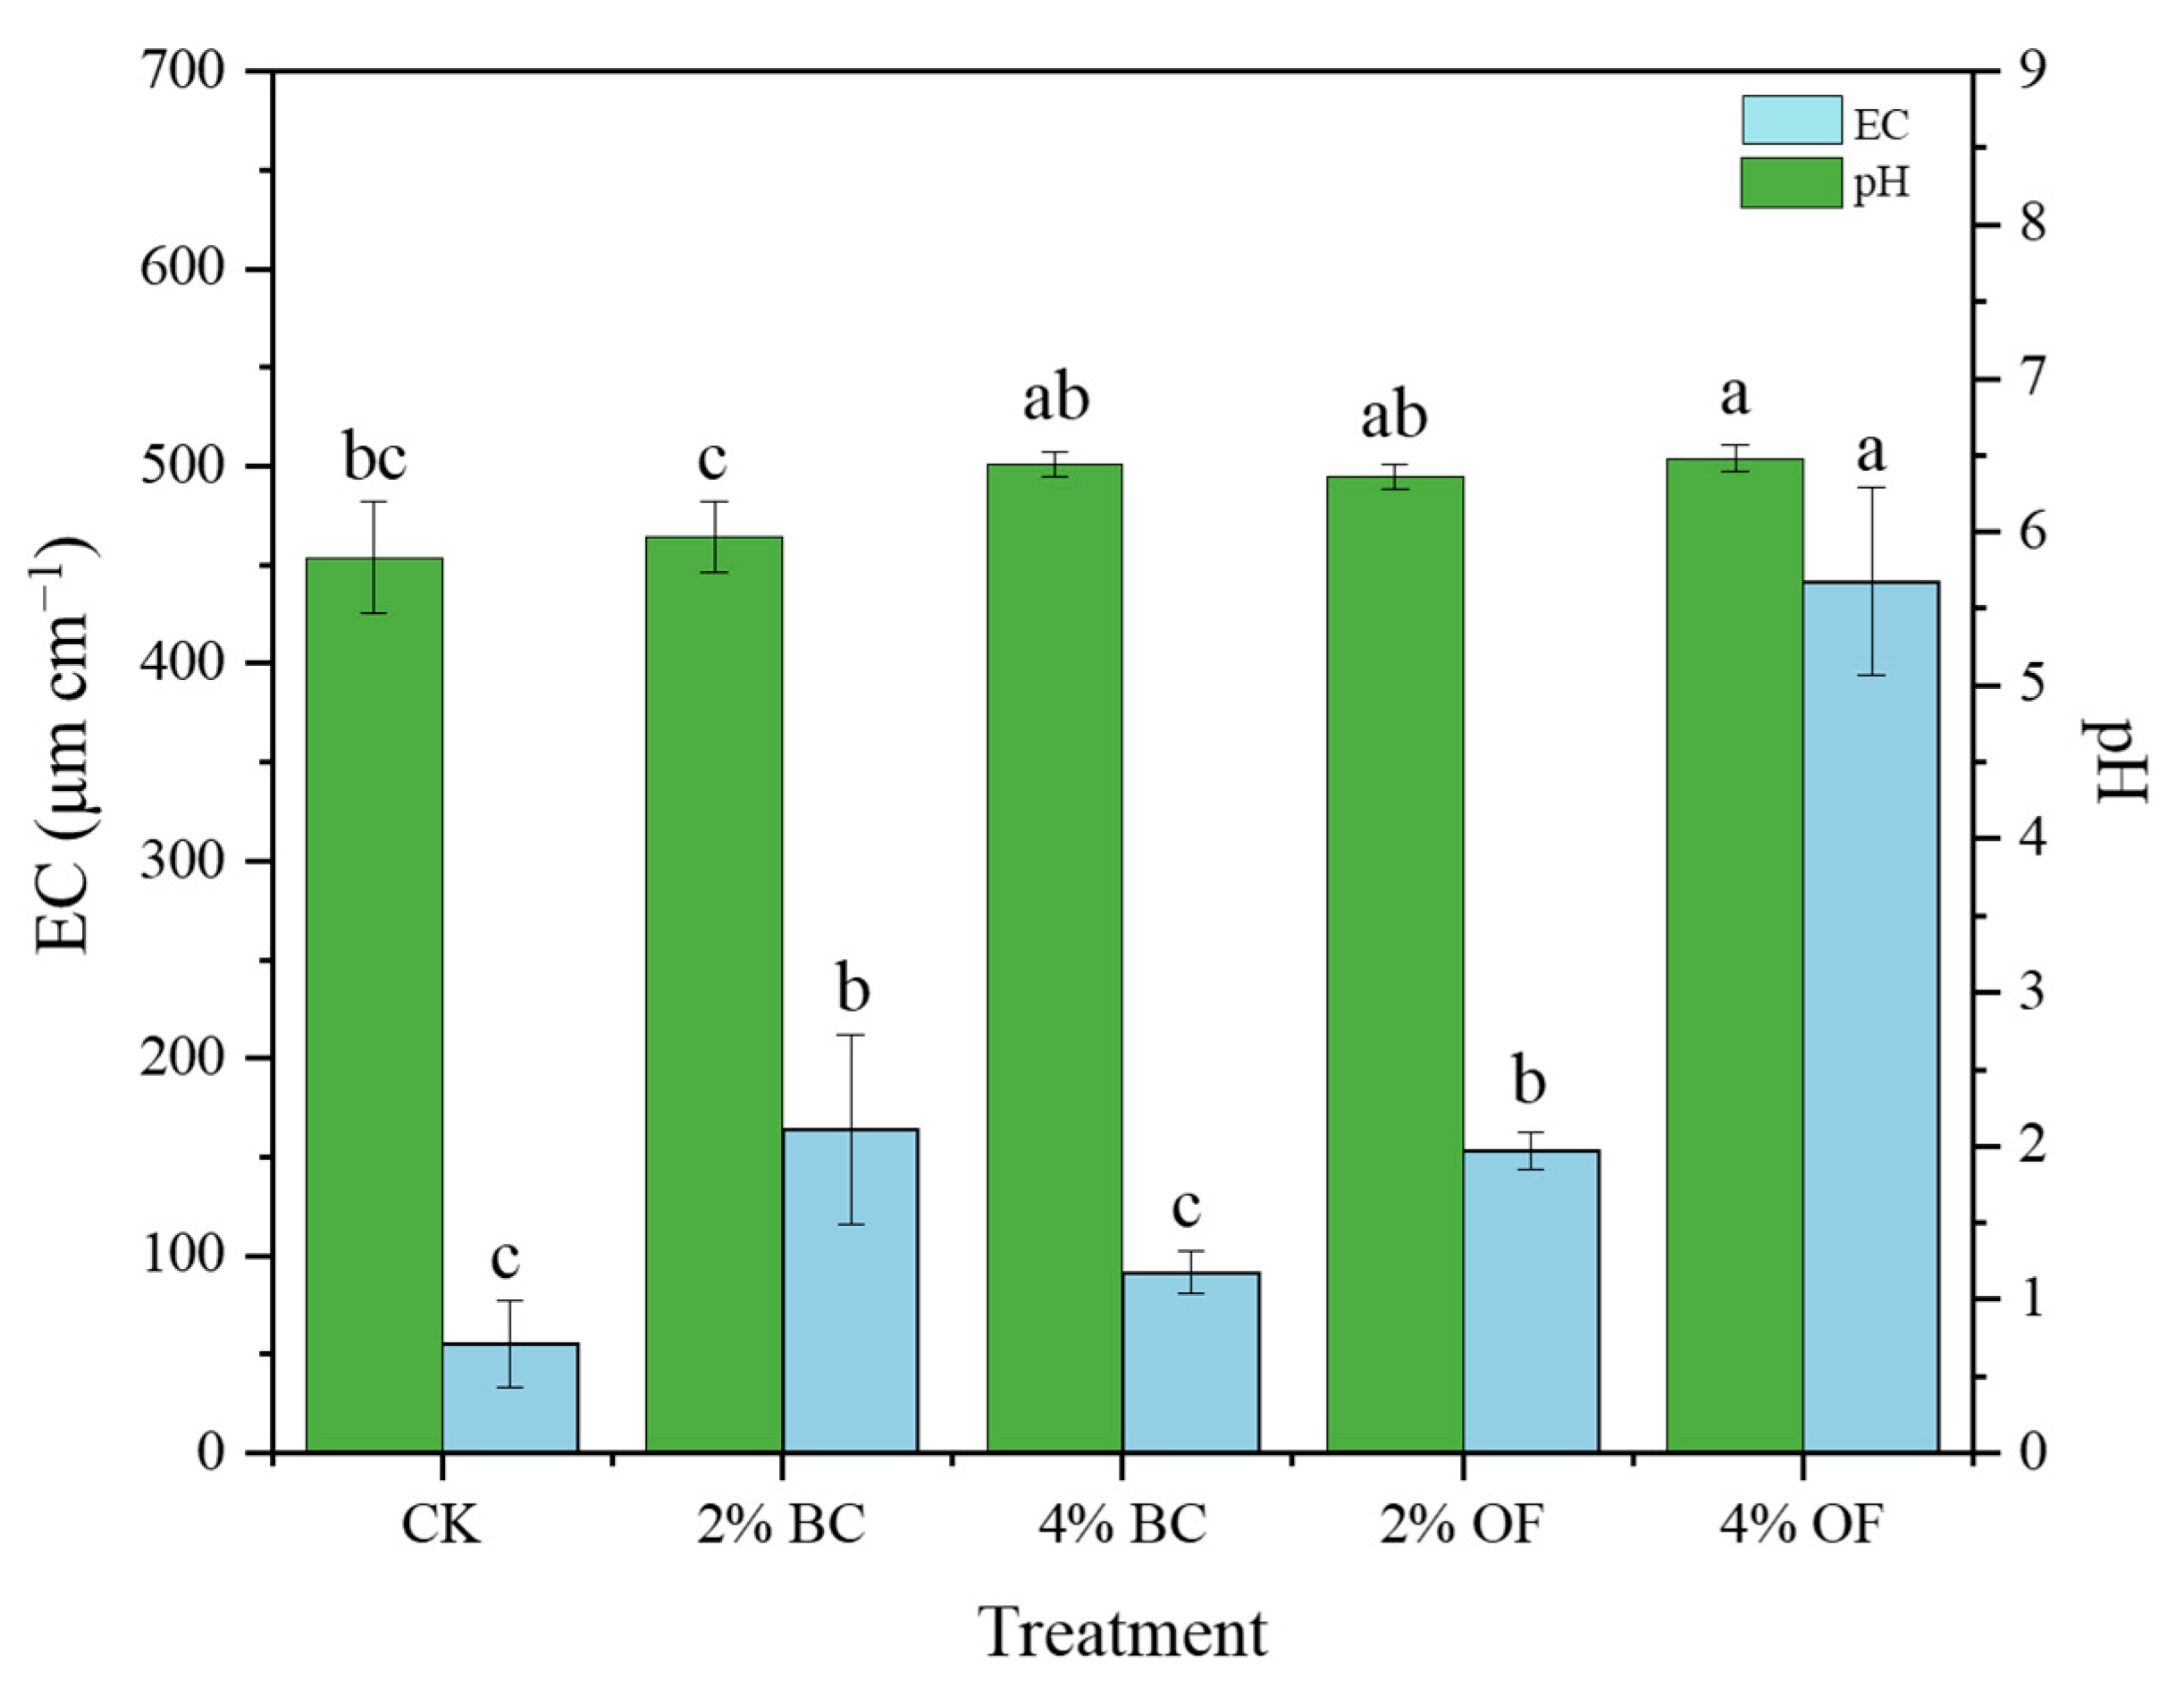
3.2. Soil Physicochemical Properties

The application of the biochar and organic fertilizer affected the soil properties, including physical properties such as the electrical conductivity (EC) and pH, as well as chemical properties such as the available phosphorus (AP), CaCl2-P, Al-P, Fe-P, Ca-P, NO3-N, and NH4+-N (Table 1, Figure 2). A comparison of the mean values showed that the biochar and organic fertilizer significantly increased the soil EC and pH (Figure 2) ( p < 0.05 ). The change in the soil pH values was not significant (5.42–6.55), but compared to the control group, both the biochar and organic fertilizer groups showed a slight increase in pH, and the pH values increased with the concentration of biochar and organic fertilizer. However, in terms of the soil EC values, the 4% BC was lower than the 2% BC. Nevertheless, compared to the control group, the experimental groups had significantly increased EC values, particularly the 4% OF, which increased by 121.4% ( p < 0.05 ).
The effects of the biochar and organic fertilizer on soil-phosphorus-related indicators (AP, CaCl2-P, Al-P, Fe-P, and Ca-P) are shown in Table 1. Specifically, compared to the control group, the 2% BC, 2% OF, and 4% BC increased the soil AP content by 13.2%, 52.0%, and 50.1%, respectively, while the 4% BC showed inhibitory effects on the AP. Regarding the soil CaCl2-P, the biochar group exhibited a minor inhibitory effect, whereas the organic fertilizer group significantly enhanced the soil CaCl2-P content ( p < 0.05 ). Specifically, the application of the 2% OF led to an 86.5% increase while the 4% OF resulted in a substantial 255.3% increase. In the phosphorus fractionation system, there was no significant difference in the soil Al-P and Fe-P, but Ca-P showed a significant change, with the 2% BC, 4% BC, 2% OF, and 4% OF increasing the Ca-P content by 14.7%, 1.9%, 11.9%, and 90.6%, respectively ( p < 0.05 ). Among them, the 4% OF was distinctly better than the other treatments.
NO3-N and NH4+-N are two indicators of soil N, and the biochar and organic fertilizer groups showed significant differences in both (Table 1). Except for the 2% BC, which decreased by 22.8%, the 4% BC, 2% OF, and 4% OF increased the soil NO3-N content by 11.8%, 18.2%, and 21.8%, respectively. However, the soil NH4+-N content in each experimental group was significantly increased, especially in the 2% OF and 4% OF, which increased by 145.3% and 454.7%, respectively ( p < 0.05 ).

3.3. Analysis of Enzymes Present in the Soil

The application of biochar and organic fertilizer markedly affected the activities of soil enzymes including invertase (INV), catalase (CAT), β-glucosidase (β-GC), acid phosphatase (ACP), and alkaline phosphatase (ALP) (Table 2). The INV activity and CAT activity showed no significant differences while the application of the biochar and organic fertilizer slightly increased the INV activity in the soil. However, the effect of the biochar on the CAT activity was not significant, and the CAT activity in the organic fertilizer group increased by 5.9% compared to the control. Compared to the control group, the application of the 2% OF and 4% OF significantly increased the activity of β-GC (8.7% and 46.4%, respectively) ( p < 0.05 ). In contrast, the application of the biochar reduced the activity of β-GC. All the treatments showed a significant decrease in ACP activity, and the biochar did not affect the soil ALP activity while the organic fertilizer increased the ALP activity.

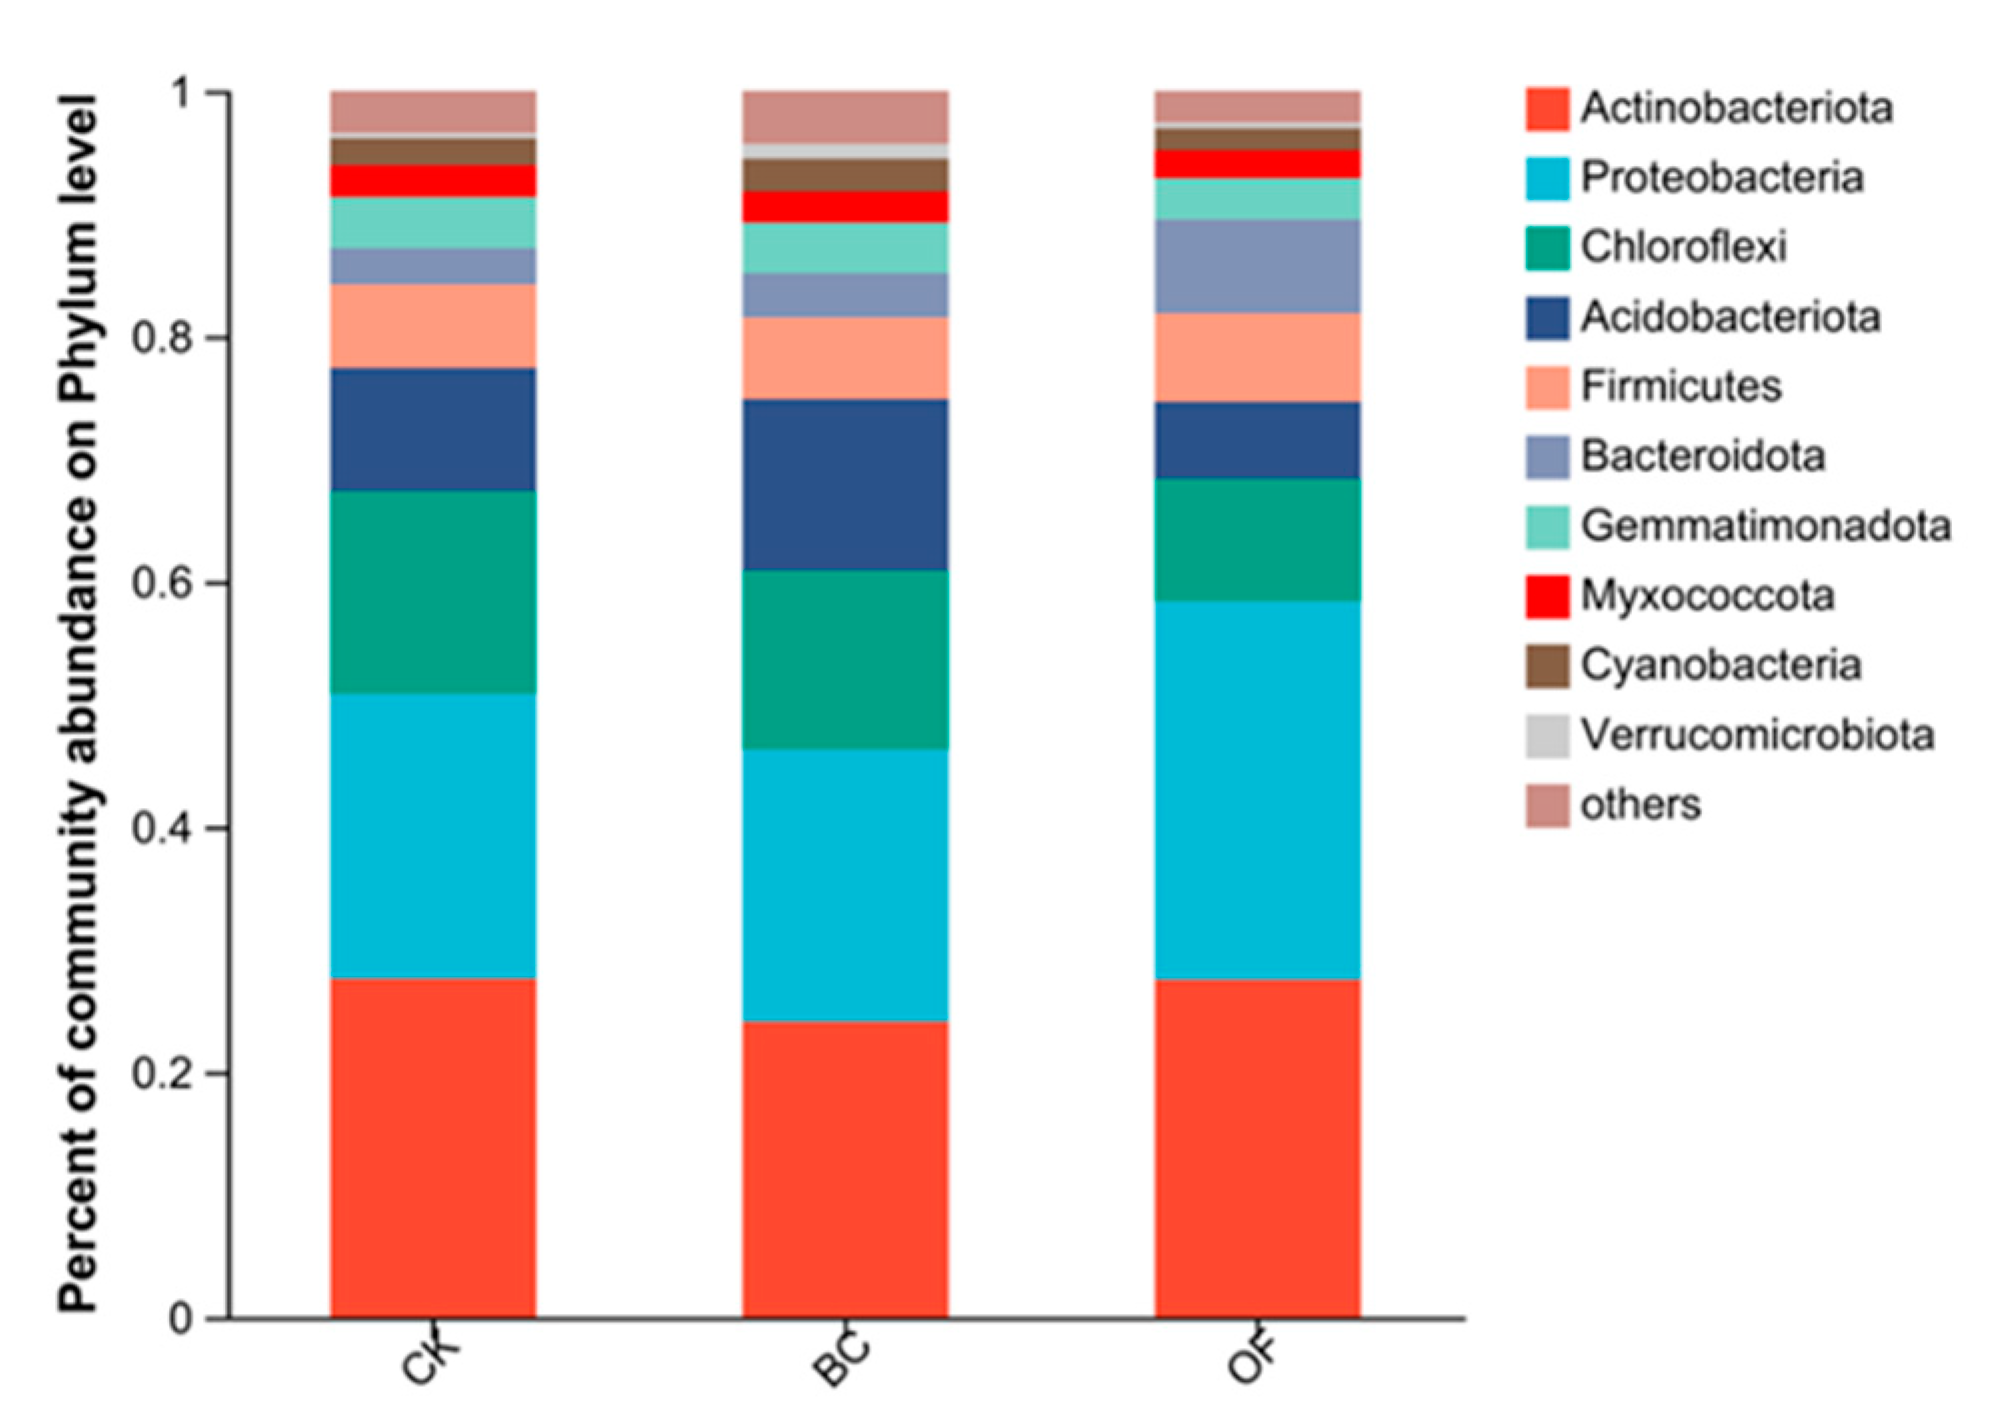
3.4. Analysis of Soil Bacterial Diversity

A total of nine samples were analyzed for diversity data, yielding optimized sequences of 351,617 reads, 146,087,007 bases, and an average sequence length of 415 bp. The composition of the bacterial communities shows the 10 most abundant phyla (with a relative abundance > 1% of the total reads) (Figure 3). Minor phyla (with relative abundances < 1%) were pooled together. Actinobacteriota, Proteobacteria, Chloroflexi, Acidobacteriota, Firmicutes, Bacteroidota, Gemmatimonadota, and Myxococcota are the dominant phyla, accounting for over 80% of the reads in each sample. Actinobacteriota and Proteobacteria were the most abundant phyla, comprising over 20% of the total microbial community composition in all soils.
As shown in Figure 4, a Kruskal–Wallis H test and one-way ANOVA were used to evaluate the significant differences in species abundance among bacterial communities of the three treatments. The results showed that there were significant differences in the species composition of the CK, BC, and OF at the phyla level (p < 0.05). The composition of dominant bacteria in the CK, BC, and OF was similar, with Actinobacteriota being the dominant bacteria. In comparison to the CK with an abundance of 27.6%, the percentage of Actinobacteriota in the BC decreased to 24.1% while it increased to 27.5% in the OF. Proteobacteria was the second dominant phylum with an abundance of 23.2%, 22.2%, and 30.8% in the CK, BC, and OF, respectively. Furthermore, Proteobacteria, Chloroflexi, Acidobacteriota, and Bacteroidota showed significant changes compared to the blank control (CK). The abundance of Proteobacteria, Chloroflexi, and Firmicutes slightly decreased in the BC treatment, while the abundance of Acidobacteriota increased by 4.0%. The abundance of Bacteroidota in the BC and OF increased from 3.0% to 3.6% and 7.7%, respectively.

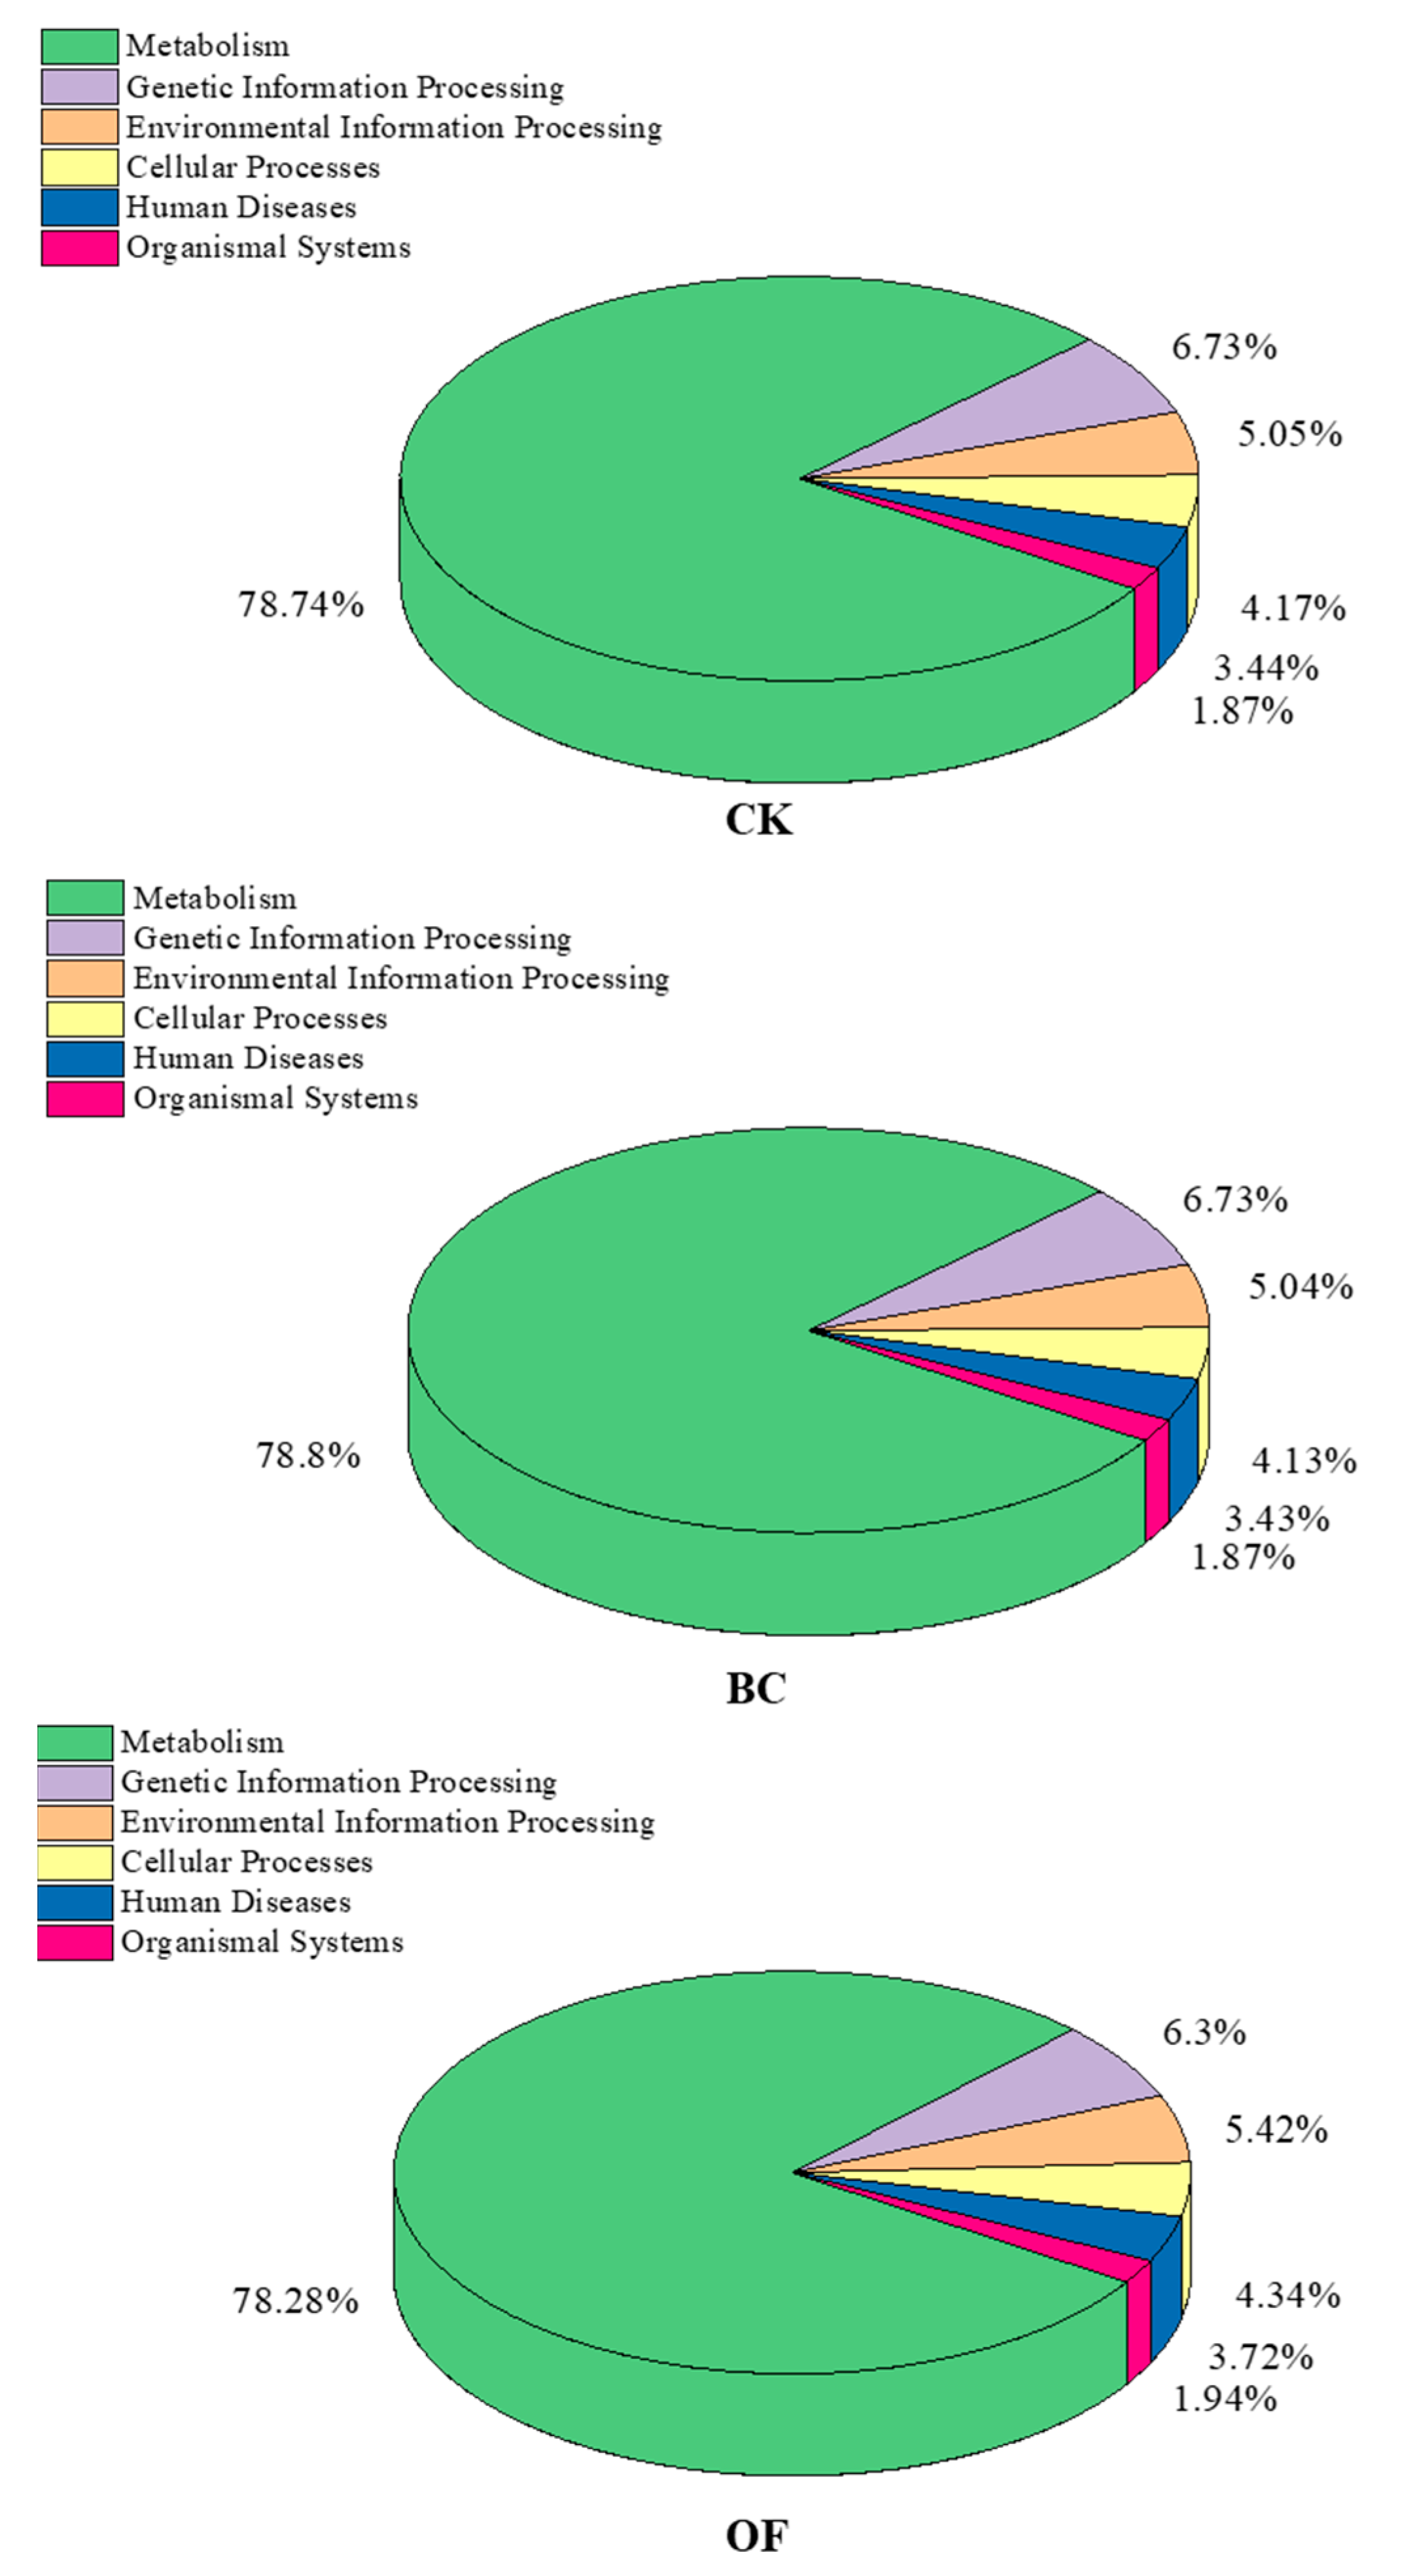
3.5. Functions of Bacterium

PICRUSt1 function prediction was used to annotate the COG and KEGG functions of the OTU, and the annotation information of the OTU at each functional level of the COG and KEGG and the abundance information of each function in different samples were obtained. A total of six functional genes of primary metabolic pathways were obtained, including the metabolism, genetic information processing, environmental information processing, cellular processes, human diseases, and organismal systems. Among them, the metabolism pathway in all three treatments was above 78% (Figure 5).
A total of 24 features and relative functional group abundances were annotated at the COG functional level (Figure 6). The top 10 relative functional group abundances and functional annotations of bacteria (relative abundance > 5%), including RNA processing and modification, chromatin structure and dynamics, energy production and conversion, amino acid transport, carbohydrate transport and metabolism, transcription, replication recombination and repair, cell wall/membrane/envelope biogenesis, inorganic ion transport, and metabolism. We conducted a general function prediction only, whereby the function was unknown, and we determined the signal transduction mechanisms and extracellular structures. There was no significant difference in the bacterial functional diversity among the three treatments ( p > 0.05 ).

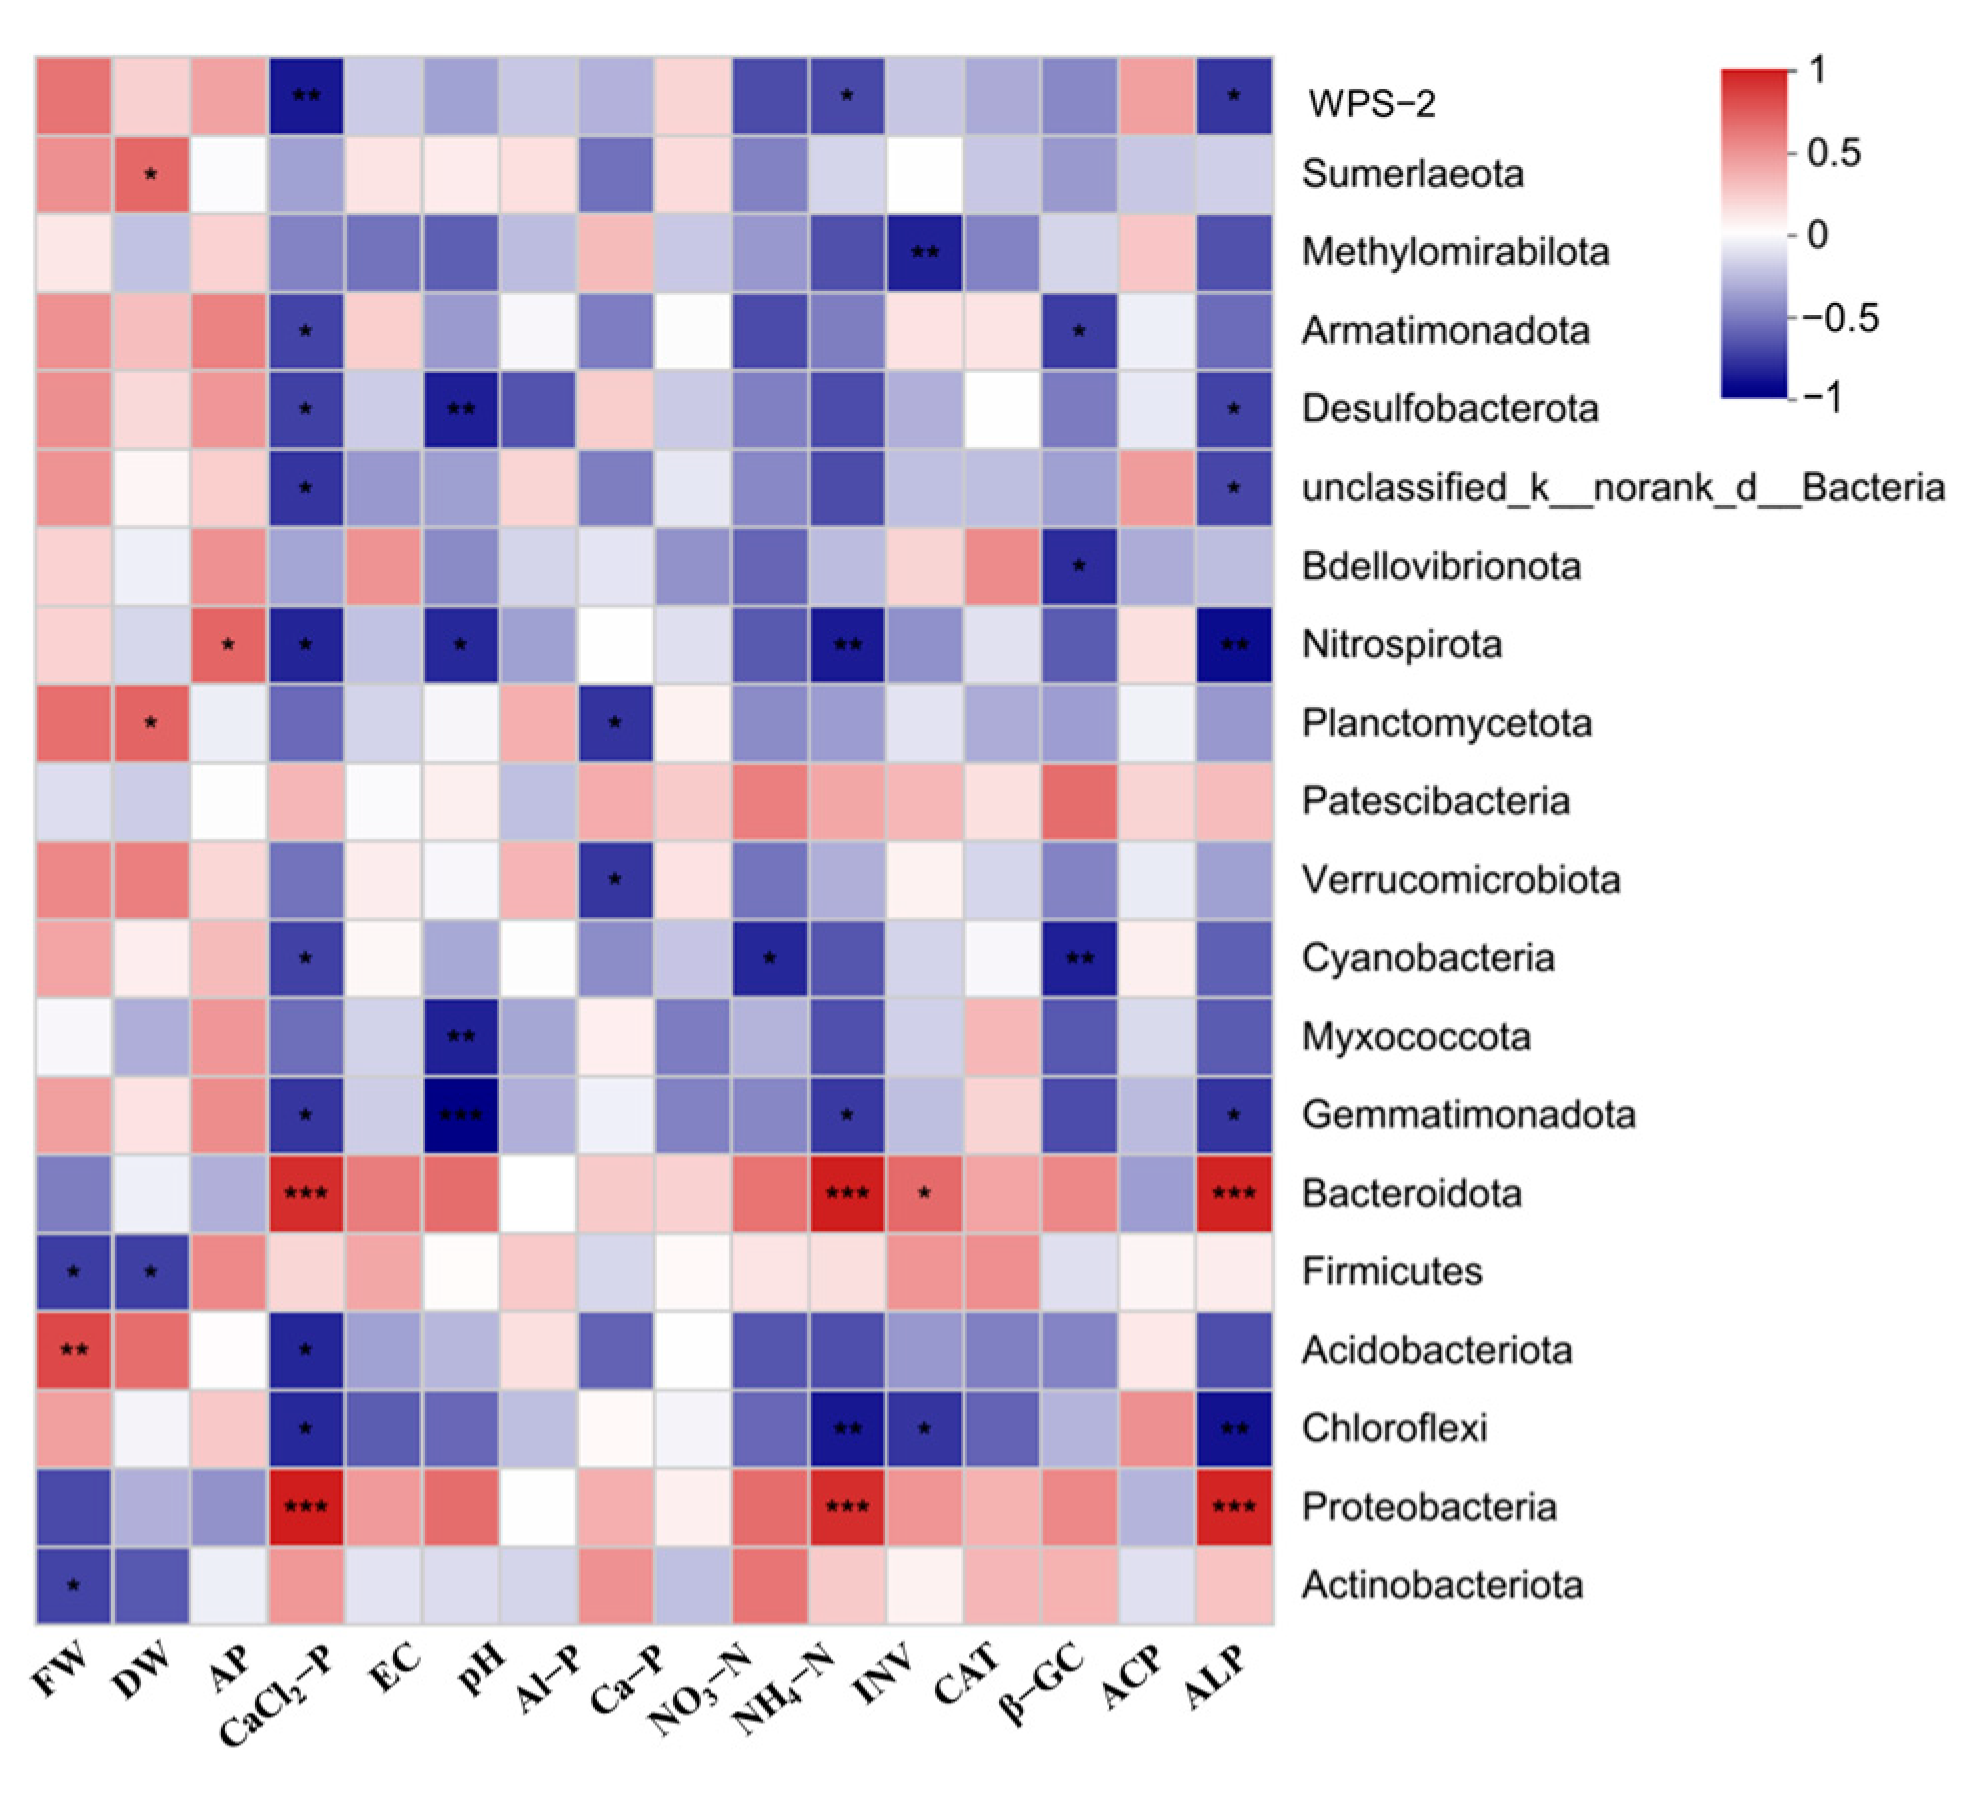
3.6. Relationships among Diverse Soil Physicochemical Properties

To further investigate the relationships among diverse environmental factors, the biomass, and soil microorganisms, a Pearson correlation heatmap was conducted. As shown in Figure 7, the dry weight was positively correlated with Sumerlaeota and Planctomycetota while it was negatively correlated with Firmicutes. It is noteworthy that CaCl2-P, ALP, and NH4+-N are all significantly positively correlated with Proteobacteria and Bacteroidota (p ≤ 0.001). The pH was significantly negatively correlated with Myxococcota, Gemmatimonadota, Nitrospirota, and Desulfobacterota ( p < 0.05 ). β-GC was significantly negatively correlated with Cyanobacteria, Bdellovibrionota, and Armatimonadota ( p < 0.05 ).
Several microbial abundance indices are used to assess species diversity and the number of unobserved species in an ecosystem. Chao and Ace indices estimate the number of unobserved species while the Sobs index considers only the observed species. The Shannon and Simpson indices measure species diversity in a community while the coverage index evaluates the sampling effort of a community. Except for the Simpson, Chao, and Sobs indices, the other indices were less significant ( p < 0.05 ). It is noteworthy that the Chao, Shannon, and Sobs indices of the 4% OF were significantly ( p < 0.05 ) lower than the control by 5.4%, 2.4%, and 6.9%, respectively (Table 3).
A redundancy analysis was used to find the critical (bio)factors influencing the soil microbe and plant growth. As shown in Figure 8, the dry weight was only positively correlated with phosphorus availability and soil acidic phosphatase while it was negatively correlated with the soil pH, EC, NH4+-N, catalase, glucose, and alkaline phosphatase.

4. Discussion

The results of the present study demonstrate that the 2% BC treatment resulted in a significant increase in both the plant height and stem diameter while the high-concentration biochar (4% BC) and organic fertilizer (2% OF and 4% OF) had negative effects on the plant height and dry weight; previous studies have separately reported the positive or negative effects of biochar and organic fertilizers on plant growth [43,44,45]. However, less research systematically compared their effects on P. giganteum growth and the corresponding mechanisms in terms of soil properties, critical enzyme activity, and soil microbes.

4.1. Soil Nutrients and Properties

The RDA results showed that the biomass of P. giganteum was positively correlated with AP and ACP and negatively correlated with pH, EC, and NH4+-N. Both biochar and organic fertilizer are inherently alkaline and contain calcium, magnesium, and potassium, which act as buffering agents. Therefore, they can neutralize soil acidity and increase the pH value. In the experimental group, the increase in the 2% BC was the smallest and the negative impact was the smallest. In addition, biochar and organic fertilizer release soluble salts into the soil solution, thereby increasing the EC of the soil. However, we observed that a high concentration of biochar (4%) decreased the EC compared to the low concentration of biochar (2%). This could be due to the formation of a physical barrier by the high concentration of biochar, reducing the contact between the soil and electrolyte solution and thereby lowering the EC. A study found that a high concentration of biochar reduced the EC of peat, and this is consistent with our findings [46]. Organic fertilizers can contribute to an increase in soil salinity, leading to a higher EC [47,48]. In acidic soils, the salt content of the organic fertilizer can become more concentrated, leading to salt stress in plants and reduced growth [49]. The best soil EC in the P. giganteum seedling stage was around 100 μs cm−1, meaning the increased soil EC induced by the OF could lead to salt stress [50,51]. The inhibitory effects of the 4% BC on the AP and CaCl2-P suggest that the higher amount of biochar can result in their immobilization and reduced nutrient (N and P) availability for plants (Table 1). The significant increase in NH4+-N content in the experimental groups indicates that the application of BC and OF can both increase soil nitrogen availability [52,53]. This finding is consistent with previous studies that have reported an increase in soil nitrogen content following the application of biochar and organic fertilizer [54,55].

4.2. Soil Microbial Abundance and Enzyme Acclivity

The current study found that BC addition can increase the soil microbial abundance while decreasing the soil microbial abundance in OF treatments. On one hand, BC has a high surface area and a porous structure, which provides a habitat for microorganisms to thrive. The porous structure of BC also helps to improve the water-holding capacity of the soil, which can provide a more favorable environment and nutrients for soil bacteria to grow [13]. For another, when OF is added to soil, it can introduce new bacteria that compete with the existing bacterial population for resources. If the new bacteria are better adapted to the conditions in the soil, they may outcompete the existing bacteria and reduce their abundance [56] (Table 3).
Organic fertilizers are rich in organic compounds, such as nitrogen, phosphorus, and carbon, which serve as essential nutrients for soil microorganisms. Soil microbes and soil enzyme activity are closely related as the availability of nutrients from organic fertilizers promotes the growth and activity of soil microorganisms, thereby increasing enzyme production [57]. Organic fertilizers have been used to increase soil enzyme activity, including INV, CAT, β-GC, and ALP, to a greater extent compared to biochar (Table 2). Biochar, although beneficial for soil health and nutrient retention, may have a more limited impact on soil enzyme activities. The porous structure and high carbon content of biochar can provide a habitat for soil microorganisms [58], but its surface area may be less conducive to enzyme–substrate interactions compared to the organic compounds present in organic fertilizers. Furthermore, the decrease in the P. giganteum yield caused by the 4% BC may be due to the decrease in the soil CAT, β-GC, and ACP activities, resulting in the change in the microbial community structure or function.

4.3. Soil Microbe Community and Result Implications

Actinobacteriota and Proteobacteria are the most abundant phyla in soils, making up over 20% of the microbial community (Figure 4). The dominance of Bacteroidota differs significantly from the blank control, meaning that the Bacteroidota community can be an important indicator of soil quality in studies of soil biological degradation processes [59]. The application of organic fertilizer (OF) increases the abundance of Bacteroidota, leading to improved soil nutrients (Table 2). Additionally, previous studies have reported that the application of organic fertilizers can increase the abundance of Acidobacteriota and Bacteroidota [60]. The results of this study show that the use of OF can enhance bacterial community diversity in soil, which is consistent with previous reports on the dominant phyla in soil (including Actinobacteriota and Proteobacteria) [61]. Proteobacteria is a common pathogenic bacteria that can colonize plants and cause disease symptoms [62]. However, the application of biochar (BC) decreased the abundance of Proteobacteria while the application of OF increased their abundance (Figure 3). Meanwhile, the abundance of Gemmatimonadota decreased with the OF application while it increased with the BC application. Gemmatimonadota is typically characterized as a copiotrophic member, which can increase soil nutrients and promote plant growth [63]. However, the impact of BC on soil bacterial communities is still under debate as some studies have reported an increase in the abundance of Actinobacteriota and other beneficial bacteria with BC applications while others have reported a decrease in actinobacterial abundance [64]. In summary, the inhibition of P. giganteum growth in the OF group may be due to an increase in pathogenic bacteria and a decrease in probiotic bacteria.
The Pearson correlation heatmap revealed that different soil microbial groups responded differently to environmental factors. For instance, Vicinamibacteraceae was positively correlated with dry weight, while Nocardioides and Mycobacterium were negatively correlated. Furthermore, the abundance of Bradyrhizobium, Micromonospora, Ramlibacter, Microvirga, Massilia, Arthrobacter, Flavisolibacter, and Gemmatimonadaceae was correlated with various soil physicochemical properties, such as CaCl2-P, NH4+-N, and ALP. In addition, the increase in the Ace, Chao, Shannon, and Sobs indices after the application of the BC (Table 3) suggests an increase in the microbial species composition, whereas after the application of the OF, the richness of the microorganisms decreased. This may also be a contributing factor to the decreased yield of P. giganteum. These findings suggest that soil physicochemical properties play a crucial role in shaping the soil microbial community and their function, which in turn affects the growth and yield of P. giganteum.
A PICRUSt1 analysis revealed that the bacterial communities in the OF treatment exhibited an increase in carbohydrate transport and metabolism, as well as transcription, but a decrease in the cell membrane and signal transduction mechanisms, compared to those in the BC treatment. In contrast, the functionality of the cell membrane was increased in the BC treatment while the signal transduction mechanism was lower than that in the CK and OF treatments. However, the differences in the functional predictions among the treatments based on PICRUSt1 were not significant in our study (Figure 6). Several factors may have contributed to this result. Firstly, longer-term treatments may be needed to allow soil microbial communities to adapt to the new conditions [17,65,66,67,68]. Secondly, the baseline soil microbial communities may already be adapted to the acidic soil environment and may be able to survive and reproduce in it [69]. Additionally, the measurement methods employed may have limitations as the current technology is still limited in its ability to accurately measure the complexity and diversity of soil microbial communities [70].
The RDA analysis results (Figure 8) indicated a positive correlation between the P. giganteum biomass and the AP and ACP. In other words, ACP (produced by plants or microorganisms) may participate in the absorption process of the AP, which is consistent with previous research findings [71,72]. Bacteria associated with ACP production, including Actinobacteria, Pseudomonas, and Bacillus, play a crucial role in the mineralization and cycling of organic phosphorus in soil, thereby influencing the availability of phosphorus for plant uptake [73,74,75]. These bacteria contribute to the release of inorganic phosphate (Pi) from organic phosphorus compounds, making it accessible to plants [76].

5. Conclusions

Apparently, compared with the CK, the 2% BC had a positive effect on the growth of P. giganteum, notably reflected in a remarkable 41.7% increase in the dry weight. In contrast, elevated concentrations of biochar (4% BC) and organic fertilizer (2% and 4%) exhibited detrimental impacts on the growth of P. giganteum. The increase in the soil pH, EC, and nutrient availability (P and N) suggests that both BC and OF can improve soil fertility. The RDA results showed that the inhibition of P. giganteum growth after applying the 4% BC can be attributed to the lower AP and CaCl2-P levels, as well as the reduced soil enzyme activity. The organic fertilizer significantly increased the β-GC activity by 8.7% (2% OF) and 46.4% (4% OF) while the biochar had a limited impact on enzyme activities. However, the adverse impact of the OF on crop yield may be associated with an increased EC (121.4%), higher abundance of soil-borne pathogens, and decreased presence of beneficial microorganisms. The BC application enhanced the soil bacterial community diversity and abundance, whereas the OF had the opposite effect. In summary, both biochar and organic fertilizers have significant potential for improving soil quality. However, achieving the optimal crop quality and yield requires fine tuning the application rates and methods based on specific circumstances. Further optimization and investigation are needed to understand the complex interaction between application strategies, soil characteristics, and crop responses.

Author Contributions

Data collection and calculation, X.L., H.L. and B.Z. (Bangxi Zhang); investigation, W.L. and J.W.; methodology, B.Z. (Bangxi Zhang) and Y.P.; supervision, H.C., Y.P. and Y.Z.; writing—original draft, X.L., T.F. and B.Z. (Baige Zhang); writing—review and editing, R.Y., B.C., T.F., Y.P., X.H., H.L., Q.Z., X.W., Y.Z., W.L., J.W. and B.Z. (Baige Zhang); revised manuscript, H.C. All authors have read and agreed to the published version of the manuscript.

Funding

This research was funded by This research was funded by Guizhou Provincial Major Scientific and Technological Program ([2019]3006-4, [2023]078), and National Natural Science Foundation of China (42207015).

Institutional Review Board Statement

Not applicable.

Informed Consent Statement

Not applicable.

Data Availability Statement

Not applicable.

Conflicts of Interest

The authors declare no conflict of interest.

References

  1. Yin, M.; Li, X.; Liu, Q.; Tang, F. Rice husk ash addition to acid red soil improves the soil property and cotton seedling growth. Sci. Rep. 2022, 12, 1704. [Google Scholar] [CrossRef]
  2. Nguyen, B.T.; Le, L.B.; Pham, L.P.; Nguyen, H.T.; Tran, T.D.; Van Thai, N. The effects of biochar on the biomass yield of elephant grass (Pennisetum Purpureum Schumach) and properties of acidic soils. Ind. Crops Prod. 2021, 161, 113224. [Google Scholar] [CrossRef]
  3. Baligar, V.; Fageria, N.; Eswaran, H.; Wilson, M.; He, Z. Nature and properties of red soils of the world. In The Red Soils of China: Their Nature, Management and Utilization; Springer: Berlin/Heidelberg, Germany, 2004; pp. 7–27. [Google Scholar]
  4. Gong, X.; Liu, Y.; Li, Q.; Wei, X.; Guo, X.; Niu, D.; Zhang, W.; Zhang, J.; Zhang, L. Sub-tropic degraded red soil restoration: Is soil organic carbon build-up limited by nutrients supply. For. Ecol. Manag. 2013, 300, 77–87. [Google Scholar] [CrossRef]
  5. Zhang, H.-M.; Bo-Ren, W.; Ming-Gang, X.; Ting-Lu, F. Crop yield and soil responses to long-term fertilization on a red soil in southern China. Pedosphere 2009, 19, 199–207. [Google Scholar] [CrossRef]
  6. Li, P.; Wu, M.; Kang, G.; Zhu, B.; Li, H.; Hu, F.; Jiao, J. Soil quality response to organic amendments on dryland red soil in subtropical China. Geoderma 2020, 373, 114416. [Google Scholar] [CrossRef]
  7. Chen, L.; Li, X.; Peng, Y.; Xiang, P.; Zhou, Y.; Yao, B.; Zhou, Y.; Sun, C. Co-application of biochar and organic fertilizer promotes the yield and quality of red pitaya (Hylocereus polyrhizus) by improving soil properties. Chemosphere 2022, 294, 133619. [Google Scholar] [CrossRef]
  8. Zhang, Y.; Yan, J.; Rong, X.; Han, Y.; Yang, Z.; Hou, K.; Zhao, H.; Hu, W. Responses of maize yield, nitrogen and phosphorus runoff losses and soil properties to biochar and organic fertilizer application in a light-loamy fluvo-aquic soil. Agric. Ecosyst. Environ. 2021, 314, 107433. [Google Scholar] [CrossRef]
  9. Yu, H.; Zou, W.; Chen, J.; Chen, H.; Yu, Z.; Huang, J.; Tang, H.; Wei, X.; Gao, B. Biochar amendment improves crop production in problem soils: A review. J. Environ. Manag. 2019, 232, 8–21. [Google Scholar] [CrossRef]
  10. Nsubuga, D.; Kabenge, I.; Zziwa, A.; Yiga, V.A.; Mpendo, Y.; Harbert, M.; Kizza, R.; Banadda, N.; Wydra, K.D. Optimization of adsorbent dose and contact time for the production of jackfruit waste nutrient-enriched biochar. Waste Dispos. Sustain. Energy 2023, 5, 63–74. [Google Scholar] [CrossRef]
  11. Abukari, A.; Kaba, J.S.; Dawoe, E.; Abunyewa, A.A. A comprehensive review of the effects of biochar on soil physicochemical properties and crop productivity. Waste Dispos. Sustain. Energy 2022, 4, 343–359. [Google Scholar] [CrossRef]
  12. Are, K.S. Biochar and soil physical health. In An Imperative Amendment for Soil and the Environment; InTech Open: London, UK, 2019; pp. 21–33. [Google Scholar]
  13. Adhikari, S.; Timms, W.; Mahmud, M.P. Optimising water holding capacity and hydrophobicity of biochar for soil amendment–A review. Sci. Total Environ. 2022, 851, 158043. [Google Scholar] [CrossRef] [PubMed]
  14. Xue, P.; Fu, Q.; Li, T.; Liu, D.; Hou, R.; Li, Q.; Li, M.; Meng, F. Effects of biochar and straw application on the soil structure and water-holding and gas transport capacities in seasonally frozen soil areas. J. Environ. Manag. 2022, 301, 113943. [Google Scholar] [CrossRef] [PubMed]
  15. Lopes, É.M.G.; Reis, M.M.; Frazão, L.A.; da Mata Terra, L.E.; Lopes, E.F.; dos Santos, M.M.; Fernandes, L.A. Biochar increases enzyme activity and total microbial quality of soil grown with sugarcane. Environ. Technol. Innov. 2021, 21, 101270. [Google Scholar] [CrossRef]
  16. Palansooriya, K.N.; Wong, J.T.F.; Hashimoto, Y.; Huang, L.; Rinklebe, J.; Chang, S.X.; Bolan, N.; Wang, H.; Ok, Y.S. Response of microbial communities to biochar-amended soils: A critical review. Biochar 2019, 1, 3–22. [Google Scholar] [CrossRef]
  17. Gul, S.; Whalen, J.K.; Thomas, B.W.; Sachdeva, V.; Deng, H. Physico-chemical properties and microbial responses in biochar-amended soils: Mechanisms and future directions. Agric. Ecosyst. Environ. 2015, 206, 46–59. [Google Scholar] [CrossRef]
  18. Warnock, D.D.; Lehmann, J.; Kuyper, T.W.; Rillig, M.C. Mycorrhizal responses to biochar in soil—Concepts and mechanisms. Plant Soil 2007, 300, 9–20. [Google Scholar] [CrossRef]
  19. Noyce, G.L.; Jones, T.; Fulthorpe, R.; Basiliko, N. Phosphorus uptake and availability and short-term seedling growth in three Ontario soils amended with ash and biochar. Can. J. Soil Sci. 2017, 97, 678–691. [Google Scholar] [CrossRef]
  20. Du, T.; Hu, Q.; He, H.; Mao, W.; Yang, Z.; Chen, H.; Sun, L.; Zhai, M. Long-term organic fertilizer and biofertilizer application strengthens the associations between soil quality index, network complexity, and walnut yield. Eur. J. Soil Biol. 2023, 116, 103492. [Google Scholar] [CrossRef]
  21. Xiao, Q.; He, B.; Wang, S. Effect of the Different Fertilization Treatments Application on Paddy Soil Enzyme Activities and Bacterial Community Composition. Agronomy 2023, 13, 712. [Google Scholar] [CrossRef]
  22. Rubagumya, I.; Komakech, A.J.; Kabenge, I.; Kiggundu, N. Potential of organic waste to energy and bio-fertilizer production in Sub-Saharan Africa: A review. In Waste Disposal & Sustainable Energy; Springer: Berlin/Heidelberg, Germany, 2023. [Google Scholar] [CrossRef]
  23. Shah, M.N.; Wright, D.L.; Hussain, S.; Koutroubas, S.D.; Seepaul, R.; George, S.; Ali, S.; Naveed, M.; Khan, M.; Altaf, M.T. Organic fertilizer sources improve the yield and quality attributes of maize (Zea mays L.) hybrids by improving soil properties and nutrient uptake under drought stress. J. King Saud Univ. Sci. 2023, 35, 102570. [Google Scholar] [CrossRef]
  24. Bondarenko, A.; Kachanova, L.; Chelbin, S. Formation of an organisational and technological mechanism for the development of the fertiliser market in the Russian Federation. In E3S Web of Conferences; EDP Sciences: Ulys, France, 2023. [Google Scholar]
  25. Sharma, A.; Chetani, R. A review on the effect of organic and chemical fertilizers on plants. Int. J. Res. Appl. Sci. Eng. Technol. 2017, 5, 677–680. [Google Scholar] [CrossRef]
  26. Singh, T.B.; Ali, A.; Prasad, M.; Yadav, A.; Shrivastav, P.; Goyal, D.; Dantu, P.K. Role of organic fertilizers in improving soil fertility. In Contaminants in Agriculture; Springer: Berlin/Heidelberg, Germany, 2020; pp. 61–77. [Google Scholar] [CrossRef]
  27. Vengadaramana, A.; Jashothan, P.T.J. Effect of organic fertilizers on the water holding capacity of soil in different terrains of Jaffna peninsula in Sri Lanka. Sch. Res. Libr. 2021, 2, 500–503. [Google Scholar]
  28. Cooperband, L.; Bollero, G.; Coale, F. Effect of poultry litter and composts on soil nitrogen and phosphorus availability and corn production. Nutr. Cycl. Agroecosyst. 2002, 62, 185–194. [Google Scholar] [CrossRef]
  29. Jia, Y.; Liao, Z.; Chew, H.; Wang, L.; Lin, B.; Chen, C.; Lu, G.; Lin, Z. Effect of Pennisetum giganteum zx lin mixed nitrogen-fixing bacterial fertilizer on the growth, quality, soil fertility and bacterial community of pakchoi (Brassica chinensis L.). PLoS ONE 2020, 15, e0228709. [Google Scholar] [CrossRef]
  30. Zhao, J.; Jing, Z.-D.; Yin, X.-J.; Li, J.-F.; Dong, Z.-H.; Wang, S.-R.; Shao, T. Sustainable utilization of residual grass: Effect of anaerobic storage days on chemical composition, fermentation performance, microbial community, and functional profiles of Pennisetum giganteum. In Environmental Science and Pollution Research; Springer: Berlin/Heidelberg, Germany, 2023. [Google Scholar] [CrossRef]
  31. Zhu, S.; Zhang, Q.; Yang, R.; Zhang, B.; Yang, Z.; Chen, X.; Wang, X.; Du, M.; Tang, L. Typical JUNCAO Overwintering Performance and Optimized Cultivation Conditions of Pennisetum sp. in Guizhou, Southwest China. Sustainability 2022, 14, 4086. [Google Scholar] [CrossRef]
  32. Qiao-Hong, Z.; Xin-Hua, P.; Huang, T.-Q.; Zu-Bin, X.; Holden, N. Effect of biochar addition on maize growth and nitrogen use efficiency in acidic red soils. Pedosphere 2014, 24, 699–708. [Google Scholar]
  33. Raza, M.A.; Feng, L.Y.; van der Werf, W.; Iqbal, N.; Khalid, M.H.B.; Chen, Y.K.; Wasaya, A.; Ahmed, S.; Ud Din, A.M.; Khan, A.; et al. Maize leaf-removal: A new agronomic approach to increase dry matter, flower number and seed-yield of soybean in maize soybean relay intercropping system. Sci. Rep. 2019, 9, 13453. [Google Scholar] [CrossRef]
  34. Wang, S.; Sun, L.; Ling, N.; Zhu, C.; Chi, F.; Li, W.; Hao, X.; Zhang, W.; Bian, J.; Chen, L. Exploring soil factors determining composition and structure of the bacterial communities in saline-alkali soils of Songnen Plain. Front. Microbiol. 2020, 10, 2902. [Google Scholar] [CrossRef]
  35. Jiang, B.; Gu, Y. A suggested fractionation scheme of inorganic phosphorus in calcareous soils. Fertil. Res. 1989, 20, 159–165. [Google Scholar] [CrossRef]
  36. Zhang, H.; Kovar, J.L. Phosphorus fractionation. In Methods of Phosphorus Analysis for Soils, Sediments, Residuals, Waters; North Carolina State University: Manhattan, KS, USA, 2000; p. 50. [Google Scholar]
  37. Moir, J.; Tiessen, H. Characterization of Available P by Sequential Extraction; Lewis Publishers: Boca Rato, FL, USA, 2007; p. 14. [Google Scholar]
  38. Sparks, D.L.; Page, A.L.; Helmke, P.A.; Loeppert, R.H. Methods of Soil Analysis, Part 3: Chemical Methods; John Wiley & Sons: Hoboken, NJ, USA, 2020; Volume 14. [Google Scholar]
  39. Sánchez-Alcalá, I.; Del Campillo, M.; Torrent, J. Extraction with 0.01 M CaCl2 underestimates the concentration of phosphorus in the soil solution. Soil Use Manag. 2014, 30, 297–302. [Google Scholar] [CrossRef]
  40. Zhu, Y.; Guo, B.; Liu, C.; Lin, Y.; Fu, Q.; Li, N.; Li, H. Soil fertility, enzyme activity, and microbial community structure diversity among different soil textures under different land use types in coastal saline soil. J. Soils Sediments 2021, 21, 2240–2252. [Google Scholar] [CrossRef]
  41. Hayano, K. A method for the determination of β-glucosidase activity in soil. Soil Sci. Plant Nutr. 1973, 19, 103–108. [Google Scholar] [CrossRef]
  42. Aguilar-Chávez, Á.; Díaz-Rojas, M.; del Rosario Cárdenas-Aquino, M.; Dendooven, L.; Luna-Guido, M. Greenhouse gas emissions from a wastewater sludge-amended soil cultivated with wheat (Triticum spp. L.) as affected by different application rates of charcoal. Soil Biol. Biochem. 2012, 52, 90–95. [Google Scholar] [CrossRef]
  43. Schulz, H.; Glaser, B. Effects of biochar compared to organic and inorganic fertilizers on soil quality and plant growth in a greenhouse experiment. J. Plant Nutr. Soil Sci. 2012, 175, 410–422. [Google Scholar] [CrossRef]
  44. Agegnehu, G.; Bird, M.I.; Nelson, P.N.; Bass, A.M. The ameliorating effects of biochar and compost on soil quality and plant growth on a Ferralsol. Soil Res. 2015, 53, 1–12. [Google Scholar] [CrossRef]
  45. Carter, S.; Shackley, S.; Sohi, S.; Suy, T.B.; Haefele, S. The impact of biochar application on soil properties and plant growth of pot grown lettuce (Lactuca sativa) and cabbage (Brassica chinensis). Agronomy 2013, 3, 404–418. [Google Scholar] [CrossRef]
  46. Prasad, M.; Tzortzakis, N.; McDaniel, N. Chemical characterization of biochar and assessment of the nutrient dynamics by means of preliminary plant growth tests. J. Environ. Manag. 2018, 216, 89–95. [Google Scholar] [CrossRef]
  47. Mohammadifar, A.; Gholami, H.; Golzari, S.; Collins, A.L. Spatial modelling of soil salinity: Deep or shallow learning models? Environ. Sci. Pollut. Res. 2021, 28, 39432–39450. [Google Scholar] [CrossRef]
  48. Han, J.; Dong, Y.; Zhang, M. Chemical fertilizer reduction with organic fertilizer effectively improve soil fertility and microbial community from newly cultivated land in the Loess Plateau of China. Appl. Soil Ecol. 2021, 165, 103966. [Google Scholar] [CrossRef]
  49. Wu, L.; Jiang, Y.; Zhao, F.; He, X.; Liu, H.; Yu, K. Increased organic fertilizer application and reduced chemical fertilizer application affect the soil properties and bacterial communities of grape rhizosphere soil. Sci. Rep. 2020, 10, 9568. [Google Scholar] [CrossRef]
  50. Abel, S.; Peters, A.; Trinks, S.; Schonsky, H.; Facklam, M.; Wessolek, G. Impact of biochar and hydrochar addition on water retention and water repellency of sandy soil. Geoderma 2013, 202, 183–191. [Google Scholar] [CrossRef]
  51. Asai, H.; Samson, B.K.; Stephan, H.M.; Songyikhangsuthor, K.; Homma, K.; Kiyono, Y.; Inoue, Y.; Shiraiwa, T.; Horie, T. Biochar amendment techniques for upland rice production in Northern Laos: 1. Soil physical properties, leaf SPAD and grain yield. Field Crops Res. 2009, 111, 81–84. [Google Scholar] [CrossRef]
  52. Laird, D.A.; Fleming, P.; Davis, D.D.; Horton, R.; Wang, B.; Karlen, D.L. Impact of biochar amendments on the quality of a typical Midwestern agricultural soil. Geoderma 2010, 158, 443–449. [Google Scholar] [CrossRef]
  53. Lehmann, J.; Gaunt, J.; Rondon, M. Bio-char sequestration in terrestrial ecosystems—A review. Mitig. Adapt. Strateg. Glob. Chang. 2006, 11, 403–427. [Google Scholar]
  54. Biederman, L.A.; Harpole, W.S. Biochar and its effects on plant productivity and nutrient cycling: A meta-analysis. GCB Bioenergy 2013, 5, 202–214. [Google Scholar] [CrossRef]
  55. Kuzyakov, Y.; Subbotina, I.; Chen, H.; Bogomolova, I.; Xu, X. Black carbon decomposition and incorporation into soil microbial biomass estimated by 14C labeling. Soil Biol. Biochem. 2009, 41, 210–219. [Google Scholar] [CrossRef]
  56. Yang, Y.; Li, G.; Min, K.; Liu, T.; Li, C.; Xu, J.; Hu, F.; Li, H. The potential role of fertilizer-derived exogenous bacteria on soil bacterial community assemblage and network formation. Chemosphere 2022, 287, 132338. [Google Scholar] [CrossRef]
  57. Antonious, G.F.; Turley, E.T.; Dawood, M.H. Monitoring soil enzymes activity before and after animal manure application. Agriculture 2020, 10, 166. [Google Scholar] [CrossRef]
  58. Höglund, E. The Effects of Biochar on Soil Biota in Temperate and Boreal Agricultural Soils. Helsingin Yliopiston. 2022. Available online: https://helda.helsinki.fi/server/api/core/bitstreams/5dd23027-ae59-4add-9454-aa335b722c64/content (accessed on 11 June 2023).
  59. Kruczyńska, A.; Kuźniar, A.; Podlewski, J.; Słomczewski, A.; Grządziel, J.; Marzec-Grządziel, A.; Gałązka, A.; Wolińska, A. Bacteroidota structure in the face of varying agricultural practices as an important indicator of soil quality—A culture independent approach. Agric. Ecosyst. Environ. 2023, 342, 108252. [Google Scholar] [CrossRef]
  60. Ma, M.; Zhou, J.; Ongena, M.; Liu, W.; Wei, D.; Zhao, B.; Guan, D.; Jiang, X.; Li, J. Effect of long-term fertilization strategies on bacterial community composition in a 35-year field experiment of Chinese Mollisols. Amb Express 2018, 8, 20. [Google Scholar]
  61. Rousk, J.; Brookes, P.C.; Bååth, E. The microbial PLFA composition as affected by pH in an arable soil. Soil Biol. Biochem. 2010, 42, 516–520. [Google Scholar] [CrossRef]
  62. Preston, G.M.; Studholme, D.J.; Caldelari, I. Profiling the secretomes of plant pathogenic Proteobacteria. FEMS Microbiol. Rev. 2005, 29, 331–360. [Google Scholar] [CrossRef] [PubMed]
  63. Zhang, W.; Han, J.; Wu, H.; Zhong, Q.; Liu, W.; He, S.; Zhang, L. Diversity patterns and drivers of soil microbial communities in urban and suburban park soils of Shanghai, China. PeerJ 2021, 9, e11231. [Google Scholar] [CrossRef] [PubMed]
  64. Li, X.; Romanyà, J.; Li, N.; Xiang, Y.; Yang, J.; Han, X. Biochar fertilization effects on soil bacterial community and soil phosphorus forms depends on the application rate. Sci. Total Environ. 2022, 843, 157022. [Google Scholar] [CrossRef]
  65. Shao, T.; Zhao, J.; Liu, A.; Long, X.; Rengel, Z. Effects of soil physicochemical properties on microbial communities in different ecological niches in coastal area. Appl. Soil Ecol. 2020, 150, 103486. [Google Scholar] [CrossRef]
  66. Zhang, M.; Zhang, L.; Riaz, M.; Xia, H.; Jiang, C. Biochar amendment improved fruit quality and soil properties and microbial communities at different depths in citrus production. J. Clean. Prod. 2021, 292, 126062. [Google Scholar] [CrossRef]
  67. Zhou, Z.; Gao, T.; Van Zwieten, L.; Zhu, Q.; Yan, T.; Xue, J.; Wu, Y. Soil microbial community structure shifts induced by biochar and biochar-based fertilizer amendment to Karst calcareous soil. Soil Sci. Soc. Am. J. 2019, 83, 398–408. [Google Scholar] [CrossRef]
  68. Du, T.-Y.; He, H.-Y.; Zhang, Q.; Lu, L.; Mao, W.-J.; Zhai, M.-Z. Positive effects of organic fertilizers and biofertilizers on soil microbial community composition and walnut yield. Appl. Soil Ecol. 2022, 175, 104457. [Google Scholar]
  69. Gao, L.; Wang, R.; Shen, G.; Zhang, J.; Meng, G.; Zhang, J. Effects of biochar on nutrients and the microbial community structure of tobacco-planting soils. J. Soil Sci. Plant Nutr. 2017, 17, 884–896. [Google Scholar] [CrossRef]
  70. Liu, L.; Zhu, N.; Zhou, G.; Dang, P.; Yang, X.; Qiu, L.; Huang, M.; Gong, Y.; Zhao, S.; Chen, J. Response of soil microbial community to plant composition changes in broad-leaved forests of the karst area in Mid-Subtropical China. PeerJ 2022, 10, 12739. [Google Scholar] [CrossRef]
  71. Sato, T.; Ezawa, T.; Cheng, W.; Tawaraya, K. Release of acid phosphatase from extraradical hyphae of arbuscular mycorrhizal fungus Rhizophagus clarus. Soil Sci. Plant Nutr. 2015, 61, 269–274. [Google Scholar] [CrossRef]
  72. Gaume, A.; Mächler, F.; De León, C.; Narro, L.; Frossard, E. Low-P tolerance by maize (Zea mays L.) genotypes: Significance of root growth, and organic acids and acid phosphatase root exudation. Plant Soil 2001, 228, 253–264. [Google Scholar] [CrossRef]
  73. Solans, M.; Messuti, M.I.; Reiner, G.; Boenel, M.; Vobis, G.; Wall, L.G.; Scervino, J.M. Exploring the response of Actinobacteria to the presence of phosphorus salts sources: Metabolic and co-metabolic processes. J. Basic Microbiol. 2019, 59, 487–495. [Google Scholar] [CrossRef] [PubMed]
  74. Dasila, H.; Sah, V.; Jaggi, V.; Kumar, A.; Tewari, L.; Taj, G.; Chaturvedi, S.; Perveen, K.; Bukhari, N.A.; Siang, T.C. Cold-tolerant phosphate-solubilizing Pseudomonas strains promote wheat growth and yield by improving soil phosphorous (P) nutrition status. Front. Microbiol. 2023, 14, 1135693. [Google Scholar] [CrossRef]
  75. Azizoglu, U. Bacillus thuringiensis as a biofertilizer and biostimulator: A mini-review of the little-known plant growth-promoting properties of Bt. Curr. Microbiol. 2019, 76, 1379–1385. [Google Scholar] [CrossRef]
  76. Timofeeva, A.; Galyamova, M.; Sedykh, S. Prospects for using phosphate-solubilizing microorganisms as natural fertilizers in agriculture. Plants 2022, 11, 2119. [Google Scholar] [CrossRef]
Figure 1. The (a) plant height, (b) stem diameter, and (c) dry weight and fresh weight of P. giganteum. The values represented by different letters indicate significant differences (Tukey HSD, p < 0.05).
Sustainability 15 15142 g001
Figure 2. The soil EC and pH of P. giganteum. The values represented by different letters indicate significant differences (Tukey HSD, p < 0.05 ).
Sustainability 15 15142 g002
Figure 3. The distribution of bacterial community on phylum level.
Sustainability 15 15142 g003
Figure 4. Relative abundance of significantly different phyla among CK, BC, and OF. A one-way ANOVA test was used to evaluate the importance of comparisons between indicated groups. * p < 0.05.
Sustainability 15 15142 g004
Figure 5. Functional notes pie chart of soil bacterium (pathway level 1). Different colors represent the abundance values of the functions corresponding to the KEGG pathway level 1 in each group or sample. The OTU abundance table was standardized by PICRUSt; that is, the effect of the copy number of 16S marker gene in the species genome was removed. Then, through the greengene id corresponding to each OTU, the KEGG function annotation of OTU was performed to obtain the annotation information of OTU at the KEGG function level and the abundance information of each function in different samples.
Sustainability 15 15142 g005
Figure 6. Functional structure of bacterium in different treatments (PICRUSt1). The OTU abundance table was standardized by PICRUSt; that is, the effect of the copy number of 16S marker gene in the species genome was removed. Then, the COG functional annotation of OTU was performed by the greengene id corresponding to each OTU to obtain the annotation information of OTU at the COG functional level and the abundance information of each function in different samples.
Sustainability 15 15142 g006
Figure 7. The relationships between environmental factors and bacteria species at the phylum level (INV, invertase; CAT, catalase; β-GC, β-glucosidase; ACP, acid phosphatase; and ALP, alkaline phosphatase). The R value is displayed in different colors in the figure. If the p value is less than 0.05, it is marked with *, and the right legend is the color interval of different R values (* 0.01 < p ≤ 0.05, ** 0.001 < p ≤ 0.01, *** p ≤ 0.001).
Sustainability 15 15142 g007
Figure 8. RDA of bacterial phylum and (a) soil pH, EC, and nutrient, and (b) soil enzyme activity. The red arrow represents the quantitative environmental factor, and the length of the environmental factor arrow can represent the degree of influence of the environmental factor on the species data. The angle between the arrows of environmental factors represents positive and negative correlation. The acute angle represents a positive correlation, the obtuse angle represents a negative correlation, and the right angle represents no correlation.
Sustainability 15 15142 g008
Table 1. The soil nutrient parameters. The data presented are averages from three replicates ± SD. The letter indicates statistically significant differences based on the LSD Fisher test with a p < 0.05 .
TreatmentAP
(mg·kg−1)
CaCl2-P
(mg·kg−1)
Phosphorus FractionationNO3-N
(mg·kg−1)
NH4+-N
(mg·kg−1)
Al-P (mg·kg−1)Fe-P (mg·kg−1)Ca-P (mg·kg−1)
CK71.53 ± 4.12 bc1.59 ± 0.21 b237.41 ± 30.84 a2338 ± 47.30 a51.91 ± 10.56 b2.80 ± 0.32 ab1.58 ± 0.08 c
2% BC81.03 ± 17.48 abc1.35 ± 0.00 b224.77 ± 23.45 a2326 ± 21.53 a59.55 ± 3.65 b2.16 ± 0.50 b1.87 ± 0.23 c
4% BC58.03 ± 13.97 c1.26 ± 0.15 b206.79 ± 20.54 a2334 ± 6.09 a52.90 ± 8.57 b3.13 ± 0.61 ab1.68 ± 0.10 c
2% OF108.7 ± 12.39 ab2.96 ± 0.16 b237.53 ± 34.23 a2347 ± 30.57 a58.07 ± 8.67 b3.31 ± 0.57 a3.88 ± 0.48 b
4% OF107.3 ± 26.61 ab5.65 ± 1.72 a244.82 ± 18.81 a2352 ± 1.89 a98.96 ± 15.73 a3.41 ± 0.56 a8.78 ± 0.79 a
Note: AP, available phosphorus content.
Table 2. The soil enzyme activities of P. giganteum. The data presented are averages from three replicates ± SD. The letter indicates statistically significant differences based on the LSD Fisher test with a p < 0.05 .
TreatmentINV
(mg d−1 g−1)
CAT
(mL h−1 g−1)
β-GC
(μg d−1 g−1)
ACP
(mg d−1 g−1)
ALP
(mg d−1 g−1)
CK0.25 ± 0.05 a8.53 ± 0.87 a0.21 ± 0.02 b0.47 ± 0.04 a0.23 ± 0.00 c
2% BC0.28 ± 0.04 a8.53 ± 0.87 a0.20 ± 0.02 bc0.46 ± 0.01 b0.23 ± 0.01 c
4% BC0.27 ± 0.05 a7.53 ± 1.51 a0.18 ± 0.02 c0.44 ± 0.01 b0.23 ± 0.01 c
2% OF0.32 ± 0.04 a9.04 ± 0.00 a0.23 ± 0.03 b0.45 ± 0.01 b0.39 ± 0.03 b
4% OF0.32 ± 0.06 a9.04 ± 0.00 a0.31 ± 0.01 a0.43 ± 0.02 b0.46 ± 0.03 a
Note: INV, invertase; CAT, catalase; β-GC, β-glucosidase; ACP, acid phosphatase; ALP, alkaline phosphatase; d, day; h, hour.
Table 3. Soil microbial abundance indices after cultivation. The data presented are averages from three replicates ± SD. The letter indicates statistical significance differences based on the LSD Fisher test with a p < 0.05 .
TreatmentAceChaoCoverageShannonSimpsonSobs
CK2804.81 ± 115.52 a2761.21 ± 78.1 a0.98 ± 0.00) a6.27 ± 0.07 a0.01 ± 0.00 a2348.33 ± 110.18 a
2% BC2895.81 ± 224.93 a2909.72 ± 197.00 ab0.98 ± 0.00 a6.39 ± 0.07 a0.01 ± 0.00 a2506.00 ± 155.47 ab
2% OF2634.57 ± 90.91 a2612.91 ± 75.35 b0.98 ± 0.00 a6.12 ± 0.05 b0.01 ± 0.00 a2184.00 ± 86.88 b
Disclaimer/Publisher’s Note: The statements, opinions and data contained in all publications are solely those of the individual author(s) and contributor(s) and not of MDPI and/or the editor(s). MDPI and/or the editor(s) disclaim responsibility for any injury to people or property resulting from any ideas, methods, instructions or products referred to in the content.

