Article

Effects of Audio-Visual Environmental Factors on Emotion Perception of Campus Walking Spaces in Northeastern China

College of Landscape Architecture, Northeast Forestry University, Harbin 150040, China
*
Authors to whom correspondence should be addressed.
Sustainability 2023, 15(20), 15105; https://doi.org/10.3390/su152015105
Submission received: 10 September 2023 / Revised: 9 October 2023 / Accepted: 19 October 2023 / Published: 20 October 2023
(This article belongs to the Section Environmental Sustainability and Applications)

Abstract

:
In the context of urban sustainable development and the creation of pedestrian-friendly campus environments, optimizing campus walking spaces has emerged as a central focus in urban planning research. Presently, research in pedestrian environments predominantly adopts a macroscopic perspective, offering limited insights into pedestrians’ subjective experiences and emotional perceptions at a micro level. Therefore, this study conducted on-site experiments in 21 walking spaces across three campuses, utilizing image semantic analysis, multifunctional sound level meter, wearable electrocardiography devices, and the Profile of Mood States (POMS) to collect data separately on audio-visual environmental factors and pedestrians’ emotional states. This study’s findings revealed significant correlations (p < 0.01) among factors such as the Green Visual Index, Spatial Enclosure Index, Sky Visibility Index, Spatial feasibility Index, and Equivalent Continuous A-weighted Sound Pressure Level with physiological and psychological alterations in pedestrians’ emotions. Additionally, the various proportions of audio-visual environmental factors also exerted significant influences on emotions (p < 0.05). The relevant conclusions can provide a reference for optimizing the audio-visual environment of walking space and promoting the sustainable development of the campus. In future research, the effects of audio-visual environments on both emotional and physiological indicators, as well as subjective evaluations, can be explored further.

1. Introduction

Campus planning holds a crucial role within the broader field of urban planning. With sustainable development and urbanization on the rise, the concept of creating walkable campuses has gained significant attention in urban planning. In 1990, numerous European and American universities collaborated to endorse the Talloires Declaration, placing sustainable campus transportation as a top priority and advocating for the development of green campuses. By 2003, an additional 293 universities, including many in China, had embraced this initiative. The adoption of sustainable transportation methods on campus is considered a crucial indicator, and establishing a walkable campus is recognized as an important means of fostering harmonious campus development.
Currently, the design of motorized roadways within campuses is relatively comprehensive. However, pedestrian pathways, which are the ones that are used most frequently, have not been paid a proportionate level of attention [1]. This oversight reflects an underestimation of the importance of walkability in campus planning. Walking serves not only as the fundamental and primary mode of transportation within campuses but also as a means of combining leisure, physical fitness, and social interaction. Its most noteworthy characteristics are grounded in low-carbon and environmentally friendly attributes while simultaneously promoting physical and mental well-being and delivering a pleasurable experience. These aspects contribute positively to the overall well-being of urban societies and the ecological environment. Consequently, it has become an imperative task to conduct in-depth research aimed at enhancing the quality of walking spaces [2,3].
The link between walking and health receives widespread attention [4]. The COVID-19 pandemic has not only escalated disease-related mortality but has also triggered a surge in mental health challenges [5], which are often difficult to alleviate in the short term [6]. As reported by the Chinese Association of Mental Health, the incidence of depression and anxiety disorders has been steadily increasing among college students, with depression rates exceeding 10% as of 2021. Numerous studies have shown that brief exposure to natural environments can enhance emotions [7,8] and reduce stress [9]. Previous research [10] has established that the concept of a walkable campus not only reduces carbon emissions but also enhances students’ health and overall quality of life. Other studies have explored the role of natural landscape elements (e.g., green vegetation, architecture, and human activities) in boosting pedestrians’ emotional well-being [11]. Walking, as a form of moderate-intensity physical activity, has a positive impact on physical health [12]. Meticulously designed pedestrian spaces not only elevate the comfort of walking, health, and well-being but also contribute to environmental sustainability [13].
Micro-design factors play a crucial role in shaping the quality of walking environments and are directly linked to individuals’ walking experiences [14]. It is imperative to pay more attention to the micro-scale aspects of walking environments, involving an exploration of the attributes within walking spaces that influence students’ perceptions of the physiological and psychological environment. The body of research on human perception during walking at the micro-scale remains limited. According to the Stimulus–Organism–Response (SOR) theory, stimuli consciously or unconsciously impact human emotions or behavior, eliciting a response [15]. However, the perception of environmental stimuli by humans is not a singular and isolated process. Instead, it constitutes a multisensory experience that encompasses visual, auditory, olfactory, and other sensory inputs, all converging to form a comprehensive consciousness. People integrate this sensory information [16] through multimodal perception, resulting in a bottom-up cognitive process. This cognitive process is also intertwined with human behavior and emotions (top-down signals) [17], yielding a distinct and subjective perceptual experience [18]. In contrast to other senses, vision and hearing perceive space more accurately and in direction. Amongst studies on audio-visual integration, some suggest that audio-visual integration can evoke stronger emotional responses [19]. The existing body of research on multiple perceptions of walking space remains limited. Therefore, this study focuses on exploring the combined effects of audio-visual environmental factors on walking emotions.
Currently, researchers both domestically and internationally predominantly adopt a macroscopic objective approach when assessing the walking environment. This approach has resulted in a research gap regarding the subjective perspectives and psychological perceptions of individuals within the walking space and environment. From a physiological perspective, individuals perceive audio-visual cues from the external environment, and these cues trigger responses from the autonomic nervous system (ANS). The autonomic nervous system comprises the sympathetic nervous system (SNS), which activates during stressful situations, and the parasympathetic nervous system (PNS), responsible for restoring balance and homeostasis after stress. Heart rate variability (HRV), evaluated in both the time and frequency domains, arises from variations in the R-R interval. This interval is determined by impulses originating from the sinus node and is influenced by the activity of both the sympathetic and parasympathetic nerves. Consequently, changes in the R-R interval mirror the activation levels of both the SNS and the PNS. Research by Jackson M and Erin Chave further demonstrated the direct correlation between heart rate and HRV with an individual’s emotional state [20]. HR(V) finds extensive use in medical examinations and responds to various factors such as exercise and emotional arousal [21], accurately representing changes in physical states during walking. Hence, HRV serves as a valuable objective tool for assessing emotional changes. Physiological indicators can objectively reflect the influence of audio-visual factors on emotions, while subjective assessments are better suited to explore the underlying significance of the environment. Therefore, a combination of physiological data and subjective questionnaires is pivotal for obtaining the most accurate results.
To date, most studies have been carried out in controlled laboratory settings to examine the impact of the environment on emotions. However, given that environmental perception engages multiple senses, these experiments inherently suffer from limitations in replicating real-world conditions [22,23]. Laboratory environments provide controlled settings conducive to studying experimental variables, but these findings have limited applicability to real-life scenarios, resulting in reduced ecological validity. Conversely, field experiments offer a more authentic representation of the actual environment, ensuring greater ecological validity of the outcomes [24]. To achieve the established goal, the field measurement experiment method is adopted in this study.
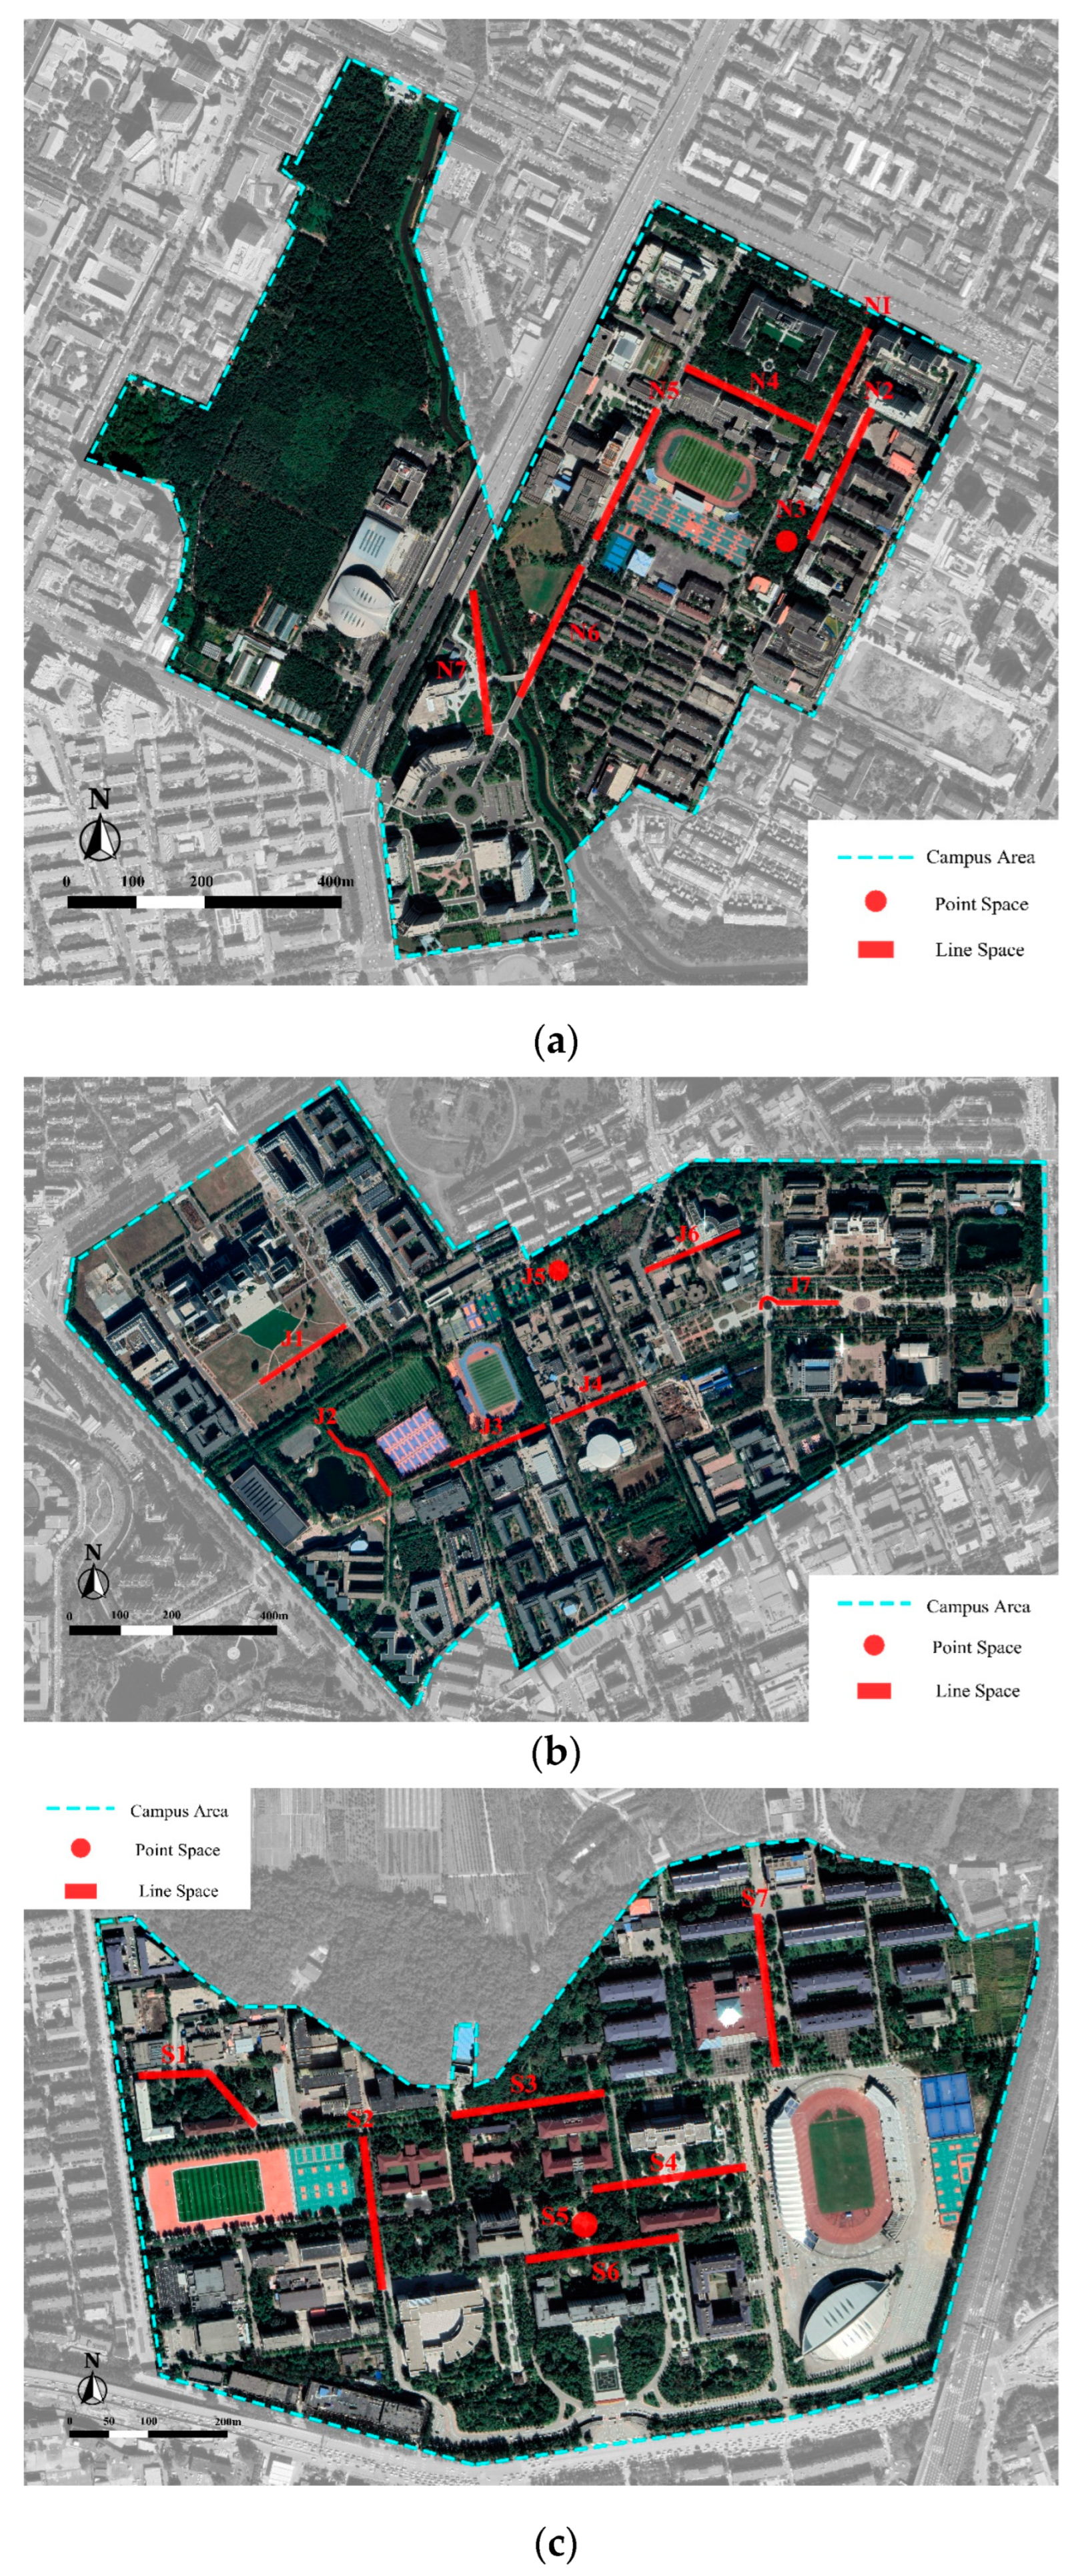
This study conducted comprehensive field measurement experiments to investigate the physiological indicators and subjective assessments of emotional responses in common and representative audio-visual environments within campus walking spaces. Within the research, this study addressed the following primary objectives:
  • To explore the correlation between individual audio-visual environmental factors and physiological and subjective evaluation indicators of emotions.
  • To examine how varying proportions of audio-visual environmental factors affect physiological and subjective evaluation responses to walking emotions in campus walking spaces.
  • To investigate whether the physiological and psychological effects of various combinations of audiovisual environmental factors on walking mood remain consistent.
  • To construct multiple linear regression models to establish the connection between audio-visual environmental factors and emotion perception in campus walking spaces. This model can guide planning and designing strategies in campus walking spaces to enhance pedestrians’ emotional perception.

2. Materials and Methods

2.1. Research Area

This study is focused on northeastern China, with specific attention to the capital cities of the three northeastern provinces: Harbin, Changchun, and Shenyang. Various universities in these cities were selected for the research, including Northeast Forestry University (NEFU), Qianwei Campus of Jilin University (JLU), and the main campus of Shenyang Agricultural University (SYAU). These campuses cover areas of 136 hectares, 164 hectares, and 257 hectares, respectively.
To ensure a diverse and representative sample, this study employed a combination of the universities’ road networks and the frequency of usage for each road segment. Subsequently, the study identified seven distinct walking spaces within each university, resulting in a total of 21 experimental areas. These areas encompass both walking node spaces and linear spaces. The experimental areas within the three universities were designated as N1–N7, J1–J7, and S1–S7 (Figure 1).
To reduce the influence of walking distance and ensure consistent audio-visual environments for each sample, the study standardized the distance covered by the study participants to 200 m. This distance provided a straightforward route, avoiding the need to cross intersections or encounter other obstacles. To minimize the impact of walking direction, the study implemented a round-trip walking format, covering a total distance of 400 m, which took approximately 5 min to complete.

2.2. Experimental Design

2.2.1. Participants

To determine the required planned sample size for the study, this paper conducted an a priori statistical power analysis on the participants using G*Power 3.1.9.7. This study established a medium effect size of f = 0.25, a statistical test power of 1 − β = 0.8, and a significance level of α = 0.05 as the criteria for calculating the planned sample size. The analysis indicated that a repeated measures analysis of variance (ANOVA) would necessitate a minimum of 16 participants per school. To ensure an adequate sample size and avoid failure samples, this study decided to include 20 participants from each school, resulting in a total of 60 participants from the three schools. Among the participants, there were 28 males and 32 females (Table 1). To minimize variability, this study selected students from the three universities who were studying architecture and town and country planning-related subjects. All participants had normal vision and hearing and did not use any psychotropic substances. They wore comfortable, loose-fitting clothing and had not engaged in strenuous exercise or experienced significant fatigue within 2 h prior to the experiment. Participants were instructed not to consume alcohol or caffeine for 12 h before the experiment. To prevent potential bias in the assessment of responses, the true purpose of the experiment was not disclosed to the participants. Additionally, participants were fully familiar with the use of the experimental equipment. Since body mass index (BMI) can impact walking behavior [25], Table 1 presents the participants’ BMI. The data indicate that all participants had a normal BMI [26].
The body mass index (BMI) of the experimental participants:
BMI = Weight / H e i g h t 2
The values are presented as follows: average ± standard deviation.

2.2.2. Data Collection for Audio-Visual Environmental Factors

For visual environmental factors, this research selected indicators based on three aspects of pedestrian spaces within the campus: spatial form, spatial environment, and spatial facilities. Specific indicators and calculation formulas are detailed in Table 2. Visual imagery was captured in the field using a camera to replicate the pedestrian’s perspective. To ensure the experiment’s rigor and the results’ credibility, this research established a sampling interval of 20 m, resulting in a total of 207 sampling points across 21 walking spaces. The camera’s acquisition angle was fixed at 0° to provide a flat view. After computing average values for quantitative indicators, these values were assigned to each road segment. The panoramic camera utilized for image capture was the Garmin VIRB 360, generating synthesized panoramic images with a resolution of 5640 × 2820 pixels. This camera is equipped with a GPS + GLONASS satellite positioning system, automatically recording the geographical coordinates of the captured images. The camera’s shooting height was determined based on the average height of Chinese adult men and women, as reported by the National Health Commission in 2023, which is 1.6 m.
Panoramic images captured by panoramic cameras are often presented in equirectangular projection. In this projection, the projected area is not equal to the actual area. To make the area of the panoramic image measurable, it needs to be converted into a cylindrical equal-area projection for calculations. The specific calculation process involves converting the original equirectangular projection to spherical coordinates and then further converting these spherical coordinates to cylindrical equal-area projection.
Equirectangular projection to spherical latitude and longitude coordinate formulas is as follows:
λ = x 1 / ( cos φ 1 ) + λ 0
φ = y 1 + φ 1
where λ is the longitude of the location of the spherical coordinate fixed point; φ is the latitude of the location of the fixed point in spherical coordinates; φ 1 is the standard latitude line of the spherical coordinates; λ 0 is the central meridian of the spherical coordinates; x 1 is the horizontal coordinate of the equirectangular projection; y 1 is the vertical coordinate of the equirectangular projection.
Spherical coordinates to cylindrical equal-area projection formulas are as follows:
x 2 = ( λ λ 0 ) cos λ 0
y 2 = sin φ / cos λ 0
where λ is the longitude of the location of the spherical coordinates, φ is the latitude of the location of the spherical coordinates, λ 0 is the central longitude of the spherical coordinates, x 2 is the horizontal coordinate of the cylindrical equal-area projection, and y 2 is the vertical coordinate of the cylindrical equal-area projection.
Using the method of image semantic segmentation to quantify the visual environment, currently, the commonly used image semantic segmentation models include FCN, SegNet, DeepLabv3+, etc. Compared with FCN and other common models, the DeepLabv3+ deep neural network model is more accurate and has obvious advantages in terms of operation rate and stability; therefore, after comprehensive consideration, this study chooses the DeepLabv3+ model as the deep learning algorithm support for panoramic image recognition (Figure 2), and iterative training is carried out based on the ADE_20K dataset.
To minimize the influence of irrelevant factors, such as environmental lighting and chromatic aberration, on image recognition, this study adaptively standardizes the brightness, contrast, and color of the image data. The processed images are then input into the DeepLabv3+ model for further processing. The segmentation results are organized, and the elements are summarized to extract visual components, including natural vegetation (trees, shrubs, and grasses), the sky, roads, and buildings (walls), as well as attached facilities and other visual elements. These visual elements are used for parameter calculations. After several iterations of training, the deep learning algorithm can achieve an image recognition accuracy of up to 96.7%, which meets the research requirements.
For the auditory environmental factors, the Equivalent Continuous A-weighted Sound Pressure Level ( L A e q ) indicator [27] was chosen, which can be used to describe the noise level over a sustained period of time. An AWA5680 multifunctional sound level meter (Hangzhou Aihua Instrument Co., Ltd., Hangzhou, China) was used at the same point to measure continuously for five working days, each time continuously for 5 min, and the height of the measuring equipment from the ground was 1.5 m.

2.2.3. Physiological Measurements

Heart rate variability (HRV) alone serves as an indicator of increased or decreased sympathetic or parasympathetic activity and is the preferred method for this purpose. Time domain analysis of HRV, such as RR.mean, can provide insights into the degree of variability between adjacent heartbeats, reflecting autonomic regulation throughout the body. RMSSD, on the other hand, reflects the rapidity of heart rate variability and is often associated with parasympathetic activity. It is considered the most suitable measure when establishing a connection with subjective sensations [28]. Therefore, in this study, the mean of the RR interval (RR.mean) and the root mean square of the difference between neighboring heart rate intervals (RMSSD) were selected as physiological indices to assess emotion changes.
There have been previous studies involving the use of portable wearable smart devices, and each of these studies employed different techniques to obtain heart rate data from various body locations. Prior studies have presented a hybrid approach to assess the quality of data collected from six widely used wearable heart rate monitoring biosensors [29]. In all experiments, the Polar H10 demonstrated the highest correlation and agreement with the standard, along with the lowest number of artifacts. In this experiment, the Polar H10 chest strap was selected and combined with the Polar Pacer Pro wristwatch to measure physiological metrics for the participants.

2.2.4. Subjective Evaluation of Emotions

Chinese norms for the Profile of Mood States (POMS) were used as the instrument to measure emotional states in this study. This questionnaire is commonly employed in medical research for the long-term monitoring of patients’ emotional states and has been validated for various demographic groups [30]. Professor Beili Zhu confirmed the high validity of the Chinese norm for POMS, establishing it as a valuable tool for studying emotional states and the relationship between emotions and exercise. The scale comprises seven subscales, encompassing seven emotional states, including tension–anxiety, depression–dejection, anger–hostility, vigor–activity, fatigue–inertia, confusion–bewilderment, and friendliness, for a total of 40 adjectives. The reliability of the Chinese norms for the Profile of Mood States ranges from 0.62 to 0.82, with an average reliability coefficient of r = 0.71.
The Total Mood Disturbance (TMD) of the POMS is calculated as follows:
TMD = (sum of negative emotion scores − sum of positive emotion scores) + 100.
Higher TMD scores indicate more negative emotion states, reflecting more disorganized, bored, or dysfunctional emotions.

2.3. Procedure

A Latin-square design was employed to mitigate the influence of sequence effects on the experiment. Various factors related to the walking experience were carefully considered to minimize the impact of weather conditions such as temperature, humidity, and wind speed. During the experiment, the average temperature ranged from 20 to 27 °C, humidity levels were between 55% and 62%, and wind speeds ranged from 2 to 3 levels.
To prevent the potential impact of peak campus pedestrian traffic on the experiments, the experiment was conducted during periods that did not coincide with holidays or class dismissal times. The experiment took place from 7 May to 28 May 2023 at four different time slots: 8:00–9:30 AM, 10:00–11:30 AM, 2:00–3:30 PM, and 4:00–6:00 PM. Before the experiment, volunteers were informed about the starting and ending points of the walking route, as well as the use of the equipment. They also filled out a questionnaire to record basic personal information and baseline subjective evaluations of their emotions, capturing their emotional state at rest without any stimuli. Since emotions vary in real-world scenarios, the assumption was made that individuals entered these scenarios in their baseline emotional state. At each site, a 5 min break was taken before the experiment began. Once the experiment started, the experimenters ensured that other individuals did not engage in conversations with the volunteers at a certain distance. Volunteers experienced the selected walking space at their own comfortable walking pace, and the experimenters measured and recorded the equivalent A sound level. Additionally, panoramic photographs were taken without disrupting the volunteers. At the end of each experience, the volunteers filled out the Profile of Mood States again. Each time the volunteers reached a new location, they ensured to take ample rest before proceeding with the experimental process (Figure 3).

3. Results

3.1. Descriptive Statistics and Correlation Analyses

The descriptive statistics of the experimental data are presented in Table 3. Pearson’s correlation tests were conducted on the experimental data to analyze the relationship between the audio-visual environmental factors and the physiological indicators and subjective evaluations. The results are displayed in Table 4. The analysis revealed that physiological indicators exhibited highly significant correlations with all audio-visual environmental factors except AFI (p < 0.01), and subjective evaluation results displayed highly significant correlations with all audio-visual environmental factors except VE (p < 0.01).

3.2. Physiological Effects of Emotions

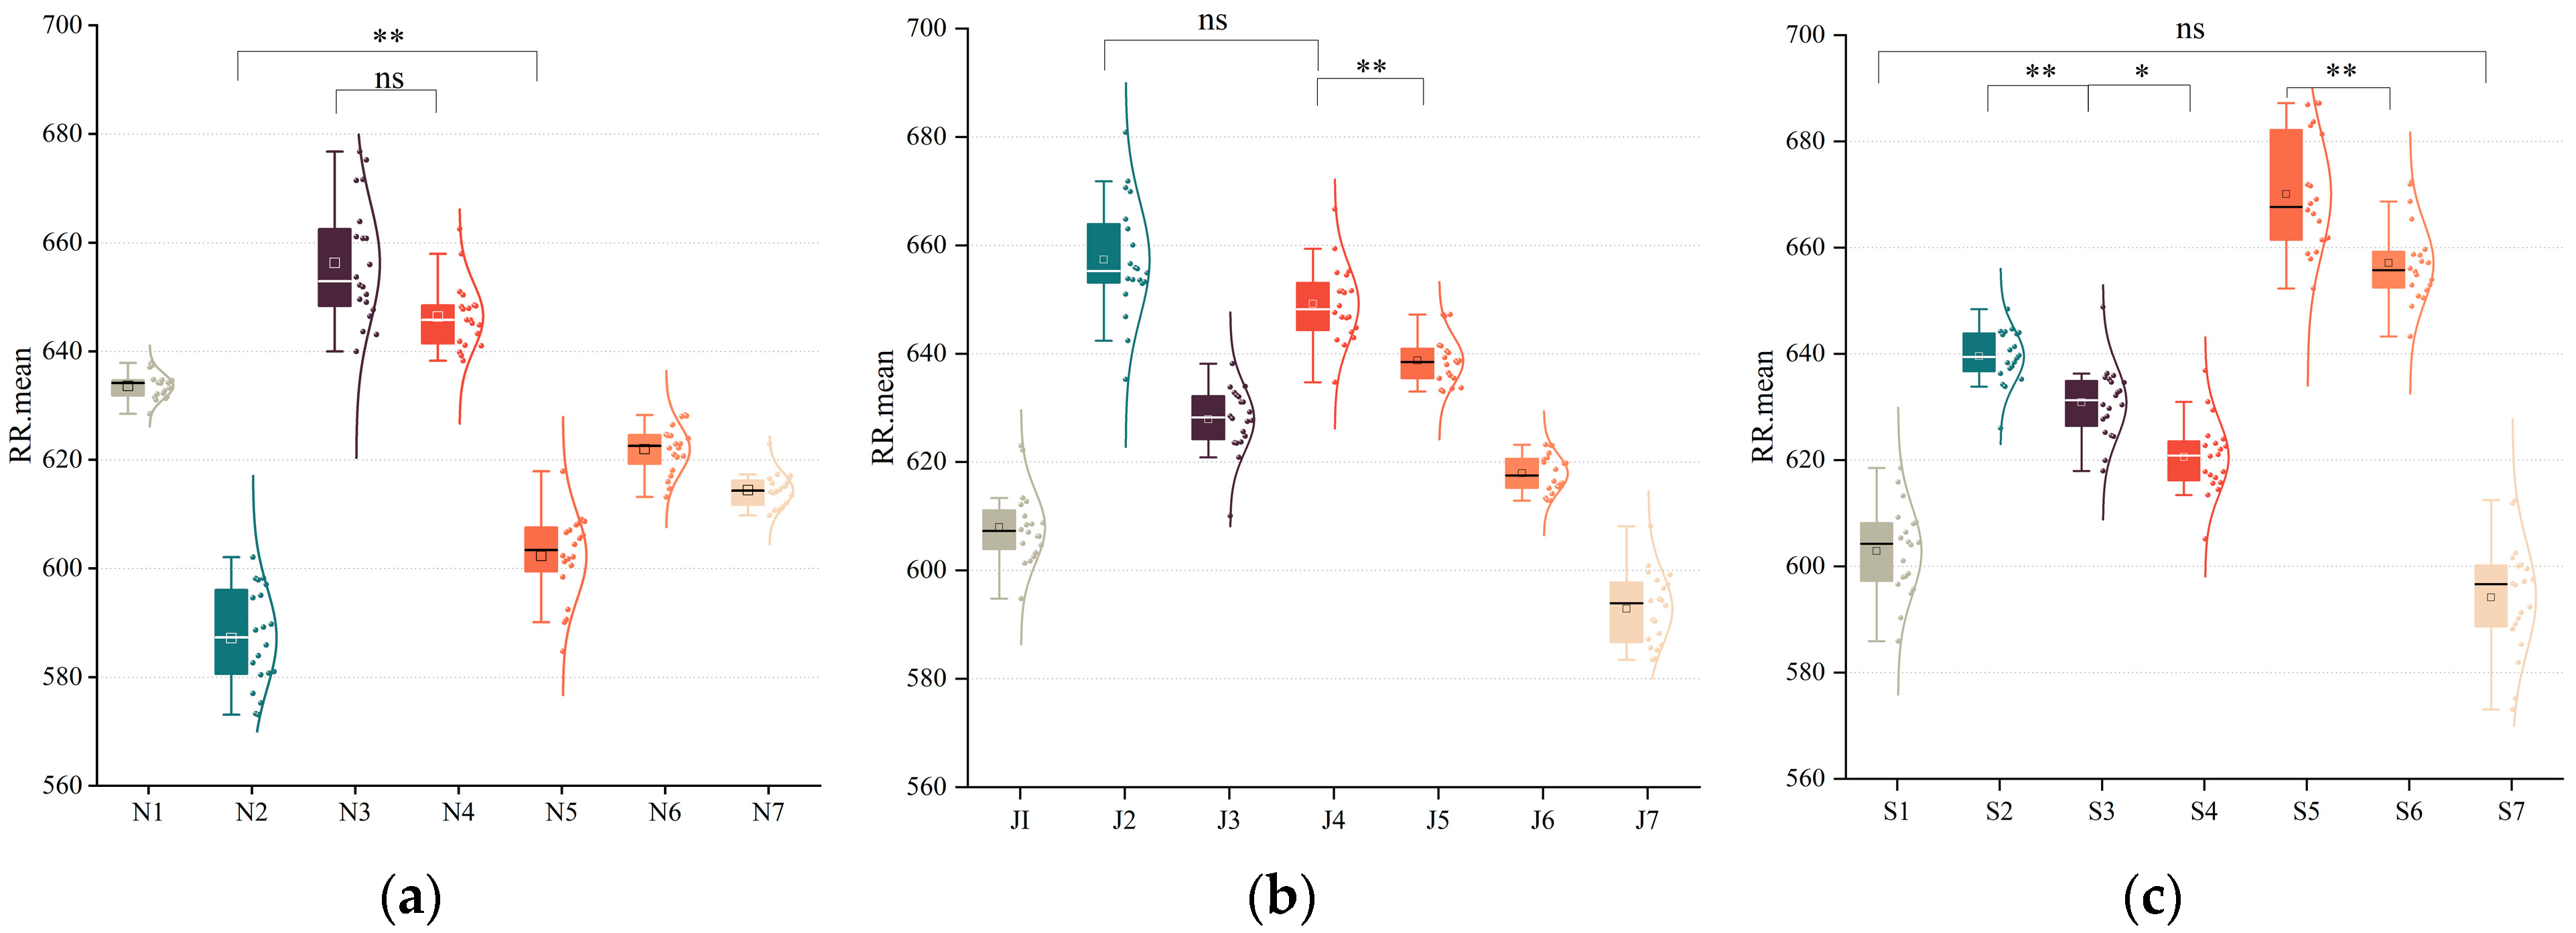
Repeated measures ANOVA on the physiological indicator RR.mean for walking spaces at NEFU, JLU, and SYAU universities respectively showed (Table 5) that the main effect of audio-visual environmental factors was significant F(3.57, 67.87) = 225.82, p < 0.001, F(3.65, 69.31) = 215.61, p < 0.001, and F(3.18, 60.42) = 210.85, p < 0.001. The Greenhouse–Geisler estimates of deviation from sphericity were ω = 0.53, 0.61, and 0.60, respectively, and the deviation η 2 was greater than 0.9, indicating that different audio-visual contextual factors have a significant effect on RR.mean.
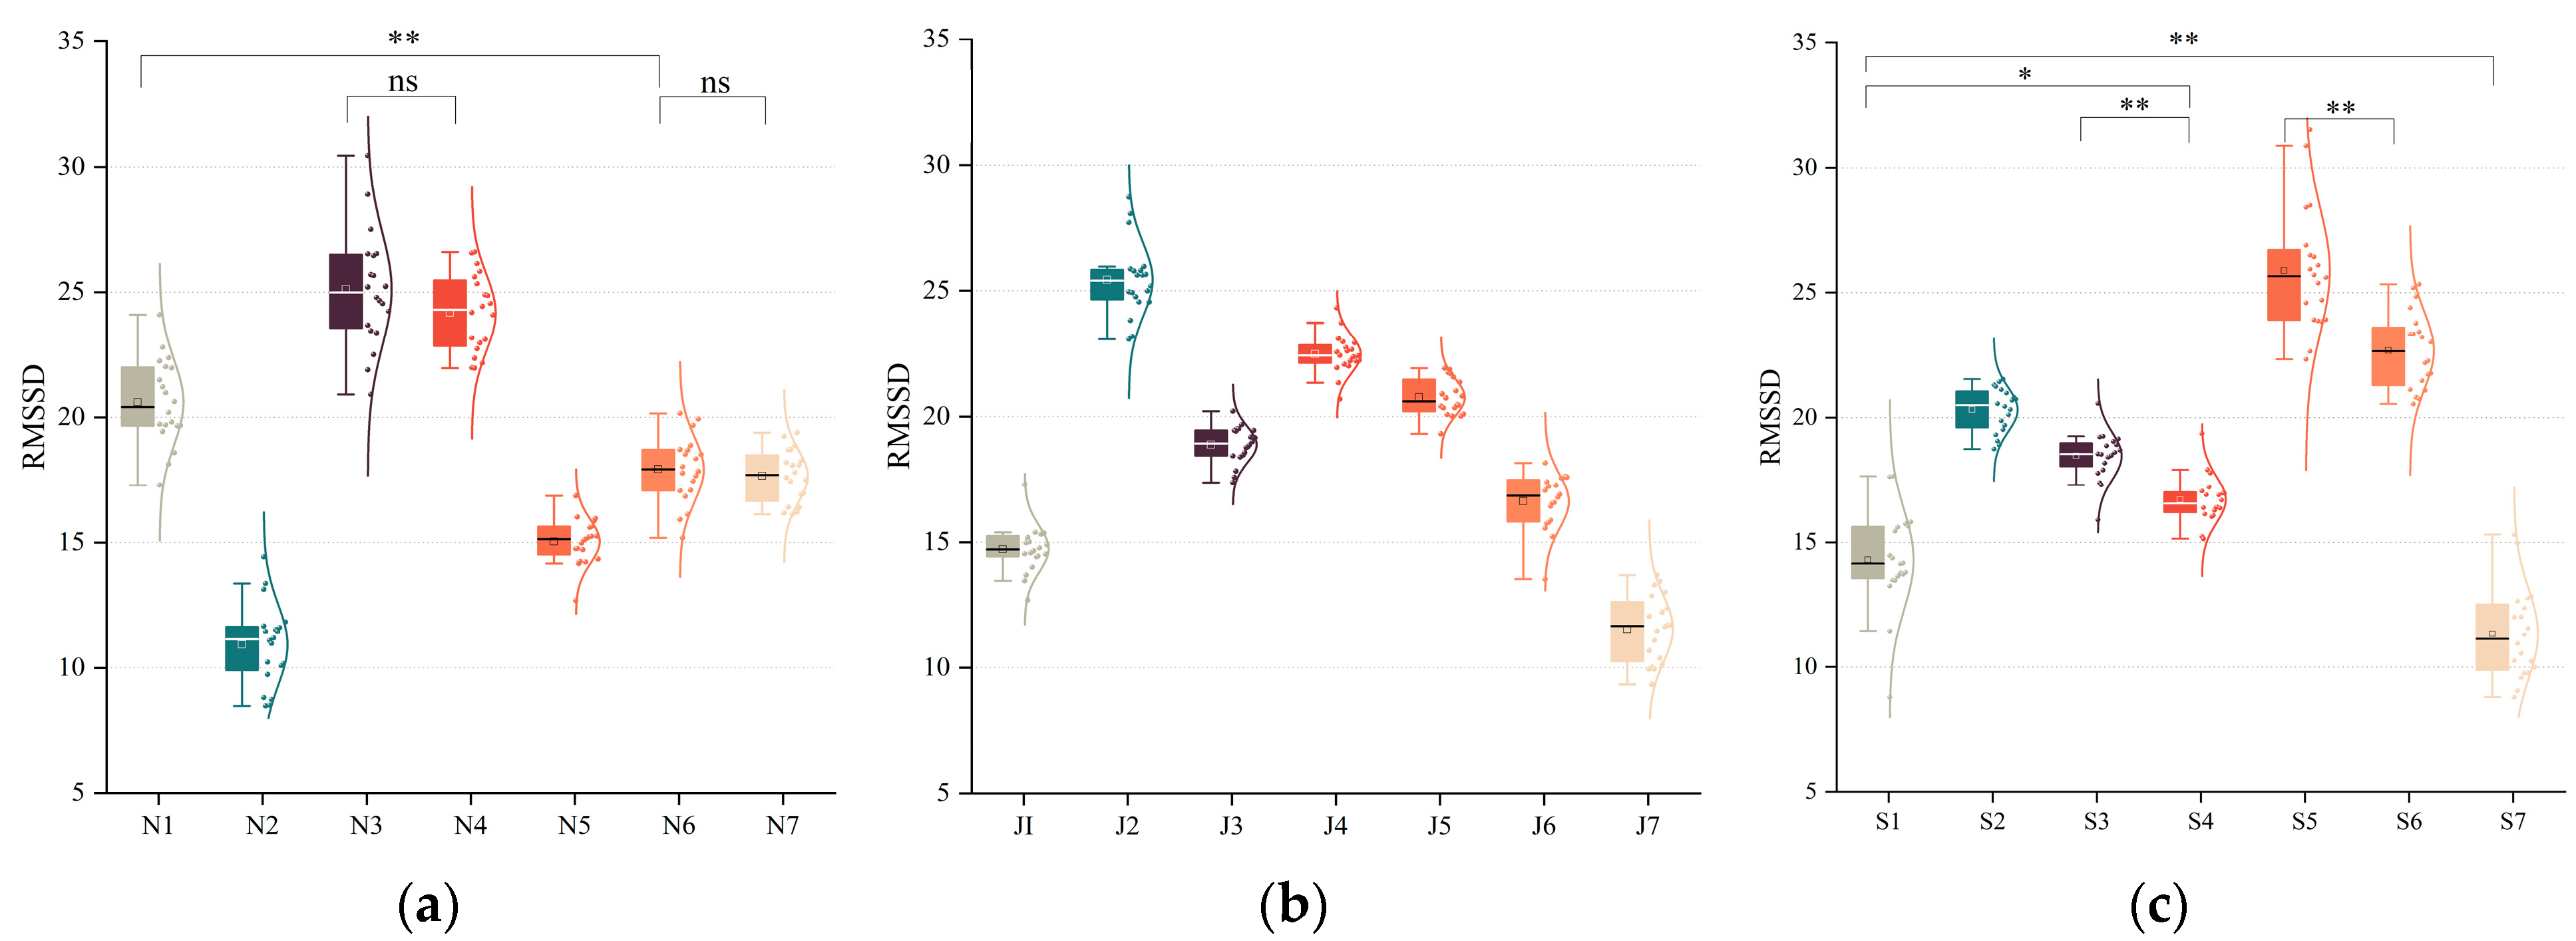
Repeated measures ANOVA on RMSSD showed significant main effects of audio-visual environmental factors F (4.43, 84.10) = 211.55, p < 0.001, F (3.80, 72.21) = 414.16, p < 0.001, F (3.20, 60.79) = 180.14, p < 0.001, and the Greenhouse–Geisler estimates of the deviations from sphericity estimates of ω = 0.51, 0.39, and 0.29, indicating significant differences in RMSSD across experimental sites on campus.
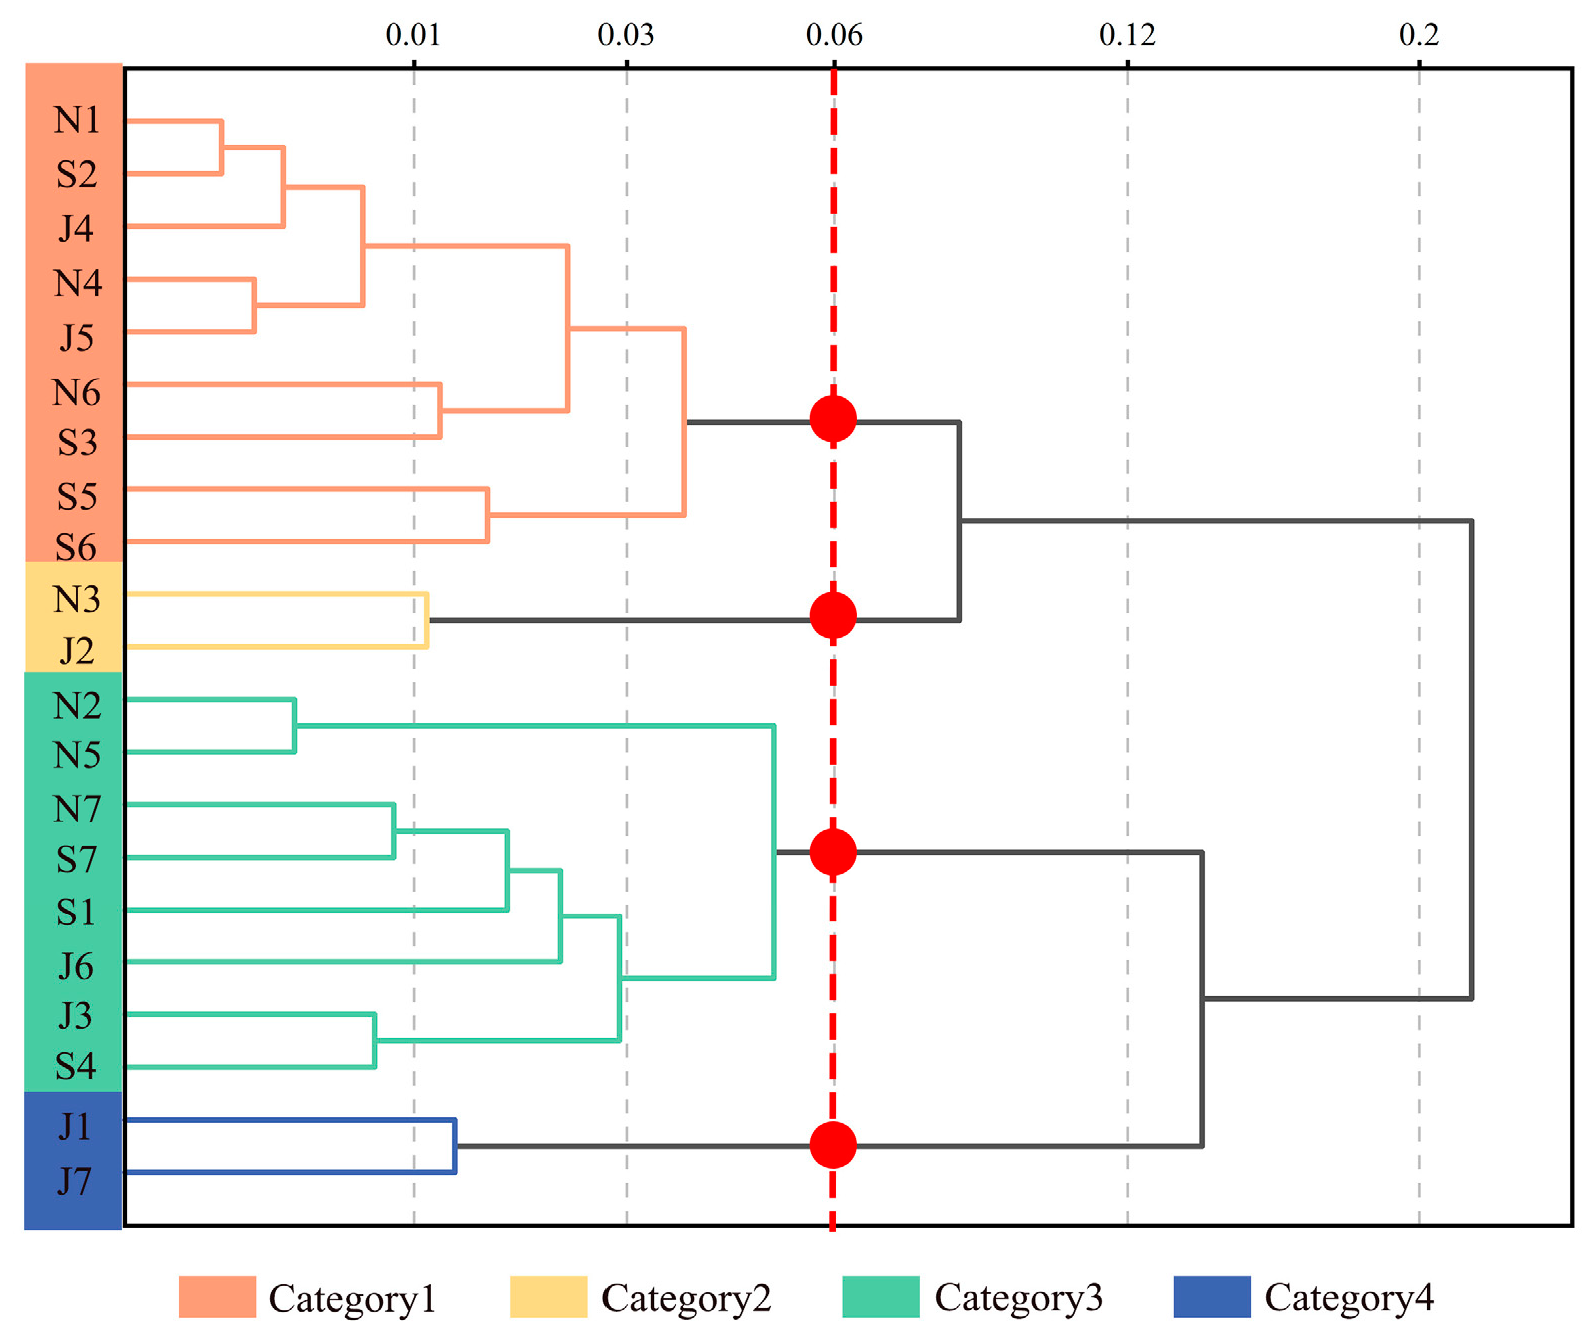
Hierarchical cluster analysis (HCA) can reliably identify clusters in data based on similarities between samples. HCA has been applied to audio-visual studies [31]. Based on the measured audio-visual environmental factors data for 21 walking spaces, the HCA method was used to classify the 21 experimental locations into four classes of walking spaces (Figure 4); features are shown in Table 6.
The first category of walking spaces exhibited relatively high values for GVI, SED, and SFI, along with relatively low SVI and L A e q . The second category had the highest GVI and SED while featuring the lowest sound pressure levels and SVI. The third category of walking spaces displayed moderate levels across all audio-visual environmental factors. The fourth category had the highest SVI, sound pressure levels, SFI, and VE, but the lowest values for GVI, SED, and AFI. The categorization of different walking spaces based on the above audio-visual environmental factors will help to further investigate the effects of audio-visual environmental factors on emotion in different categories of walking spaces.
Furthermore, pairwise comparisons were conducted to perform a simple effects analysis on the pedestrian spaces of the three schools, comparing the mean values of physiological indicators under different audio-visual environmental conditions. The differences in the scores of physiological indicators (RR.mean and RMSSD) for the different walking spaces of the three schools are shown in Figure 5 and Figure 6, respectively.
Simple effects analyses revealed significant differences in physiological indicators (RR.mean and RMSSD) among the four types of walking spaces. Specifically, the fourth type of walking space had significantly higher scores than the third type (p < 0.01), the third type scored significantly higher than the first type (p < 0.01), and the first type had significantly higher scores than the second type (p < 0.01). The analysis found that the first and second categories of walking space had a positive effect on emotion (Table 7).

3.3. Psychological Effects of Emotions

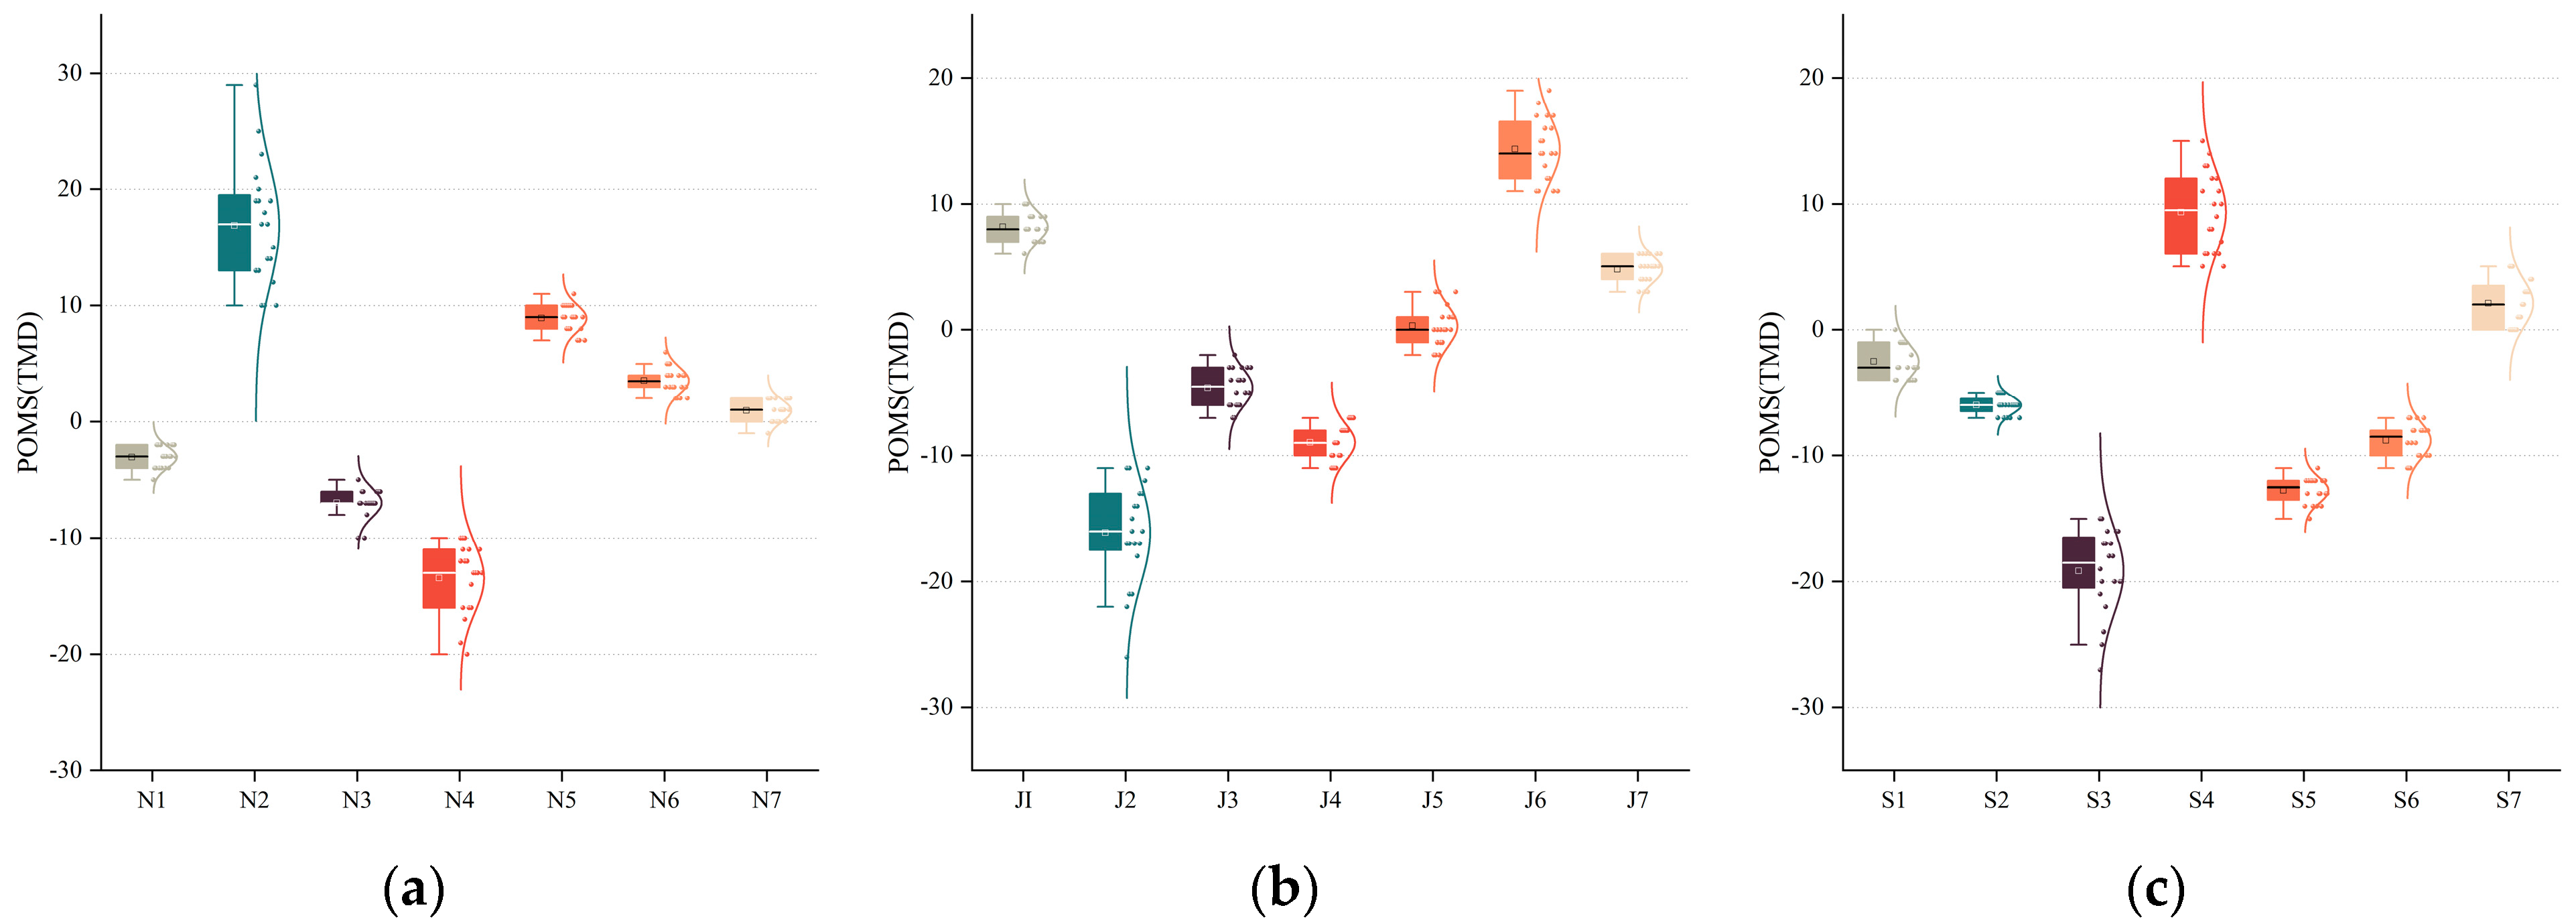
The results showed that the main effect of different audio-visual environmental factors F (1.75, 33.16) = 328.10, p < 0.001, F (2.30, 43.72) = 489.41, p < 0.001, and F (3.05, 57.93) = 471.14, p < 0.001 was statistically significant on POMS (TMD), as shown in Table 8. Due to the differences in the levels of audio-visual environmental factors between the 21 walking spaces (Figure 7), N2, N5, N6, J1, J6, J7, and S4 walking spaces increased negative emotions, the remaining walking spaces promoted positive emotions, and POMS(TMD) was significantly higher in the fourth category of walking spaces than in the first and the second categories of walking spaces (p < 0.001), and the third category of walking spaces was significantly higher than in the second category of walking spaces (p < 0.001).
Examining mood fluctuations allows us to pinpoint specific areas that feel confined and restricted due to inadequate design considerations, resulting in a sense of emptiness and inappropriateness. These spaces contribute to a less favorable pedestrian experience. For instance, Plaza J7 serves as a prime example of these characteristics, as indicated by its lower SED score. Similarly, Walking Space N6 is surrounded by an extensive area of ground cover plants but lacks nearby buildings, further emphasizing its unwelcoming nature. Some spaces create a tense atmosphere due to heavy traffic and the sheer volume of vehicles passing through them. This can lead to discomfort for pedestrians. Notable examples include N2, the primary road on campus characterized by dense traffic, and S1, a walking space near the campus gate. Conversely, some spaces come to life and become more intriguing due to the presence of people passing through, interacting, and communicating with one another, for example, J5, which is a compact walking space characterized by higher foot traffic, reduced noise levels, and a cleaner, more self-contained environment.

3.4. Prediction of Audio-Visual Environmental Factors and Emotions

This research employed multiple linear regression models to investigate the impact of various audio-visual environmental factors on the perception of walking emotions. The aim was to conduct a comprehensive analysis of the characteristics required for a campus environment that encourages enjoyable walking, offering practical reference suggestions for campus walking space design. This study excluded factors related to AFI and VE as they were not associated with physiological indicators or subjective evaluation indicators, and, therefore, they were not included in the model analysis (Table 9, Table 10, Table 11 and Table 12).
The table presents compelling evidence that different audio-visual environmental factors significantly influence both physiological indicators and subjective evaluation indicators when assessing emotion changes ( R 2 > 60). All three models passed the F-test, with test coefficients of 391.073, 459.667, and 125.423, respectively. Notably, GVI emerged as the dominant factor among the visual environmental factors, exhibiting substantial effects on physiological indicators and subjective evaluation indicators in all three models. The β coefficients for GVI were −0.792, −0.834, and −0.897.

4. Discussion

This study investigated the impact of various audio-visual environmental factors on the emotional experience of walking on campuses. Based on previous studies [32,33], this study combined these factors with physiological indicators of emotion and subjective evaluations to explore the underlying mechanisms. This study aimed to optimize campus walking spaces based on these audio-visual environmental factors. This study conducted field measurements to ensure ecological validity and employed real-time objective physiological indicators, including RR.mean and RMSSD, which were measured using portable electrocardiograph devices. These devices, combined with heart rate variability analysis, offered accurate and objective insights into individuals’ cognitive and emotional responses in built environments.
Unlike previous studies that often focused on urban streets and public spaces [34,35], this research concentrated on campuses, examining specific locations and populations. Prior research has shown that walking in green environments yields more favorable psychological and physiological responses than in suburban settings [36,37,38]. Creating successful walkable environments necessitates attention to various physical factors, including pedestrian facilities, safety, and comfortable walking spaces [39,40,41]. Increased pedestrian spaces, pedestrian-guided facilities, and green areas are associated with higher pedestrian satisfaction levels [42].
The field experiments involving 21 pedestrian spaces revealed that all visual environment factors significantly influenced emotion. Among these factors, spatial form features (SEI) and spatial environmental features (GVI and SVI) played crucial roles in affecting emotion, especially concerning physiological effects. In particular, the GVI emerged as the dominant factor influencing emotional effects, aligning with prior research emphasizing the significance of greenery in elevating the overall experiences of pedestrians [43].
Previous research has indicated a significant correlation between noise satisfaction and overall environmental satisfaction [44]. This study corroborated these findings by demonstrating that quieter walking areas led to more positive emotional experiences for walkers. Thus, noise considerations are crucial in designing walking spaces. Each audio-visual environmental factor had a combined effect on emotion, with the combined effect of GVI, SEI, SVI, SFI, AFI, VE, and L A e q emerging as a key factor influencing emotion. In contrast to prior studies that solely examined the impact of audio-visual environmental factors on emotion perception, this research took a step further by exploring the combined effects of these factors on emotion. Additionally, Li and Kang, in a previous study [45], discovered that when environments were presented as audio-visual interactions, participants exhibited responses that closely aligned with those evoked by the simulated situation, and their physiological sensations were more in sync with their subjective perceptions. To enhance environmental quality planning and renovation strategies, an integration of visual and auditory environmental factors is imperative. This entails enriching the hierarchy of the campus plant landscape, enhancing road pavement construction, strategically situating public facilities, introducing enclosed spaces, simplifying interface complexity, mitigating noise pollution, and cultivating pedestrian-friendly campus pathways. These measures collectively promote a heightened sense of comfort for pedestrians, both subjectively and physiologically.
This study revealed that combining physiological and emotional data provided a more comprehensive reflection of the emotional responses. The process of emotion and mood development initially begins with an affective appraisal of the situation and is subsequently accompanied by physiological changes within the body [46]. The comparative results of this study indicate that there are some differences between the emotional data captured by physiological sensors and the environmental experiences expressed by participants in questionnaires, effectively depicting changes in emotions. Therefore, this paper recommends the inclusion of physiological indicators as complementary measures to subjective assessments when evaluating the overall quality of campus pedestrian spaces.
Advancements in neurocognitive science and technological progress in the measurement and analysis of electrophysiological signals have paved the way for novel opportunities in directly observing human emotional experiences. While emotions may appear complex, psychologists have simplified most emotions into a two-dimensional model comprising emotional valence and arousal [47]. Based on this two-dimensional emotion model, the Center for Emotion Research at the U.S. Department of Mental Health, through extensive experiments with picture emotion stimuli, has found that these two dimensions can be effectively reflected through electrocardiographic and other physiological signals. Some studies have even demonstrated that both dimensions of emotion can be recorded by measuring physiological responses. In this research domain, the collection of subjective and objective data from walkers is pivotal in understanding their relationship with the audio-visual environment within the walking space.
However, there are some limitations to the study. Experimenters’ familiarity with the campus environment can influence physiological and psychological responses to the same walking space. Participants familiar with the environment tend to be more sensitive to its nuances. In real-world environments, individuals often perform other tasks other than fully experiencing their surroundings. In such cases, audio-visual perceptions may be affected by salience, an attentional mechanism used to passively or actively filter out elements that stand out from the environment. Future studies on auditory environmental factors should consider overall sound complexity and the impact of specific sound sources on emotion.
With the continuous development of technology, audio-visual experiments increasingly use virtual reality (VR) technology to present environments [48,49]. In the future, research can explore how to integrate physiological measurements with VR instruments and incorporate additional physiological indices.
Therefore, in future research, the effects of audio-visual environments on physiological emotion indicators and subjective evaluations can be further investigated. This can be explored from the perspectives of audio-visual coordination, audio-visual salience, and audio-visual preferences.

5. Conclusions

This paper conducted a field study investigating the relationship between audio-visual environmental factors and physiological as well as subjective evaluation indicators of walking emotion in 21 campus walking spaces. The focus was on a combination of subjective and objective measures. This paper experimentally examined the impact of different audio-visual environmental factors on walkers’ physiology using two indicators, RR.mean and RMSSD. Additionally, this research analyzed the effects of audio-visual environmental factors on the subjective aspect of walking emotion by assessing the Total Mood Disturbance (TMD) through the Profile of Mood States (POMS). This study reveals the following:
  • Walking emotion was influenced by various audio-visual environmental factors. Specifically, audio-visual factors such as GVI, SEI, SFI, and VE showed positive correlations with physiological emotion indicators (RR.mean and RMSSD), while SVI and LAeq exhibited negative correlations with these physiological indicators. Furthermore, GVI, SEI, and SFI displayed negative correlations with Total Mood Disturbance (TMD), whereas SVI, AFI, and LAeq displayed positive correlations with TMD. Among these factors, GVI, SEI, and SVI had a more pronounced effect on emotion.
  • Various proportions of audio-visual environmental factors exhibited significant impacts on emotions. Interestingly, these same combinations did not produce the same effects in physiological and subjective emotional assessments. Therefore, this paper recommends the inclusion of physiological indicators as complementary measures to subjective assessments when evaluating the overall quality of campus pedestrian spaces. The GVI ranged from 31.64 to 56.74, SEI ranged from 36.49 to 56.66, SVI ranged from 13.55 to 27.76, SFI ranged from 21.15 to 32.89, AFI ranged from 0.12 to 2.17, and VE ranged from 1.71 to 3.21, L A e q ranged from 45.97 to 55.00. According to the experimental results of this study, the audio-visual environmental factors range of categories 1 and 2 walking space, and the sound environmental quality standard for noise GB 3096-2008, the audio-visual environmental factors in the above threshold range can better promote positive emotions and contributes to the sustainable development of the campus environment.
  • This study has developed multiple linear regression models to analyze the relationships between audio-visual environmental factors and emotional physiological and psychological changes within campus walking spaces. These models offer valuable guidance for optimizing the design of audio-visual environmental factors in campus walking spaces. By improving the comfort of the audio-visual environment, research can enhance pedestrians’ emotional experiences and elevate the overall quality of the campus environment.
Drawing from walkers’ physiological indicators and subjective evaluations of the real-time audio-visual environment, this study can optimally balance different audio-visual environmental factors to assist designers in creating campus walking spaces. This approach includes planning the sound pressure level within a specific visual environment and designing appropriate visual environmental factors within a particular acoustic environment. Ultimately, this helps in designing campus walking spaces that offer an appealing and comfortable environment, enhancing the emotional experience of walkers. This study is expected to provide valuable insights for urban planners, administrators, and landscape architects in designing campus walking spaces that offer a highly enjoyable experience while promoting environmental sustainability.

Author Contributions

Conceptualization, Y.M. and J.Z.; methodology, Y.M. and J.Z.; software, Y.M.; validation, Y.M., J.Z. and X.Y.; formal analysis, J.Z.; investigation, Y.M.; resources, J.Z.; data curation, X.Y.; writing—original draft preparation, Y.M.; writing—review and editing, J.Z.; visualization, Y.M.; supervision, X.Y.; project administration, X.Y. All authors have read and agreed to the published version of the manuscript.

Funding

This research received no external funding.

Institutional Review Board Statement

According to relevant policies and regulations, the questionnaires and experiments in the article do not involve human life science and medical research and have no influence or harm on the participants. Research does not involve sensitive personal information. It has no commercial interests and the anonymous information and data used can undergo ethical review.

Informed Consent Statement

Not applicable.

Data Availability Statement

Not applicable.

Conflicts of Interest

The authors declare no conflict of interest.

References

  1. Khorsheed, J.B.; Goriel, W.A.S. Analytical Study of University Campuses’ Walkability using Space Syntax Analysis: University of Duhok (UoD) as a Case Study. J. Eng. Res. 2021, 9, 15. [Google Scholar] [CrossRef]
  2. Pae, G.; Akar, G. Effects of walking on self-assessed health status: Links between walking, trip purposes and health. J. Transp. Health 2020, 18, 100901. [Google Scholar] [CrossRef]
  3. LaJeunesse, S.; Ryus, P.; Kumfer, W.; Kothuri, S.; Nordback, K. Measuring Pedestrian Level of Stress in Urban Environments: Naturalistic Walking Pilot Study. Transp. Res. Rec. 2021, 2675, 109–119. [Google Scholar] [CrossRef]
  4. Ma, J.; Lin, P.; Williams, J. Effectiveness of nature-based walking interventions in improving mental health in adults: A systematic review. Curr. Psychol. 2023, 1–19. [Google Scholar] [CrossRef]
  5. O’Connor, R.C.; Wetherall, K.; Cleare, S.; McClelland, H.; Melson, A.J.; Niedzwiedz, C.L.; O’Carroll, R.E.; O’Connor, D.B.; Platt, S.; Scowcroft, E.; et al. Mental health and well-being during the COVID-19 pandemic: Longitudinal analyses of adults in the UK COVID-19 Mental Health & Wellbeing study. Br. J. Psychiatry 2020, 218, 326–333. [Google Scholar] [CrossRef]
  6. Kelly, B.D.; Gulati, G.; Cullen, W. Mental health in the COVID-19 pandemic. QJM Int. J. Med. 2020, 113, 311–312. [Google Scholar] [CrossRef]
  7. Schertz, K.E.; Bowman, J.E.; Kotabe, H.P.; Layden, E.A.; Zhen, J.; Lakhtakia, T.; Lyu, M.; Paraschos, O.A.; Van Hedger, S.C.; Rim, N.W.; et al. Environmental influences on affect and cognition: A study of natural and commercial semi-public spaces. J. Environ. Psychol. 2022, 83, 101852. [Google Scholar] [CrossRef]
  8. Veitch, J.; Timperio, A.; Salmon, J.; Hall, S.J.; Abbott, G.; Flowers, E.P.; Turner, A.I. Examination of the acute heart rate and salivary cortisol response to a single bout of walking in urban and green environments: A pilot study. Urban For. Urban Green. 2022, 74, 127660. [Google Scholar] [CrossRef]
  9. Sacchelli, S.; Grilli, G.; Capecchi, I.; Bambi, L.; Barbierato, E.; Borghini, T. Neuroscience Application for the Analysis of Cultural Ecosystem Services Related to Stress Relief in Forest. Forests 2020, 11, 190. [Google Scholar] [CrossRef]
  10. Yuan, S.; Browning, M.; McAnirlin, O.; Sindelar, K.; Shin, S.; Drong, G.; Hoptman, D.; Heller, W. A virtual reality investigation of factors influencing landscape preferences: Natural elements, emotions, and media creation. Landsc. Urban Plan. 2023, 230, 104616. [Google Scholar] [CrossRef]
  11. Flowers, E.P.; Turner, A.I.; Abbott, G.; Timperio, A.; Salmon, J.; Veitch, J. People with the least positive attitudes to green exercise derive most anxiolytic benefit from walking in green space. Urban For. Urban Green. 2022, 72, 127587. [Google Scholar] [CrossRef]
  12. Lin, W.; Chen, Q.; Jiang, M.; Tao, J.; Liu, Z.; Zhang, X.; Wu, L.; Xu, S.; Kang, Y.; Zeng, Q. Sitting or Walking? Analyzing the Neural Emotional Indicators of Urban Green Space Behavior with Mobile EEG. J. Urban Health 2020, 97, 191–203. [Google Scholar] [CrossRef]
  13. Jevtic, M.; Matkovic, V.; Paut Kusturica, M.; Bouland, C. Build Healthier: Post-COVID-19 Urban Requirements for Healthy and Sustainable Living. Sustainability 2022, 14, 9274. [Google Scholar] [CrossRef]
  14. Ma, X.; Chau, C.K.; Lai, J.H.K. Critical factors influencing the comfort evaluation for recreational walking in urban street environments. Cities 2021, 116, 103286. [Google Scholar] [CrossRef]
  15. Pandita, S.; Mishra, H.G.; Chib, S. Psychological impact of covid-19 crises on students through the lens of Stimulus-Organism-Response (SOR) model. Child. Youth Serv. Rev. 2021, 120, 105783. [Google Scholar] [CrossRef]
  16. Berkouk, D.; Bouzir, T.A.K.; Boucherit, S.; Khelil, S.; Mahaya, C.; Matallah, M.E.; Mazouz, S. Exploring the Multisensory Interaction between Luminous, Thermal and Auditory Environments through the Spatial Promenade Experience: A Case Study of a University Campus in an Oasis Settlement. Sustainability 2022, 14, 4013. [Google Scholar] [CrossRef]
  17. Gehrlach, D.A.; Dolensek, N.; Klein, A.S.; Roy Chowdhury, R.; Matthys, A.; Junghänel, M.; Gaitanos, T.N.; Podgornik, A.; Black, T.D.; Reddy Vaka, N.; et al. Aversive state processing in the posterior insular cortex. Nat. Neurosci. 2019, 22, 1424–1437. [Google Scholar] [CrossRef]
  18. Choi, I.; Lee, J.Y.; Lee, S.H. Bottom-up and top-down modulation of multisensory integration. Curr. Opin. Neurobiol. 2018, 52, 115–122. [Google Scholar] [CrossRef]
  19. Ha, J.; Kim, H.J. The restorative effects of campus landscape biodiversity: Assessing visual and auditory perceptions among university students. Urban For. Urban Green. 2021, 64, 127259. [Google Scholar] [CrossRef]
  20. Gray, J.M.; Tully, E.C. Cognitive reappraisal moderates the quadratic association between heart rate variability and negative affectivity. Psychophysiology 2020, 57, e13584. [Google Scholar] [CrossRef]
  21. Dijkhuis, R.R.; Ziermans, T.; van Rijn, S.; Staal, W.; Swaab, H. Emotional Arousal During Social Stress in Young Adults with Autism: Insights from Heart Rate, Heart Rate Variability and Self-Report. J. Autism Dev. Disord. 2019, 49, 2524–2535. [Google Scholar] [CrossRef] [PubMed]
  22. Hong, J.; He, J.; Lam, B.; Gupta, R.; Gan, W.-S. Spatial Audio for Soundscape Design: Recording and Reproduction. Appl. Sci. 2017, 7, 627. [Google Scholar] [CrossRef]
  23. Aletta, F.; Kang, J.; Axelsson, Ö. Soundscape descriptors and a conceptual framework for developing predictive soundscape models. Landsc. Urban Plan. 2016, 149, 65–74. [Google Scholar] [CrossRef]
  24. Hong, J.Y.; Lam, B.; Ong, Z.-T.; Ooi, K.; Gan, W.-S.; Kang, J.; Feng, J.; Tan, S.-T. Quality assessment of acoustic environment reproduction methods for cinematic virtual reality in soundscape applications. Build. Environ. 2019, 149, 1–14. [Google Scholar] [CrossRef]
  25. Horacek, T.M.; Yildirim, E.D.; Kattelmann, K.; Brown, O.; Byrd-Bredbenner, C.; Colby, S.; Greene, G.; Hoerr, S.; Kidd, T.; Koenings, M.M.; et al. Path Analysis of Campus Walkability/Bikeability and College Students’ Physical Activity Attitudes, Behaviors, and Body Mass Index. Am. J. Health Promot. 2018, 32, 578–586. [Google Scholar] [CrossRef]
  26. Misra, A.; Dhurandhar, N.V. Current formula for calculating body mass index is applicable to Asian populations. Nutr. Diabetes 2019, 9, 3. [Google Scholar] [CrossRef]
  27. Sánchez Fernández, L.P. Environmental noise indicators and acoustic indexes based on fuzzy modelling for urban spaces. Ecol. Indic. 2021, 126, 107631. [Google Scholar] [CrossRef]
  28. Shoushan, M.M.; Alexander Reyes, B.; Rodriguez, A.M.; Woon Chong, J. Contactless Heart Rate Variability (HRV) Estimation Using a Smartphone during Respiratory Maneuvers and Body Movement. In Proceedings of the 2021 43rd Annual International Conference of the IEEE Engineering in Medicine & Biology Society (EMBC), Online, Mexico, 1–5 November 2021; Volume 2021, pp. 84–87. [Google Scholar] [CrossRef]
  29. Umair, M.; Chalabianloo, N.; Sas, C.; Ersoy, C. HRV and Stress: A Mixed-Methods Approach for Comparison of Wearable Heart Rate Sensors for Biofeedback. IEEE Access 2021, 9, 14005–14024. [Google Scholar] [CrossRef]
  30. Lochbaum, M.; Zanatta, T.; Kirschling, D.; May, E. The Profile of Moods States and Athletic Performance: A Meta-Analysis of Published Studies. Eur. J. Investig. Health Psychol. Educ. 2021, 11, 50–70. [Google Scholar] [CrossRef]
  31. Liu, Y.P.; Hu, M.J.; Zhao, B. Audio-visual interactive evaluation of the forest landscape based on eye-tracking experiments. Urban For. Urban Green. 2019, 46, 11. [Google Scholar] [CrossRef]
  32. Kadiri, S.R.; Alku, P. Subjective Evaluation of Basic Emotions from Audio-Visual Data. Sensors 2022, 22, 4931. [Google Scholar] [CrossRef] [PubMed]
  33. Felcyn, J.; Preis, A.; Praszkowski, M.; Wrzosek, M. Assessment of Audio-Visual Environmental Stimuli. Complementarity of Comfort and Discomfort Scales. Arch. Acoust. 2021, 46, 279–288. [Google Scholar] [CrossRef]
  34. Hooper, P.; Boruff, B.; Beesley, B.; Badland, H.; Giles-Corti, B. Testing spatial measures of public open space planning standards with walking and physical activity health outcomes: Findings from the Australian national liveability study. Landsc. Urban Plan. 2018, 171, 57–67. [Google Scholar] [CrossRef]
  35. Jo, H.I.; Jeon, J.Y. Overall environmental assessment in urban parks: Modelling audio-visual interaction with a structural equation model based on soundscape and landscape indices. Build. Environ. 2021, 204, 108166. [Google Scholar] [CrossRef]
  36. de Brito, J.N.; Pope, Z.C.; Mitchell, N.R.; Schneider, I.E.; Larson, J.M.; Horton, T.H.; Pereira, M.A. The effect of green walking on heart rate variability: A pilot crossover study. Environ. Res. 2020, 185, 109408. [Google Scholar] [CrossRef]
  37. Aziz, N.A.A.; Shian, L.Y.; Mokhtar, M.D.M.; Raman, T.L.; Saikim, F.H.; Chen, W.; Nordin, N.M. Effectiveness of urban green space on undergraduates’ stress relief in tropical city: A field experiment in Kuala Lumpur. Urban For. Urban Green. 2021, 63, 127236. [Google Scholar] [CrossRef]
  38. Encho, H.; Uchida, K.; Horibe, K.; Nakatsuka, K.; Ono, R. Walking and perception of green space among older adults in Japan: Subgroup analysis based self-efficacy. Health Promot. Int. 2023, 38, daac175. [Google Scholar] [CrossRef] [PubMed]
  39. Gerike, R.; Koszowski, C.; Schröter, B.; Buehler, R.; Schepers, P.; Weber, J.; Wittwer, R.; Jones, P. Built Environment Determinants of Pedestrian Activities and Their Consideration in Urban Street Design. Sustainability 2021, 13, 9362. [Google Scholar] [CrossRef]
  40. Oviedo, D.; Okyere, S.A.; Nieto, M.; Kita, M.; Kusi, L.F.; Yusuf, Y.; Koroma, B. Walking off the beaten path: Everyday walking environment and practices in informal settlements in Freetown. Res. Transp. Bus. Manag. 2021, 40, 100630. [Google Scholar] [CrossRef]
  41. Hillnhütter, H. Stimulating urban walking environments—Can we measure the effect? Env. Plan. B Urban Anal. City Sci. 2022, 49, 275–289. [Google Scholar] [CrossRef]
  42. Lee, S.; Han, M.; Rhee, K.; Bae, B. Identification of Factors Affecting Pedestrian Satisfaction toward Land Use and Street Type. Sustainability 2021, 13, 10725. [Google Scholar] [CrossRef]
  43. Gozalo, G.R.; Morillas, J.M.B.; Gonzalez, D.M.; Moraga, P.A. Relationships among satisfaction, noise perception, and use of urban green spaces. Sci. Total Environ. 2018, 624, 438–450. [Google Scholar] [CrossRef] [PubMed]
  44. Scherer, K.R. Evidence for the Existence of Emotion Dispositions and the Effects of Appraisal Bias. Emotion 2021, 21, 1224–1238. [Google Scholar] [CrossRef] [PubMed]
  45. Li, Z.Z.; Kang, J. Sensitivity analysis of changes in human physiological indicators observed in soundscapes. Landsc. Urban Plan. 2019, 190, 103593. [Google Scholar] [CrossRef]
  46. Mellouk, W.; Handouzi, W. CNN-LSTM for automatic emotion recognition using contactless photoplythesmographic signals. Biomed. Signal Process. Control 2023, 85, 104907. [Google Scholar] [CrossRef]
  47. Albraikan, A.; Tobon, D.P.; El Saddik, A. Toward User-Independent Emotion Recognition Using Physiological Signals. IEEE Sens. J. 2019, 19, 8402–8412. [Google Scholar] [CrossRef]
  48. Jo, H.I.; Jeon, J.Y. Perception of urban soundscape and landscape using different visual environment reproduction methods in virtual reality. Appl. Acoust. 2022, 186, 108498. [Google Scholar] [CrossRef]
  49. Puyana-Romero, V.; Lopez-Segura, L.S.; Maffei, L.; Hernandez-Molina, R.; Masullo, M. Interactive Soundscapes: 360 degrees-Video Based Immersive Virtual Reality in a Tool for the Participatory Acoustic Environment Evaluation of Urban Areas. Acta Acust. United Acust. 2017, 103, 574–588. [Google Scholar] [CrossRef]
Figure 1. Experimental area. (a) NEFU; (b) JLU (Qianwei Campus); (c) SYAU (Main Campus).
Sustainability 15 15105 g001
Figure 2. Example of equirectangular projection to cylindrical equal-area projection and image semantic segmentation.
Sustainability 15 15105 g002
Figure 3. Experimental flow.
Sustainability 15 15105 g003
Figure 4. HCA of the 21 walking spaces.
Sustainability 15 15105 g004
Figure 5. Differences in subjects’ RR.mean scores across walking spaces at the three schools. (a) NEFU; (b) JLU; (c) SYAU. Only non-significant (ns) and significant differences p < 0.05 (*) and p < 0.01 (**) are labeled in the figure; the rest that is not labeled are significant differences p < 0.001.
Sustainability 15 15105 g005
Figure 6. Differences in subjects’ RMSSD scores across walking spaces at the three schools. (a) NEFU; (b) JLU; (c) SYAU. Only non-significant (ns) and significant differences p < 0.05 (*) and p < 0.01 (**) are labeled in the figure; the rest that is not labeled are significant differences p < 0.001.
Sustainability 15 15105 g006
Figure 7. Differences in subjects’ POMS (TMD) scores across walking spaces at the three schools. (a) NEFU; (b) JLU; (c) SYAU. All three schools in the graph have significant differences in walking space POMS (TMD) scores p < 0.001.
Sustainability 15 15105 g007
Table 1. Physical characteristics of participants.
Participant (no.)GenderAge (Year)Weight (kg)Height (m) BMI   ( kg / m 2 )
28Male23.57 ± 2.0375.07 ± 4.131.78 ± 0.0323.84 ± 1.53
32Female22.56 ± 1.5252.66 ± 1.691.64 ± 0.0219.52 ± 0.16
Table 2. Abbreviations and calculation formulae for audio-visual perception indicators.
Classification of IndicatorsIndicator NameAcronymsFormulaNo.
Visual environmentSpatial patternSpatial enclosure IndexSEI S E D n = W n A n (2)
Spatial environmentGreen Visual IndexGVI G V I n = G n A n = i = 1 i g i i = 1 i a i (3)
Sky Visibility IndexSVI S V I n = V n A n = i = 1 i v i i = 1 i a i (4)
Spatial Feasibility IndexSFI S F I n = W n R n (5)
Visual EntropyVE V E = i = 1 n P i log P i (6)
Space facilitiesAncillary Facilities IndexAFI A F I n = F n A n = i = 1 i f i i = 1 i a i (7)
Auditory environmentEquivalent Continuous A-weighted Sound Pressure Level L A e q L e q   = 10⋅ log 10 ( 1 T t 1 t 2 10 0.1 L ( t ) dt)(8)
W n   is the amount of pixels occupied by buildings, walls, and plants in the panoramic image numbered n;   A n   is the total amount of pixels in the panoramic image numbered n;   G n   is the amount of pixels occupied by natural vegetation in the panoramic image numbered n;   V   n   is the amount of pixels in the sky area in the panoramic image numbered n;   W n   is the amount of pixels for the pavement in the panoramic image of number n;   R n   is the amount of pixels for the carriageway in the panoramic image numbered n;   P i   is the amount of pixels of the element in each photograph;   F n   is the amount of pixels of the walking space appurtenances in the panoramic image numbered n; L e q is the equivalent sound level in decibels (dB); T is the time interval in seconds;   t 1 and   t 2   are the start and end times of the time range for calculating the equivalent sound level, in seconds, respectively; L(t) is the sound level at time t, in decibels (dB).
Table 3. Descriptive statistics of experimental variables.
Variable TypeVariable NameMeanStandard DeviationMinMax
Independent variableGVI31.51 13.18 10.14 56.74
SEI38.07 10.93 13.69 56.66
SVI30.49 10.06 13.55 54.49
SFI27.61 3.44 21.15 32.89
AFI1.23 0.85 0.07 2.89
VE2.33 0.58 1.32 3.24
L A e q 53.07 3.35 45.97 58.83
Implicit variableRR.mean627.11 24.45 573.08 687.20
RMSSD18.65 4.75 8.48 31.53
POMS (TMD)−1.569.91 −26.6329.43
Table 4. Correlations between audio-visual environmental factors and physiological and subjective evaluation indicators.
GVISEISVISFIAFIVE L A e q
RR.mean0.879 **0.804 **−0.725 **0.337 *0.0010.180 **−0.487 **
RMSSD0.888 **0.829 **−0.757 **0.290 *0.0450.149 **−0.391 **
POMS (TMD)−0.768 **−0.652 **0.657 **−0.128 *0.156 **−0.0110.432 *
** and * represent 1% and 5% significance levels, respectively.
Table 5. Results of significance analysis of physiological indicators.
SourceType III Sum of SquaresdfMean SquareFSig.Partial Eta Squared
NEFURR.mean71,059.2913.57219,892.082225.816<0.0010.922
RMSSD3003.9034.426678.673211.545<0.0010.918
JLURR.mean63,092.8923.64817,294.893215.610<0.0010.919
RMSSD2703.4303.801711.320414.159<0.0010.956
SYAURR.mean90,775.0653.18028,548.207210.851<0.0010.917
RMSSD2948.2813.199921.493180.140<0.0010.905
Table 6. Clustering center for audio-visual environmental factors for each category of pedestrian space.
GVISEISVISFIAFIVE L A e q
Category 137.64 43.87 26.27 28.71 1.04 2.39 52.57
Category 256.40 53.55 14.41 26.16 1.90 2.42 50.85
Category 320.97 31.58 34.94 25.32 1.45 2.06 53.98
Category 412.87 16.33 52.10 31.55 0.70 2.90 54.64
Table 7. Descriptive statistics of the audio-visual environmental factors of categories 1 and 2.
GVISEISVISFIAFIVE L A e q
Min31.64 36.49 13.55 21.15 0.12 1.71 45.97
Max56.74 56.66 28.18 32.89 2.17 3.21 58.83
Mean41.7 45.77 23.18 28.08 1.09 2.41 52.40
Table 8. Results of the significance analysis of POMS (TMD) for the subjective evaluation of emotions.
Type III Sum of SquaresdfMean SquareFSig.Partial Eta Squared
NEFU12,200.9351.7456991.178328.100<0.0010.945
JLU13,109.9182.3015697.704489.412<0.0010.963
SYAU10,742.6543.0493523.660471.138<0.0010.961
Table 9. Descriptive statistics of multiple linear regression.
Variable NameVariablesMean
Visual Environmental FactorGVIX₁31.51
SEDX₂38.07
SVIX₃30.49
SFIX₄27.61
AFIX₅1.23
VEX₅2.33
Auditory Environmental Factors L A e q X₇53.07
Explained VariablesRR.meanY₁627.11
RMSSDY₂18.65
POMS (TMD)Y₃−1.56
Table 10. Linear regression model of audio-visual environmental factors with RR.mean.
UnstandardizedStandardized Coefficientsp R 2 FN
BStd. ErrorBeta
(Constant)544.18912.928-0.000 **0.837
0.835
F = 353.644 p = 0.000 **420
GVI1.3940.1090.7340.000 **
SED0.5330.1230.2330.000 **
SVI0.3420.1470.1370.021 *
SFI1.3870.2030.1910.000 **
VE0.3741.0510.0090.722
L A e q −0.5820.175−0.0780.000 **
** and * represent 1% and 5% significance levels, respectively.
Table 11. Linear regression model of audio-visual environmental factors with RMSSD.
UnstandardizedStandardized Coefficientsp R 2 FN
BStd. ErrorBeta
(Constant)−5.3752.542-0.035 *0.833
0.831
F = 343.829 p = 0.000 **420
GVI0.2730.0210.7410.000 **
SED0.1040.0240.2330.000 **
SVI0.0370.0290.0760.205 *
SFI0.2640.040.1870.000 **
VE0.0210.2070.0020.921
L A e q 0.0560.0340.0390.103
** and * represent 1% and 5% significance levels, respectively.
Table 12. Linear regression model of audio-visual environmental factors with POMS (TMD).
UnstandardizedStandardized Coefficientsp R 2 FN
BStd. ErrorBeta
(Constant)−0.2287.705-0.9760.646
0.641
F = 125.423 p = 0.000 **420
GVI−0.6900.065−0.8970.000 **
SED0.1080.0740.1160.145
SVI−0.0460.088−0.0460.601
SFI0.0750.1060.0260.478
AFI2.4380.3540.2050.000 **
L A e q 0.2380.1050.0790.024 *
** and * represent 1% and 5% significance levels, respectively.
Disclaimer/Publisher’s Note: The statements, opinions and data contained in all publications are solely those of the individual author(s) and contributor(s) and not of MDPI and/or the editor(s). MDPI and/or the editor(s) disclaim responsibility for any injury to people or property resulting from any ideas, methods, instructions or products referred to in the content.

