


Urban Rail Transit Station Type Identification Based on “Passenger Flow—Land Use—Job-Housing”


Abstract
:1. Introduction
2. Research Design
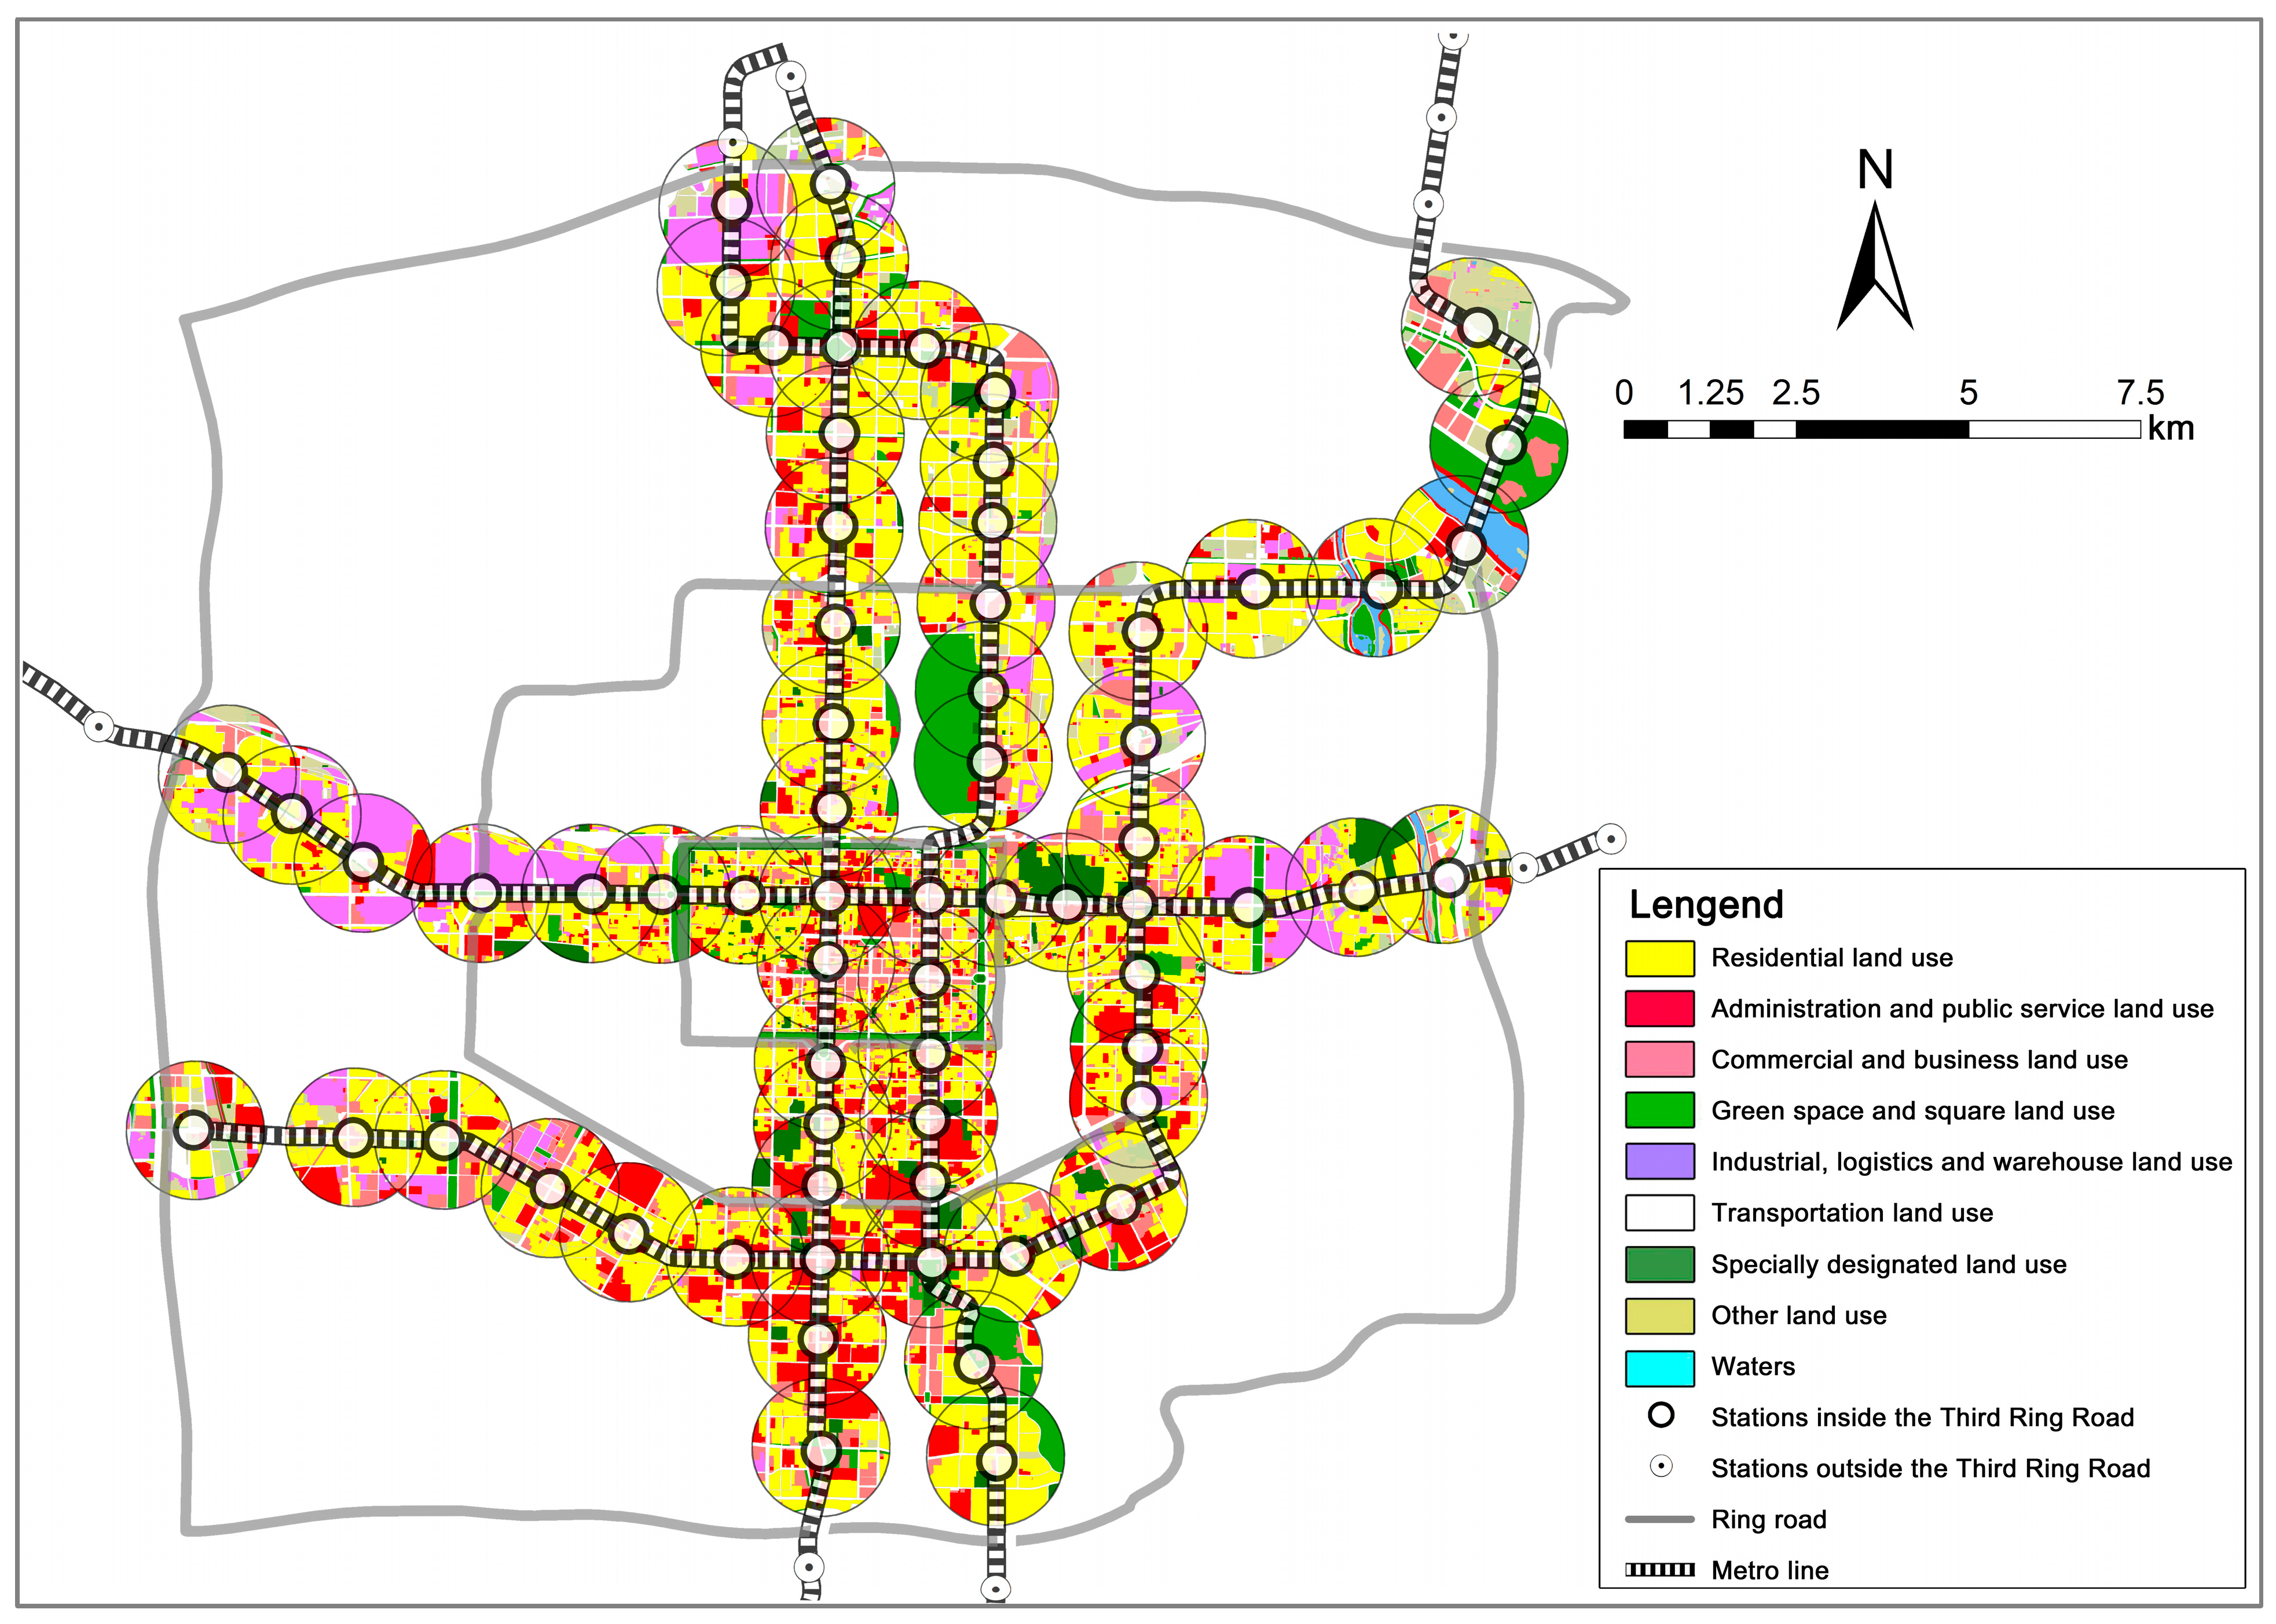
2.1. City Context
2.2. Data Processing
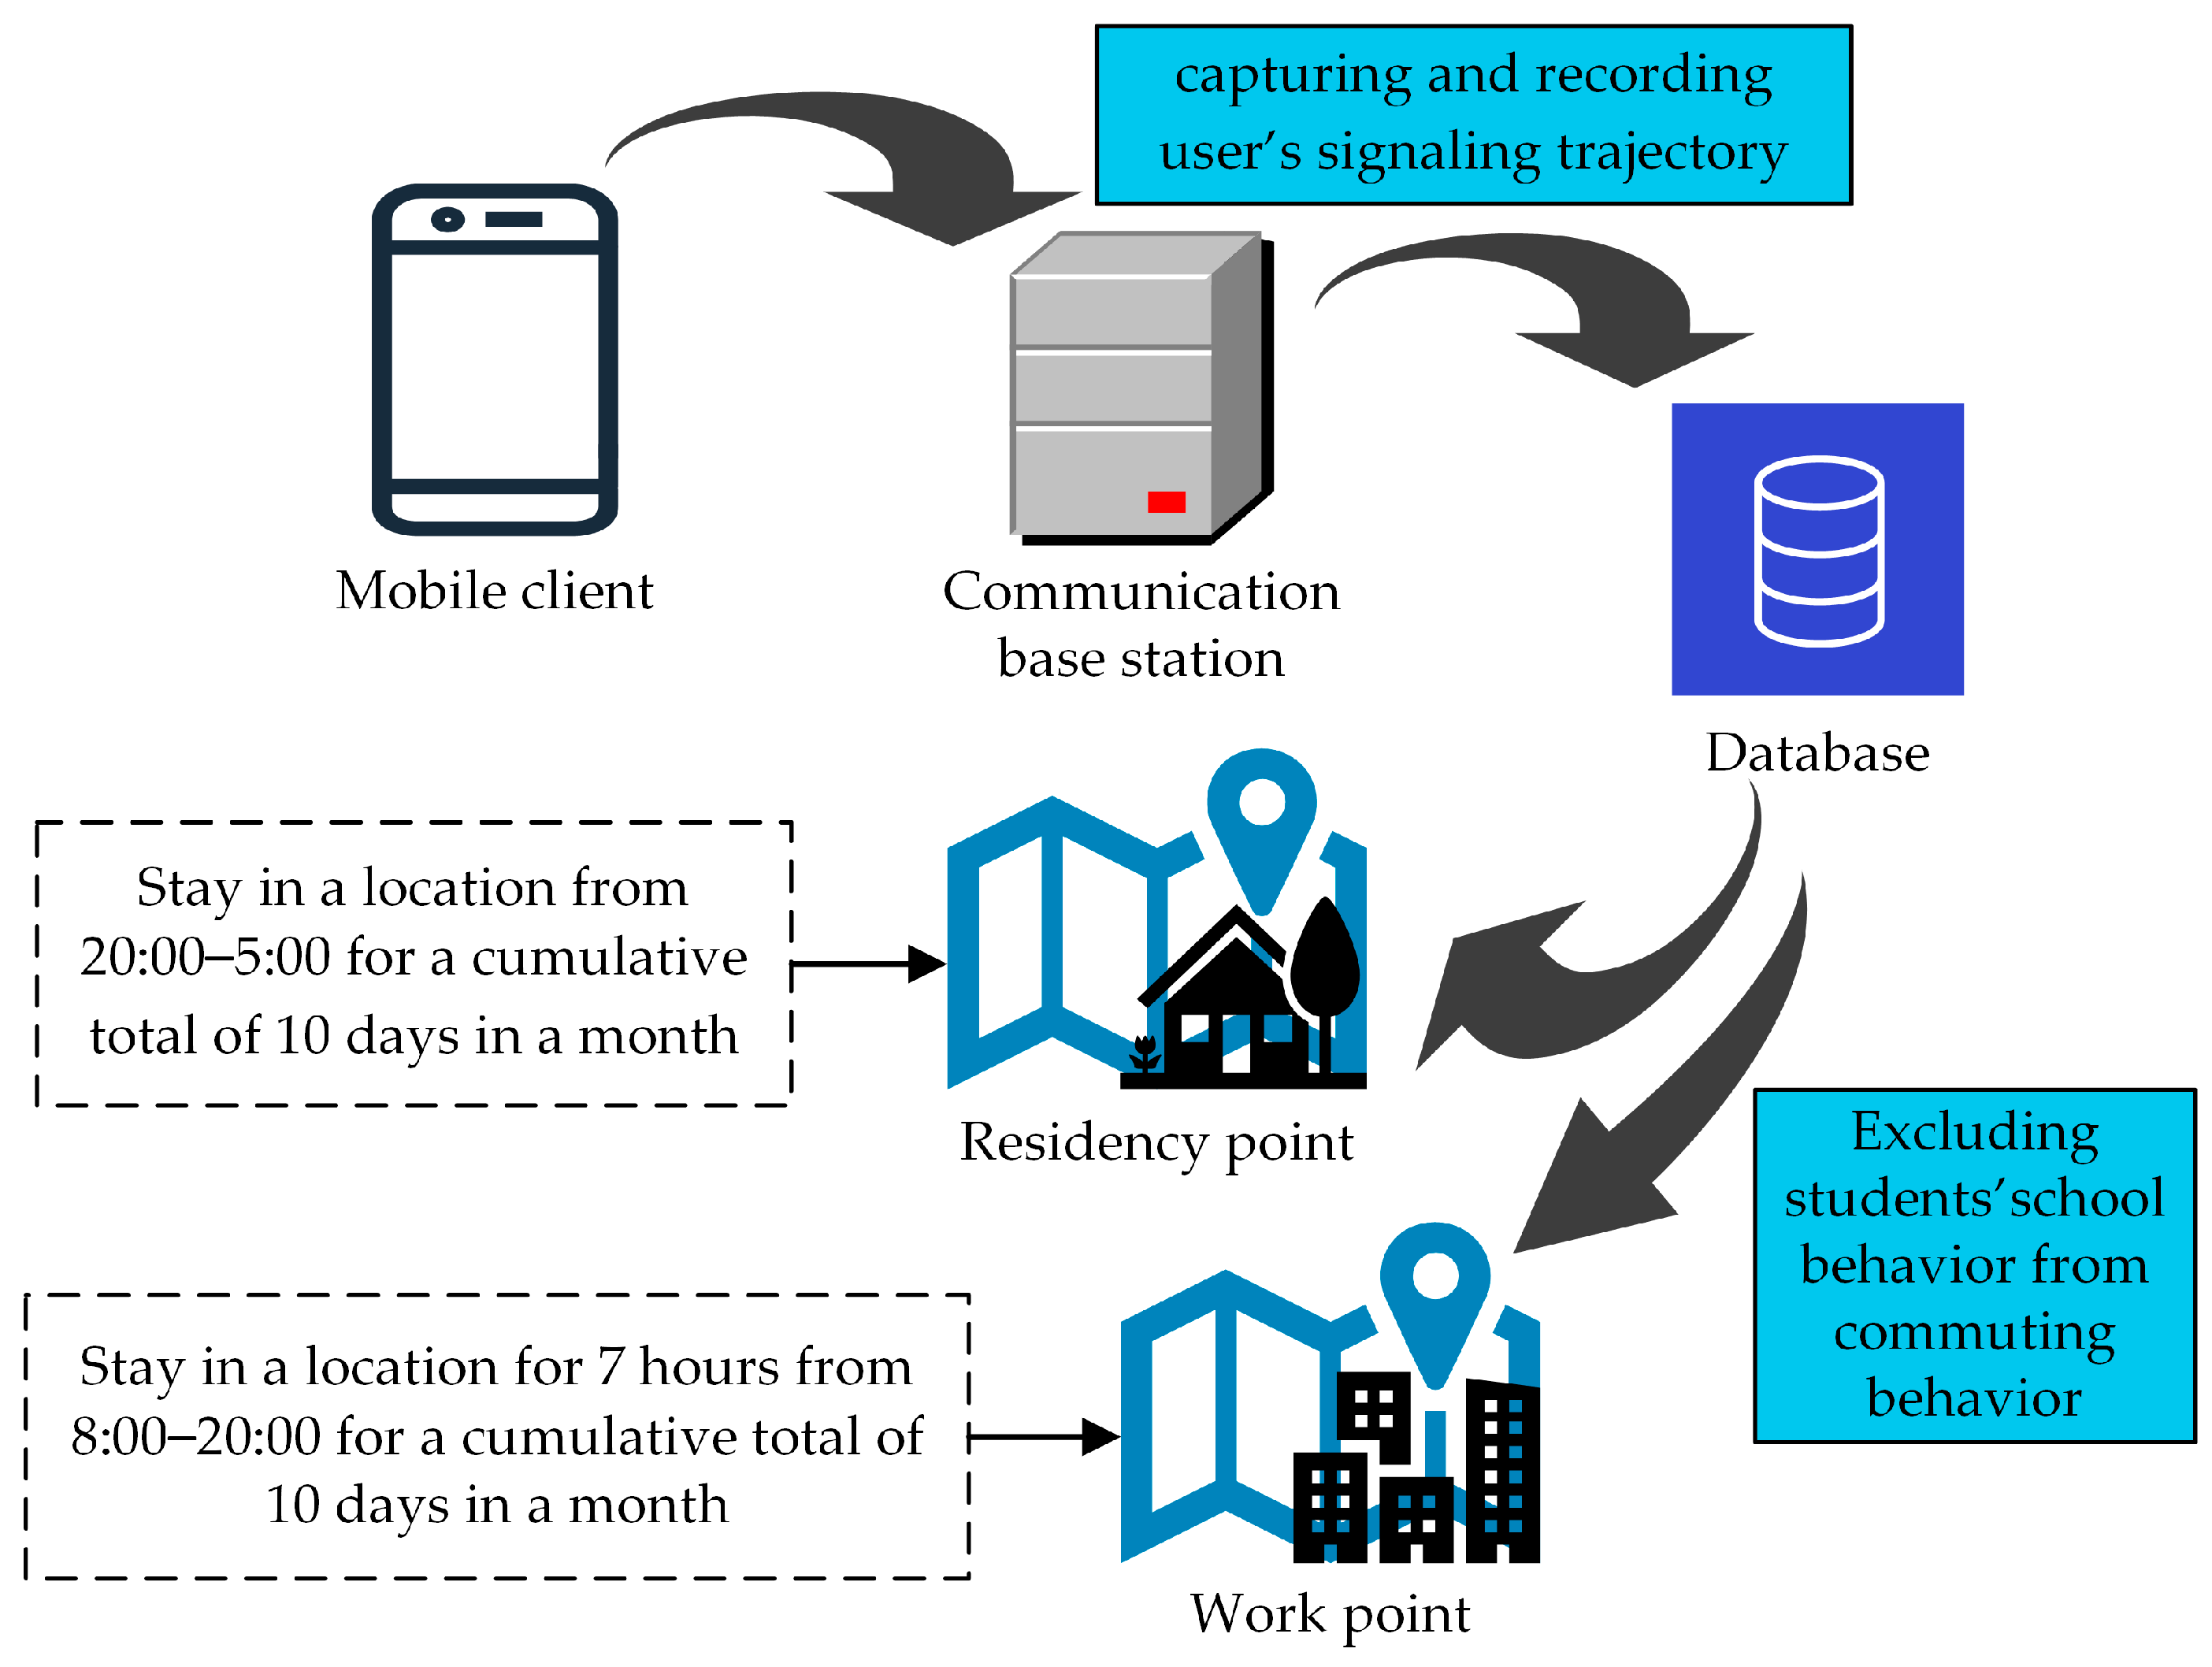
2.2.1. Mobile Phone Signaling Data
- (1)
- The identification and processing of passenger flow in and out of urban rail transit stations
- (2)
- The identification and processing of employed and resident populations
2.2.2. Land Use Data
2.3. Methodology
2.3.1. Hierarchical Clustering Method
2.3.2. K-Means Clustering Algorithm
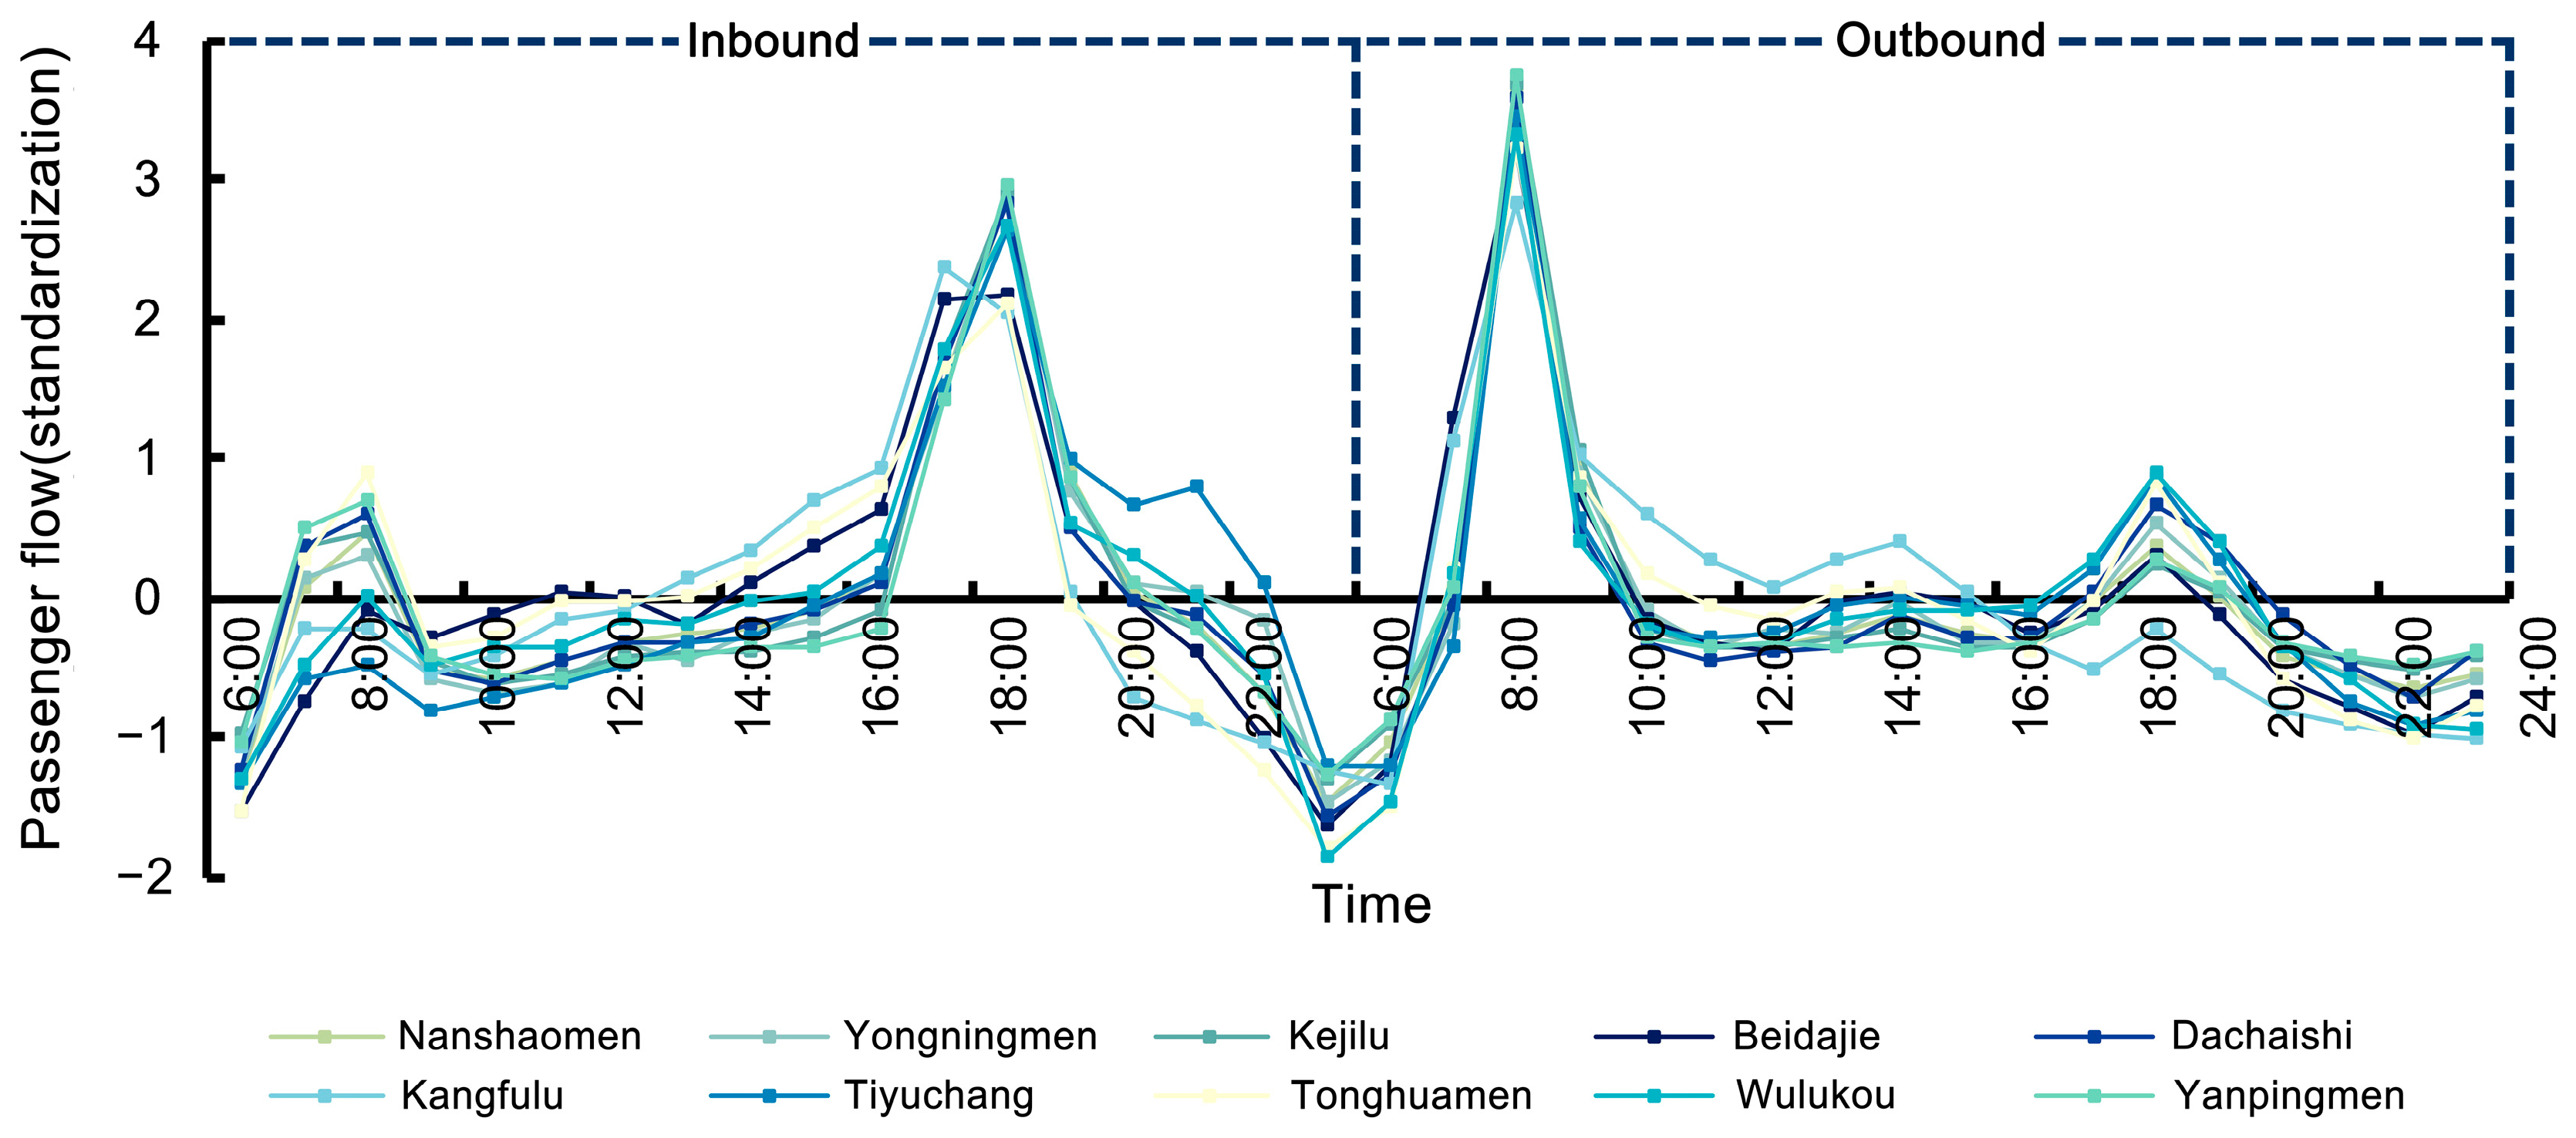
2.3.3. Measurements of Passenger Flow Time Series and Intensity Characteristics
- (1)
- Passenger flow time series characteristics
- (2)
- Passenger flow intensity characteristics
2.3.4. Measurements of Land Use Structure Characteristics
2.3.5. Measurements of Job–Housing Population Characteristics
3. Results
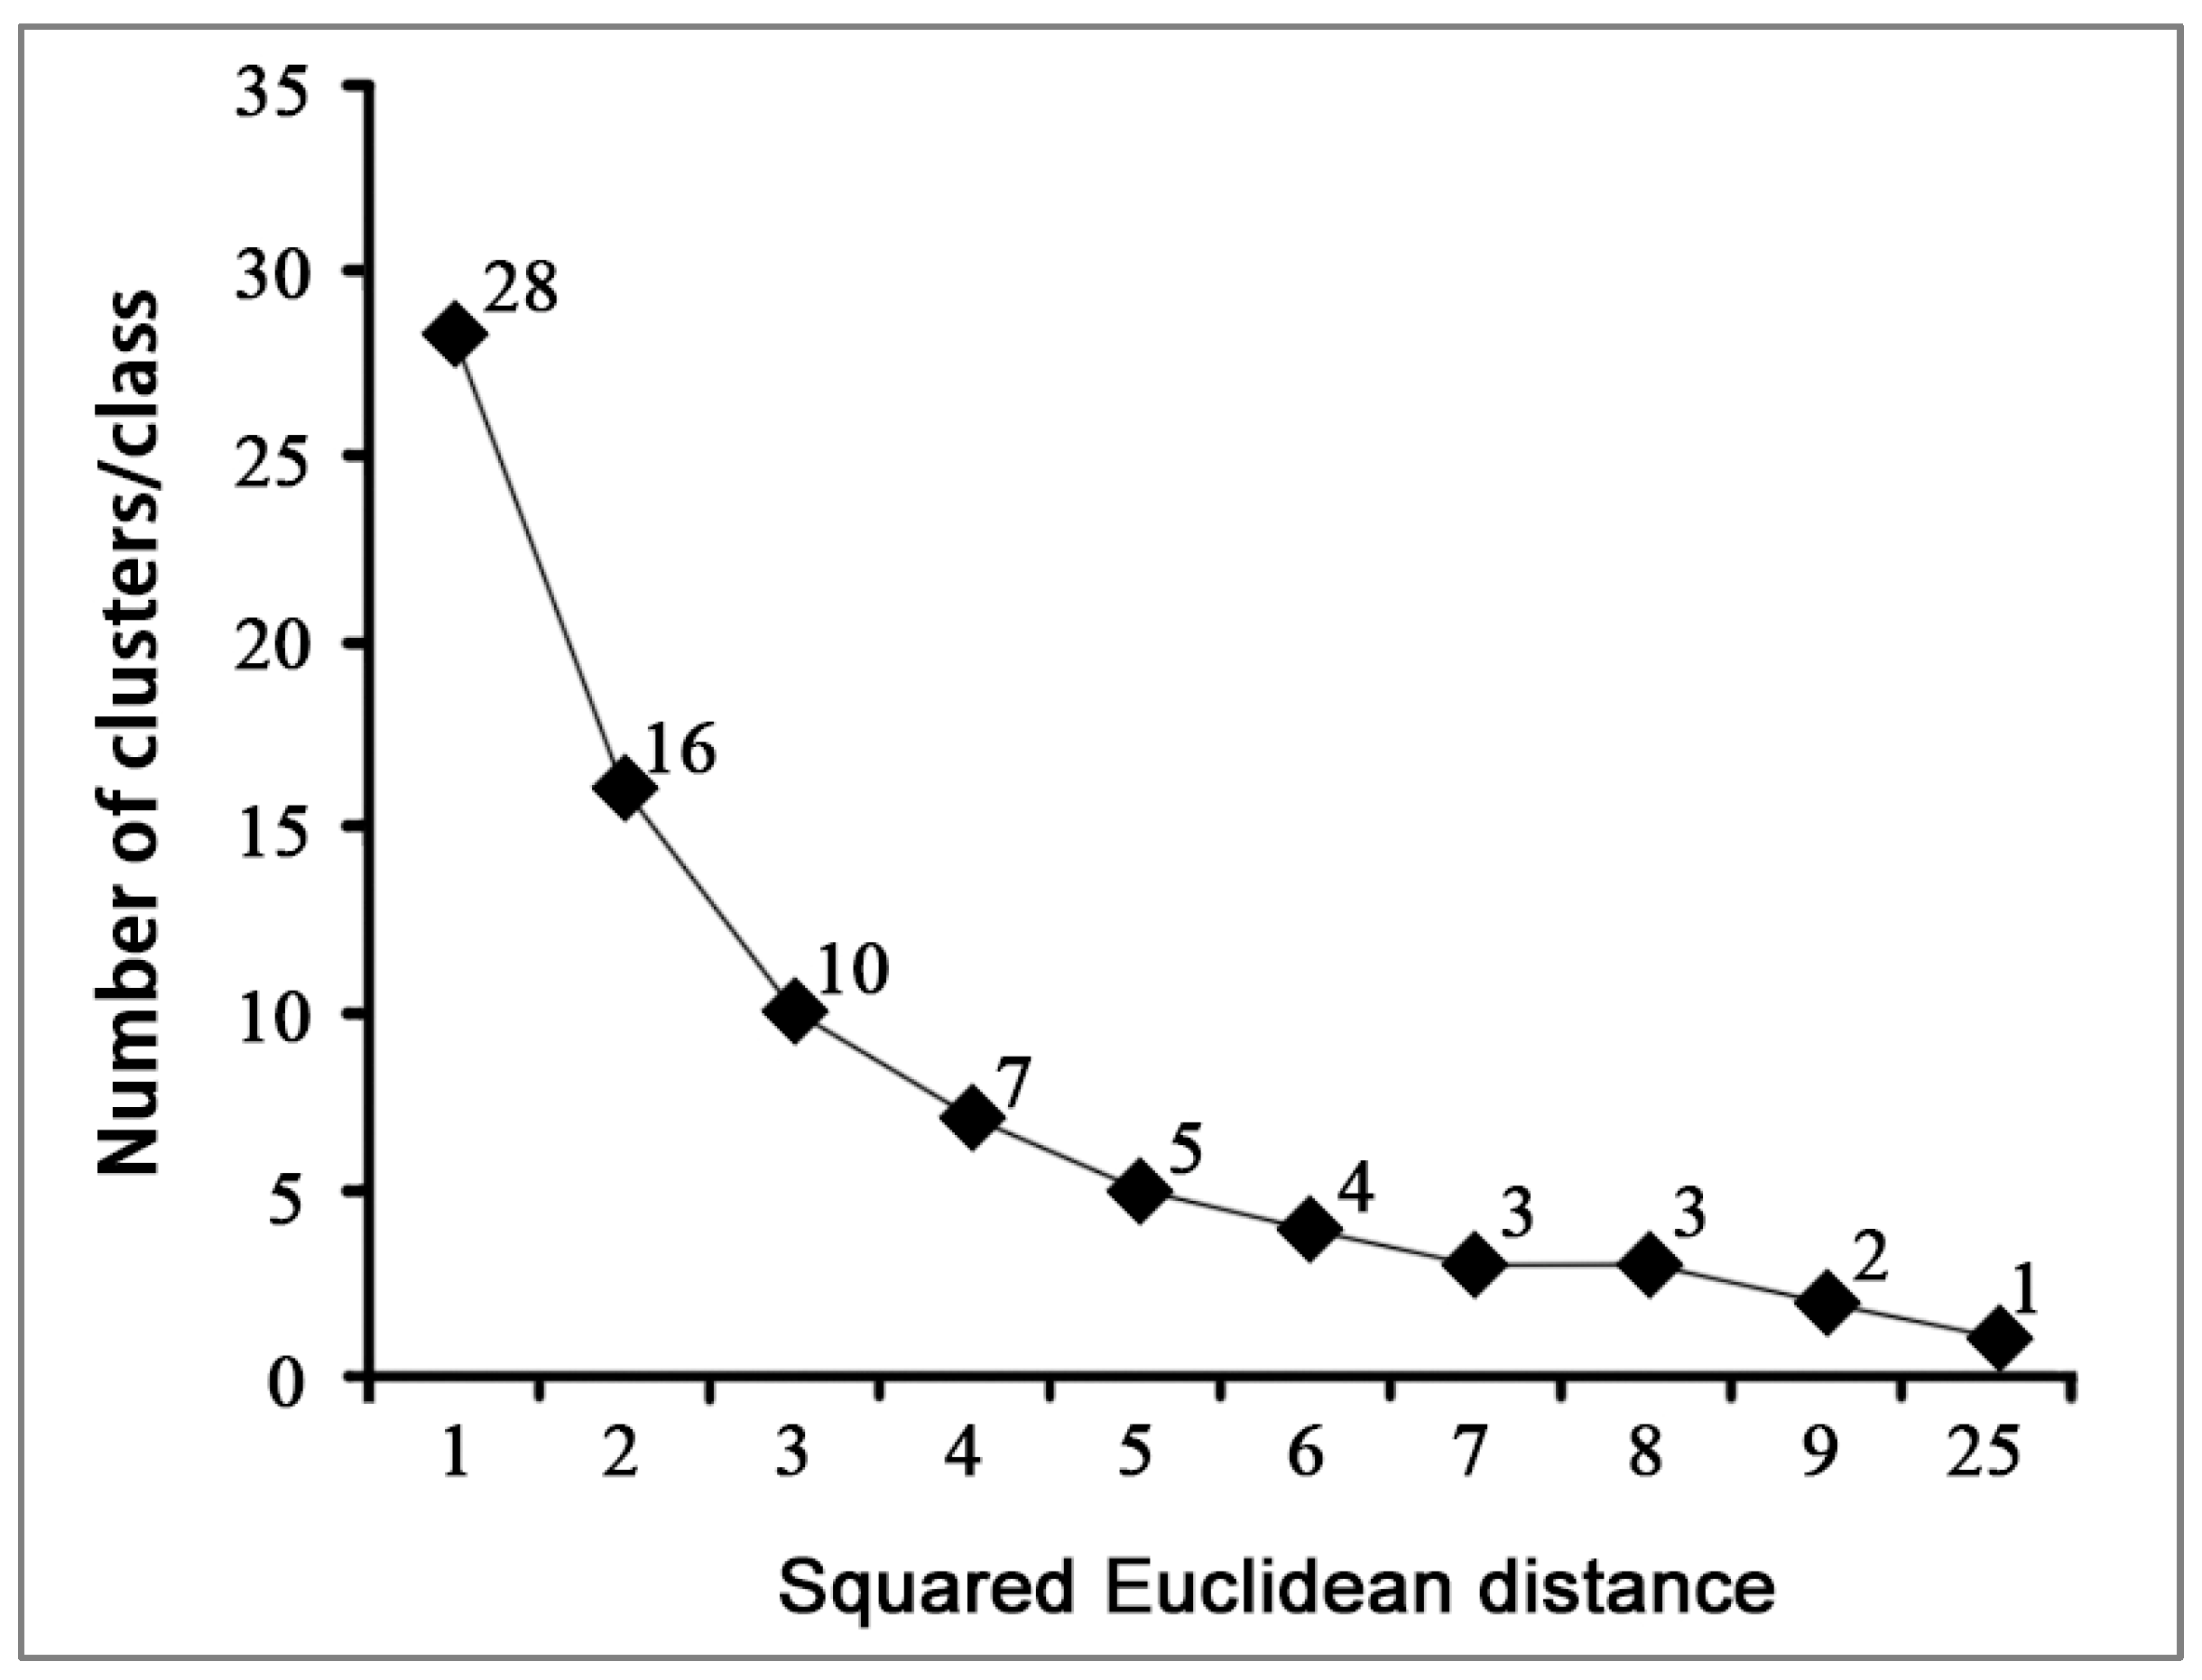
3.1. Determination of the Number of Clusters
3.2. K-Means Clustering Results
- (1)
- Employment-led stations with job–housing density balance
- (2)
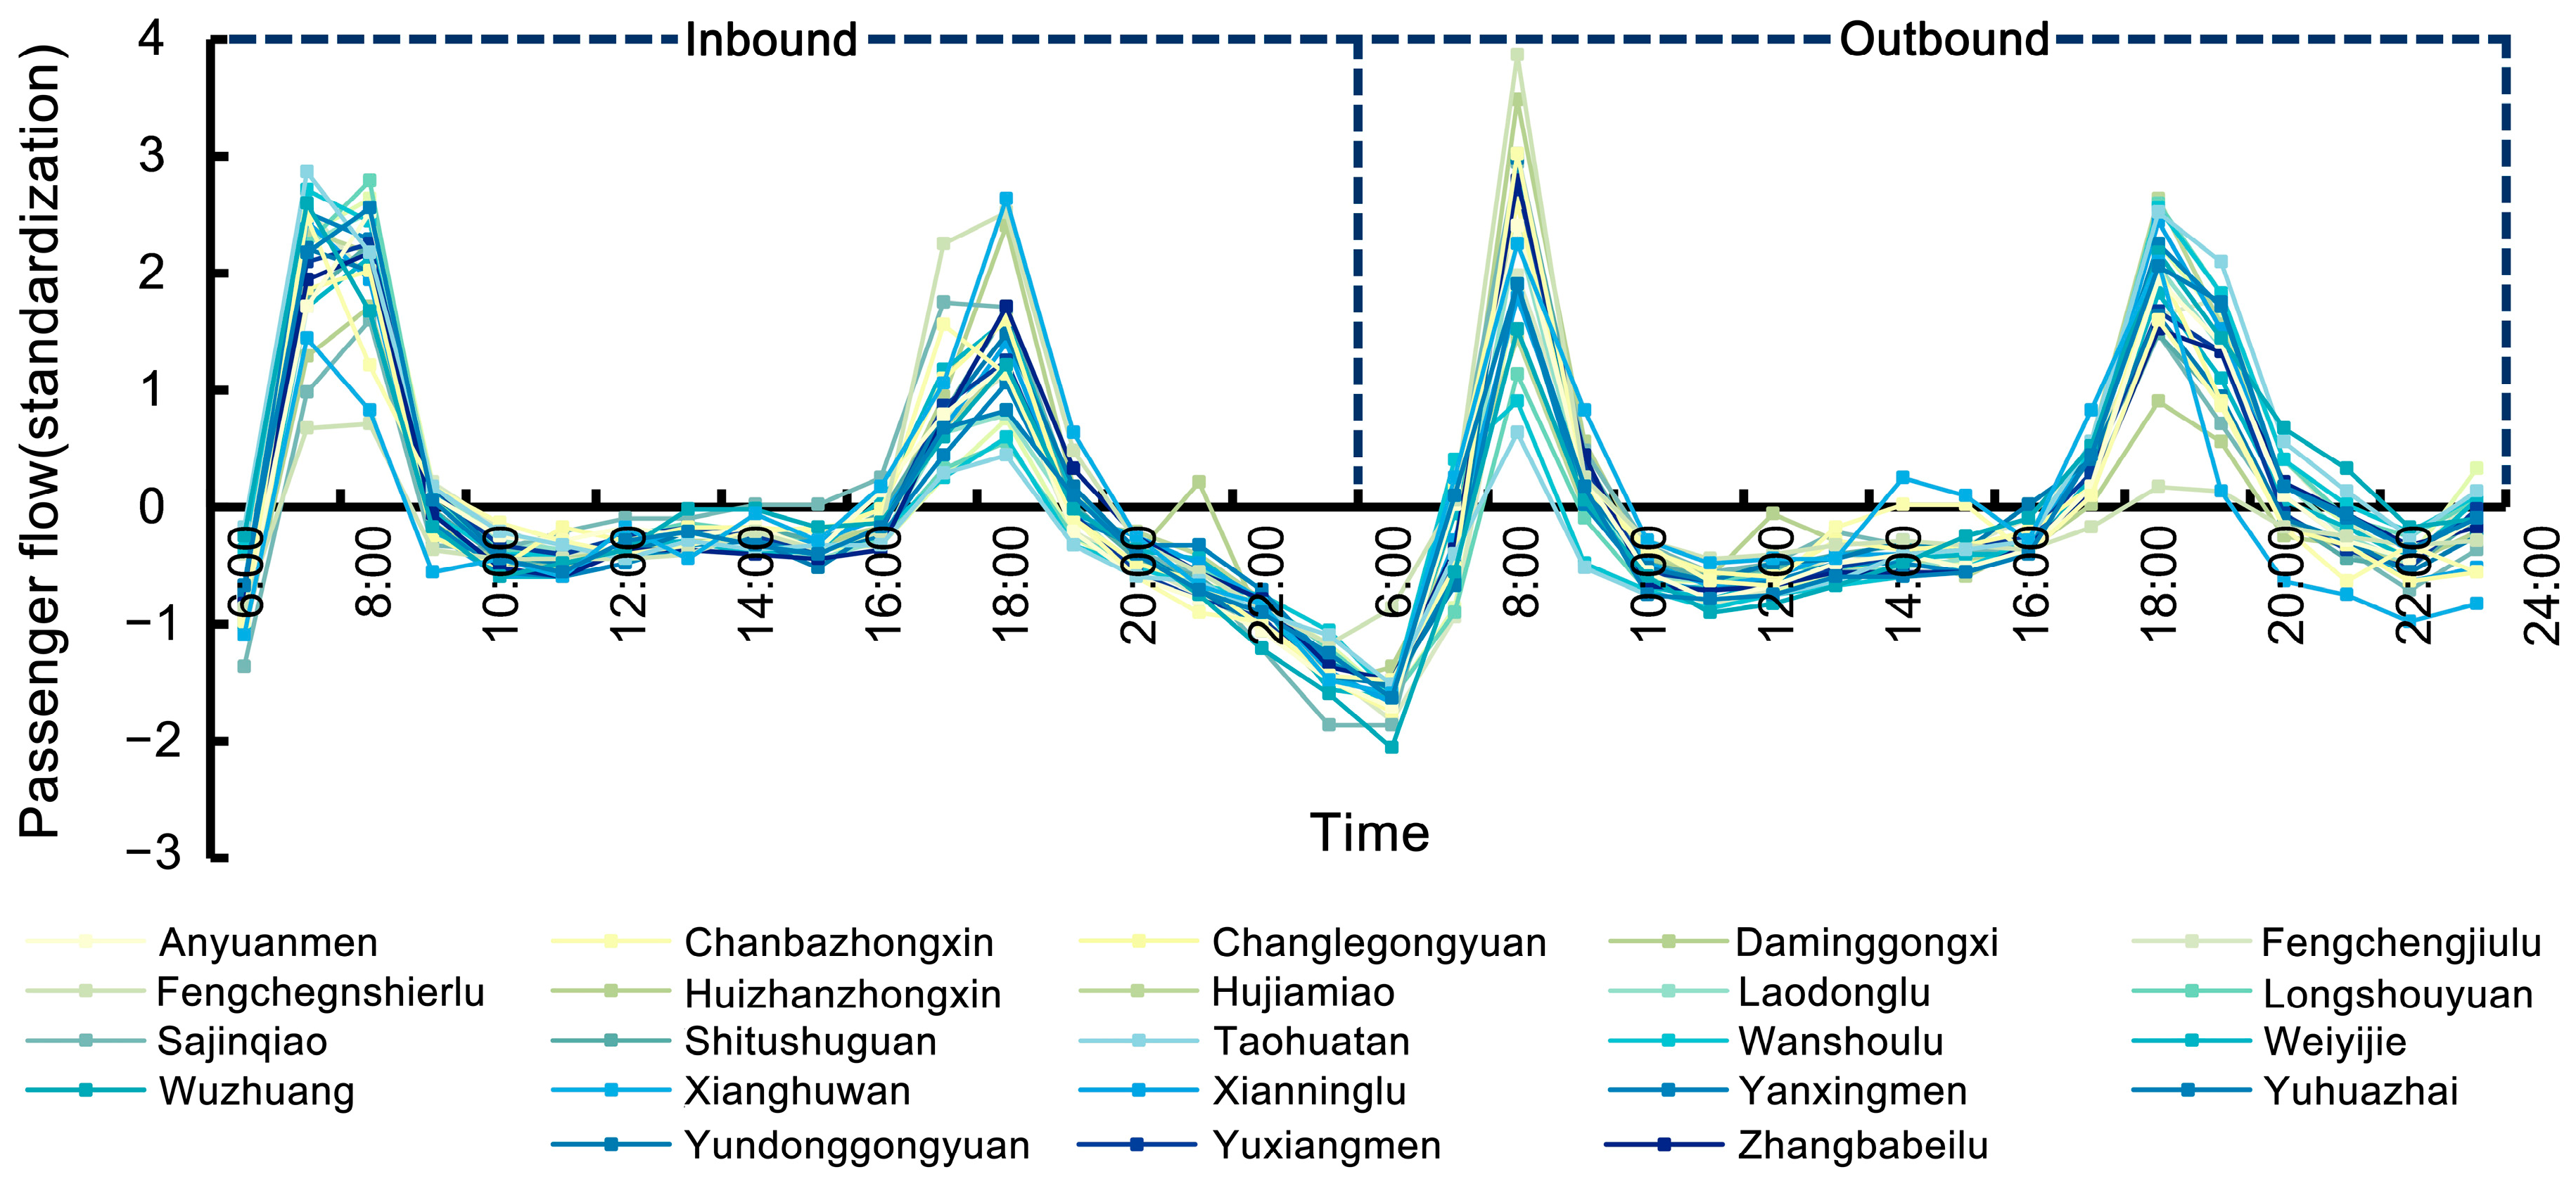
- Job–housing mismatch stations with high residential density
- (3)
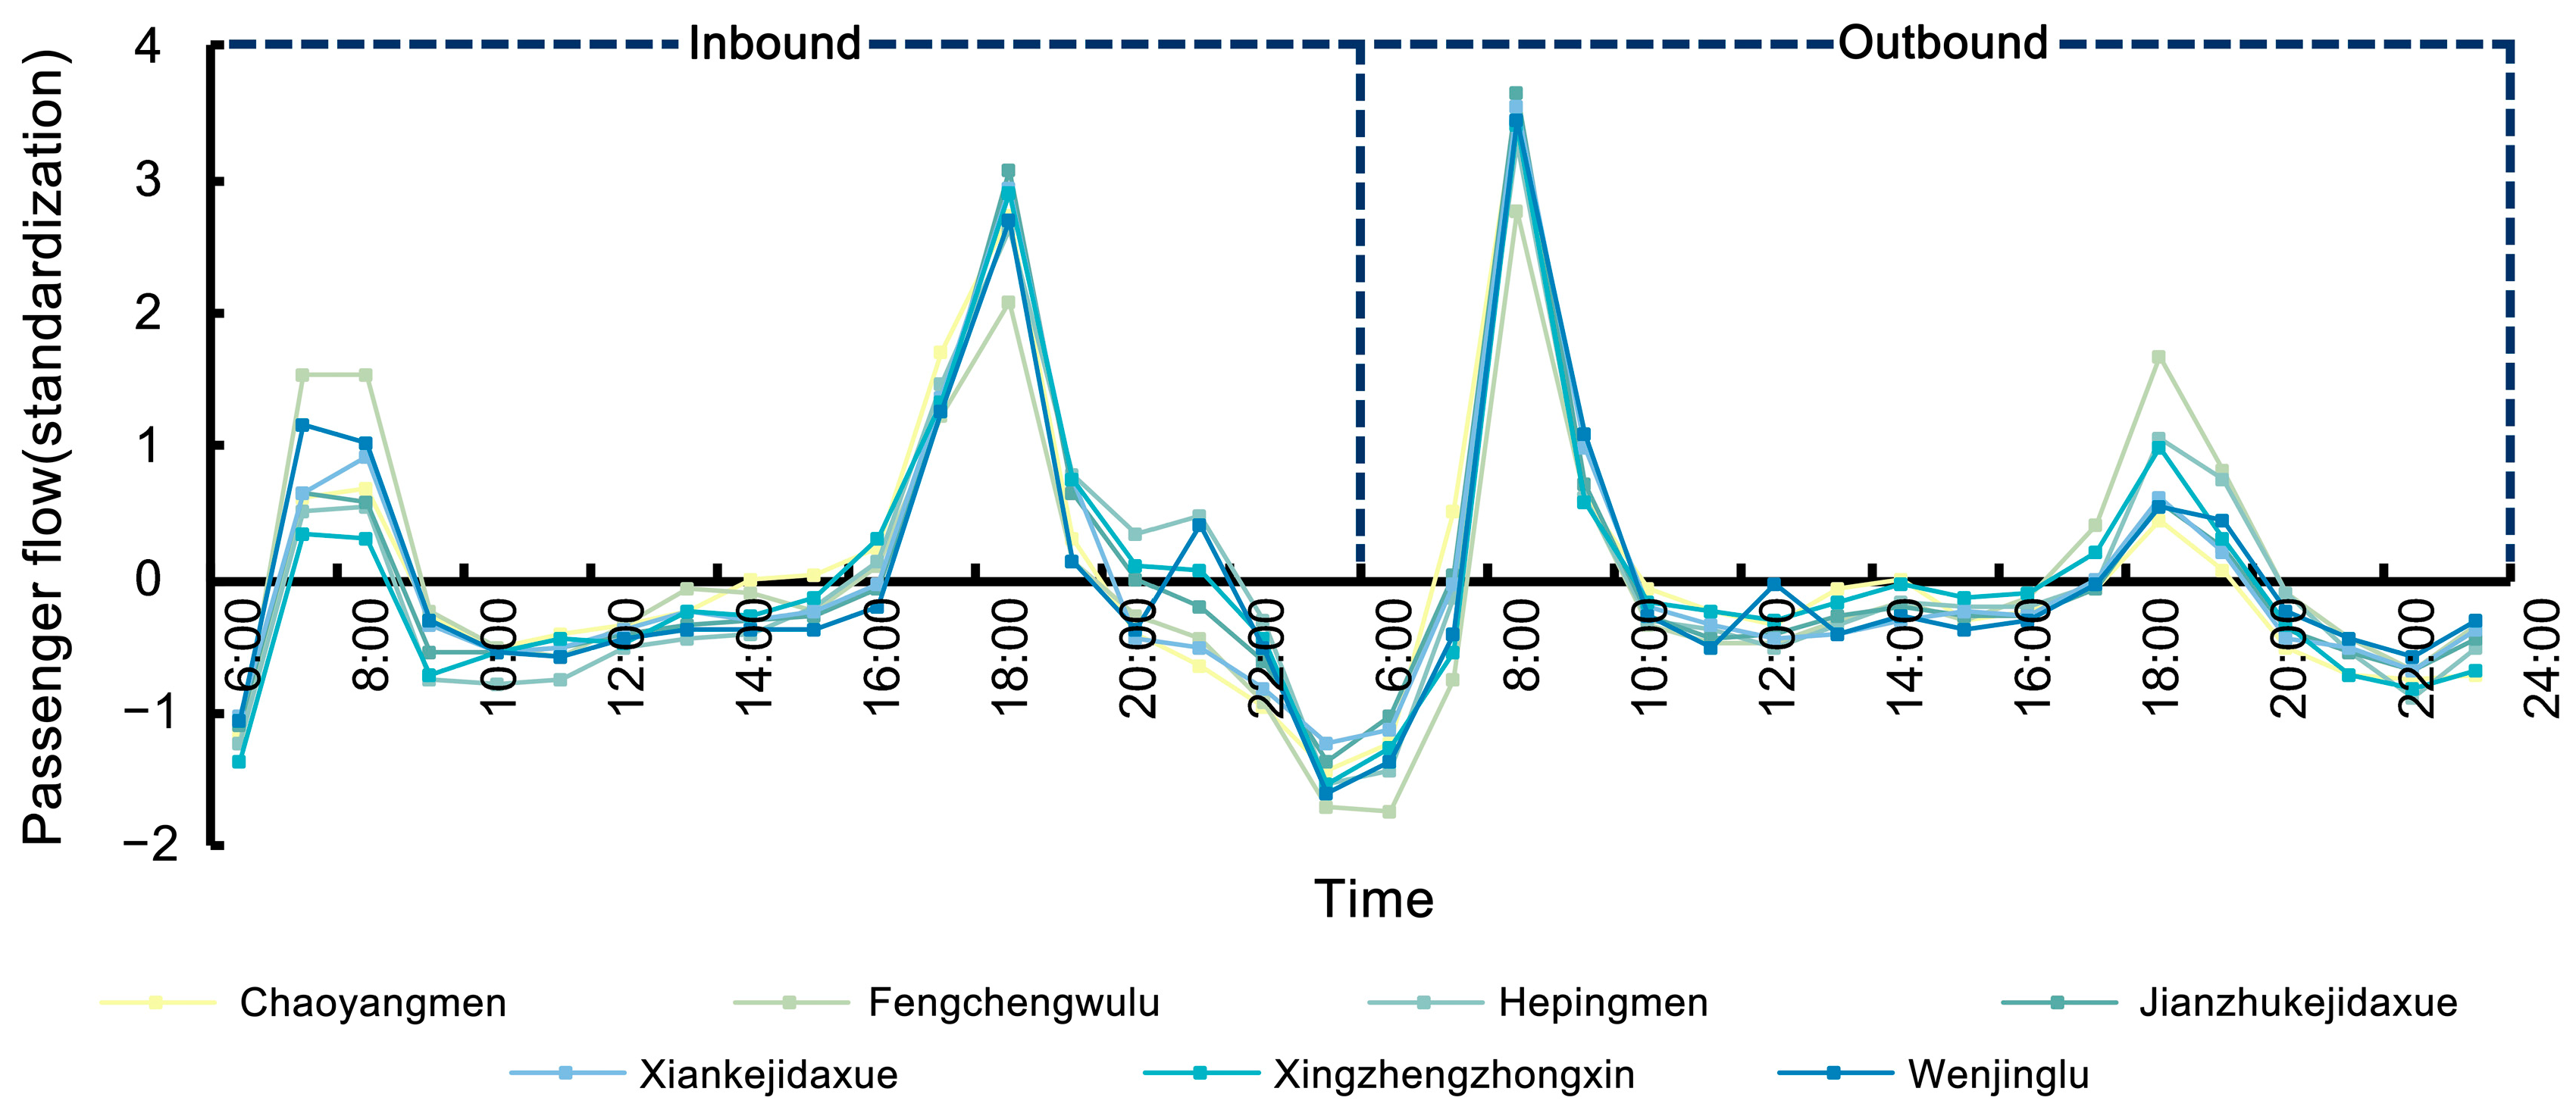
- Mismatch-biased employment stations with job–housing density balance
- (4)
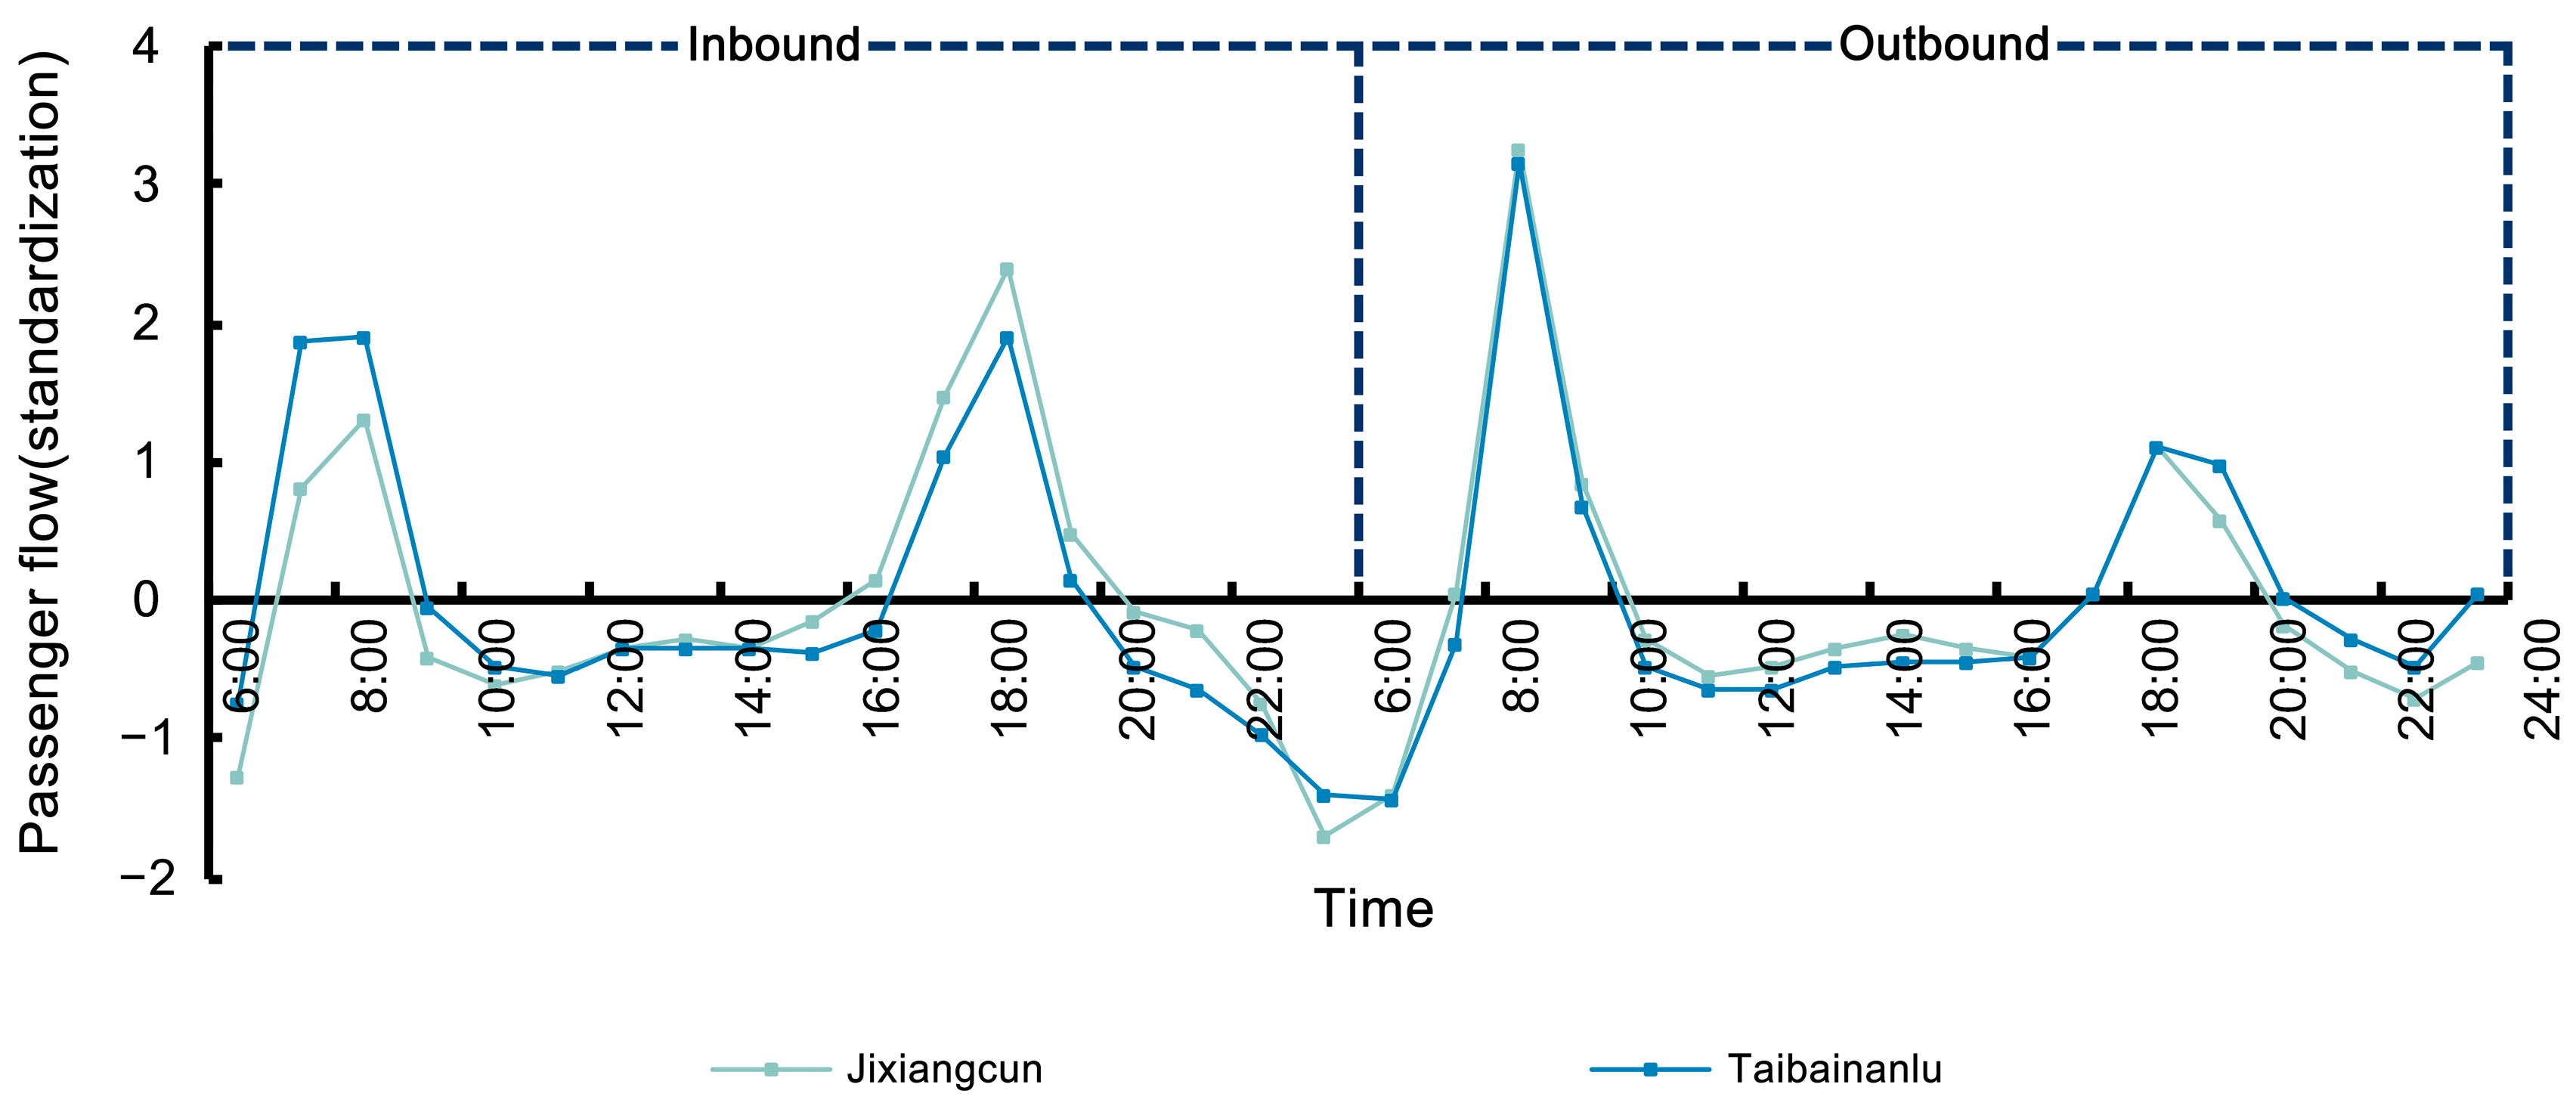
- Mismatch-biased employment station with high residential density
- (5)
- Mismatch-biased residence stations with high residential density
- (6)
- Comprehensive stations with job–housing density balance
4. Discussion
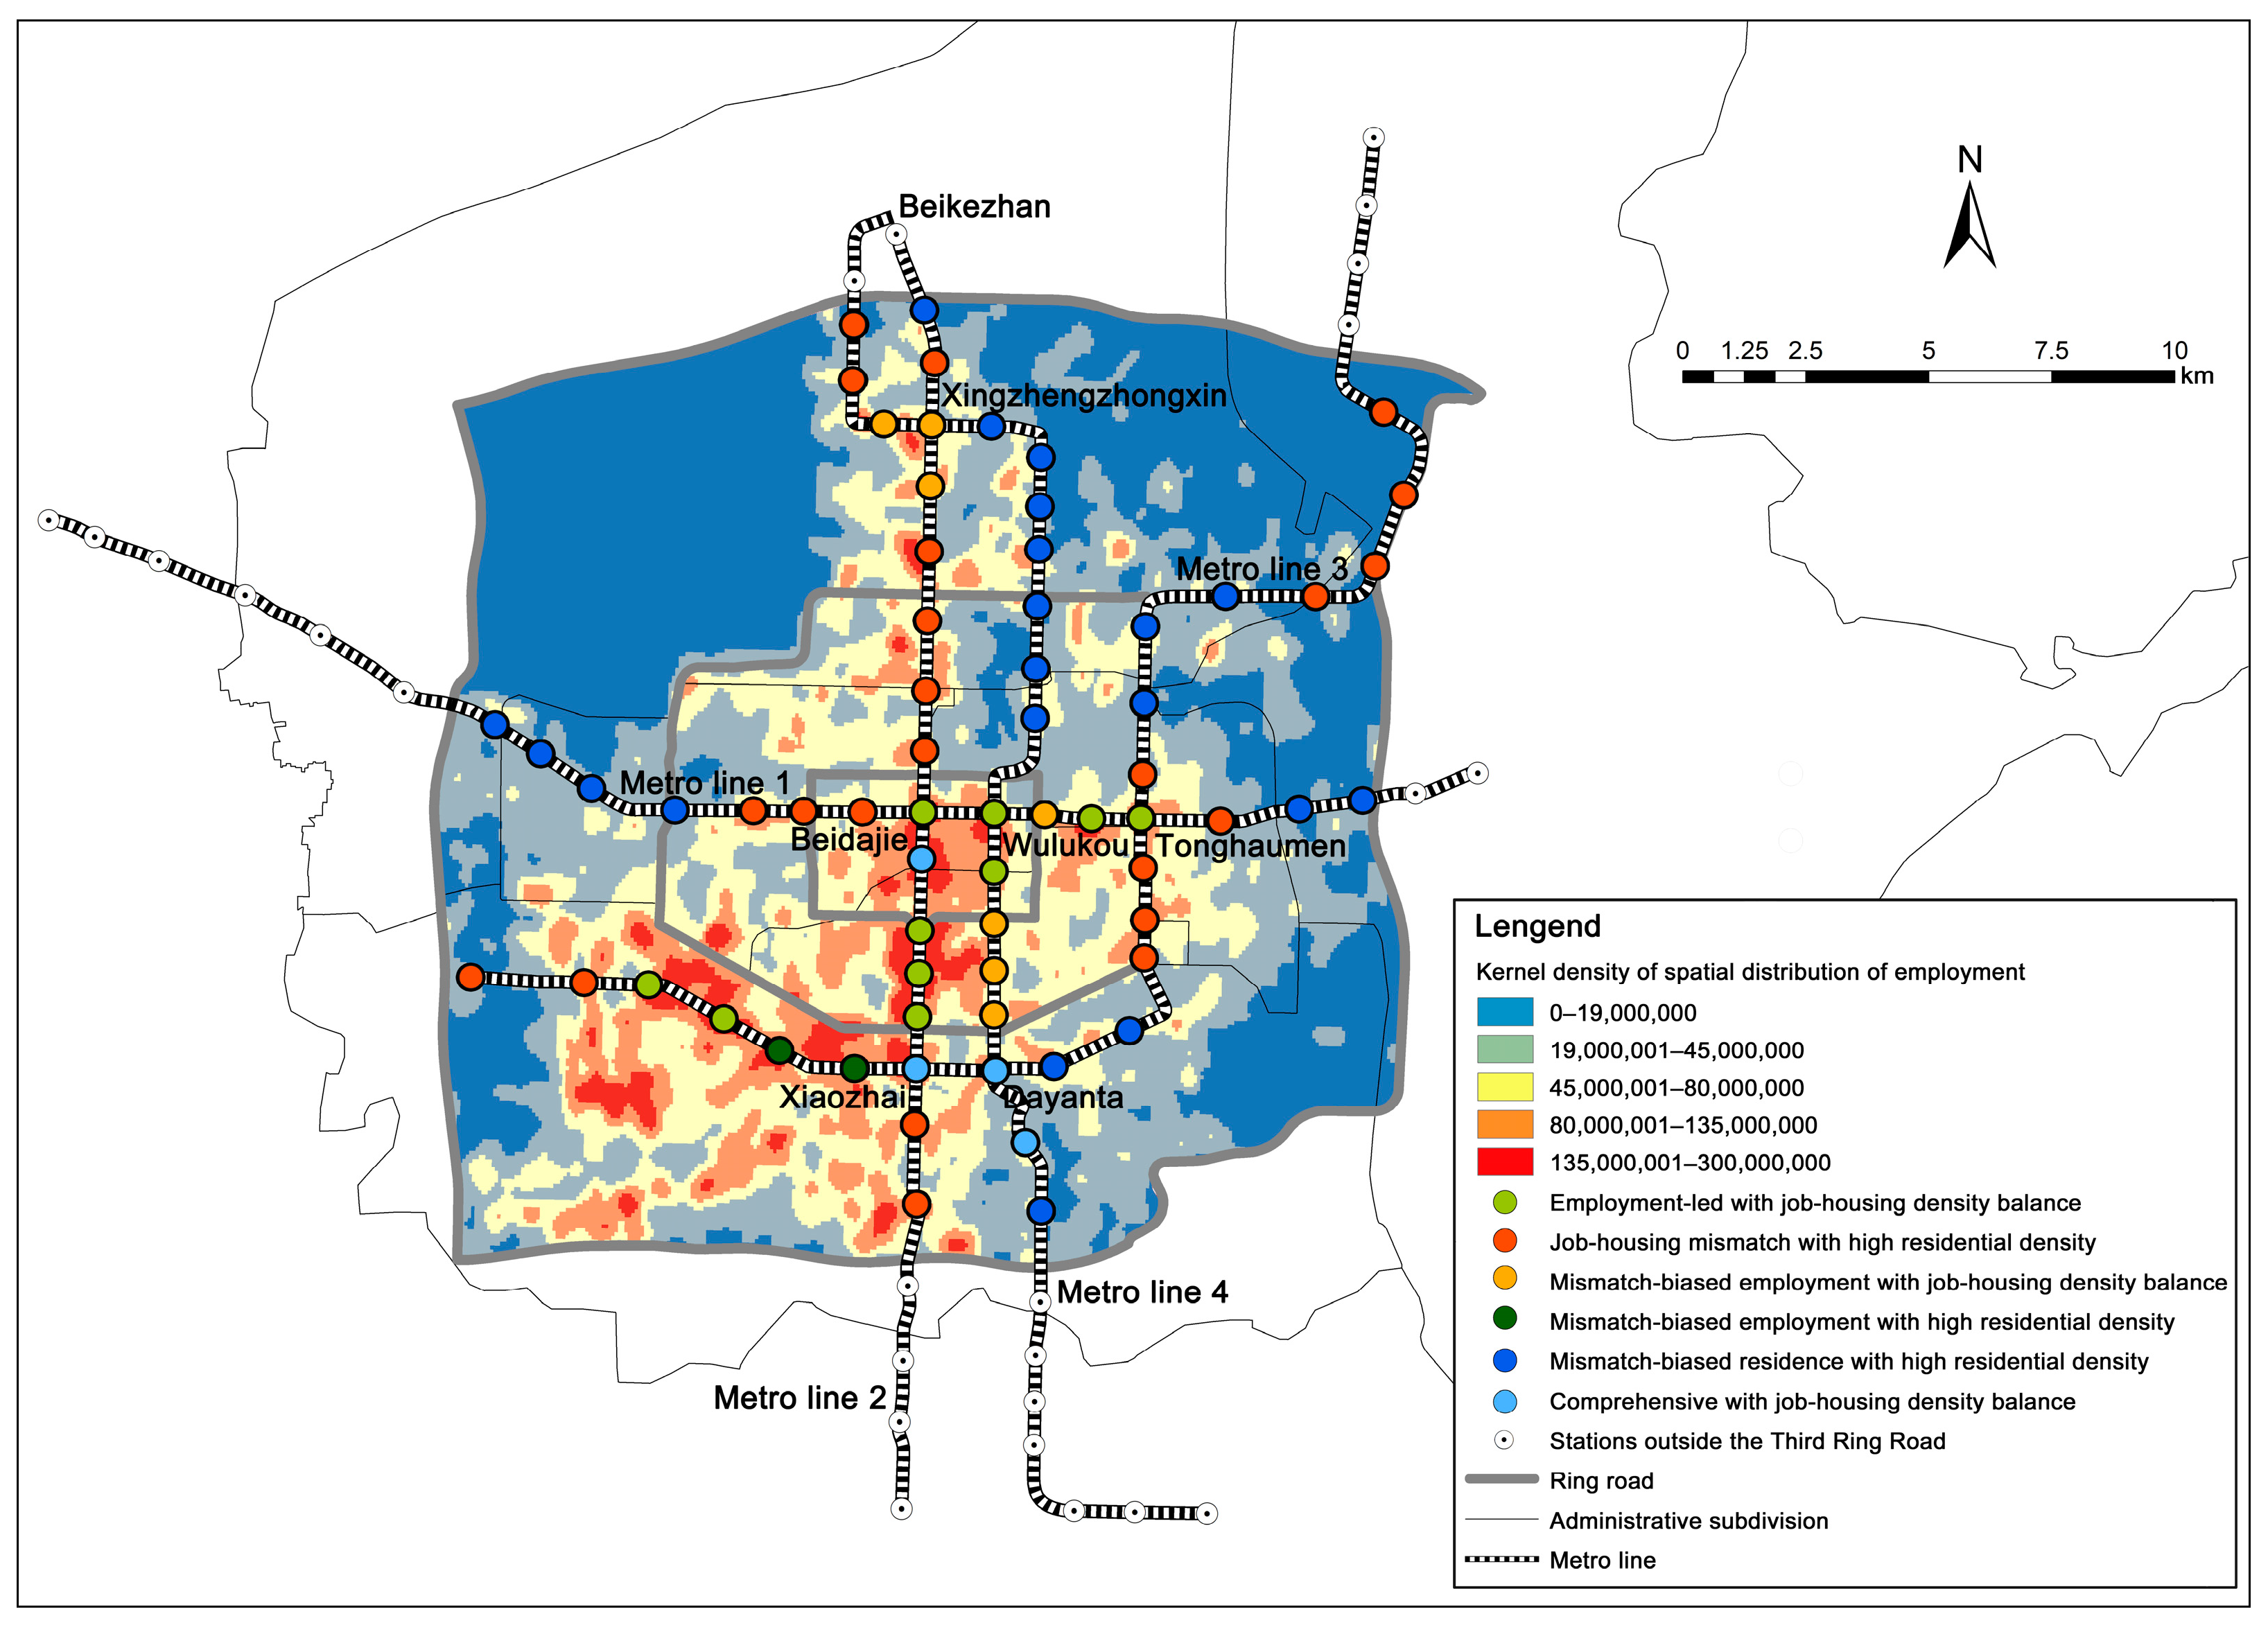
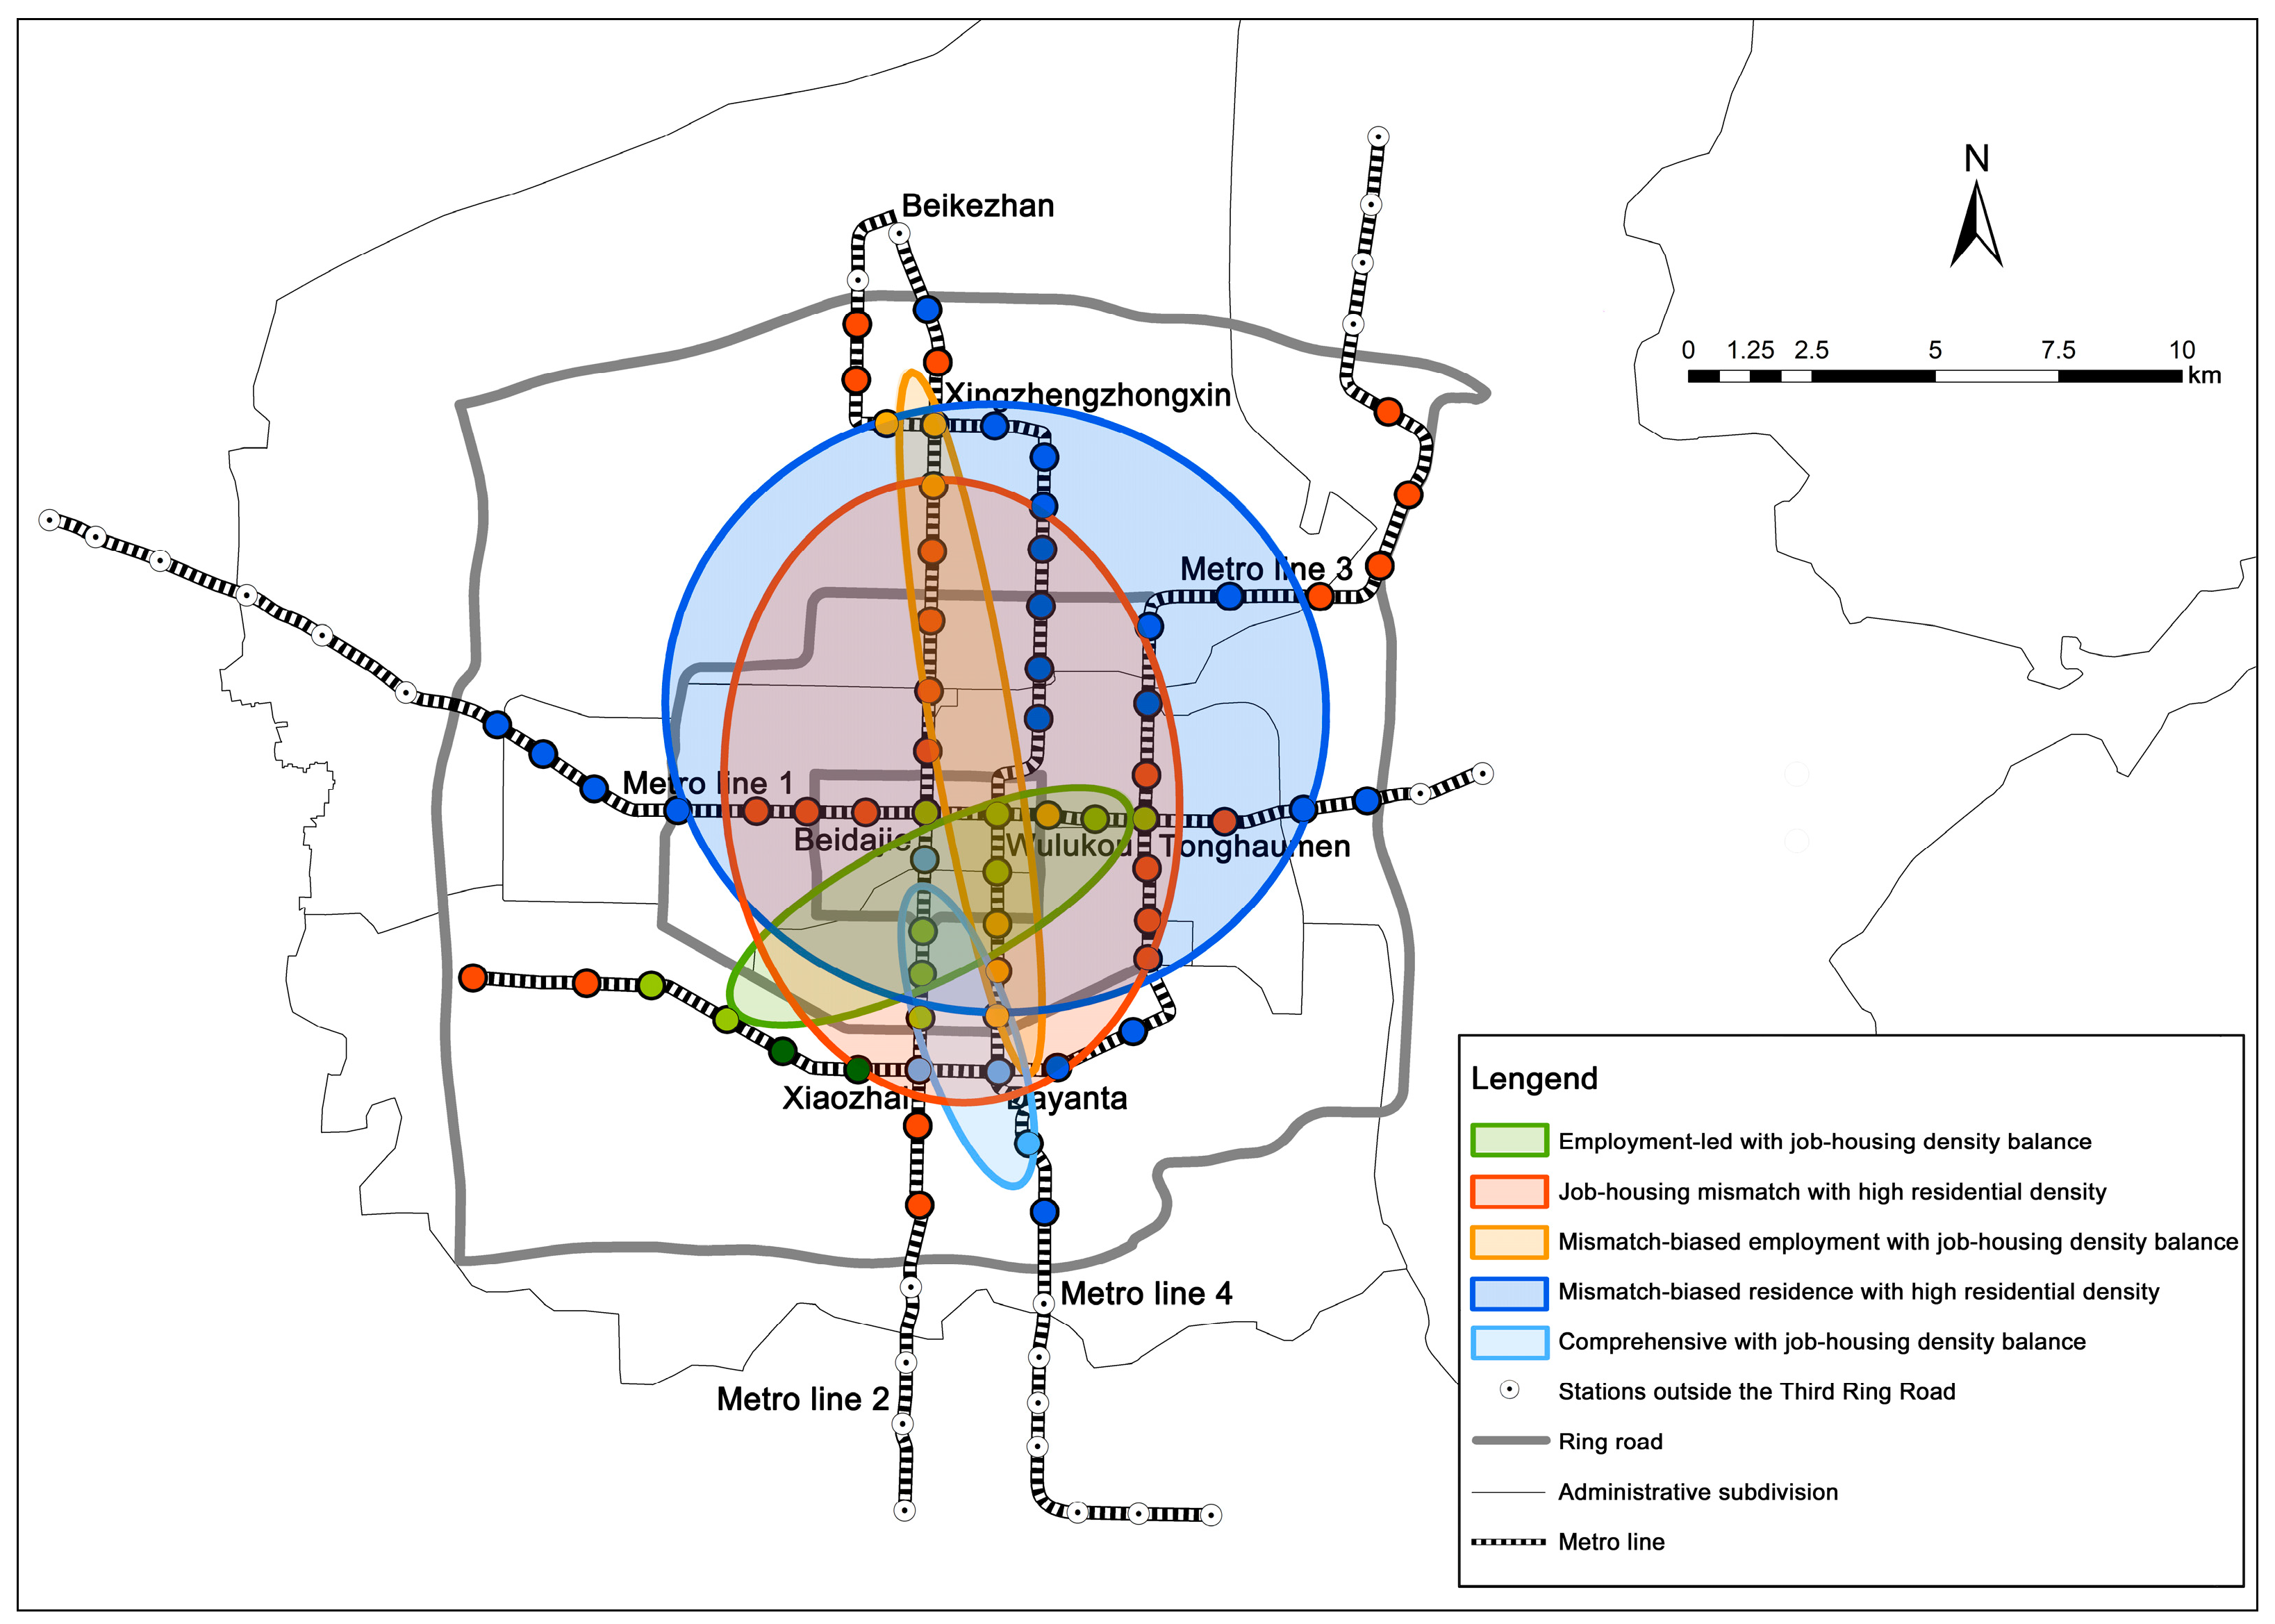
4.1. Spatial Distribution of Stations
4.2. Spatial Rebalancing of Metro Stations
4.3. Limitations
5. Conclusions
Author Contributions
Funding
Institutional Review Board Statement
Informed Consent Statement
Data Availability Statement
Acknowledgments
Conflicts of Interest
Appendix A
References
- Han, B.M.; Li, Y.W.; Lu, F.; Yang, Z.X.; Yang, R.X.; Chen, Y.X.; Sun, Y.J.; Xi, Z.; Wang, L.Y.; Dai, Y.J. Statistical analysis of urban rail transit operations in the world in 2021: A review. Urban Rapid Rail Transit 2022, 35, 5–11. [Google Scholar] [CrossRef]
- Yang, X.X.; Zou, Y.J.; Chen, L. Operation analysis of freeway mixed traffic flow based on catch-up coordination platoon. Accid. Anal. Prev. 2022, 175, 106780. [Google Scholar] [CrossRef]
- Jiang, Y.S.; Yi, Z.Y.; Xiao, G.S.; Li, H.W.; Yao, Z.H. Modeling the Effect of the Platoon Size of CAVs on Mixed Traffic Flow: A Cellular Automaton Method. J. Adv. Transp. 2023, 2023, 2761858. [Google Scholar] [CrossRef]
- Jin, Y. The Influence of Land Use on Diurnal Pattern of Urban Mass Transit Station Boardings: A Case Study of Shanghai City. Mod. Urban Res. 2015, 6, 13–19. [Google Scholar] [CrossRef]
- Pan, H.X.; Wei, C.D.; Shi, C. Difference Analysis of Rail Traffic Accessibility Effect Housing Price: Shanghai Center City Example. Planners 2016, 32, 203–208. [Google Scholar] [CrossRef]
- Zhang, Y.; Ku, Z.W.; Zhou, W. Study on the Spatial Matching of Occupation and Residence in Large Cities and its Co-ordinated Development with Railway Transportation: A Case Study of Shenzhen Municipality. Urban Plan. Forum 2018, 1, 99–106. [Google Scholar] [CrossRef]
- Wang, Z.J.; Liu, H.X.; Tanku, F. Classification of service functions in urban railway stations based on AFC data and RF models. J. Transp. Syst. Eng. Inf. Technol. 2018, 18, 224–230. [Google Scholar] [CrossRef]
- Pang, L.; Jiang, Y.; Wang, J.; Qiu, N.; Xu, X.; Ren, L.; Han, X. Research of Metro Stations with Varying Patterns of Ridership and Their Relationship with Built Environment, on the Example of Tianjin, China. Sustainability 2023, 15, 9533. [Google Scholar] [CrossRef]
- Yu, Z.; Zhu, X.; Liu, X. Characterizing metro stations via urban function: Thematic evidence from transit-oriented development (TOD) in Hong Kong. J. Transp. Geogr. 2022, 99, 103299. [Google Scholar] [CrossRef]
- Duan, D.G.; Zhang, F. Study on Classification of urban rail transit stations from the perspective of landuse optimization:A case study on Xi’an subway line 2. City Plan. Rev. 2013, 37, 39–45. [Google Scholar]
- Yu, L.J.; Li, Y.; Chen, K.M. Using Spectral Clustering for Urban Rail Station Classification. J. Transp. Inf. Saf. 2014, 32, 122–125. [Google Scholar] [CrossRef]
- Wang, W.Y.; Liu, J.C.; Yu, Y.D. Research on classification of rail transit stations in Xi’an based on land use and population. People’s Public Transp. 2020, 8, 29–33. [Google Scholar] [CrossRef]
- Xia, X.; Gai, J.Y. Classification of urban rail transit stations and points and analysis of passenger flow characteristics based on K-Means clustering algorithm. Mod. Urban Transit 2021, 4, 112–118. [Google Scholar]
- Jiang, Y.; Zheng, H.; Yu, S.Y.; Tang, X. Relationship Between Job-Housing Spatial Distribution and Rail Transit Network in Tianjin: An Analysis Based on Cellular Data. Urban Transp. China 2018, 16, 26–35. [Google Scholar]
- Ren, L.J.; Yun, Y.X.; Quan, H.Y. Study on Classification and Characteristics of Urban Rail Transit Station Based on Node-Place Model Empirical Analysis and Experience Enlightenment of Singapore. Urban Plan. Int. 2016, 1, 109–116. [Google Scholar]
- Bertolini, L. Nodes and places: Complexities of railway station redevelopment. Eur. Plan. Stud. 1996, 4, 331–345. [Google Scholar] [CrossRef]
- Bertolini, L. Spatial Development Patterns and Public Transport: The Application of an Analytical Model in the Netherlands. Plan. Pract. Res. 1999, 14, 199–210. [Google Scholar] [CrossRef]
- Chen, Z.; Batty, M.; Manley, E.; Wang, J.; Wang, Z.; Feng, C.; Schmitt, G. Variability in regularity: Mining temporal mobility patterns in London, Singapore, and Beijing using smart-card data. PLoS ONE 2016, 11, 0149222. [Google Scholar] [CrossRef]
- Yin, Q.; Meng, B.; Zhang, L.Y. Classification of subway stations in Beijing based on passenger flow characteristics. Prog. Geogr. 2016, 35, 126–134. [Google Scholar]
- Tan, Z.Z.; Li, S.Y.; Li, X.; Liu, X.P.; Chen, Y.M. Clustering of Metro Stations in Guangzhou based on Passenger Flow. Trop. Geogr. 2017, 37, 102–111. [Google Scholar]
- Yuan, F.T.; Cheng, T.J.; Wei, J.B. Research on Classification of Rail Stations Based on AFC Data. J. Transp. Eng. 2021, 21, 48–52. [Google Scholar] [CrossRef]
- Cui, X.; Yu, B.J.; Liang, P.P.; Wang, L.; Zang, L.F. Urban rail transit station type identification and job housing spatial rebalancing based on passenger flow and land use: Taking Chengdu as an example. Mod. Urban Res. 2021, 7, 68–79. [Google Scholar]
- Meekyung, M. Classification of Seoul metro stations based on boarding/Alighting patterns using machine learning cluster-ing. J. Inst. Internet Broadcast. Commun. 2018, 18, 13–18. [Google Scholar] [CrossRef]
- Ma, X.; Wu, Y.J.; Wang, Y.; Feng, C.; Liu, J. Mining smart card data for transit riders’ travel patterns. Transp. Res. Part C Emerg. Technol. 2013, 36, 1–12. [Google Scholar] [CrossRef]
- Zhou, Y.; Fang, Z.X.; Zhan, Q.M.; Huang, Y.P.; Fu, X.W. Inferring social functions available in the metro station area from passengers’ staying activities in smart card data. ISPRS Int. J. Geo.-Inf. 2017, 6, 394–397. [Google Scholar] [CrossRef]
- Chen, Y.; Yao, M.; Cai, Z. Research on the classification of urban rail transit stations-taking Shanghai metro as an example. In Proceedings of the 15th International conference on service systems and service management (ICSSSM), Hangzhou, China, 21–22 July 2018; pp. 1–6. [Google Scholar]
- Roth, C.; Kang, S.M.; Batty, M.; Barthelemy, M. Structure of urban movements: Polycentric activity and entangled hierarchical flows. PLoS ONE 2011, 6, 15923. [Google Scholar] [CrossRef]
- Wang, Y.L.; Jin, Y.N.; Wu, B. Definition and Classification Method of Rail Transit Stations Under TOD. Traffic Transp. 2021, 37, 51–56. [Google Scholar]
- Liao, C.; Scheuer, B. Evaluating the performance of transit-oriented development in Beijing metro station areas: Integrating morphology and demand into the nodeplace model. J. Transp. Geogr. 2022, 100, 103333. [Google Scholar] [CrossRef]
- Jiang, Y.S.; Yu, G.S.; Hu, L.; Li, Y. Refined Classification of Urban Rail Transit Stations Based on Clustered Station’s Passenger Traffic Flow Features. J. Transp. Syst. Eng. Inf. Technol. 2022, 22, 106–112. [Google Scholar] [CrossRef]
- Zhou, Y.; Zheng, S.; Hu, Z.; Chen, Y. Metro station risk classification based on smart card data: A case study in Beijing. Phys. A Stat. Mech. Its Appl. 2022, 594, 127019. [Google Scholar] [CrossRef]
- Xi’an National Economic and Social Development Statistics Bulletin 2022. Available online: http://tjj.xa.gov.cn/ (accessed on 23 September 2023).
- Xi’an Metro Mileage Exceeds 300 Kilometres. Available online: https://news.cctv.com/ (accessed on 23 September 2023).
- Overview of China’s Metro. Available online: https://metrodb.org/ (accessed on 23 September 2023).
- Xi’an Municipal People’s Government. Available online: https://www.xa.gov.cn/ (accessed on 30 September 2023).
- Feng, H.X.; Yang, H.; Yv, Y.; Wang, Y.Z.; Qin, P.C.; Zhao, Z.Q.; Jing, Q.H. A travel mode identification method based on mobile phone signaling data: China. CN202011366779.0, 16 August 2022. [Google Scholar]
- Lv, D.J.; Li, S.Y.; Tan, Z.Z.; Wu, Z.F.; Gao, F.; Liu, X.P. Fine-Scale Modeling of Multi-time Dimensional lnfluencing Factors in Transit Ridership at MetroStations: A Case Study of Guangzhou City. Geogr. Geo-Inf. Sci. 2019, 3, 58–65. [Google Scholar] [CrossRef]
- Long, Y.; Zhang, Y.; Cui, C.Y. Identifying Commuting Pattern of Beijing Using Bus Smart Card Data. Acta Geogr. Sin. 2012, 67, 1339–1352. [Google Scholar] [CrossRef]
- Xie, H.; Zhang, L.; Lim, C.P.; Yu, Y.; Walters, J. Improving K-means clustering with enhanced Firefly Algorithms. Appl. Soft Comput. 2019, 84, 105763. [Google Scholar] [CrossRef]
- Omrani, H.; Parmentier, B.; Helbich, M.; Pijanowski, B. The land transformation model-cluster framework: Applying k-means and the Spark computing environment for large scale land chan ge analytics. Environ. Model. Softw. 2019, 111, 182–191. [Google Scholar] [CrossRef]
- Li, S.Y.; Lv, D.J.; Huang, G.P.; Zhang, X.H.; Gao, F.; Chen, Y.T.; Liu, X.P. Spatially varying impacts of built environment factors on rail transit ridership at station level: A case study in Guangzhou, China. J. Transp. Geogr. 2020, 82, 102631. [Google Scholar] [CrossRef]
- An, D.; Tong, X.; Liu, K.; Chan, E.H.W. Understanding the impact of built environment on metro ridership using open source in Shanghai. Cities 2019, 93, 177–187. [Google Scholar] [CrossRef]
- Huang, J.; Wang, J.E.; Jin, H.T.; Jin, F.J. Investigating spatiotemporal patterns of passenger flows in the Beijing metro system from smart card data. Prog. Geogr. 2018, 37, 397–406. [Google Scholar] [CrossRef]
- Gao, L.; Xu, Y.K. Study on the Ratio of Industrial Land to Residential Land in Guangzhou under the Perspective of Occupational and Residential Balance. Planners 2018, 34, 77–82. [Google Scholar]
- Niu, X.Y.; Ding, L.; Song, X.D. Analyzing suburban new town development on SHANGHAI from the perspective of Jobs-Housing spatial relationship. City Plan. Rev. 2017, 41, 47–53. [Google Scholar]


| Station Name | 6:00–7:00 | 7:00–8:00 | …… | 22:00–23:00 | 23:00–24:00 | ||||
|---|---|---|---|---|---|---|---|---|---|
| Numbers | Standardized Value | Numbers | Standardized Value | …… | Numbers | Standardized Value | Numbers | Standardized Value | |
| Xiaozhai | 42 | −1.488 | 179 | −0.628 | …… | 323 | 0.275 | 55 | −1.406 |
| Tiyuchang | 51 | −1.551 | 270 | −0.248 | 260 | −0.307 | 42 | −1.601 | |
| Nanshaomen | 68 | −1.371 | 390 | 0.468 | 142 | −0.950 | 30 | −1.591 | |
| Yongningmen | 76 | −1.408 | 419 | 0.078 | 313 | −0.379 | 34 | −1.588 | |
| Zhonglou | 83 | −1.616 | 386 | −0.443 | 407 | −0.362 | 78 | −1.637 | |
| Station Name | m | L1 | L2 | L3 | L4 | L5 | L6 | L7 | L8 | H | D | E |
|---|---|---|---|---|---|---|---|---|---|---|---|---|
| Xiaozhai | 8 | 0.322 | 0.182 | 0.319 | 0.002 | 0.111 | 0.002 | 0.045 | 0.017 | 1.517 | 0.562 | 0.730 |
| Tiyuchang | 6 | 0.218 | 0.157 | 0.354 | 0 | 0.138 | 0.003 | 0.130 | 0 | 1.546 | 0.245 | 0.863 |
| Nanshaomen | 7 | 0.182 | 0.162 | 0.448 | 0.005 | 0.121 | 0.004 | 0.078 | 0 | 1.468 | 0.478 | 0.754 |
| Yongningmen | 7 | 0.139 | 0.203 | 0.410 | 0.057 | 0.141 | 0.001 | 0.049 | 0 | 1.558 | 0.388 | 0.801 |
| Zhonglou | 6 | 0.190 | 0.210 | 0.327 | 0.026 | 0.227 | 0 | 0.020 | 0 | 1.519 | 0.273 | 0.848 |
| Station Name | Time Series Characteristics of Passenger Flow | Passenger Flow Intensity Characteristics | Land Use Structure Characteristics | Job–Housing Population Characteristics | |||||||||||
|---|---|---|---|---|---|---|---|---|---|---|---|---|---|---|---|
| Extremum Point (C1) | Skewness (C2) | Kurtosis (C3) | Peak Hour Factor (C4) | Time Distribution Equalization Factor (C5) | Land Use Mixture Degree (L1) | Land Use Dominance Degree (L2) | Land Use Uniformity Index (L3) | Employed Population Density (P1) | Resident Population Density (P2) | ||||||
| Inbound | Outbound | Inbound | Outbound | Inbound | Outbound | Inbound | Outbound | Inbound | Outbound | ||||||
| Xiaozhai | 2 | 3 | −0.02 | −0.34 | −1.74 | −1.48 | 0.11 | 0.10 | 2.01 | 1.59 | 1.52 | 0.56 | 0.73 | 0.59 | 0.54 |
| Tiyuchang | 2 | 3 | 0.16 | −0.58 | −1.15 | −1.24 | 0.11 | 0.09 | 1.59 | 1.69 | 1.55 | 0.25 | 0.86 | 0.70 | 0.69 |
| Nanshaomen | 3 | 3 | −0.45 | 0.65 | 0.91 | 1.29 | 0.10 | 0.11 | 1.47 | 1.58 | 1.47 | 0.48 | 0.75 | 0.83 | 0.91 |
| Yongningmen | 5 | 3 | −0.99 | −0.38 | 1.12 | −0.57 | 0.88 | 0.08 | 1.25 | 1.43 | 1.56 | 0.39 | 0.80 | 0.73 | 0.77 |
| Zhonglou | 2 | 3 | −0.21 | −0.65 | −1.30 | −0.67 | 0.09 | 0.08 | 1.17 | 1.35 | 1.52 | 0.27 | 0.85 | 0.84 | 0.80 |
| Station Type | Average Passenger Flow Time Series Change Curve | Average of Passenger Flow Parameters | Land Use Features of Typical Stations | Average of Land Use, Employment, and Residence Parameters | |||
|---|---|---|---|---|---|---|---|
| Employment-led with job–housing density balance Cluster 1 | 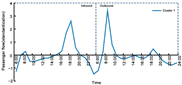 | Single-peak type | Inbound | Outbound |  | L1 | 1.57 |
| C2 | 1.22 | 2.58 | P1 | 0.66 | |||
| C3 | 1.32 | 7.54 | P2 | 0.71 | |||
| Job–housing mismatch with high residential density Cluster 2 Cluster 3 | 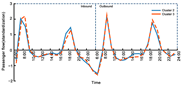 | Double-peak type | Inbound | Outbound |  | L1 | 1.51 |
| C2 | 1.32 | 1.40 | P1 | 0.32 | |||
| C3 | 1.25 | 2.73 | P2 | 0.62 | |||
| Mismatch-biased employment with job–housing density balance Cluster 4 |  | Double-peak type | Inbound | Outbound |  | L1 | 1.52 |
| C2 | 1.28 | 2.31 | P1 | 0.42 | |||
| C3 | 0.89 | 4.48 | P2 | 0.51 | |||
| Mismatch-biased employment with high residential density Cluster 5 | 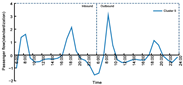 | Double-peak type | Inbound | Outbound |  | L1 | 1.24 |
| C2 | 0.96 | 2.09 | P1 | 0.49 | |||
| C3 | 0.75 | 4.43 | P2 | 0.93 | |||
| Mismatch-biased residence with high residential density Cluster 6 | 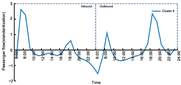 | Double-peak type | Inbound | Outbound |  | L1 | 1.54 |
| C2 | 1.92 | 1.24 | P1 | 0.15 | |||
| C3 | 2.82 | 2.36 | P2 | 0.40 | |||
| Comprehensive with job–housing density balance Cluster 7 | 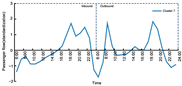 | Full-peak type | Inbound | Outbound |  | L1 | 1.57 |
| C2 | 0.51 | 0.60 | P1 | 0.50 | |||
| C3 | −0.21 | 1.83 | P2 | 0.49 | |||
| Land use legend |  | ||||||
| Station Type | Number of Stations | Station Name |
|---|---|---|
| Employment-led with job–housing density balance | 10 | Nanshaomen, Yongningmen, Kejilu, Beidajie, Dachaishi, Kangfulu, Tiyuchang, Tonghuamen, Wulukou, Yanpingmen |
| Job–housing mismatch with high residential density | 23 | Daminggongxi, Fengchengjiulu, Hujiamiao, Huizhanzhongxin, Laodonglu, Longshouyuan, Sajinqiao, Shitushuguan, Wanshoulu, Weiyijie, Xianninglu, Yanxingmen, Yuxiangmen, Yundonggongyuan, Changlegongyuan, Zhangbabeilu, Anyuanmen, Chanbazhongxin, Fengchengshierlu, Taohuatan, Wuzhuang, Xianghuwan, Yuhuazhai |
| Mismatch-biased employment with job–housing density balance | 7 | Chaoyangmen, Fengchengwulu, Xingzhengzhongxin, Hepingmen, Jianzhukejidaxue, Wenjinglu, Xi’ankejidaxue |
| Mismatch-biased employment with high residential density | 2 | Jixiangcun, Taibainanlu |
| Mismatch-biased residence with high residential density | 20 | Beichitou, Baihuacun, Beiyuan, Chanhe, Changqinglu, Daminggong, Daminggongbei, Guangtaimen, Hanyuandian, Hanchenglu, Kaiyuanmen, Qinglongsi, Qujiangchixi, Shijiajie, Shizhongyiyiyuan, Xinjiamiao, Yujiazhai, Zaoyuan, Zaohe, Changlepo |
| Comprehensive with job–housing density balance | 4 | Datangfurongyuan, Xiaozhai, Dayanta, Zhonglou |
| Variable | Clustering | Error | F | Sig | ||
|---|---|---|---|---|---|---|
| MS | DF | MS | DF | |||
| Inbound extremum point | 0.696 | 6 | 0.298 | 59 | 2.337 | 0.043 |
| Outbound extremum point | 0.622 | 6 | 0.306 | 59 | 2.034 | 0.075 |
| Inbound skewness | 1.325 | 6 | 0.216 | 59 | 6.140 | 0.000 |
| Outbound skewness | 1.894 | 6 | 0.493 | 59 | 3.844 | 0.003 |
| Inbound kurtosis | 8.652 | 6 | 2.416 | 59 | 3.581 | 0.004 |
| Outbound kurtosis | 60.841 | 6 | 9.585 | 59 | 6.348 | 0.000 |
| Inbound time distribution equalization factor | 0.192 | 6 | 0.076 | 59 | 2.512 | 0.031 |
| Outbound time distribution equalization factor | 0.314 | 6 | 0.123 | 59 | 2.562 | 0.028 |
| Inbound peak hour factor | 0.004 | 6 | 0.001 | 59 | 6.067 | 0.000 |
| Outbound peak hour factor | 0.006 | 6 | 0.001 | 59 | 4.443 | 0.001 |
| Land use mixture degree | 0.039 | 6 | 0.016 | 59 | 2.502 | 0.032 |
| Land use dominance degree | 0.035 | 6 | 0.017 | 59 | 2.039 | 0.075 |
| Land use uniformity index | 0.008 | 6 | 0.004 | 59 | 2.025 | 0.077 |
| Employed population density | 0.045 | 6 | 0.016 | 59 | 6.420 | 0.000 |
| Resident population density | 0.032 | 6 | 0.019 | 59 | 6.512 | 0.000 |
Disclaimer/Publisher’s Note: The statements, opinions and data contained in all publications are solely those of the individual author(s) and contributor(s) and not of MDPI and/or the editor(s). MDPI and/or the editor(s) disclaim responsibility for any injury to people or property resulting from any ideas, methods, instructions or products referred to in the content. |
© 2023 by the authors. Licensee MDPI, Basel, Switzerland. This article is an open access article distributed under the terms and conditions of the Creative Commons Attribution (CC BY) license (https://creativecommons.org/licenses/by/4.0/).
Share and Cite
Feng, H.; Chen, Y.; Wu, J.; Zhao, Z.; Wang, Y.; Wang, Z. Urban Rail Transit Station Type Identification Based on “Passenger Flow—Land Use—Job-Housing”. Sustainability 2023, 15, 15103. https://doi.org/10.3390/su152015103
Feng H, Chen Y, Wu J, Zhao Z, Wang Y, Wang Z. Urban Rail Transit Station Type Identification Based on “Passenger Flow—Land Use—Job-Housing”. Sustainability. 2023; 15(20):15103. https://doi.org/10.3390/su152015103
Chicago/Turabian StyleFeng, Hongxia, Yaotong Chen, Jinyi Wu, Zhenqian Zhao, Yuanqing Wang, and Zhuoting Wang. 2023. "Urban Rail Transit Station Type Identification Based on “Passenger Flow—Land Use—Job-Housing”" Sustainability 15, no. 20: 15103. https://doi.org/10.3390/su152015103
APA StyleFeng, H., Chen, Y., Wu, J., Zhao, Z., Wang, Y., & Wang, Z. (2023). Urban Rail Transit Station Type Identification Based on “Passenger Flow—Land Use—Job-Housing”. Sustainability, 15(20), 15103. https://doi.org/10.3390/su152015103