Article

Study of Settlement Patterns in Farming–Pastoral Zones in Eastern Inner Mongolia Using Planar Quantization and Cluster Analysis

1
Design College, Inner Mongolia Normal University, Hohhot 010022, China
2
School of Geographical Science, Inner Mongolia Normal University, Hohhot 010022, China
3
School of Forestry, Inner Mongolia Agricultural University, Hohhot 010019, China
4
School of Architecture, Xi’an University of Architecture and Technology, Xi’an 710055, China
*
Author to whom correspondence should be addressed.
Sustainability 2023, 15(20), 15077; https://doi.org/10.3390/su152015077
Submission received: 28 August 2023 / Revised: 4 October 2023 / Accepted: 17 October 2023 / Published: 20 October 2023

Abstract

:
Settlements are comprehensive carriers of the material form expression and social appearance of human activities under specific geographical environmental choices. The analysis and preservation of their forms are important principles and strategies for rural settlement planning and construction. In this study, 28 settlements in the farming–pastoral zones in eastern Inner Mongolia were selected as the research objects. By combining fractal geometry and computer programming, the relationship between the boundary form, spatial structure, and architectural order of the settlements was quantitatively expressed, and quantitative indicators that better summarize the form of the settlements in the farming–pastoral zones in eastern Inner Mongolia were extracted. Then, factor analysis and cluster analysis were conducted using the Statistical Package for the Social Sciences software (SPSS26.0) to obtain the characteristic types of settlement forms. Finally, the classification results were combined with social and humanistic factors and the geographical environment to test the rationality of the results. The results show that (1) five form indicators effectively describe the settlement forms in the research area, among which the shape index, dimension of the public space, and architectural density play a crucial role in the spatial structure factors. (2) In this study, we mainly used a data collection and processing–principal component extraction and systematic clustering-type division method to complete scientific research on settlement form classification. (3) By combining the clustering results with the spatial form features and analysis mainly based on spatial structure factors, the settlement forms in the farming–pastoral zones in eastern Inner Mongolia are described as three typical types: multidirectional expanding settlement, settlement patterns extending at both ends, and centripetal development settlement. Furthermore, the characteristics of the human–land relationship implicit in each type of settlement form are explained, achieving a scientific representation and classification of the settlement forms. The research results provide useful quantitative guidance for rural revitalization, settlement form optimization, and preservation in the farming–pastoral zones in eastern Inner Mongolia

1. Introduction

A village’s living environment is one of the core elements of the continuation of human well-being and sustainable development [1]. As one of the basic forms of human settlements, villages are a spatial and environmental complex composed of endogenous dynamics and external expressions and serve as the extension of production and lifestyle [2,3]. However, the decline in the aesthetic appeal of village living environments is an undisputed reality and has become a global issue [4,5]. Countries such as the Netherlands, Japan, Italy, and the United States are currently or have been facing challenges in the development of village living environments. While promoting rural economic development, improving the living environment of villages has become a universal choice for many countries around the world [6,7,8,9,10,11].
As the largest developing country in the world, the People’s Republic of China has undergone varying degrees of adjustments to the space–economy–society structure in rural areas within the distinctive urban–rural dual system [12]. While these adjustments have greatly improved the living environment and addressed existing issues in rural areas such as transportation and environmental hygiene, the disregard for the analysis and respect of the original rural space (current fabric and topography) and cultural spirit (history, culture, and sense of place), as well as the tendency toward simplified spatial planning, have led to the disappearance of urban–rural place-based spaces (public spaces) and the weakening of human experiences. In response to the decline in rural areas, the government has proposed rural revitalization as a new strategy to stimulate rural development [13,14]. In addition to the central government, various provinces and municipalities in China, such as the Inner Mongolia Autonomous Region, released the Five-Year Action Plan for Rural Pastoral Area Habitat Environment Improvement (2021–2025) in 2022. It particularly emphasizes that we should adhere to the laws of rural development, retain the rural style, and avoid homogeneity across villages [15]. Consequently, consensus has been reached in China’s rural planning field regarding the respect for the regional culture and original forms of villages. Therefore, when engaging in planning activities, the government and planners should not only focus on extracting the existing spatial patterns and constructing locally based spatial cognitive content to effectively preserve the regional context but also contemplate how to utilize these patterns for spatial interpretation, thereby facilitating the implementation of corresponding decisions.
The spatial form of settlements serves as the concentrated carrier of the regional human settlement landscape and cultural context value. The protection and continuation of their form are important principles and strategies in rural settlement planning and design. Scholars have conducted relevant research on the characteristics of settlement forms and their spatial distribution. Based on the investigation of settlements in the loess gully landform area, the evolution characteristics of traditional settlement forms in the region have been studied [16]. Taking the settlements in the hinterland of the Jianghan Plain throughout history as the object, the formation of these settlements and their connection with the geographical environment have been explained [17]. The centripetal spatial form characteristics of Hakka settlements in mountainous areas, which are characterized by backing against mountains and facing water with axial symmetry, have been visually depicted [18]. By revealing the regional differentiation pattern in Guizhou, the gradually dispersed characteristics of the settlements as they transition from mountain basins to mountains have been summarized [19]. Through field surveys and mapping in the Baishui River Valley in central Guizhou, four types of combinations of public spaces in settlements have been identified [20]. Such research generally treats settlements as independent research subjects, combining natural environment and historical factors and predominantly summarizing the form characteristics of settlements through language descriptions based on visual and textual materials.
With the increasing prevalence of interdisciplinary studies, the combination of research on the spatial form of settlements and the visualization display of geographic information systems (GIS) in China and internationally has been utilized to explore the possibilities of sustainable development for both settlements and cities, for example, analyzing the urban spatial form and predicting the urban growth through demographic and sociological factors and exploring methods and technological models that can promote harmonious urban–rural development, thus supporting the sustainability of urban development [21,22,23]. In the context of coordinated urban–rural development, strategies for sustainable development in urban and rural areas have been discussed, particularly focusing on agricultural land expansion and transformation [24,25,26]. Furthermore, research on the internal spatial characteristics of settlements or settlement site selection has been conducted to explain and analyze the spatial patterns of adaptive development in settlements [27,28,29]. The emerging index system of settlement morphology based on fractal geometry can more accurately reflect the irregular shape and complex structure of the settlement space. For example, mathematical methods such as the fractal dimension value and box-counting dimension method have been utilized to obtain fractal dimensions, which reflect the degree of structurization and spatial distribution characteristics of the settlement space [30,31,32]. Index factors such as the saturation coefficient, fractal dimension, and dispersion coefficient under the field of landscape ecology are mainly used in settlement morphology to quantify village boundaries, building unit maps, road maps, and other indicators [33,34,35]. In the field of geology, indicators such as the surface roughness, relief amplitude, and elevation are employed to construct a quantitative index system for studying the morphological characteristics and types of mountainous settlements in three-dimensional form [36,37,38]. In terms of the indicator system for quantitative research, many studies have used indicator factors in the field of fractal geometry, but these indicators are more suitable for studying settlements in the cultural core areas of China where traditional agricultural production is the primary economic structure, such as settlements on plains and in mountainous areas. They are not applicable for research on settlement morphology in cultural transition areas; non-traditional agricultural economic systems; and sandy, meadow, or composite terrains.
Compared to the cultural core area, the semi-lunar cultural transmission belt along the borders of China comprises two parts: the Great Wall zone and the Tibet–Yi Corridor. This region spans from northeast to southwest China and is objectively manifested on the geographical map of China as a wide and extensive cultural transition zone distributed on its sides. Over time, it has undergone spatial and temporal changes, giving rise to areas such as the Shaanxi–Gansu–Sichuan border, the Jiangxi–Hunan–Guangdong border, the Zhejiang–Fujian–Jiangxi border, the Inner Mongolia–northeast China border, and the Inner Mongolia–Shanxi border [39]. The cultural transition zone exhibits significant features, including a diverse geographical pattern, coexistence of various production industries and lifestyles, and the cohabitation and intertwining of multiple ethnic groups and cultures. In this complex environmental context, various settlement morphologies have emerged that are distinct from traditional agricultural regions. This is particularly evident in the scattered relationships between dwellings and farmland and the degree of architectural dispersion. However, research in this area is scarce.
The transitional zone between Daxing’anling and the Mongolian Plateau grassland region, known as the farming–pastoral zone in eastern Inner Mongolia, is one of the most typical representative areas. Numerous inland rivers not only create plains and mountain valleys but also provide conditions for irrigation in the plains and valleys. The favorable natural geographical location makes this area suitable for both farming and grazing. In history, the eastern Mongolian region was the Mongolian ethnic gathering area closest to the cultural core area. It was characterized by the immigration activities during the late Qing dynasty rushing into the northeast, which led to drastic ethnic integration in this area, gradually transforming it from a traditional grassland area into a cultural area with a mixture of Mongolian and Han population, as well as dual agricultural and pastoral production [40]. Significant changes have occurred in local production and lifestyle. The once sparse Mongolian yurts have turned into a scattered network of earth and straw houses. The wooden sheep pens used for nomadic herding have gradually been replaced by brick and stone. The winding tracks of vehicles have evolved into well-connected village paths. As a result, the settlements in the agricultural and pastoral interlacing area in eastern Inner Mongolian have become the most representative cultural interlacing settlements in China [41]. Studies on settlements in the eastern Inner Mongolia have achieved some important achievements in social and historical research on the formation of settlements in the eastern Mongolia since the Qing dynasty [42,43,44]. Investigations and surveys have been conducted on the architecture and courtyard layouts within the settlements, revealing the morphological characteristics of the settlements in eastern Inner Mongolian, which reflect the cultural integration [45,46,47]. However, existing social and humanities research on the settlements in eastern Inner Mongolia is abundant, especially research focusing on a macroscopic analysis of the settlement landscapes, and the analytical results are highly subjective. The research content lacks attention to the spatial forms of settlements in the farming–pastoral zone in eastern Inner Mongolia, especially the correlation between the production methods and settlement spatial forms.
Through a compilation of relevant research findings, it has been discovered that previous studies on rural settlement spaces still have unresolved issues requiring further exploration in the following areas. In terms of the research content, current studies have primarily focused on the material basis of the spatial forms when investigating settlement spaces and have neglected the exploration of secondary spaces related to production. Deepening research into the association between the inhabitants’ survival wisdom and culture within the settlement forms would contribute to proposing region-specific strategies for protection and heritage preservation. In terms of research methods, although quantitative research has gradually become mainstream, most studies have been based on traditional agricultural regions to establish indicators and selection methods. It is necessary to create new indicators and to employ new research methods to better understand the characteristics and diverse cultural factors of non-traditional agricultural settlements, such as dispersed settlements. Additionally, in terms of the research scope, previous studies have mainly focused on the cultural core areas of China, such as the Central Plains, Jiangnan, and Lingnan. These analyses primarily centered around rural settlements with agricultural production as the primary economic activity and Han ethnicity as the dominant cultural feature. Limited research has been conducted on the vast cultural border areas in China, such as the farming–pastoral zone in eastern Inner Mongolia, resulting in an academic imbalance.
In this paper, a statistical analysis using the Statistical Package for the Social Sciences (SPSS 26.0) mathematics software is combined with the regional cultural background to demonstrate the characteristics of the settlement forms and to classify them in a more scientific, systematic, and quantitative manner, illustrating their relationships with natural resources, cultural practices, and economic activities. By employing modern concepts, perspectives, and methodologies to analyze the settlement forms in cultural border areas, this research provides a more scientific reference for the future protection, development, and optimization of rural revitalization and settlement forms in the farming–pastoral zone in eastern Inner Mongolia.

2. Materials and Methods

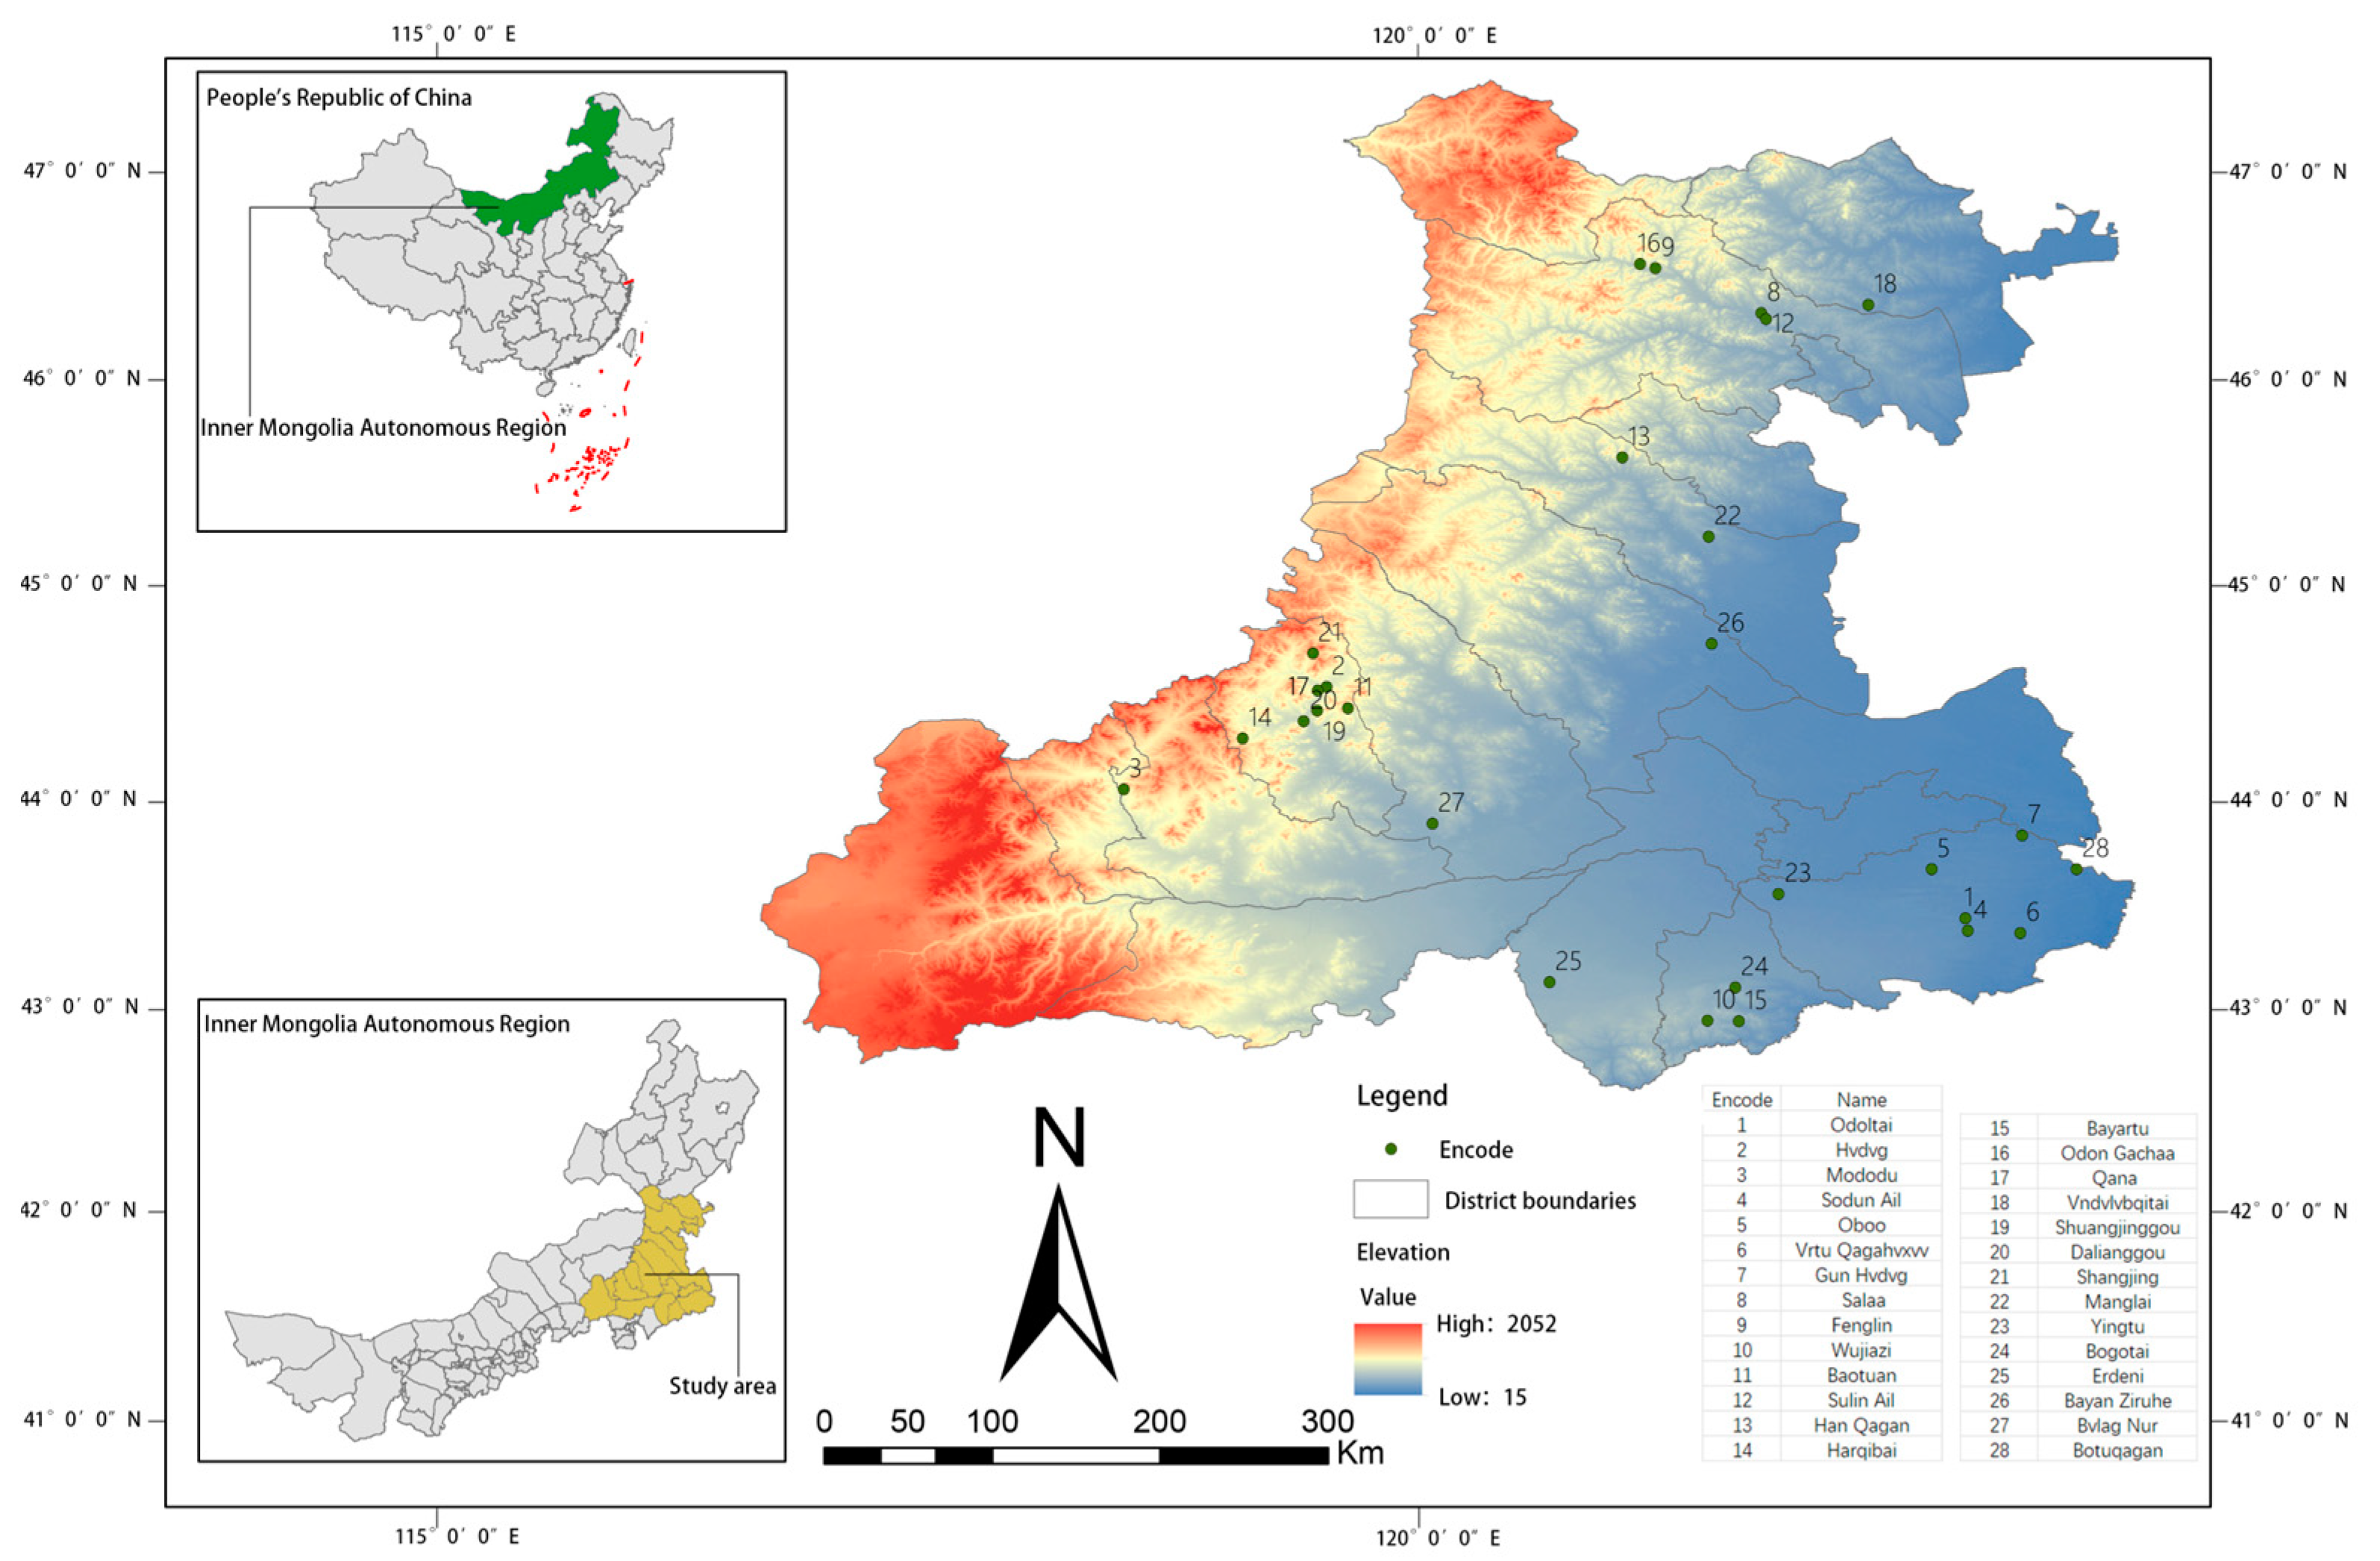
2.1. Research Sampling and Data Collection

(1) Research Sample Selection
The study area is the semi-agricultural and semi-pastoral area in the farming–pastoral zone in eastern Inner Mongolia (117°06′–123°42′ N, 42°14′–47°39′ E). Accordingly, there were 20 banners, counties, and cities under the jurisdiction of Chifeng, Tongliao, and the Hinggan League. This area predominantly consists of semi-agricultural and semi-pastoral land types, with a total area of 182,300 square kilometers, accounting for 15.4% of the total land area of the Inner Mongolia Autonomous Region.
In this study, natural settlements with relatively stable traditional forms that have continued to the present were selected by comparing Google Earth georeferenced satellite images with historical materials such as the Inner Mongolia Tongzhi and historical maps. Based on the principles of typicality and representativeness, integrity, and transport accessibility, a total of 28 settlements in the farming–pastoral zone in eastern Inner Mongolia were chosen as samples (Figure 1).
The satellite digital elevation data used of this study were obtained from the Geographic Spatial Data Cloud website, with a resolution of 30 m. The overall topographical environment within the study area includes the Yanshan Mountains in the south and connects to the Greater Khingan Mountains in the north. The Greater Khingan Mountains extend in a northeast to southwest direction, reaching the western part of the Mongolian Plateau, while the eastern and southeastern parts consist of hilly dunes that fan out, connecting to the Songnen Plain. The topography gradually decreases from south to north and from west to east, and the predominant landform type is high plateaus. This region is a typical agro-pastoral and forested transition zone, is highly sensitive to environmental changes, and also forms an important component of the eastern end of the Eurasian steppe.
(2) Data Collection and Processing
We corrected and refined the topographic data through cross-referencing with graphical and textual materials, including field surveys, map investigations, satellite imagery, and anthropological and local chronicles, and we also identified the study objects and extracted architectural floor plans, hydrological networks, and contour lines. These tasks were manually executed by professional researchers using the AutoCAD platform. To facilitate a subsequent analysis of the settlement forms, we presented the settlement morphology in a tabular format, accompanied by numerical identifiers (Figure 2). Using ArcGIS and Rhinoceros, specifically Grasshopper, we measured the spatial forms associated with the indicator system. Subsequently, we used the SPSS 26.0 software to conduct a statistical analysis of the obtained data. Through an exploratory factor analysis, we consolidated multiple indicators into several key factors. Then, utilizing a hierarchical cluster analysis, we classified the morphologies of the settlements based on these primary factors. Finally, we performed a comparative analysis to evaluate the effectiveness and accuracy of the quantified morphological indicators and classification results in relation to the spatial and geographical environment of the farming–pastoral zone in eastern Inner Mongolia. In conclusion, we identified the most representative indicator factors of the morphology of the settlements in this region. Through a combination of on-site research, settlement records from local chronicles, and archaeological data, we gained insights into the spatial value and environmental significance of these settlements so as to explore the driving forces behind the development of the settlement forms and to provide guidance for the adaptability transformation of the settlement morphology in the farming–pastoral zone in eastern Inner Mongolia.

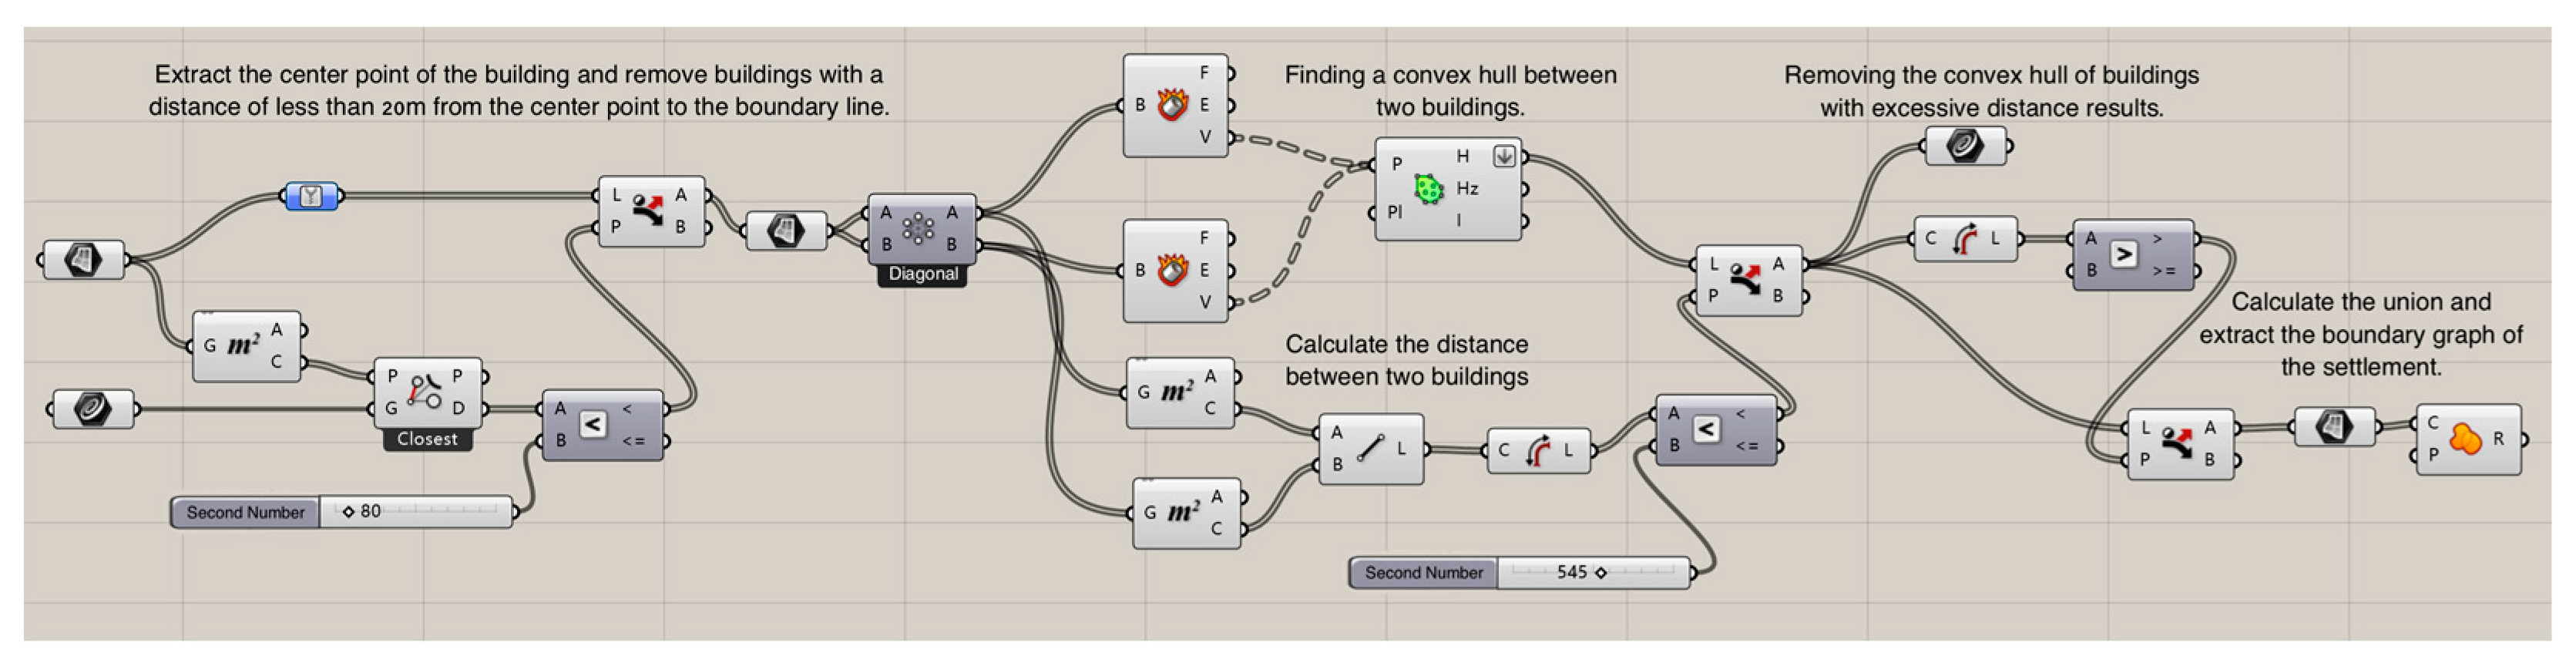
2.2. Study Methodology

(1) Indicator System Construction
Based on a review of the existing literature, the selection of the indicators focused on the quantitative perspective, adopted the suggestions of senior engineers in design units and esteemed professors and scholars from renowned universities, and clarified the best indicators that reflect the characteristics of the settlements in the farming–pastoral zone in eastern Inner Mongolia, rather than the suitability and precision in urban spaces. Additionally, considering the unique ecological environment and regional culture of the farming–pastoral zone in eastern Inner Mongolia, we consulted Google satellite maps and gathered data on the settlement texture and current conditions. Field surveys were conducted to verify and identify the spatial distribution patterns of the settlements, guiding the selection of indicators that capture features such as the dispersion, scale, and boundaries [36], which are indicative of the farming–pastoral zone in eastern Inner Mongolia. By maximizing the advantages of fractal geometry in interpreting graphics, our approach demonstrates clear advantages over traditional methods based on a surface roughness analysis and a hydrological analysis. It enables a better recognition of the primary classifying characteristics of the settlement locations in the farming–pastoral zone in eastern Inner Mongolia. Finally, the focus of this study was the exploration of the wisdom of the human settlement environment and the ethnic culture integration connotation of fractal geometry in various natural landforms. Therefore, we selected a set of five quantifiable indicators for settlement morphology based on fractal geometry, including two fundamental form indicators and three advanced form indicators. This selection of indicators allowed for exploration of the effectiveness and accuracy of the different methods of quantifying and classifying the morphology in relation to the spatial and cultural identity of the settlements (Table 1).
Plan area of the settlement
The compiled AutoCAD settlement layout was imported into Rhinoceros 7.0 in a non-geographic coordinate format, and the center point of each building in the settlement was determined first. Subsequently, in Grasshopper, we generated a Delaunay triangulation network with the building center point as the base points. This program automatically filters out buildings with a distance to the boundary of less than 20 m. The respective building numbers and minimum distance data between the two buildings connected by each linking line were output. On this basis, the standard deviation of the mean distance (μ) and the minimum distance between buildings in the cluster (σ) were calculated, and the influence distance of the buildings in the cluster (μ + 3σ) was obtained. In addition, by overlaying the convex hulls of pairwise buildings within the influence distance, the common space of the settlement was determined. This information was then used to extract the boundary of the settlement. Finally, the settlement area per square meter was calculated (Figure 3).
Length-to-width ratio
The length-to-width ratio is the ratio of the long axis to the short axis of the minimum outer rectangle within a settlement’s outer boundary pattern. It represents the overall shape of the settlement’s macro boundary, indicating the degree of the elongated characteristics [48]. Furthermore, the length-to-width ratio indicates the degree of slenderness of the settlement boundary diagram: a higher value indicates a more slender settlement.
λ = L a W a
where La represents the long axis of the minimum outer rectangle of the settlement plane boundary diagram and Wa is the short axis of the minimum outer rectangle of the settlement plane boundary diagram.
Shape index of the planar boundary pattern of the settlement
In studies of the boundary morphology, the landscape ecology commonly employs shape indices to quantify the complexity of a shape by measuring its deviation from a compact shape with the same area, such as a circle, square, rectangle, or other regular polygon. In practical situations, an ellipse with the same area and aspect ratio (referring to the aspect ratio of the settlement boundary in this context) as that of a perfect circle is often used as a reference object, which is modified from the same area of a regular circle [49]. The higher the value of the shape index is, the more trivial the form of the settlement becomes, resulting in a greater variety of spatial forms and a richer experience. In contrast, if the value of the shape index is smaller, the spatial morphology becomes simpler and more regular.
S = P 1.5 λ λ + 1.5 λ A π
where P is the perimeter of the boundary shape, A is the area, and λ is the length-to-width ratio.
Settlement building density
The settlement density is an indicator commonly used to describe the spatial state of a settlement and directly reflects the density of the buildings within the settlement [50]. When the building density of a settlement reaches a certain level, it can form localized and continuous internal boundaries, which results in a clear sense of spatiality within the settlement [51]. The formula for characterizing the density of the buildings in the settlement is as follows:
M = A a A b
where M is the settlement density; Aa is the sum of the building areas; and A b   is the total boundary area of the settlement.
Fractal dimension value of public space
There are three primary methods for calculating the fractal dimensions of urban morphology: the area–perimeter relation, the Box Counting Method, and the area–radius relation. Under specific circumstances, the first two approaches may be considered equivalent, whereas the area–radius method offers a more dynamic perspective on characterizing the urban development and morphology. However, it is essential to note that the choice of computational methodology varies during the specific calculation processes, resulting in distinct geographical spatial implications for different dimension [52]. The first method, the area–perimeter relation, is relatively straightforward. Both area and perimeter are common dimensions in architecture. Thus, we employ this approach to quantify the complexity of public spaces by examining the relationship between the area and perimeter of patches.
D = 2 l g ( P 4 ) l g ( A )
where D is the fractal dimension value of the public spatial patches; P is the perimeter of the public spatial patterns (including both the inner and outer perimeters); and A is the area of the public spatial pattern.
(2) Principal Component Factor Analysis
Principal component analysis is an analytical method that simplifies the structure of a dataset through dimensionality reduction [53]. The principal component analysis of the settlement form factors involves extracting a new set of a few, mutually independent principal component factors from multiple factors that have a certain correlation through SPSS transformation, which comprehensively reflects the information carried by the original multiple factors, thus serving as the principal components of the original factors. The number of principal component factors is small, is unrelated to each other, and carries more than 80% of the original information from multiple factors. By substituting these principal component factors for the original multiple factors, the goal of dimensionality reduction is achieved [54].
(3) System Clustering Analysis
The system clustering method is a clustering method that organizes different levels of classes from more to fewer based on inter-class distances [55]. The principal component factor system clustering of the settlement morphology factors takes the information carried by the principal component factors as its attributes, treating each settlement as a category and forming the first level. Using the distance between settlements (settlement similarity) as a statistical measure, the closest settlements with an inter-class distance are grouped into a new class, forming the second level. Then, the new classes in the second level are clustered based on the distance between classes. This process is repeated until all of the settlements are grouped into one major class. The number of clusters can be specified in advance according to the actual needs or judgement based on professional knowledge of the sample attribution of each classification number [56].

3. Results

3.1. Principal Component Factor Analysis

The prerequisite for principal component analysis is the presence of strong correlations among the factor variables, which needs to be examined to determine the feasibility of the model. The Kaiser–Meyer–Olkin (KMO) value of the indicator system is 0.713, i.e., significantly higher than 0.5 (ranging from 0 to 1, with stronger correlations closer to 1) [54], indicating a strong inter-factor correlation.
In addition, the approximate chi-squared distribution value of the Bartlett’s sphericity test is 132.906 with a significance level of 0.000, i.e., significantly less than 0.001. Therefore, the data model passes both the KMO and Bartlett’s tests and effectively summarizes the interrelationships and commonalities among the settlement morphology factors, indicating that the sample data meet the analysis requirements.
The descriptive results for the five morphological indicators in Table 2 provide the average value and intervals of the cluster morphology indicators for the entire sample. It can be observed that the cluster morphology and aspect ratio have the largest average values; the building density has the smallest average value; and the public sub-dimension and shape index have similar average values. The aspect ratio of the settlement morphology and the numerical range of the settlement area exhibit significant variations, whereas the variations among the numerical values of the shape index, building density, and public sub-dimension are relatively small.
In accordance with the requirement that the initial eigenvalues in the SPSS 26.0 software be greater than 1, the first two principal components can be extracted. The cumulative variance contribution rate is 92.46%, which meets the statistical requirement of having a cumulative contribution rate of 80–85% or higher. This indicates that the two principal components can capture 92.46% of the information from the original variables and can effectively describe the characteristics of the settlement morphology. Consequently, the initial five-factor analysis was replaced by the two principal component factors (Table 3).
Factor rotation was conducted using the maximum variance method (Table 4). After rotation, the first principal factor exhibits high loadings on the variables of plan area of the settlement and length-to-width ratio. These indicators primarily reflect the degree of inclination in the outer boundary shape of the settlement. As a result, it is named the contour morphology factor, with a variance contribution rate of 47.28%. The second principal component exhibits high loadings on the variables of the shape index of the planar boundary pattern of the settlement, the fractal dimension value of the public space, and the settlement building density, which primarily reflect the degree of fragmentation in the outer boundary and the level of internal spatial structure of the settlement. Thus, it is named the spatial structuring factor, with a variance contribution rate of 92.46% (Table 4, Figure 4).

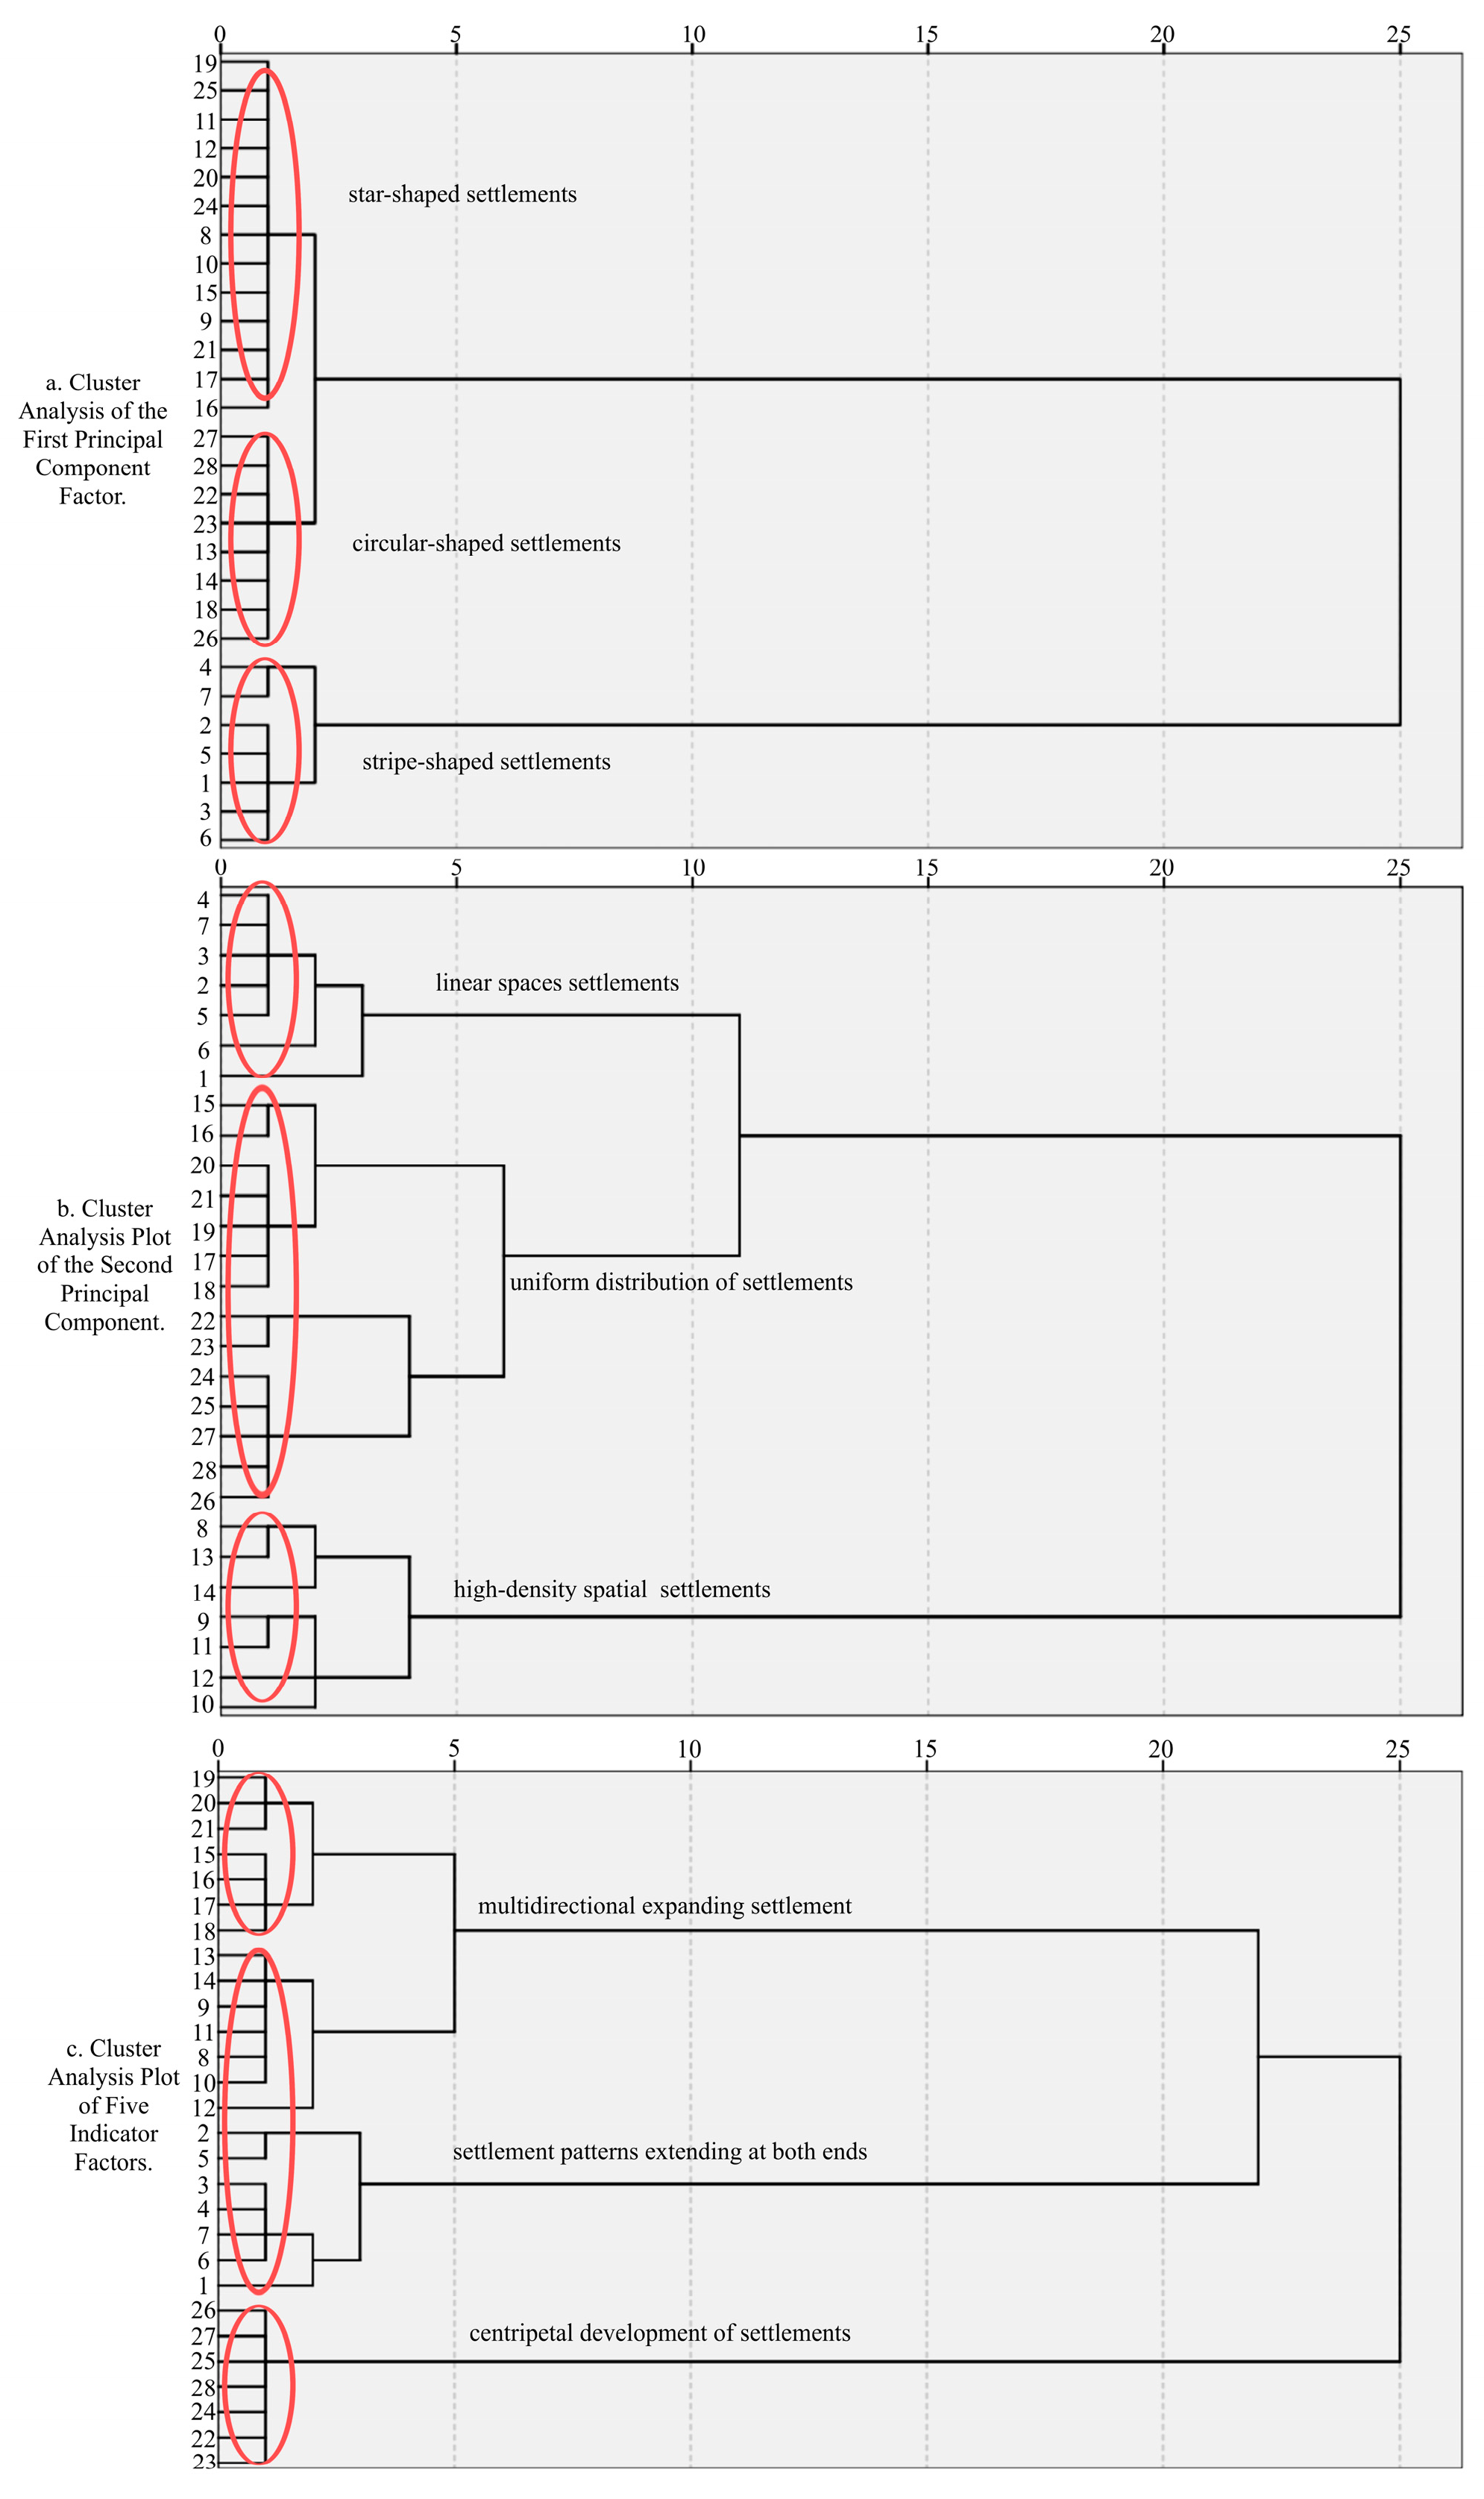
3.2. Systematic Cluster Analysis

From the above analysis and charts (Figure 5a and Table 5, it can be observed that in the analysis of the first principal component factor (settlement area and aspect ratio), the sample data for 28 settlements in the farming–pastoral zone in eastern Inner Mongolia can be classified into three major categories. The indicator data exhibit the following characteristics. (1) Clustered settlements: there are a total of eight samples (13, 14, 18, 22, 23, 26, 27, and 28), which have the smallest settlement area and length-to-width ratio values. (2) Star-shaped settlements: there are a total of 13 samples (8, 9, 10, 11, 12, 15, 16, 17, 19, 20, 21, 24, and 25), with intermediate settlement area and length-to-width ratio values. However, compared to the clustered settlements, the differences in these two indicators are not significant, and there is some overlap in the thresholds. (3) Strip settlements: there are a total of seven samples (1, 2, 3, 4, 5, 6, and 7), which have the highest settlement area and aspect ratio values, far exceeding the values of the previous two groups.
In the analysis of the second principal component factor (settlement building density, shape index, and fractal dimension value of public space), the 28 samples can be classified into three major categories and their index exhibits the following characteristics. (1) High-density spatial settlements: there are a total of seven samples (8, 9, 10, 11, 12, 13, and 14), which have the highest values for all three indicators. (2) Uniformly distributed settlements: there are a total of 14 samples (15, 16, 17, 18, 19, 20, 21, 22, 23, 24, 25, 26, 27, and 28) with relatively high shape index and public space fractal dimension values, which are slightly lower than the dense spatial settlements. However, the building density values are low. (3) Settlements in linear spaces: there are a total of seven samples (1, 2, 3, 4, 5, 6, and 7), which have the lowest values for all three indicators, and the composition of this group is identical to that of the strip settlements identified in the analysis of the first principal component factor.
In the cluster analysis of the five indicator factors, the 28 samples can be categorized into three major groups, and the indicator data display the following characteristics. (1). Multidirectional expanding settlement: there are a total of 14 samples (8, 9, 10, 11, 12, 13, 14, 15, 16, 17, 18, 19, 20, and 21). The spatial structural factors, including the shape index of the planar boundary pattern of the settlement, settlement building density, and fractal dimension value of public space, all have the highest values. The numerical values of the two contour morphology factors (i.e., the area and aspect ratio) rank second among the three groups. (2) Centrally developing settlement: there are a total of seven samples (22, 23, 24, 25, 26, 27, and 28). The values of the area, length-to-width ratio, and fractal dimension value of the public space are the lowest, while the values of the shape index and settlement building density are relatively high. Moreover, the values of the five indexes are slightly lower than those of the multidirectional expanding settlements. (3). Settlement patterns extending from both ends: there are a total of seven samples (1, 2, 3, 4, 5, 6, and 7). The three spatial structural factors have the lowest values, while the values of the two contour morphology factors are the highest and are significantly greater than those of the first two groups. Furthermore, the composition of this group is identical to that of the strip settlements identified in the analysis of the first principal component factor and that of the linear spatial settlements identified in the analysis of the second principal component factor.
In general, settlements 1, 2, 3, 4, 5, 6, and 7 exhibit identical results in all three clustering analyses. Settlements 8, 9, 10, 11, 12, 13, and 14, as well as settlements 22, 23, 24, 25, 26, 27, and 28, exhibit consistent clustering results in the analysis of the second principal component factor and the clustering analysis of the five indicator factors. Only settlements 15, 16, 17, 18, 19, 20, and 21 have different classifications in the results of the principal component factor analysis and the clustering analysis of the five indicator factors.

4. Discussion

4.1. Analysis of Clustering Results

(1) Principal component factor analysis combined with clustering results
According to the results of the three types of cluster analysis, samples 1, 2, 3, 4, 5, 6, and 7 are always classified into the same group. This group of settlements exhibits significantly higher length-to-width ratio and area values compared to the other classifications, while the remaining indices have relatively minor differences compared to those of the other groups. These findings suggest that the distinctive variations in the contour morphology of this group of settlements lead to its separate classification in each clustering analysis. Based on the analysis results presented in Section 3.2, it can be concluded that the length-to-width ratio and area indicators can only affect the development of the settlement space into a linear form with two ends, but they do not have a significant impact on further identification of the clustered morphological types when combined with the principal component factors, which also confirms the observation that the variance contribution rate of the area and length-to-width ratio is the smallest in the factor analysis results presented in Section 3.1.
To facilitate data analysis, we consolidated the results of the three clustering analyses for the non-linear developing settlements in Table 6. Through comparison of the contents of Table 6, it can be observed that the star-shaped settlements and circular-shaped settlements have samples assigned to centrally development settlements and multidirectional expanding settlements, indicating an overall lack of clear inclination in the classification results. Although the majority of the star-shaped settlements (11/13) are classified as multidirectional expanding settlements, the composition of their spatial structures is relatively balanced (five highly dense space + six uniform distribution of space). This fails to demonstrate the extent to which this factor influences the final clustering. Thus, it can be ascertained that the plan area of the settlement and length-to-width ratio indicators for non-linear settlements do not play a significant role in the classification results.
In comparison, all of the high-density spatial settlements are classified as multidirectional expanding settlements, highlighting the primary role of the spatial structure in the classification of the settlements. Additionally, although the 14 samples in the uniform distribution of space settlements are ultimately assigned to two different types of settlements, when considering the classification based on contour morphology, the settlement assigned to the multidirectional expanding settlement classification (six star-shaped + one circular-shaped) clearly lean toward the star-shaped form, while the samples assigned to the centripetal development of settlements classification (five circular-shaped + two star-shaped) clearly lean toward a circular-shaped form. The contour morphology factor demonstrates a tendency to refine the result of the spatial structure. The combination of the data analysis results and the settlement morphology classification diagram effectively explains the significant influences of the three indicators of the spatial structure factors on the settlement morphology classification results, with the contour morphology factor having some influence, albeit not significant.
(2) Spatial characteristics of cluster analysis data (Table 7)
① Contour morphology characteristics:
The linear settlements exhibit an overall morphology that extends in two directions, clearly displaying the characteristic of horizontal development. The clustered settlements exhibit a morphology characterized by cohesive blocks. The star-shaped settlements do not exhibit apparent inclination, and the overall morphology of the settlements is characterized by multiple coexisting axial directions.
② Spatial structure characterization:
The representation of the data results in terms of the spatial structure of the settlements: The linear spatial settlements exhibit softened boundaries, appropriate spacing between buildings within the settlement, spatial complexity with a low level of fragmentation, arrangement of the buildings within the settlement along roads, and a strong spatial order structure. For the uniformly distributed settlements, the buildings within them are relatively loosely scattered, with clear undulating boundary forms, a high degree of spatial fragmentation within the settlements, and a lack of spatial coherence. The dense spatial settlements, influenced by the surrounding environment, exhibit significant variations in the curvilinear nature of their boundaries, clustering of buildings within the settlements, high levels of spatial compactness, complex fragmentation within the settlements’ internal space, and a weaker sense of order.
③ Characteristics of settlement development pattern:
The boundaries of the multidirectional expanding settlements exhibit a diverse and intricate form, with a high concentration of buildings within, a fragmented internal space without a clear hierarchy, and settlement boundary formation that is largely influenced by the surrounding environment. The settlement patterns extending at both ends have comparably longer and more harmonious boundary lines, a strong sense of order with linearly arranged buildings, and a regular and orderly spatial structure. On a large scale, they present strip-like shapes, indicating a trend of expansion and development toward both ends. The centrally developing settlements have a generally smooth overall boundary form but, with some twists and turns, contain a scattered point-like distribution of buildings without a discernible pattern, a disorganized internal space, a lack of order, and a high degree of fragmentation. On a small scale, they exhibit a cluster-like form, indicating a tendency for even development in all directions.

4.2. Factor Analysis

In this study, various indicators such as the settlement shape index and public fractal dimension of the different categories were compared. The results indicate that there is a high degree of similarity among the different settlements within the same category, while significant differences exist between settlements of different types. By employing qualitative analysis methods and integrating the results of the cluster analysis with the spatial structural characteristics of the settlements the farming–pastoral zone in eastern Inner Mongolia, it was found that the classification of the settlement types is closely related not only to the aforementioned indicators but also to the environmental factors and the production and lifestyle of the villagers. This demonstrates that the classification results have a significant practical significance. Table 3. Matrix eigenvalue and variance contribution rate of factor analysis.
(1) Multidirectional Expanding Settlement
The shape index, public sub-dimension, and building density values of the multidirectional expanding settlements are the highest. This indicates that such settlements have complex and fragmented outer boundaries, strong internal structural organization, and a highly efficient building spatial organization. Notably, settlements 15, 16, 17, 18, 19, 20, and 21 are often traversed by a main road, and their boundary shape, building density, and fractal dimension are heavily influenced by transportation development. As convenience of transportation becomes increasingly important, buildings are constructed parallel to the roads. In contrast, settlements 8, 9, 10, 11, 12, 13, and 14 mostly formed spontaneously around the edges of the foothills. Except for the side limited by the mountain, the boundaries of these settlements have naturally expanded outward. Due to the limited natural conditions required for farming in these settlements, the buildings are clustered together, and the flat land on the periphery is utilized for agricultural activities. Settlements 15, 16, 17, 18, 19, 20, and 21 have larger utilization and construction areas, have experienced faster expansion, and have a larger scale, whereas settlements 8, 9, 10, 11, 12, 13, and 14 have been more significantly influenced by the topographical environment, resulting in fragmented internal spaces, a weak sense of order, and a smaller scale.
Throughout history, the multidirectional expanding settlements have been influenced by the immigration and cultivation policies of the Qing dynasty, leading to a settlement form that is mainly focused on agriculture and animal husbandry, with the combined development of agriculture, animal husbandry, and forestry. These settlements are located on gentle slopes or foothills, and natural mountain barriers shield them from cold winds in winter and facilitate the flow of cool breezes in summer, thus achieving the effect of air circulation and cooling. This not only provides a strong defense but also minimizes geological damage. It also offers a certain degree of concealment [57]. Through investigation, it was found that the multidirectional expanding settlements were mainly distributed in the hilly and gully areas with significant topographical variations. These settlements were built against the mountains and have spread toward the mountaintops or along the roads. In gently sloping areas, isolated houses were more common. Villagers have relied on planting forests on the slopes as windbreaks and have utilized the flat areas in front of the mountains for agricultural production. The combination of agriculture, animal husbandry, and forestry, along with the terraced pattern formed on the slopes, has resulted in a multidimensional landscape system with a good panoramic view. The internal road systems of these settlements were relatively simple, allowing for the full utilization of the land resources. For the settlements built in accordance with the terrain, their scopes also expanded, demonstrating the stability of the settlement forms and reflecting the ecological wisdom of residents in adapting to the natural environment.
(2) Settlement patterns extending at both ends
The length-to-width ratio values of this type of settlement are the highest among all of the settlement categories, while the shape index, building density, and fractal dimension values of these settlements are the lowest values. This indicates that these settlements are relatively large in scale, have simple and smooth planar boundaries, and exhibit a trend of linear development at both ends. The relationship between the settlements and road transportation is closely intertwined, with a low building density within the settlements and a strong sense of spatial order.
Settlements 1, 4, 7, 6, and 5 are distributed in a belt-like grassland area oriented in the east–west direction, where pastoralists have settled and formed agriculture-based, mixed farming settlements. The two ends of the settlements extend into flat and open surroundings. These settlements have developed into a linear shape along the roads, i.e., long in the east–west direction and narrow in the north–south direction, and exhibit a grid-like spatial organization for internal transportation. Settlements 2 and 3 are located on gentle slopes on both sides of the valley, and these settlements are arranged along the contour lines of the mountains or waterway roads. The flat land near the rivers is utilized as arable land, and the water bodies are one of the main factors influencing the construction of the settlements. In summary, as the number of immigrants increases, the production and livelihood of the villagers relies more on water resources and the road transportation system. The settlement patterns have evolved from a random distribution to a significant clustering distribution, which facilitates both concentrated living and dispersed grazing. This layout not only meets the needs of villagers for safe living but also meets the production requirements, reflecting the relationship between the two production modes of agriculture and nomadic pastoralism, and the typical local relationship between pastoralists and the land is shaped by nature.
(3) Centripetal Development of Settlements
This type of settlement has the lowest fractal dimension values, while the shape index and building density values are intermediate, indicating that the outer boundary of the settlement is simple and the internal building layout is scattered. Through on-site investigations, it has been observed that these settlements have developed in a concentric manner, with buildings facing the same direction and often located in flat sandy or grassland areas. Settlements 24, 25, 28, and 27 have a relatively large scale, with residential areas that are far larger than the national standards. They encompass living spaces, livestock breeding areas, and agricultural cultivation spaces, reflecting the livelihood needs of farming and herding households. During the process of transition from a nomadic lifestyle to settled communities, such settlements were often established on flat grassland areas and have gradually evolved through a relatively arbitrary selection of settlement points and organizational forms. Within these settlements, large areas are devoted to livestock pens, resulting in a dispersed, punctiform morphology that embodies the spatial characteristics of small-scale livestock production and large-scale migrations [58]. In contrast, the residents of settlements 26, 23, and 22, which are distributed on gentle sandy terrain, rely primarily on the county roads passing through their interiors for external development. These settlements exhibit a strong sense of order in their internal streets and alleys, presenting a grid-like layout.
In summary, the residents of these settlements have chosen a settled lifestyle primarily centered around pastoral activities. Due to the limited carrying capacity of the local region, the organization of productive spaces within the settlements is often combined with more distant grazing areas. Livestock, such as cattle and sheep, are grazed daily within fenced private pastures, giving rise to a planned grazing or rotational grazing livelihood approach [59]. The continuous expansion of sandy areas in settlements has caused damage to the arable land. In light of the relatively low productivity levels, to avoid conflicts arising from limited resources and a growing population, the number of people accommodated in the settlements has decreased, and their scale has gradually diminished. Despite the dispersed nature of the households within the settlements and the absence of a prominent central space, the cohesive nature of these settlements can be discerned from their gentle boundary morphology.
(4) Summary
In the course of history, the farming–pastoral zone in eastern Inner Mongolia has developed distinctive morphological characteristics in terms of the density, distribution, and scale, which differ from those of settlements in regions with a uniform topography. In these settlements, the mode of production and life adapted to the environment in the pastoral–agricultural zone and has gradually solidified as a unique spatial concept and pattern specific to the ethnic groups in this region [60].
Traditionally, both pastoral and agricultural settlements have relied on nature for food, but agricultural settlements have had a lower degree of dependence on the natural environment compared to pastoral areas. Agricultural residential patterns often exhibit a harmonious distribution and are nestled against mountains and along water sources, including valleys, tidal flats, farmland, forests, residential plots, and houses [16,17,18]. The normal structure of pastoral settlements is a circular scattered pattern, characterized by the organic combination of expansive and flat grasslands, fixed migratory campsites, and freely roaming herds [61].
The settlements in the semi-agricultural and semi-pastoral transitional zone in eastern Inner Mongolia, which is the primary economic form, exhibit the characteristics of both pastoral and agricultural settlements [62]. Due to the ecological consciousness of respecting nature and adapting to nature, the shape of these settlements is relatively constrained by the natural environment, reflecting the principle of adjusting measures to local conditions in terms of the proportions of agricultural and pastoral economies, livestock grazing patterns, and grazing radius. These factors determine the distance between courtyards, the boundaries of villages and towns, and the degree of fragmentation in public spaces, thus becoming the dominant elements influencing the spatial form of these settlements. Different forms of semi-agricultural and semi-pastoral activities result in the settlements having diverse internal spatial arrangements, which is also the practical reason why the spatial structural factors are the main components in the analysis of settlements.
Affected by the macro policy environment, agricultural modernization, and micro agricultural culture, pastoralists who were originally engaged in nomadic farming have gradually accepted some agricultural lifestyles and farming techniques, have embarked on the path of high-yield planting, and have improved their ability to transform resources and the environment and to resist risks [63]. However, as living standards have significantly improved, a series of challenges arising from the unsustainable exploitation of grasslands, such as resource overloading and environmental degradation, have gradually emerged. The development of settlements in the farming–pastoral zone in eastern Inner Mongolia has neglected the factor of the environmental carrying capacity. Consequently, while these settlements are interconnected, they collectively face challenges in terms of environmental degradation, resource depletion, and waste pollution, hindering their sustainable development [64]. Furthermore, a crucial issue is how to preserve the unique culture and way of life inherent to the Mongolian region amidst the process of cultural assimilation.

5. Conclusions

Compared with previous research, in this study, we analyzed the classification characteristics of the settlement morphology in the farming–pastoral zones in eastern Inner Mongolia under the selected morphological quantitative indicators. Five indicators suitable for measuring the morphology of settlements in the farming–pastoral zones in eastern Inner Mongolia were selected. Through a mathematical analysis, these indicators were extracted as two principal component factors: contour morphological factors and spatial structural factors. A cluster analysis revealed that the spatial structural factor is the primary factor, while the contour morphological factor is the secondary factor. Furthermore, the cluster analysis was used to classify the settlement morphology, resulting in the identification of three major types of typical settlement morphologies in the farming–pastoral zones in eastern Inner Mongolia: ① multidirectional expanding settlements; ② settlement patterns extending at both ends; and ③ centrally developing settlements. Finally, the combination of the classification results with the social, cultural, and geographical factors demonstrated the significant influence of the spatial structure factors on the clustering results, as well as the rationality of the three categories of the settlement classification. This reflects the profound influence of the semi-agricultural and semi-pastoral production mode on the spatial characteristics of the settlements in the farming–pastoral zones in eastern Inner Mongolia, as well as the integration of the internal and external environments of the settlements with the natural landscape, resulting in a holistic human habitat environment.
During the Qing Dynasty, due to immigration and cultivation, settlements emerged in the farming–pastoral zones in eastern Inner Mongolia. These settlements were influenced by factors such as agricultural immigration from the mainland and the social environment and natural conditions at that time [42]. Regarding the contour morphological features of the settlements, they exhibited some unique regional characteristics in terms of their spatial structure. We used spatial structure factors (shape index, building density, and fractal dimension value of the public space) to measure the complexity of the boundaries, the degree of structurization of public spaces, and the intensity of the building within the settlements in the farming–pastoral zones in eastern Inner Mongolia. The results provide a more comprehensive understanding of the relationship between the overall and local spaces of the settlements and the unique spatial characteristics. The analysis of contour boundary factors (settlement area and length-to-width ratio) helps to consider the relationship between the site selection, boundary forms, and nature under different topographic conditions. For instance, the layout of the road network and public facilities in the village should be based on the spatial typology of the plane form as an important consideration for construction. Furthermore, the location of newly built structures should fully consider the existing building density within the settlements, and their spatial relationship with the original buildings should be scientifically determined [65]. Scientifically quantifying the analysis of settlement morphological structures is necessary to create a favorable human habitat environment and to avoid the homogenization and urbanization of new village construction. These measures are crucial for the sustainable development of settlements, as well as for improving the current situation of the homogeneity among villages and for maintaining the regional characteristics of settlements [66].
Nonetheless, the morphological approach has limitations, and certain indicators and data require further improvement. In this study, the acquisition and processing of the original topographic maps were manually adjusted, and this process needs to be enhanced through automated processing methods to improve both the efficiency and accuracy of the results. Furthermore, automated techniques and algorithms can be considered to reduce the need for manual intervention and to improve the processing precision in order to achieve this improvement. Accordingly, future research can focus on improving the accuracy of open-source topographic data and/or utilizing advanced techniques such as 3-D laser scanning and oblique photogrammetry to efficiently acquire and quantify high-precision topographic data, thus enhancing the accuracy and reliability of the terrain data.
Another limitation is the relatively small sample size, which is the result of the difficulty of obtaining accurate topographic data for residential areas. Moreover, the samples were not randomly sampled, which may result in inconsistent and unreliable results. In future research, it is hoped that more extensive and comprehensive sampling surveys can be conducted in the farming–pastoral zone in eastern Inner Mongolia to explore and improve the existing classification system. Through such surveys, we can accurately and thoroughly summarize the morphological features of various ethnic settlements and obtain more detailed classification results. Such research will contribute to a better understanding of ethnic settlement landscapes and provide more targeted and adaptable recommendations for design and planning.
Alternatively, in the process of multicultural coexistence and mutual influence of different ethnic groups, as well as the conflict and integration between nomadic and agricultural cultures, the construction and reconstruction of multiethnic settlement landscapes is a multidimensional concept that can extend to a larger scope encompassing elements, functions, and patterns [62]. Currently, the primarily focus of morphological research in the field of settlement landscapes conducted is the architectural forms within settlements and their associated cultural representations, and insufficient attention has been paid to the protection of tangible and intangible assets related to human ecology. Therefore, future research should not only focus on the conservation of biodiversity and ecosystem restoration related to nature but also focus on the aspects of historical and cultural values relevant to human beings, including religion, habitation, socio-cultural factors, and community life [67,68,69].
In this study, factor analysis and systematic clustering methods were combined with quantitative methods for defining and classifying the morphological characteristics of settlements. This approach allowed us to preliminarily determine and classify the spatial forms of the settlements and to scientifically compare the morphological characteristics of the different categories. In addition, in this study, a set of scientific and systematic methods for extracting and classifying the characteristics of settlement patterns, which standardizes the previous qualitative classification studies that were primarily based on geometric shapes, was developed. It is beneficial for different types of settlements to seek to develop patterns that align with the requirements of sustainable development based on their own morphological characteristics. It provides a more scientific approach compared to intuitive cognition and represents a further attempt at quantitative research in the study and classification of settlement forms. Furthermore, this innovative research perspective provides a theoretical basis and technical methods for the protection and renovation of settlements in different ethnic regions.

Author Contributions

H.X.: Data curation, Writing—original draft, Software, Visualization. Q.G.: Conceptualization, Writing—review and editing, Funding acquisition, Supervision. C.S.: Funding acquisition, Project administration. Y.L.: Funding acquisition, Project administration. F.G.: Formal analysis, Investigation, Software, Visualization. All authors have read and agreed to the published version of the manuscript.

Funding

National Natural Science Foundation of China (grant number 42201374), Inner Mongolia Natural Science Foundation project (grant number 2021BS04001), Inner Mongolia Autonomous Region Natural Science Foundation Project (grant number 2021BS05009), Basic Research Business Fee Project of Inner Mongolia Normal University (grant number 2022JBQN137).

Institutional Review Board Statement

Not applicable.

Informed Consent Statement

Not applicable.

Data Availability Statement

The data will be available from the corresponding author upon reasonable request.

Conflicts of Interest

The authors declare no conflict of interest.

References

  1. Zhang, T.; He, D.; Kuang, T.; Chen, K. Effect of Rural Human Settlement Environment around Nature Reserves on Farmers’ Well-Being: A Field Survey Based on 1002 Farmer Households around Six Nature Reserves in China. Int. J. Environ. Res. Public Health 2022, 19, 6447. [Google Scholar] [CrossRef] [PubMed]
  2. Zhao, S.; Zhang, Y. Ecosystems and Human Well-Being: The Achievements, Contributions and Prospects of the Millennium Ecosystem Assessment. Adv. Earth Sci. 2006, 21, 895. [Google Scholar]
  3. Wang, Y.; Zhu, Y. Exploring the effects of rural human settlement on rural development: Evidence from Xianju County in Zhejiang Province, China. Environ. Dev. 2023, 46, 100845. [Google Scholar] [CrossRef]
  4. Esch, T.; Brzoska, E.; Dech, S.; Leutner, B.; Palacios-Lopez, D.; Metz-Marconcini, A.; Marconcini, M.; Roth, A.; Zeidler, J. World Settlement Footprint 3D-A first three-dimensional survey of the global building stock. Remote Sens. Environ. 2022, 270, 112877. [Google Scholar] [CrossRef]
  5. Mahendra, A.; Seto, K.C. Upward and Outward Growth: Managing Urban Expansion for More Equitable Cities in the Global South World Resources Report. Washington, DC. 2019. Available online: www.citiesforall.org (accessed on 27 August 2023).
  6. van Dam, F.; Heins, S.; Elbersen, B.S. Lay discourses of the rural and stated and revealed preferences for rural living. Some evidence of the existence of a rural idyll in the Netherlands. J. Rural Stud. 2002, 18, 461–476. [Google Scholar] [CrossRef]
  7. Dilley, L.; Gkartzios, M.; Odagiri, T. Developing counterurbanisation: Making sense of rural mobility and governance in Japan. Habitat Int. 2022, 125, 102595. [Google Scholar] [CrossRef]
  8. Elshof, H.; van Wissen, L.; Mulder, C.H. The self-reinforcing effects of population decline: An analysis of differences in moving behaviour between rural neighbourhoods with declining and stable populations. J. Rural Stud. 2014, 36, 285–299. [Google Scholar] [CrossRef]
  9. De Montis, A.; Ledda, A.; Ganciu, A.; Serra, V.; De Montis, S. Recovery of rural centres and “albergo diffuso”: A case study in Sardinia, Italy. Land Use Policy 2015, 47, 12–28. [Google Scholar] [CrossRef]
  10. Glasgow, N.; Brown, D.L. Rural ageing in the United States: Trends and contexts. J. Rural Stud. 2012, 28, 422–431. [Google Scholar] [CrossRef]
  11. McGranahan, D.A. Landscape influence on recent rural migration in the US. Landsc. Urban Plan. 2008, 85, 228–240. [Google Scholar] [CrossRef]
  12. Yang, Y.; Bao, W.; Wang, Y.; Liu, Y. Measurement of urban-rural integration level and its spatial differentiation in China in the new century. Habitat Int. 2021, 117, 102420. [Google Scholar] [CrossRef]
  13. Zang, Y.; Liu, Y.; Yang, Y.; Woods, M.; Fois, F. Rural decline or restructuring? Implications for sustainability transitions in rural China. Land Use Policy 2020, 94, 104531. [Google Scholar] [CrossRef]
  14. Long, H.; Liu, Y.; Li, X.; Chen, Y. Building new countryside in China: A geographical perspective. Land Use Policy 2010, 27, 457–470. [Google Scholar] [CrossRef]
  15. General Office of the Party Committee of Inner Mongolia Autonomous Region General Office of the People’s Government of the Autonomous Region Issues Implementation Plan for the Five-Year Action to Improve and Enhance the Habitat Environment in Rural and Pastoral Areas (2021–2025). Available online: https://xczxj.nmg.gov.cn/ywdt/zxdt/202304/t20230412_2289957.html?dzb=true (accessed on 27 August 2023).
  16. Han, X.; Song, G. Study on form evolution of traditional settlement in ravine of the Loess Plateau. J. Xi’an Univ. Archit. Technol. (Nat. Sci. Ed.) 2016, 48, 709–713, (In Chinese with English abstract). [Google Scholar]
  17. Lu, X.; Han, K. Formatting and Evolution of the Scattered Villages in the Traditional China:Discussion Around the Form of Rural Settlement in Jiang-Han Plain. J. Chin. Hist. Geogr. 2011, 26, 77–91+104, (In Chinese with English abstract). [Google Scholar]
  18. Lu, D.; Han, X.; Zhao, J. Study on the Spatial Form and Integration Rule of Guangfu-Type Guest and Overseas Chinese Settlements from the Perspective of Cultural Integration:A Case Study of Huangdong Village, Fenggang Town, Dongguan City. Urban Dev. Stud. 2022, 29, 42–48, (In Chinese with English abstract). [Google Scholar]
  19. Zhao, X. Research on settlement culture type and the characteristics in Guizhou Karst Area. Carsologica Sin. 2010, 29, 457–462, (In Chinese with English abstract). [Google Scholar]
  20. Zhou, Z.; Luo, Y.A. morphology study on the public space of Buyi villages in the Baishui River Valley, central Guizhou. J. Xi’an Univ. Archit. Technol. (Nat. Sci. Ed.) 2018, 50, 258–264, (In Chinese with English abstract). [Google Scholar]
  21. Stevens, D.; Dragicevic, S.; Rothley, K. iCity: A GIS–CA modelling tool for urban planning and decision making. Environ. Model. Softw. 2007, 22, 761–773. [Google Scholar] [CrossRef]
  22. Kazemi, F.; Hosseinpour, N. GIS-based land-use suitability analysis for urban agriculture development based on pollution distributions. Land Use Policy 2022, 123, 106426. [Google Scholar] [CrossRef]
  23. Valjarević, A.; Filipović, D.; Živković, D.; Ristić, N.; Božović, J.; Božović, R. Spatial Analysis of the Possible First Serbian Conurbation. Appl. Spat. Anal. Policy 2021, 14, 113–134. [Google Scholar] [CrossRef]
  24. Liu, Z. Rural Population Decline, Cultivated Land Expansion, and the Role of Land Transfers in the Farming-Pastoral Ecotone: A Case Study of Taibus, China. Land 2022, 11, 256. [Google Scholar] [CrossRef]
  25. Fazal, S. Urban expansion and loss of agricultural land—A GIS based study of Saharanpur City, India. Environ. Urban. 2000, 12, 133–149. [Google Scholar] [CrossRef]
  26. Zhou, T.; Koomen, E.; Ke, X. Determinants of Farmland Abandonment on the Urban–Rural Fringe. Environ. Manag. 2020, 65, 369–384. [Google Scholar] [CrossRef]
  27. Cutting, M. More than one way to study a building: Approaches to prehistoric household and settlement space. Oxf. J. Archaeol. 2006, 25, 225–246. [Google Scholar] [CrossRef]
  28. Zhou, Z.; Jia, Z.; Wang, N.; Fang, M. Sustainable Mountain Village Construction Adapted to Livelihood, Topography, and Hydrology: A Case of Dong Villages in Southeast Guizhou, China. Sustainability 2018, 10, 4619. [Google Scholar] [CrossRef]
  29. Li, G.; Jiang, G.; Jiang, C.; Bai, J. Differentiation of spatial morphology of rural settlements from an ethnic cultural perspective on the Northeast Tibetan Plateau, China. Habitat Int. 2018, 79, 1–9. [Google Scholar] [CrossRef]
  30. Shao, W.; Li, Z.; Ye, M. Study on the Spatial Form and Elements of Huizhou Traditional Residential Courtyard Based on Clustering Analysis. South Archit. 2022, 1, 76–84, (In Chinese with English abstract). [Google Scholar]
  31. Liang, F.; Liu, S.; Liu, L. Spatial characteristics and evolution of rural settlement landscape based on fractal theory: A case study of Xiamen, China. Chin. J. Appl. Ecol. 2017, 28, 2640–2648, (In Chinese with English abstract). [Google Scholar]
  32. Nguyen, T.T.; Hoffmann, E.; Buerkert, A. Spatial patterns of urbanising landscapes in the North Indian Punjab show features predicted by fractal theory. Sci. Rep. 2022, 12, 1819. [Google Scholar] [CrossRef]
  33. Pu, X.; Wang, Z.; Gao, L.; Huang, Q. House Plane Figure in Rural Settlement. Archit. J. 2013, 5, 111–115, (In Chinese with English abstract). [Google Scholar]
  34. Deng, Y.; Fu, X.; Zheng, W.; Zhang, H. Representation, measurement and attribution of spatial order of traditional villages in southern Hunan. Geogr. Res. 2021, 40, 2722–2742, (In Chinese with English abstract). [Google Scholar]
  35. Chai, X.; Tao, W.; Lu, J. Formation and Evolution of Traditional Village Material Form Based on Conzenian Approach: A Case Study of Nongme Village of Dai Ethnic. Hum. Geogr. 2022, 37, 90–99, (In Chinese with English abstract). [Google Scholar]
  36. Jia, Z.-Y.; Meng, C.-Y.; Zhou, Z.-X. A 3-D morphological approach on spatial form and cultural identity of ethnic mountain settlements: Case from Guizhou, China. J. Mt. Sci. 2021, 18, 1144–1158. [Google Scholar] [CrossRef]
  37. Wu, Q.; Guo, F.; Li, H.; Kang, J. Measuring landscape pattern in three dimensional space. Landsc. Urban Plan. 2017, 167, 49–59. [Google Scholar] [CrossRef]
  38. Rogers, D.; Cooper, A.; McKenzie, P.; McCann, T. Assessing regional scale habitat area with a three dimensional measure. Ecol. Inform. 2012, 7, 1–6. [Google Scholar] [CrossRef]
  39. Zhao, D. Cultural Diffusion, Shamanism Bottom and Early Chinese Cultural Perspective—Tong Enzheng’s Crescent-Shaped Cultural Diffusion Belt in Borderland” in Retrospect. J. Sichuan Univ. (Philos. Soc. Sci. Ed.) 2023, 3, 28–39, 190–191, (In Chinese with English abstract). [Google Scholar]
  40. Wu, J.; Zhang, Q.; Li, A.; Liang, C. Historical landscape dynamics of Inner Mongolia: Patterns, drivers, and impacts. Landsc. Ecol. 2015, 30, 1579–1598. [Google Scholar] [CrossRef]
  41. Wang, Y. Transforming Inner Mongolia: Commerce, Migration, and Colonization on the Qing Frontier; Rowman & Littlefield: Lanham, MD, USA, 2021; pp. 188–190. [Google Scholar]
  42. Wang, Y. Development and Change: The Transformation from Grazing to Agriculture in Eastern Inner Mongolia in Qing Dynasty; Inner Mongolia University Press: Hohhot, China, 2000; pp. 138–156, (In Chinese with English abstract). [Google Scholar]
  43. Borjigidai Uyunbilig (Oyunbilig). The Formation of Modern Mongolian Farming Village Society; Inner Mongolia University Press: Hohhot, China, 2007; pp. 126–149, (In Chinese with English abstract). [Google Scholar]
  44. Pasternak, B.; Salaff, J.W. Cowboys and Cultivators: The Chinese of Inner Mongolia; Westview Press: Salaff Boulder, CO, USA, 1993; pp. 204–205. [Google Scholar]
  45. Su, D.E.; Na, S.D.; Dong, F.J.; Su, B.G.Z.L.; Su, L.D.; Su, Y.L.Q.G.; Ma, S.Q. Study on the Settlement Change in Tongliao Region from 1635 to 2019. Geogr. Sci. 2021, 41, 2011–2020, (In Chinese with English abstract). [Google Scholar]
  46. Li, P. The distribution of settlements in the Liao Dynasty and modern agricultural settlements in the Horqin Sandy Land—Taking the area of the second forest farm in Tongliao City, Inner Mongolia as an example. J. Inn. Mong. Univ. Natl. (Soc. Sci. Ed.) 2012, 38, 80–84, (In Chinese with English abstract). [Google Scholar]
  47. Liu, B. Investigation and Research on Rural Settlement Space in Inner Mongolia. Master’s Thesis, Inner Mongolia University of Science and Technology, Baotou, China, 2019. (In Chinese with English abstract). [Google Scholar]
  48. Hu, M.; Feng, D.; Wu, Y. Shadow Denoising of Urban Regular Buildings. Remote Sens. Inf. 2022, 35, 123–128. [Google Scholar]
  49. Moser, D.; Zechmeister, H.G.; Plutzar, C.; Sauberer, N.; Wrbka, T.; Grabherr, G. Landscape patch shape complexity as an effective measure for plant species richness in rural landscapes. Landsc. Ecol. 2002, 17, 657–669. [Google Scholar] [CrossRef]
  50. Liu, K.; Liao, C.; Chen, Y.; Huang, Y. Quantitative Study on the Spatial Characteristics of the Settlements in Buwa Qiang Village. Archit. Cult. 2018, 12, 205–207, (In Chinese with English abstract). [Google Scholar]
  51. Marshall, S.; Gong, Y.; Green, N. Urban compactness: New geometric interpretations and indicators. Math. Urban Morphol. 2019, 431–456. [Google Scholar] [CrossRef]
  52. Si, Q.; Fang, Y.; Wu, L. The pattern characteristics and formation processes of rural settlements in the agro—Pastoral zone—The case of Jarud Banner, Inner Mongolia, China. J. Arid Land Resour. Environ. 2016, 8, 30, (In Chinese with English abstract). [Google Scholar]
  53. Bryant, F.B.; Yarnold, P.R. Principal-components analysis and exploratory and confirmatory factor analysis. In Reading and Understanding Multivariate Statistics; Grimm, L.G., Yarnold, P.R., Eds.; American Psychological Association: Washington, DC, USA, 1995; pp. 99–136. [Google Scholar]
  54. Joliffe, I.; Morgan, B. Principal component analysis and exploratory factor analysis. Stat. Methods Med. Res. 1992, 1, 69–95. [Google Scholar] [CrossRef]
  55. Dubes, R.C. Cluster analysis and related issues. In Handbook of Pattern Recognition and Computer Vision; World Scientific: Singapore, 1999; pp. 3–32. [Google Scholar]
  56. Tan, P.N.; Steinbach, M.; Kumar, V. Data mining cluster analysis: Basic concepts and algorithms. Introd. Data Min. 2013, 487, 533. [Google Scholar]
  57. Tian, G.; Qiao, Z.; Zhang, Y. The investigation of relationship between rural settlement density, size, spatial distribution and its geophysical parameters of China using Landsat TM images. Ecol. Model. 2012, 231, 25–36. [Google Scholar] [CrossRef]
  58. Zhang, L.; Zhao, T.; Rong, L. Construction of public service facilities layout network in pastoral areas based on psychological cognition range information-a case study of Inner Mongolia pastoral areas of East Wuzhumuqin Banner in Xilingol. Eur. J. Remote Sens. 2020, 53, 114–125. [Google Scholar] [CrossRef]
  59. Brogaard, S.; Li, X. Agricultural performance on marginal land in Eastern Inner Mongolia, China–Development in the pre-and post-1978 reform periods. GeoJournal 2005, 64, 163–175. [Google Scholar] [CrossRef]
  60. Williams, D.M. Subjective Landscapes and Resource Management on the Chinese Grasslands of Inner Mongolia; Columbia University Press: New York, NY, USA, 1996; pp. 111–124. [Google Scholar]
  61. Ma, M.; Kong, J. Study on the Ecological Experience of Inner Mongolia Grassland Traditional Herdsmen Settlement Construction. Adv. Mater. Res. 2011, 243, 6543–6547. [Google Scholar] [CrossRef]
  62. Zhang, M.A.; Borjigin, E.; Zhang, H. Mongolian nomadic culture and ecological culture: On the ecological reconstruction in the agro-pastoral mosaic zone in Northern China. Ecol. Econ. 2007, 62, 19–26. [Google Scholar] [CrossRef]
  63. Kolås, Å. Degradation discourse and green governmentality in the Xilinguole grasslands of Inner Mongolia. Dev. Chang. 2014, 45, 308–328. [Google Scholar] [CrossRef]
  64. Zhou, H.; Wang, C.; Bai, Y.; Ning, X.; Zang, S. Spatial and temporal distribution of rural settlements and influencing mechanisms in Inner Mongolia, China. PLoS ONE 2022, 17, e0277558. [Google Scholar] [CrossRef]
  65. Newman, D.; Applebaum, L. Defining the rurban settlement: Planning models and functional realities in Israel. Urban Geogr. 1989, 10, 281–295. [Google Scholar] [CrossRef]
  66. Abbott, J. A method-based planning framework for informal settlement upgrading. Habitat Int. 2002, 26, 317–333. [Google Scholar] [CrossRef]
  67. Liu, J.G.; Dietz, T.; Carpenter, S.R.; Folke, C.; Alberti, M.; Redman, C.L.; Schneider, S.H.; Ostrom, E.; Pell, A.N.; Lubchenco, J.; et al. Coupled human and natural systems. Ambio 2007, 38, 639–649. [Google Scholar] [CrossRef]
  68. Steiner, F. Landscape ecological urbanism: Origins and trajectories. Landsc. Urban Plan 2011, 100, 333–337. [Google Scholar] [CrossRef]
  69. Termorshuizen, J.W.; Opdam, P. Landscape services as a bridge between landscape ecology and sustainable development. Landsc. Ecol 2009, 24, 1037–1052. [Google Scholar] [CrossRef]
Figure 1. Schematic diagram of the study area.
Sustainability 15 15077 g001
Figure 2. Settlement morphology.
Sustainability 15 15077 g002
Figure 3. Extracting Grasshopper battery at the settlement boundary.
Sustainability 15 15077 g003
Figure 4. Rotated spatial component chart.
Sustainability 15 15077 g004
Figure 5. Hierarchical diagram.
Sustainability 15 15077 g005
Table 1. Indicator system description.
IndicatorDefinitionFormula
PAPlan area of the settlement-
SShape index of the planar boundary pattern of the settlement S = P 1.5 λ λ + 1.5 λ A π
λ Length-to-width ratio λ = L a / W a
MSettlement building density M = A a / A b
DFractal dimension value of public space D = 2 l g ( P 4 ) l g ( A )
Table 2. Indicator data statistic description.
IndicatorMinimumMaximumAverageStandard Deviation
Area of the settlement (km2)0.081.070.420.33
Shape index of the planar boundary pattern of the settlement1.101.431.270.09
Length-to-width ratio1.064.762.341.17
Settlement building density0.100.260.160.05
Fractal dimension value of public space1.231.351.280.04
Table 3. Matrix of eigenvalues and variance contribution rates of the factor analysis.
Total Variance Explanation
ComponentInitial EigenvalueExtraction Load Sum of SquaresSum of Squares of Rotational Loads
AggregateVariance (%)Accuracy (%)AggregateVariance (%)Accuracy (%)AggregateVariance (%)Accuracy (%)
13.5871.6471.643.5871.6471.642.3647.2847.28
21.0420.8292.461.0420.8292.462.2645.1892.46
30.224.4996.96
40.101.9898.94
50.051.06100
Table 4. Principal factor load matrix.
IndicatorBefore RotationAfter Rotation
Factor 1Factor 2Factor 1Factor 2
Shape index of the planar boundary pattern of the settlement0.970.04−0.670.70
Settlement building density0.890.36−0.390.88
Length-to-width ratio−0.820.530.96−0.19
Area of the settlement (km2)−0.820.470.92−0.23
Fractal dimension value of public space0.720.64−0.080.96
Table 5. Factor cluster analysis.
Cluster Analysis of the First Principal Component FactorIndicator(8, 9, 10, 11, 12, 15, 16, 17, 19, 20, 21, 24, 25)(13, 14, 18, 22, 23, 26, 27, 28)(1, 2, 3, 4, 5, 6, 7)
IntervalAve.SDIntervalAve.SDIntervalAve.SD
Plan area of the settlement0.26–0.370.310.030.08–0.210.140.050.28–0.370.960.08
Length-to-width ratio1.17–2.621.990.611.06–2.671.420.521.17–2.704.030.46
Cluster Analysis of the Second Principal Component FactorIndicator(8, 9, 10, 11, 12, 13, 14)(15, 16, 17, 18, 19, 20, 21, 22, 23, 24, 25, 26, 27, 28)(1, 2, 3, 4, 5, 6, 7)
Shape index of the planar boundary pattern of the settlement1.35–1.431.380.031.23–1.321.270.021.10–1.191.150.02
Settlement building density0.20–0.260.230.020.10–0.190.150.020.10-0.130.110.01
Fractal dimension value of public space1.30–1.351.290.291.23–1.341.270.261.23–1.271.240.01
Cluster Analysis of five Indicator FactorsIndicator(8, 9, 10, 11, 12, 13, 14, 15, 16, 17, 18, 19, 20, 21)(22, 23, 24, 25, 26, 27, 28)(1, 2, 3, 4, 5, 6, 7)
Plan area of the settlement0.15–0.370.290.060.08–0.300.160.090.84–1.070.960.08
Length-to-width ratio1.06–2.762.030.641.16–1.351.260.073.36–4.764.030.46
Shape index of the planar boundary pattern of the settlement1.23–1.431.320.061.23–1.321.260.031.10–1.191.150.02
Settlement building density0.17–0.260.200.030.10–0.150.130.010.10–0.130.110.01
Fractal dimension value of public space1.29–1.351.320.021.23–1.251.240.011.23–1.271.240.01
Table 6. The composition of multidirectional expanding settlement and centripetal development of settlement.
Star-Shaped Settlements
(Ave. Index)
Clustered Settlements
(Ave. Index)
High-Density Spatial Settlements
(Ave. Index)
Uniformly Distributed Settlements
(Ave. Index)
Star-Shaped + Highly Dense SpaceCircular-Shaped + Highly Dense SpaceStar-Shaped + Uniform Distribution of SpaceCircular-Shaped + Uniform Distribution of Space
Multidirectional expanding settlements113775261
Centripetal development of settlements25070025
Table 7. Spatial morphological types and characteristics of settlements in the farming–pastoral zones in eastern Inner Mongolia.
TypesSite Selection CharacteristicsSettlement MorphologySpatial Layout PatternRepresentative Settlements
Multidirectional Expanding SettlementThe shape index, building density, and fractal dimension values of public space are all at their maximum values.The settlement has gradual and indistinct boundaries, with dispersed buildings and lacking a clear order.Sustainability 15 15077 i0018, 9, 10, 11, 12, 13, 14, 15, 16, 17, 18, 19, 20, 21
Settlement Patterns Extending at Both EndsThe shape index, building density, and fractal dimension values of the public space are all the lowest.The settlements have relatively gentle boundaries, a low building density, a high level of organization, an loose arrangement of along the main roads, and a strong sense of order.Sustainability 15 15077 i0021, 2, 3, 4, 5, 6, 7
Centripetal Development of SettlementsFractal dimension value of the public space is the smallest, while the shape index and building density have intermediate values.The settlements have winding boundaries, fragmented internal space, clusters of buildings with varied orientations.Sustainability 15 15077 i00322, 23, 24, 25, 26, 27, 28
Disclaimer/Publisher’s Note: The statements, opinions and data contained in all publications are solely those of the individual author(s) and contributor(s) and not of MDPI and/or the editor(s). MDPI and/or the editor(s) disclaim responsibility for any injury to people or property resulting from any ideas, methods, instructions or products referred to in the content.

