Article

Technical-Economic Analysis of Energy Efficiency Solutions for the Industrial Steam System of a Natural Gas Processing Plant

1
Renewable Energy Research Department, Niroo Research Institute (NRI), Tehran 14686-13113, Iran
2
Department of Mechanical Engineering, Energy Systems Division, K. N. Toosi University of Technology, No. 19, Pardis Street, Molla Sadra Ave., Vanak Sq., Tehran P.O. Box 19395-1999, Iran
3
Niroo Research Institute (NRI), Tehran 14686-13113, Iran
4
South Pars Gas Complex (SPGC), Phases 1, Assaluyeh P.O. Box 75391-311, Iran
*
Author to whom correspondence should be addressed.
Sustainability 2023, 15(20), 14995; https://doi.org/10.3390/su152014995
Submission received: 21 August 2023 / Revised: 25 September 2023 / Accepted: 9 October 2023 / Published: 18 October 2023
(This article belongs to the Special Issue New Technologies for Waste Heat Recovery)

Abstract

:
Steam, which is primarily employed as a heat transfer medium in process plants, is one of the most widely utilized energy carriers in the industrial sector. One of the factors that affects the cost of steam is how well the condensate collection, steam supply, and return systems of industrial steam systems perform. In a case study, the steam systems of a natural gas processing plant were simulated. The amount of demineralized water loss and, consequently, the identification of various solutions to improve the system were analyzed. The whole steam system was simulated using the MEASUR software platform (v 1.2), and by placing the operational information of the steam system, it was possible to create a baseline for the system, model saving solutions, and finally, provide a technical and economic evaluation of the solutions. Due to the high loss of steam condensate in the SRU steam system (more than 3000 kg per hour), solutions to improve the energy efficiency of the SRU steam system in the form of a maximum recovery of steam condensate (replacement of defective steam traps, redesign of the low-pressure condensate collection network, and high-pressure waste condensate collection) were evaluated with two price assumptions of current energy prices and real prices (the energy saving value of one cubic meter of natural gas is equal to 13 cents). The results show that, for current prices, the investment return period will be between 11.8 and 3.8 months. Moreover, in the main steam system of the refinery (unit 9200), there are three solutions: replacing and repairing defective steam traps, installing an expansion turbine instead of a steam pressure relief valve (PRV), and other solutions (including increasing boiler efficiency, automatic control of the boiler, and energy recovery boiler blowdown) under two price assumptions, the current and real prices of natural gas and demineralized water, were evaluated, and the modeling results show that the investment return period for each of the above solutions at the current prices is 10.2, 186, and 13.3, respectively. The investment return period is based on assuming real fuel and BFW prices are equal to 2.0, 37.6, and 1.7, respectively.

1. Introduction

High-pressure steam is used in various applications in many industrial industries. Steam is generated in the boilers and sent to the processing facilities through steam pipes [1]. Losses may occur throughout their passage through these pipes as a result of temperature loss, pipeline insulation problems [2], and pressure loss [3]. They are referred to as steam network losses. Because of the decreased energy efficiency of the steam system, the steam’s quality at the receiving end decreases. Automatic valves called steam traps are used to capture steam and drain condensate from steam lines [4,5]. Most plants’ managers are unaware that appropriate steam trap testing and maintenance may lower their fuel costs. According to the findings of the numerous programs used to analyze the operation of steam traps, the distribution network’s steam traps cause around 20% of the steam exiting a boiler to be lost [6]. Vigorous steam traps would reduce steam losses considerably [7]. Infrared thermography [8] and wireless smart sensors [9] are two methods for monitoring steam traps.
Pumps, fans, and compressors are the main system equipment that make up industrial energy systems. Raw materials are heated, and semi-finished goods are treated using industrial steam [10]. In addition, it serves as a power source for machinery for the generation of heat and electricity. Fossil fuels are frequently used in large quantities for the production of steam in industrial sectors that rely on them as an energy source [11]. For example, generally in the oil refining industry, 23% of energy is used for steam generation [12]. Because of this dependence on steam, increasing the energy efficiency of steam systems may significantly lower industrial energy usage and costs [4]. According to the US DOE, industrial steam systems may save between 10% and 15% on energy and related costs [13]. Condensate loss and steam lines are the two main causes of energy losses [14]. According to assessments, cost parameters, such as the payback period and the measure of installation cost as a percentage of the facility baseline energy cost, are what motivate the adoption of industrial steam system energy efficiency solutions [15].
A third of the energy used at industrial sites in the US is used by steam systems. The Energy Savings Assessment Program [16,17,18], run by the US Department of Energy, has been conducting steam system energy evaluations on a variety of industrial types over the course of five years in an effort to minimize energy usage. Therkelsen and McKane [19] studied different energy efficiency solutions for the implementation of industrial steam systems. Different solutions, such as substituting electric motors with back-pressure steam turbines, fixing or replacing steam traps, fixing leaks in lines and valves, lessening excessive boiler blowdown, raising the quantity of condensate returned, and utilizing steam pressure reduction to produce electricity, were analyzed and compared. Payback periods were as low as 6.7 months for solutions such as fixing leaks in lines and valves.
The steam system of South Pars Gas Processing Phase I consists of two steam systems. The main steam system is Unit 9200, and the secondary steam system is related to the SRU units (6100 and 6200). These two units are connected in four ways: Boiler Feed Water (BFW), return condensate (outlet), sending high-pressure steam (40 bar HP), and balance with medium-pressure steam (5 to 6.5 bar). Comparatively, the main steam unit has a share of 93% in the steam production of the natural gas processing plant. The importance of the steam system of the SRU unit is due to the vital role of steam in the recovery, extraction, and flow of sulfur, which require different temperatures in the chain. In this paper, the main and secondary steam systems of the natural gas processing plant will be simulated with the help of MEASUR software. In addition to identifying the critical condensate flow bottlenecks, steam and condensate collection system design and operation plans, and energy-saving potential, it will help estimate the amount of demineralized water loss and, accordingly, identify different solutions to improve the system.

2. Overview of MEASUR Software

The name of the software is an abbreviation of the Manufacturing Energy Assessment Software for Utility Reduction (MEASUR) [20]. This integrated software tool developed by the US Department of Energy (DOE) helps industries achieve energy savings in production processes. MEASUR provides capabilities for energy analysis in all subsystems of the industry, including pumps, fans, process heat, steam systems, compressed air systems, electric motors, and other components. Previously, there was separate software (including SSAT) for the analysis of each of the systems; however, since 2018, all these component software have been integrated into a comprehensive package called MEASUR, and it can be said that it is the most advanced energy analysis tool in the industry [20]. The working environment of the system is user-friendly and has powerful graphics. It has also provided a lot of calculation tools to help energy engineers and even system designers estimate the heads of pumps, measure the curve of pump systems, etc. It should be noted that DOE has developed the MEASUR software to help improve the efficiency of energy systems, which has resulted in a powerful, user-friendly tool with realistic simulation and calculation capabilities.
MEASUR, while a valuable tool for steam system simulation, does have its limitations. Firstly, it lacks intricate combustion efficiency modeling, which may limit its ability to provide detailed insights in this area. Additionally, MEASUR is unable to estimate probable investment costs for potential projects. Furthermore, its capabilities are confined to static analysis, meaning it may not capture dynamic system behaviors. Lastly, it does not encompass comprehensive economic and economic sensitivity analyses, potentially overlooking nuanced financial considerations. Acknowledging these limitations is essential for a well-informed and balanced utilization of MEASUR in steam system assessments. Since the MEASUR tool is not able to calculate most of the economic indicators of the project, the RETScreen tool was used to evaluate the water and energy costs for a more accurate evaluation.

Modeling and Analysis Method

To simulate the energy of the natural gas processing plant’s steam system using MEASUR software, the following steps will be followed:
Step 1: Identify the characteristics of the main steam systems (Unit 9200) and SRU units (6100 and 6200) using the available information, including design drawings and energy audit reports.
Step 2: Processing and classifying the quantitative data as inputs to the model.
Step 3: Configuring the model structure and making adjustments.
Step 4: Feed real data about the steam system into the model and plan the baseline scenario.
Step 5: Plan different solutions to improve and save energy in the steam systems.
Step 6: Modeling and assessing the proposed solutions.
Step 7: Analysis of the results.
In the following, each of the above steps will be analyzed briefly. As mentioned earlier, each steam system will be modeled separately. Based on this, first the SRU steam system units (6100 and 6200) and then the main steam system of the natural gas processing plant (Unit 9200) will be modeled and simulated.

3. Energy Simulation of SRU Unit (6100 and 6200)

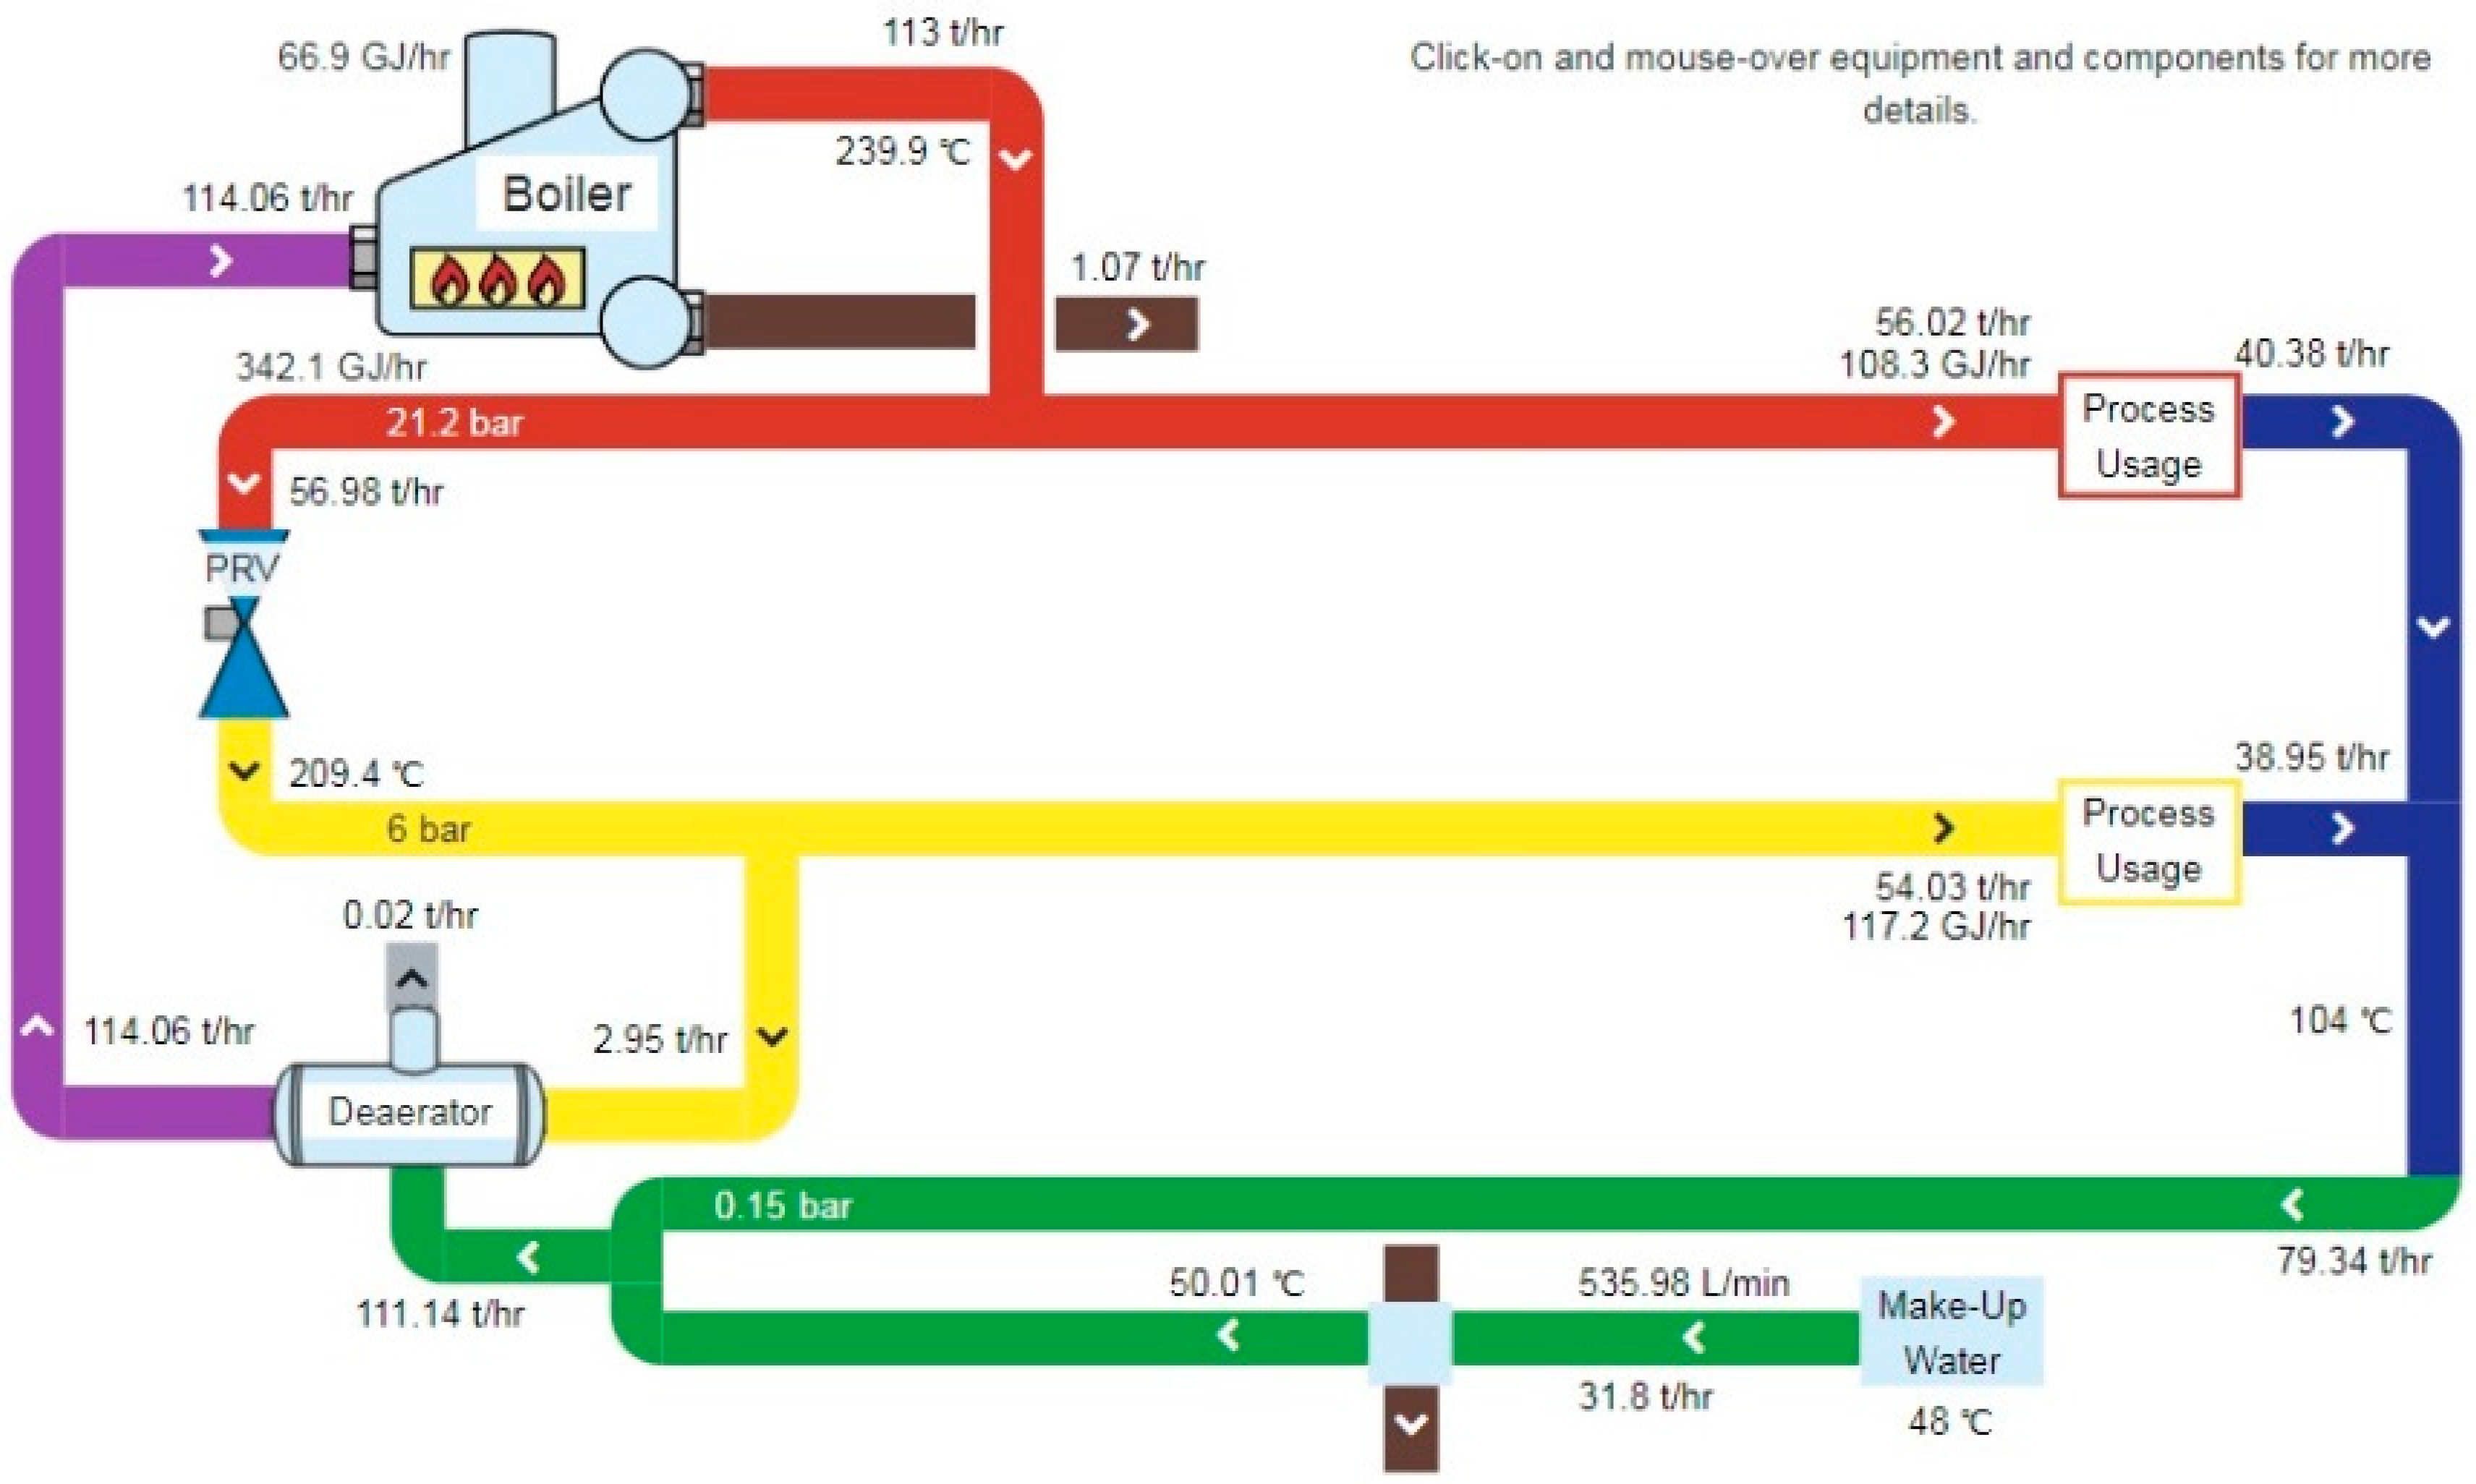
Energy modeling of the steam system in MEASUR requires various simplifications that do not affect the structure or results. The structure of the SRU steam system model is shown in Figure 1, which includes the main steam headers, boilers, steam consumers, and steam condensate return lines, along with other features such as blowdown and deaerator.

3.1. Description of the SRU Unit

This unit is made up of two terrains, 6100 and 6200, and it is one of the destinations for BFW consumption. The monthly, daily, and hourly trend of BFW consumption is shown in Figure 2. The monthly consumption of BFW in this unit is equal to 161,262 tons. Moreover, the average daily and hourly consumption rates are 440.6 tons and 18.4 tons, respectively. The share of terrain 6100 is equal to 56%, and the second terrain is equal to 44% of the total consumption of the feed water entering the SRU unit. The highest consumption of feed water occurred in June, and there is a smooth curve in the rest of the months. More details of the consumption trends in different periods are shown in Figure 2.
Table 1 presents the BFW consumption in this unit under the design and operational conditions (within a certain period), revealing that the operational consumption is about 15% less than the design consumption.
A large amount of BFW is used to produce high-pressure steam (HP-40 bar). In the design mode, 23.1 tons per hour of BFW enter the SRU steam system. The flow first enters the fourth-stage condenser (1-E-61004, 1-E-62004) to increase its temperature, then 19.3 tons per hour enter the Reaction Furnace Boiler. From the rest, 60 kg per hour is injected into the low-pressure steam production (3.5 bar), and 1955 kg per hour is entered into the first stage condenser (1-E-61001, 1-E-62001), whose product is 5-bar steam (in practice between 5 and 6 bar). In addition, 556 kg/h enters the second stage condenser (1-E-61002, 1-E-62002), and 1216 kg/h enters the third stage condenser (1-E-61003, 1-E-62003). Finally, the outlet of all these condensers (except for the fourth stage condenser) is 6 bar steam, which enters the header of the 5 bar section at a temperature of 176 °C in the SRU unit. The BFW entering the reaction boiler is converted into 19,116 kg/h of steam at 40 bar with a temperature of 254 °C, and the rest of the flow is discharged as blowdown (192 kg/h). The high-pressure steam produced in this unit is measured by two steam flowmeters (FI-6100-30 and FI-6200-30), which represent the steam production in the first and second terrains. The average hourly production of steam for the year 2019 in each of terrains 1 and 2 was equal to 4.860 ton/h and 2.729 ton/h, respectively, and the total was 7.589 ton/h (or 7589 kg/h), which is less than half of the design capacity. According to the design, 13.406 tons/h of the total high-pressure steam produced by SRU should be sent to other units of the natural gas processing plant, but in practice, this amount is very small, and based on the measurements made on the 7th of January 2021 for each of the terrains 1 and 2, they were equal to 50 kg/h and 250 kg/h, respectively. The rest of the steam is consumed by four heat exchangers whose specifications are listed in Table 2.
The measurement data shows that the share of SRU units in the total steam production of the natural gas processing plant (regardless of its temperature and pressure) is equal to 6.5%. Table 3 shows the distribution of steam production in the natural gas processing plant. Therefore, from the total water (BFW) incoming to the SRU unit, which is equal to 18.4 tons/h, about 7.6 tons/h of HP steam is produced, and 1216 kg/h enters the third condenser, 556 kg/h enters the second condenser, and 1955 kg/h enters the first stage condenser. Moreover, some of it is used for blowdown (1.2% of the total, equal to 221 kg/h), and the rest is probably wasted in various ways, and another amount leaves the unit in the form of condensate (only 6-bar steam condensate).
Based on the calculations of the MEASUR model, the amount of wasted condensate in the unit is 6.49 tons/h, and according to the calculations made in the energy audit report of the natural gas processing plant, it is equal to 6.0 tons/h. Therefore, one of the main bottlenecks is BFW and energy waste in the natural gas processing plant, and the economic value of its solution will be evaluated using MEASUR software.
(I)
Current situation of damaged steam traps in Unit 9200
The total number of steam traps in Unit 9200 is 1224, of which, according to Table 4, 1124 were disc-type thermodynamic steam traps, 4 were thermostatic, 22 were floating, and the rest were inverted buckets.
The most common failures of steam traps are related to the leakage of the traps, and the failure of low temperatures is in second place. It is possible to repair some of these failures, especially the low-temperature type, and of course, most of the damaged steam traps must be replaced. Of all the steam traps in Unit 9200, 21% are healthy, and 41% have leaks that need to be repaired or replaced. Investigations show that the amount of waste on steam caused by the failure of steam traps is about 2500 kg per hour. Therefore, in this solution, it is suggested that at least 60% of the steam traps of Unit 9200 be replaced, which can lead to the elimination of the waste of at least 2000 kg per hour of valuable vapors in the natural gas processing plant.
(II)
Current situation of damaged steam traps in the SRU unit
The total number of steam traps in the SRU unit is 358, of which 16 belong to the 6000 unit, 177 are in the 6100 unit, and 165 are in the 6200 unit. Out of all the steam traps in the SRU unit, 43.6% are healthy and in good condition. More than 10% of steam traps are blocked. Approximately 28.7% of steam traps have experienced a temperature drop and are probably on the verge of failure, and the solution is to repair or replace these traps. Cleaning steam traps can restore some of these traps to normal operation. A total of 13.3% of steam traps are on the verge of failure and may be completely open, and 2.3% of steam traps have leaks. Therefore, 57% of SRU steam traps will need repair or replacement.

3.2. Main Inputs

The model inputs include general data, operational data, boiler data, and data related to headers and others, as presented in Table 5, Table 6 and Table 7, respectively.
As Table 5 suggests, the price of fuel (natural gas equivalent) in two cases is 0.13 cents per cubic meter of natural gas equivalent (approved by the Economic Council for the value of fuel savings), and the current price for electricity and water is also presented in two options in Table 5. The results of the evaluation of solutions will be reviewed in both scenarios. The results of the solutions will be evaluated in both scenarios.

3.3. Design of Demineralized Water and Energy-Saving Solutions

In the following, solutions to reduce the loss of low-pressure condensate and energy will be examined. The energy audit and research report show that the main reason for the loss of resources in the SRU unit is the wastage of low-pressure and high-pressure condensates, which have been neglected due to technical problems. Accordingly, the main goal of this research is to find solutions to collect these condensates.

3.3.1. Solutions for Collecting Wasted Condensate in the SRU Unit

The amount of condensate loss in the SRU unit is very high, and in various reports it is estimated between 5 and 6.5 tons/h, becoming the source of waste on energy, demineralized water, and capital resources. Failure of steam traps (about 60% of the existing traps) and the discharge of low-pressure, high-pressure, and medium-pressure condensate to a main header, along with other factors, have caused these losses. In the following, each of the solutions to these problems will be analyzed briefly. Apart from the very high intrinsic value of demineralized water, it should be said that the energy content of condensate is about 25% of the energy content of steam at the same pressure; therefore, the loss of this amount of condensate can cause a severe loss of energy. Therefore, in general, the advantages of steam condensate collection in the SRU unit are:
  • Energy saving and fuel cost reduction: Although the energy produced in the SRU unit is inevitable (as a byproduct), it can be given the same intrinsic value as natural gas by exploiting this energy in other ways.
  • Reducing the need for make-up water in the unit: BFW is purified water that is very expensive to produce, and the chemical additives in it have a high economic value. Therefore, the collection of condensates from the SRU unit reduces the demand for demineralized water and, at the same time, the chemicals needed to adjust the chemical regime of the BFW.
Calculations show that the waste path of the steam system in the ideal state is only from the blowdowns, which is about 1.2% (221 kg/h) of the total water inlet to the boiler (BFW), which is assumed to be 95% by neglecting the post-improvement recycle factor. Table 8 summarizes the technical and economic features of this solution.
Collecting the SRU condensate and returning it to the system cycle requires various measures, such as renovating steam traps, redesigning parts of the condensate collection system, and making changes to it.

3.3.2. Other Energy-Saving Solutions

There are other ways to save energy, including improving the energy efficiency of steam production to about 75%, optimizing consumption, and repairing insulation. In total, these solutions can reduce energy consumption by 2%, which is not very important compared to the other solutions. These solutions were simulated in the model, and then the results were analyzed.

3.4. Analyzing the Results of Evaluating the Solutions

The simulation and energy evaluation scenarios of the SRU steam system include the baseline scenario, the SRU Condensate Recovery scenario, and the scenario of other energy-saving solutions (other ECMs). In the continuation of the process of consumption of energy carriers, the amount of savings and financial metrics will be examined and analyzed in each of these scenarios. Considering that the main focus of this research is the SRU unit, the analysis in this part will be more extensive.
Moreover, the simulation results will be analyzed with the current price of energy carriers and regional prices. Accordingly, the scenario management structure will be the same as in Figure 3. The results will be analyzed first under the baseline scenario, and then other scenarios will be discussed according to Figure 3. The results show that the peak electricity consumption of the unit is 3047 kW and considering the electricity price of 1 ¢/kWh, its annual cost will be 253,571 USD. Moreover, the total steam production of the system in the baseline scenario will be 18.4 tons per hour, and its annual operating costs will be 2,035,165 USD. The total annual fuel consumption in the steam system is estimated to be 15.73 MCM of natural gas equivalent. The cost of this fuel will be about 157.5 thousand USD per year at a price of 1 ¢/kWh per cubic meter. The total amount of make-up water consumed by the unit during the year will be 54.24 million liters, with a cost (1 ¢/kg) of 542.4 thousand USD per year; therefore, the total operating costs of the system will be 953.4 thousand USD.
The total cost of producing HP steam is 4.69 USD per ton, MP steam is 2.24 USD per ton, and LP steam is 11.45 USD per ton.

3.4.1. Analyzing the Results of Evaluating Solutions in the Option of Current Prices

In the current situation, the prices of electricity, gas, and BFW are 1 ¢/kWh, 1 ¢/m3, and 1 ¢/L, respectively. The results of the model implementation in this scenario show that the return on investment of the condensate recycling solution (as in Table 9) will be 11.8 months, that is, less than one year. The implementation of this solution will save 48.0% on the fuel consumption of the SRU unit (Figure 4). The second solution is not very serious, and its implementation can only lead to a 2.0% saving in the fuel consumption of the SRU unit. In addition, its implementation is not very easy and requires complex work to increase the efficiency of boilers and manage steam consumption in heat exchangers, which can probably cause malfunction of the SRU unit. Therefore, this solution was abandoned.
The implementation of the solution in this case will save 456.2 thousand USD annually, of which the share of energy savings is 4.8 thousand USD and the share of BFW is 497.2 thousand USD per year. Therefore, the most important effect of repairing the SRU steam system will be the reduction of BFW consumption and costs. Moreover, the compensatory consumption of BFW will decrease from 108.6 L/min to 18.2 L/min by implementing the solution, and its annual amount will also decrease from 54,238 ton/year to 9091 ton/year, which represents a saving of 123.7 ton/day or 5.15 ton/h. The total cost of HP, MP (5–7 bar), and LP (3.5 bar) steam production will be reduced to 1.73 USD per ton, respectively, which will be achieved by the maximum condensate recycling. Table 10 presents more details of the implementation results of this solution (energy and material summary).
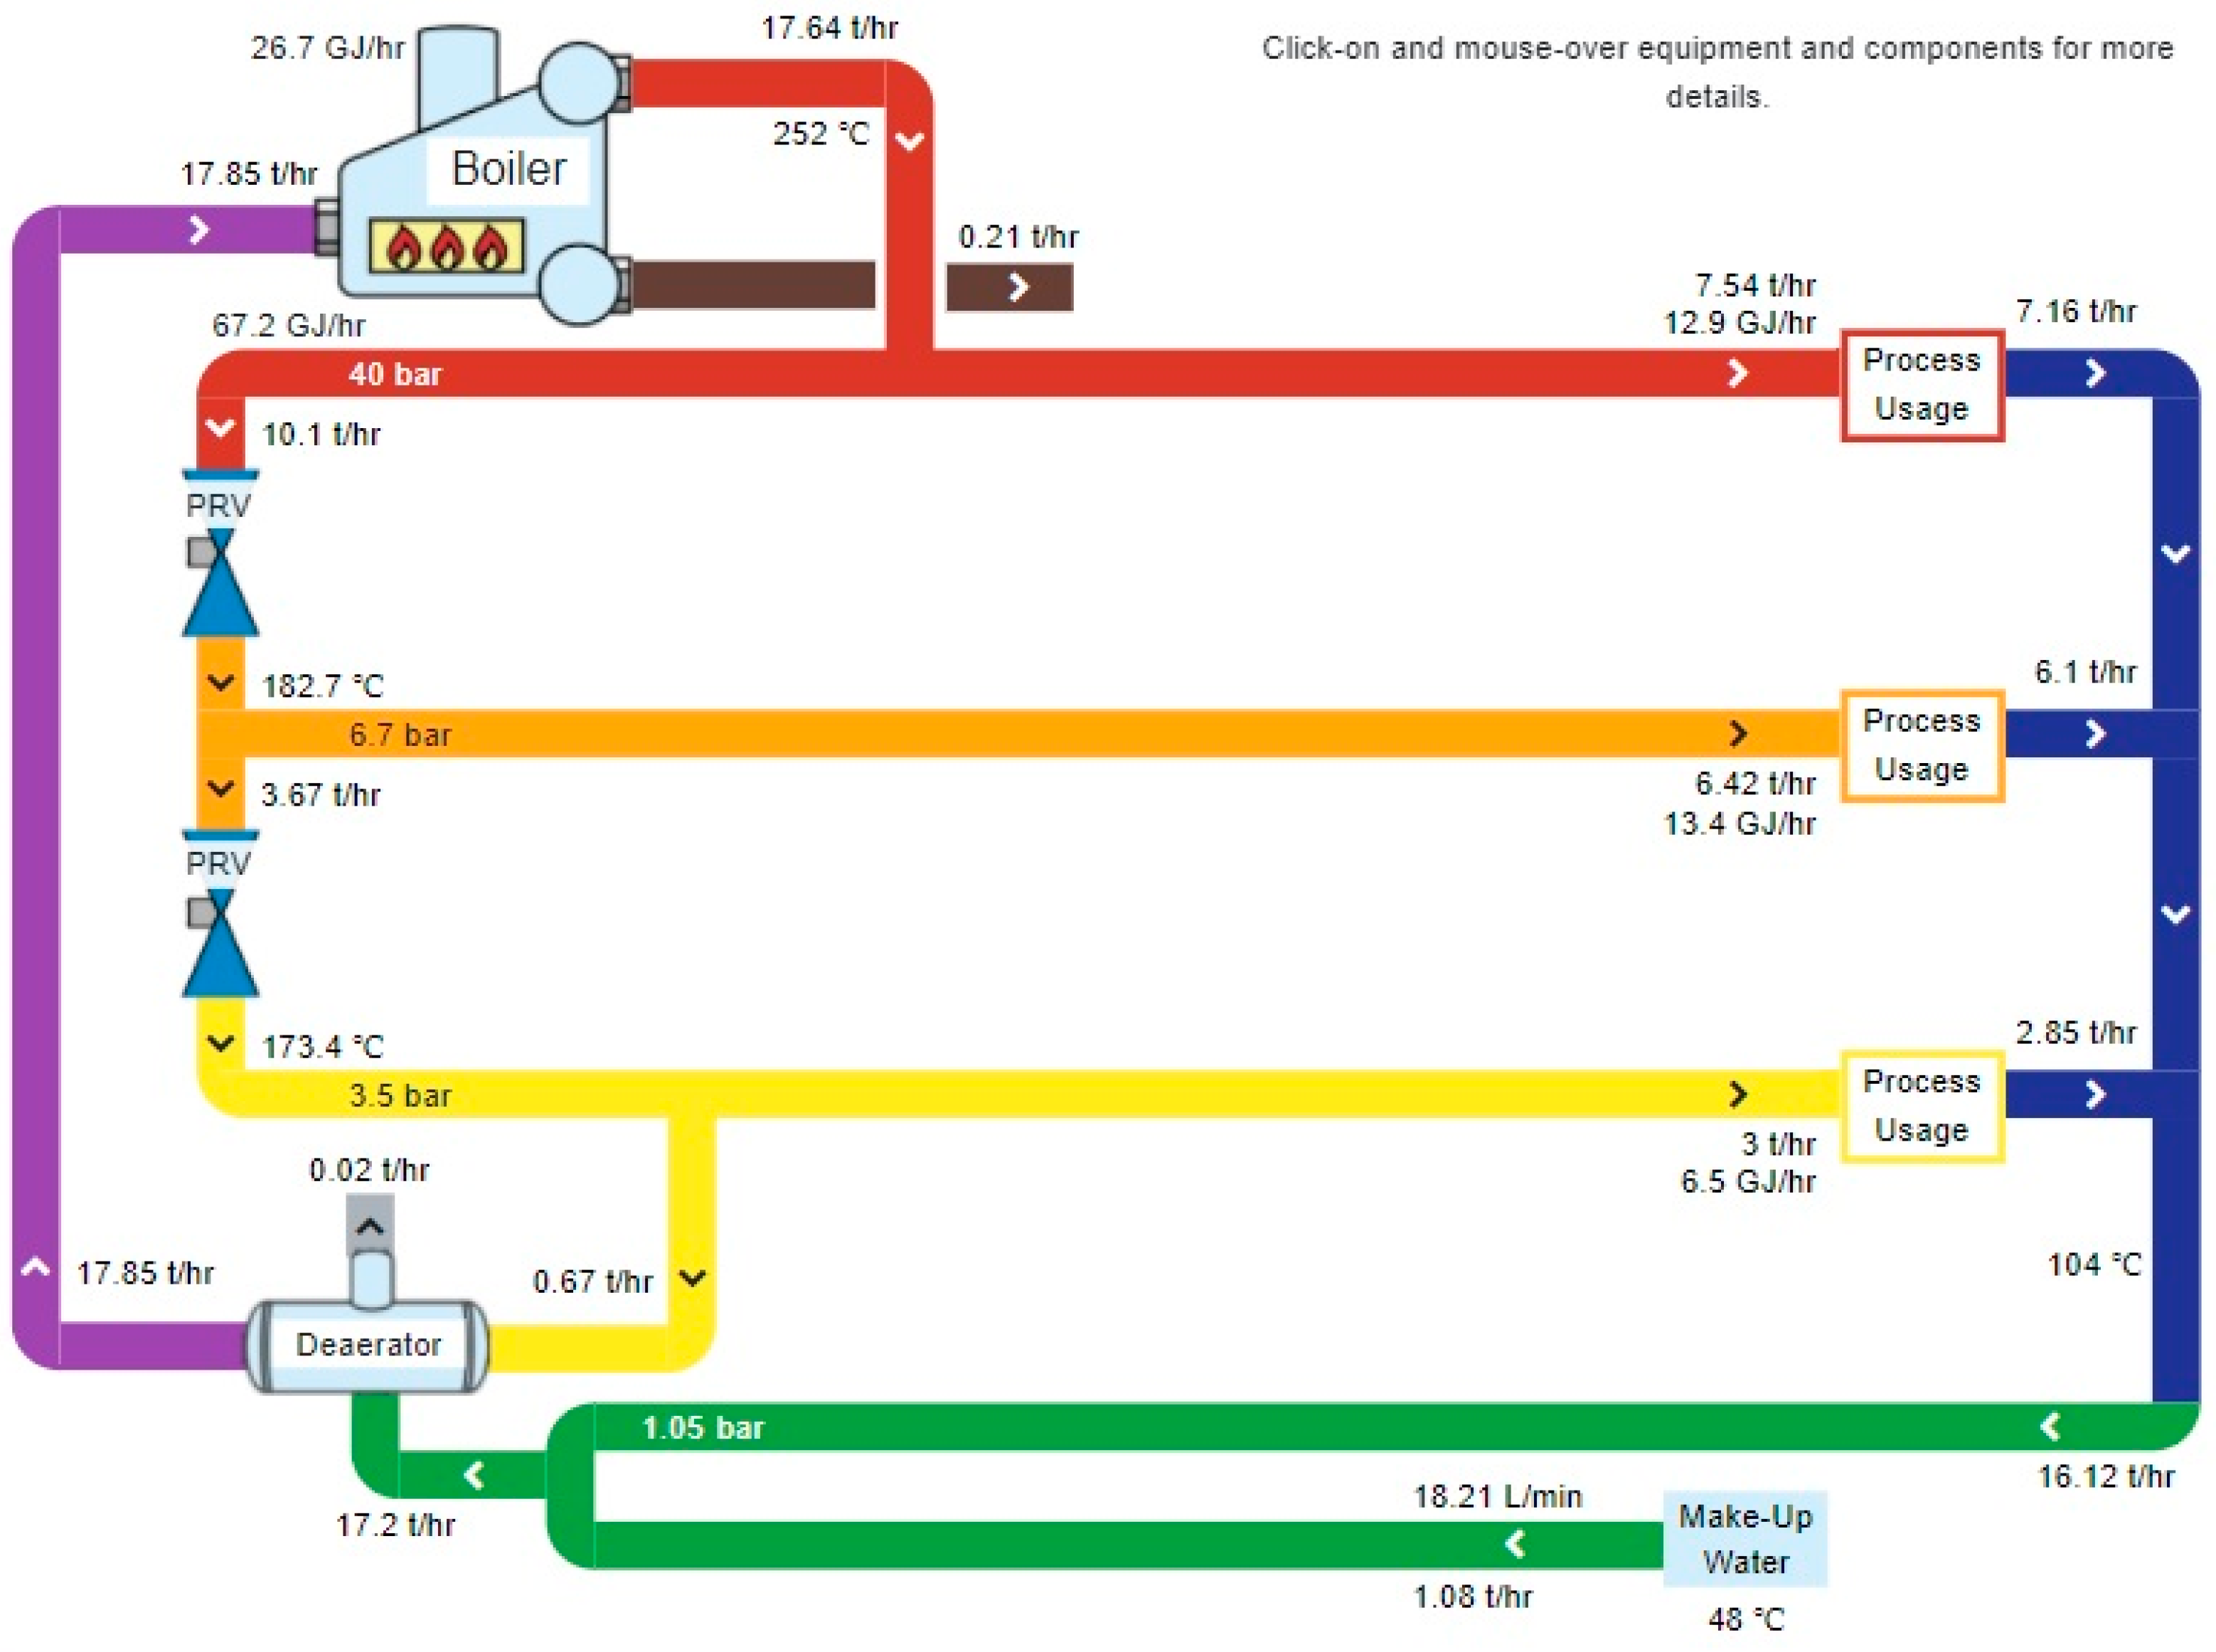
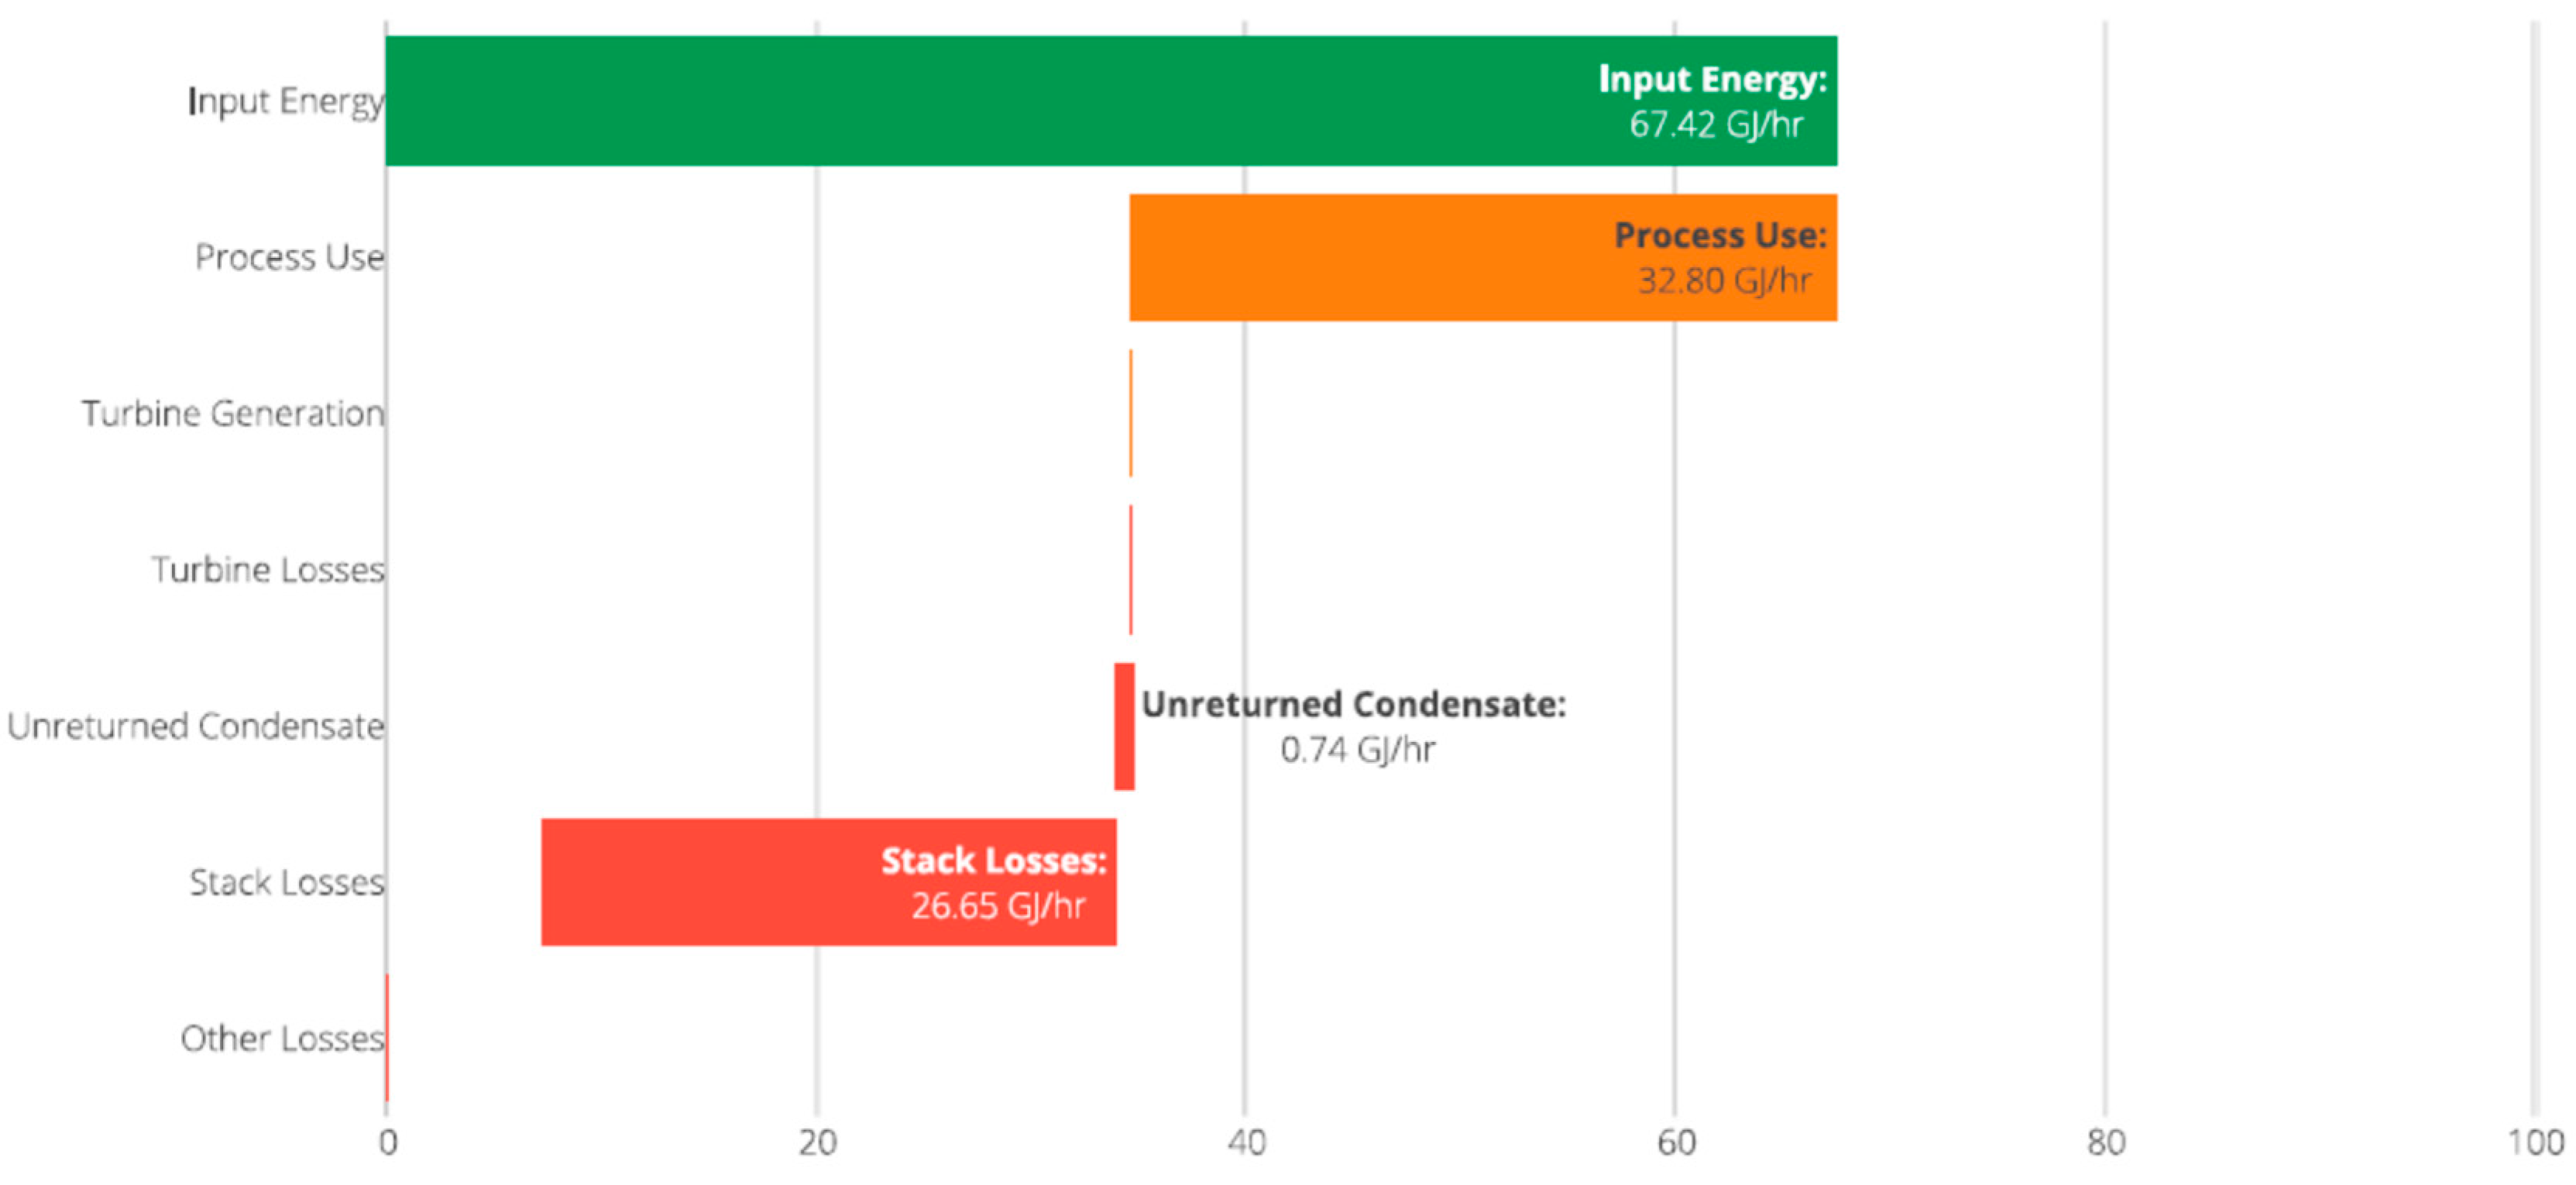
Moreover, 
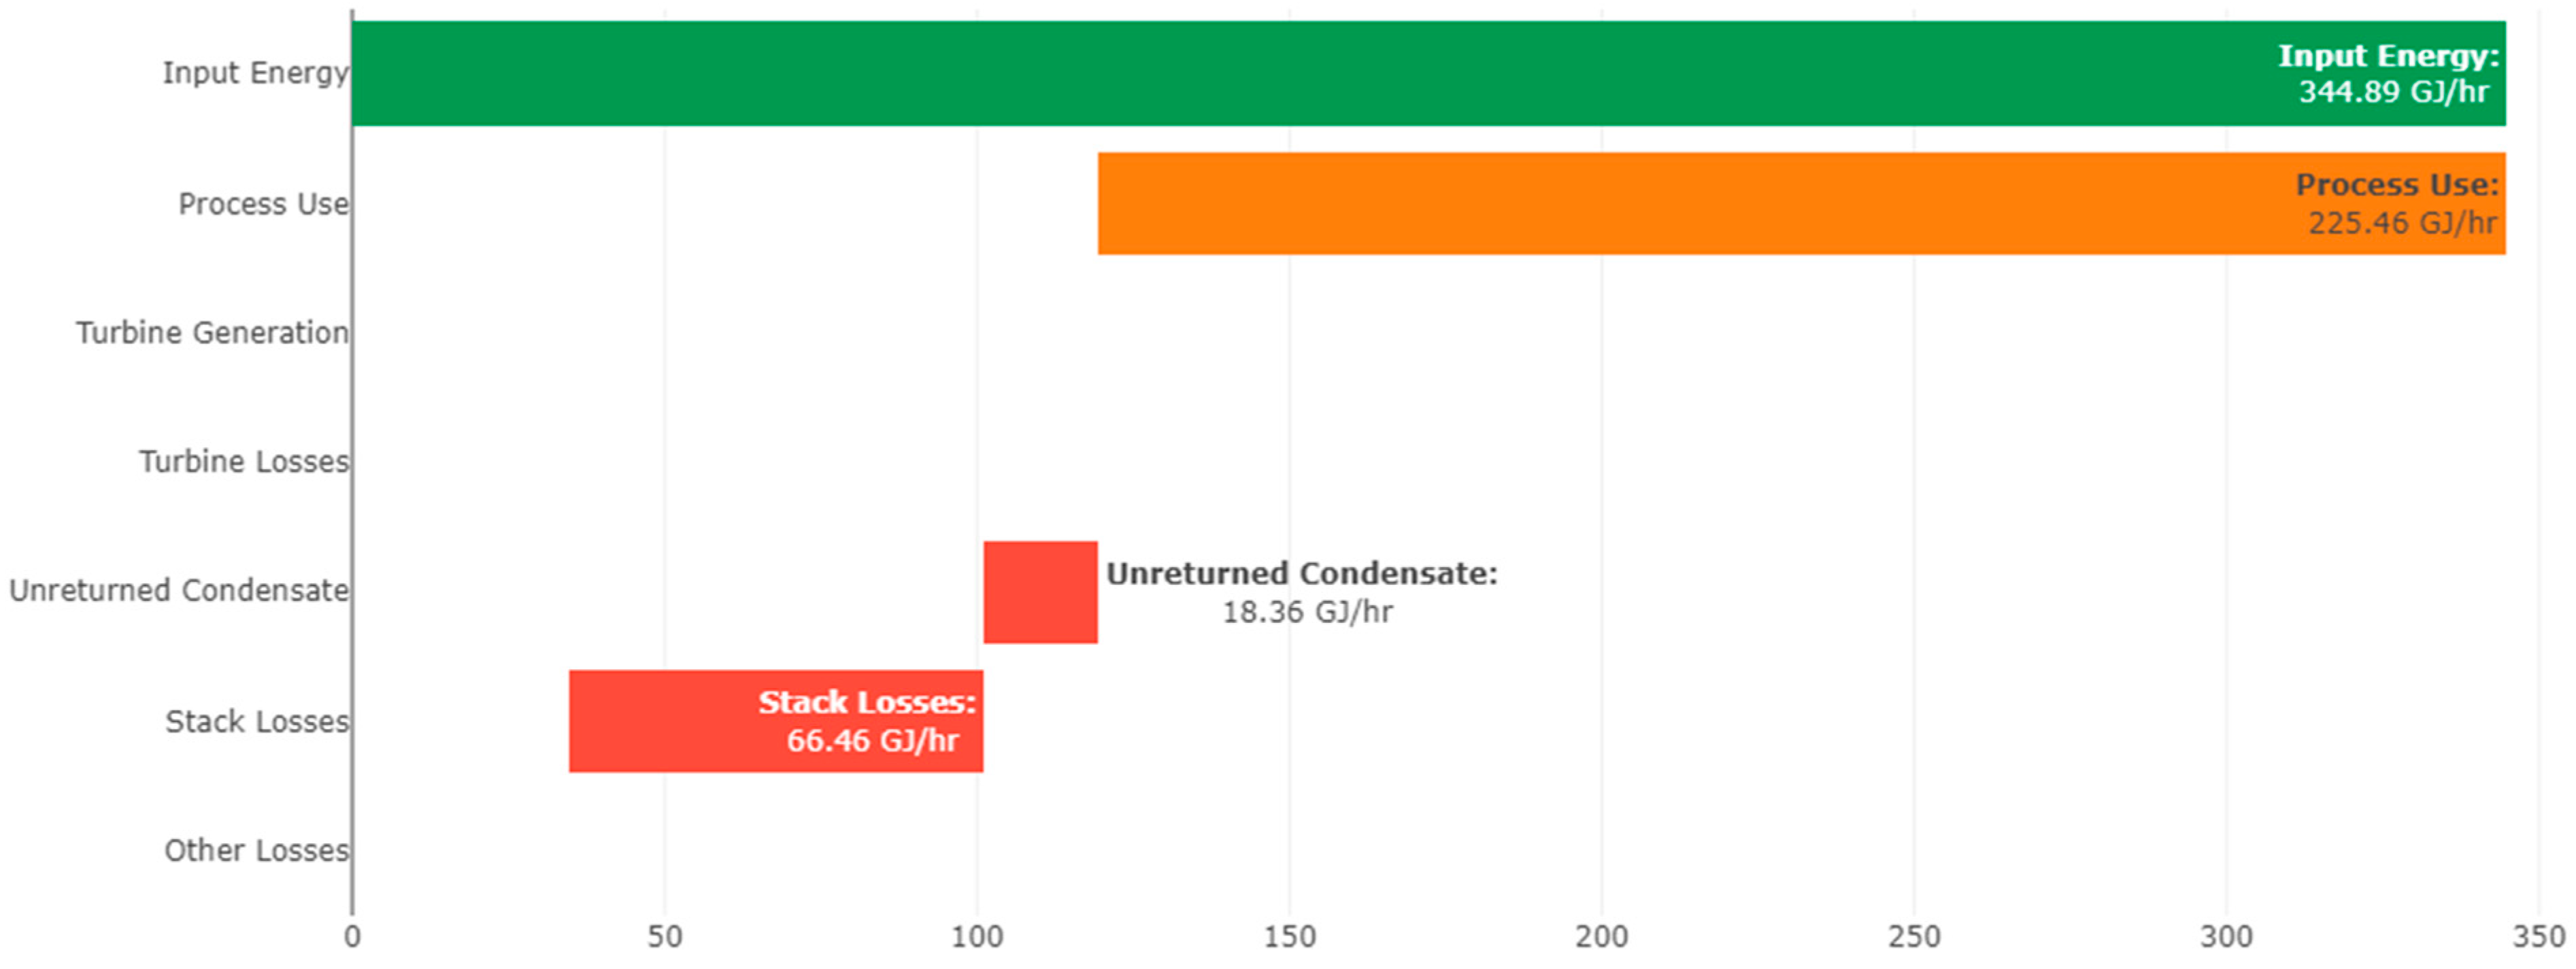
Figure 5 shows the energy flow diagram of the steam system in the SRU unit with the implementation of the solution. It shows energy losses at different places and also has useful uses in the steam system.
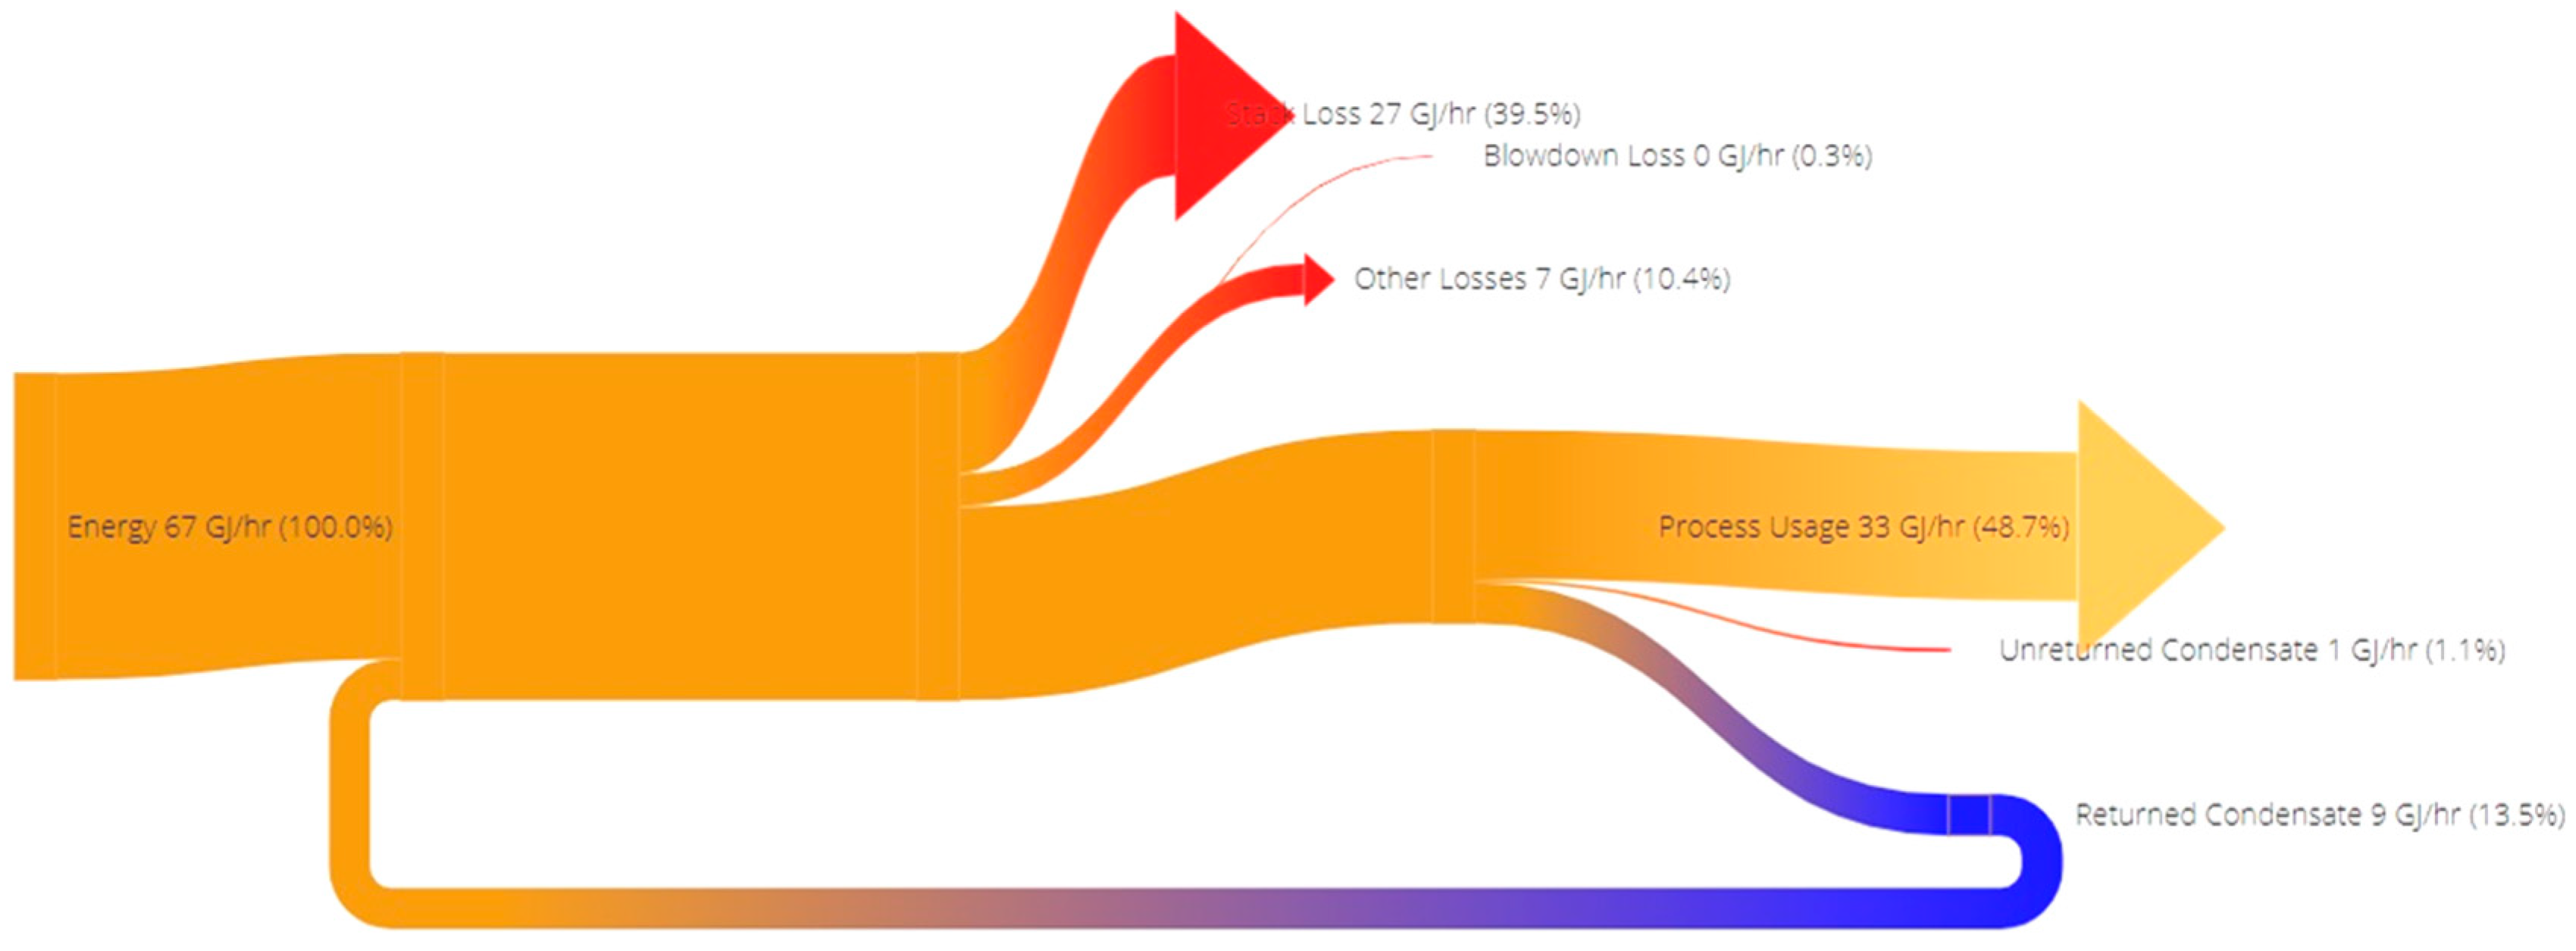
According to the Sankey diagram, after the implementation of the solution, the amount of steam loss, especially through condensate, will significantly be reduced, so that the amount of energy loss from chimneys will be 39.5%, the steam distribution system will be 10.4%, and the waste condensate will be 1.1%.
This is while the amount of energy loss through released condensate before implementing the solution was equal to 7.5%. About 13.3% of the total energy is returned to the system, and 46.5% is usefully consumed by heat exchangers and other consumers. Figure 6 shows the energy balance of the SRU unit after implementing the given solution and the amount of final consumption and energy waste. In this case, the most energy loss will occur from the chimney, part of which can be recycled, and the rest is normal.

3.4.2. Analyzing the Results of the Evaluation of the Solutions in the Option of Real Prices

In this case, the prices of energy carriers and BFW are closer to the real prices. Therefore, the energy flow will be the same as before, and only the system costs and the investment return periods will change. In the following, the evaluation results of this solution are presented. In this case, the total operating cost of the system is expected to be 4.94 million USD annually. The amount of compensatory water has not changed significantly (54,238 tons per year), and the cost of demineralized water supply will increase to 1.630 million USD. With the implementation of the maximum recycling of steam condensate, the investment return period will be reduced to less than 4 months, as it is expected to save more than 1.4 million USD in energy and demineralized water consumption over the year. More details of the evaluation of this solution are provided in Table 11.
Table 12 also shows the evaluation results of this solution. It shows that the total cost of steam production in this case will be different in different scenarios. While the total cost of HP, MP, and LP steam in the baseline scenario is 25.2, 17.58, and 46.17 USD per ton, respectively, it is expected that with the implementation of the solution, the total cost of steam in different lines will decrease to about 15.99 USD per ton.

4. Simulating the Main Steam System of the Natural Gas Processing Plant—Unit 9200

The main steam system of the natural gas processing plant supplies more than 93% of the steam. The details of the system were reviewed in the previous section, and the continuation will refer only to the modeling data. To provide steam for the natural gas processing plant, 3 boiler units of 80 tons with a pressure of 22 bar and a temperature of 244 °C have been designed and installed. Two deaerators, along with the supply water tank (for water supply and water deoxygenation), supply the water needed by the boilers with 3 pumps at a pressure of 32 bar. Before entering the boiler, the water is heated by the preheater and economizer and then enters the steam drum. The hotter and higher the temperature of the incoming water, the higher the efficiency of the boilers. The outlet steam comes out at a temperature of 244 °C and a pressure of 22 bar. Although the 9200 unit has three boilers (A, B, and C), each with a capacity of 80 tons per hour, only one boiler will be considered in the simulation. This challenge is due to the limitations of the software for modeling several boilers together. It should be mentioned that part of the data required for the simulation was obtained from drawings and internal information, part from the energy audit reports of the natural gas processing plant, and the rest was collected from field visits. The structure of the simulated steam system is shown in Figure 7. This structure was configured in the software with simplicity. The steam system consists of three boilers (mainly two boilers are working) and two steam headers (21 bar and 5 bar). More details of the input data are given in Table 13.

4.1. Main Inputs

The model inputs include general data, operational data, boiler data, data related to headers, and others, as presented in Table 13, Table 14 and Table 15, respectively.
As Table 13 suggests, the price of fuel (natural gas equivalent) for electricity and demineralized water is presented in two cases: Approximately 0.13 cents per cubic meter of natural gas (approved by the Economic Council for the value of fuel savings) and the current price. The evaluation results of the solutions will be examined under both scenarios.
The loading rate of the boilers is shown in Figure 8. It shows that all three boilers are in use, although boiler 3 is underutilized.
The efficiency of boilers is very important and indicates the amount of energy wasted in boilers. The measurements show that the operational efficiency of the boilers was between 80% and 82%, which is an acceptable value compared to their design efficiency (86%). The percentage of excess air is suitable (about 12%) in the second boiler (B) and high in the first and third boilers (25% and 28%), which can be adjusted by adjusting the fuel-air ratio.

4.2. Design and Analysis of Energy-Saving Solutions

By examining the current situation, energy audit reports, and other documents, it can be said that the main solutions for saving energy and water in the main steam unit of the natural gas processing plant (Unit 9200) are:
  • Chimney temperature control
  • Preheating the combustion air
  • Reducing incomplete combustion in the burner by controlling the fuel-air ratio
  • Reduction of losses due to sediment and soot formation
  • Reducing the pressure and operating temperature of boilers
  • Boiler load control and automatic control of boiler discharge (blowdown)
  • Pre-heating of feed water by the economizer
  • Using variable speed controllers for fans, blowers, and pumps
  • Periodic boiler repairs
By examining all the solutions to improve the energy efficiency of the natural gas processing plant’s steam system, three main solutions were selected in the following order for evaluation in the MEASUR software and the platform of the natural gas processing plant’s steam system model.
  • Using a small steam turbine to provide low-pressure steam instead of a pressure relief valve
  • Waste steam condensate recycling
  • Other steam system energy-saving solutions
In the following, each of these solutions will be reviewed briefly.

4.2.1. Using a Small Steam Turbine to Provide Low-Pressure Steam Instead of a Pressure Relief Valve

From the total medium-pressure steam (22 bar) of the natural gas processing plant, 75 tons/h of LP steam (5 bar) are produced by pressure relief valves. This is even though, in the operational conditions of the natural gas processing plant during the measurement days, the operating amount was about 50 tons per hour. The production of LP steam from MP steam accounts for about 50% of the steam produced in the 9200 unit. By passing a large volume of MP steam (22 bar) through the pressure relief valves, considerable energy is wasted. Therefore, using a small steam turbine instead of a pressure relief valve can significantly improve the energy efficiency of the steam system. This issue has been considered in the design of the steam systems of the second and third natural gas processing plants. Therefore, the adoption of this solution in the first-phase natural gas processing plant can bring significant savings in the gas consumption of the power plants and even generate income for the first-phase natural gas processing plant. Since the project is among the heat recycling projects, it is possible to sell the produced electricity to Tavanir Company (Tehran, Iran) with a guaranteed purchase price and even bring significant income to the natural gas processing plant. In Table 16, the steam turbine design conditions are given.
Due to the fluctuating steam flow rate, the design conditions will be taken into consideration, and therefore, a small steam turbine with a capacity of 3500 kW will be required. The cost of buying and installing the mentioned steam turbines is estimated at 3.1 million USD.

4.2.2. Increasing the Recycling Rate of Steam Condensate by Replacing/Repairing Steam Traps

A comprehensive investigation showed that about 60% of the steam traps at the natural gas processing plant were completely or partially damaged. Therefore, by replacing these steam traps, both the pressure balance and stability of the steam system will increase, and it will also cause significant savings in energy and water. Estimates show that replacing steam traps can save about 3.1 tons of water and steam per day. The cost of replacing and repairing the damaged steam traps of the main steam system (other than SRU) is estimated at 230,000 USD, including about 520 steam traps (with different capacities and models, mostly disc types).

4.2.3. Other Steam System Energy Improvement Solutions

Other solutions to improve the steam system are different and include increasing the temperature of the make-up water with blowdown boilers from the current 48 °C to 60 °C and increasing the efficiency of the boilers (through adjusting the ratio of fuel to air and reducing excess air in boilers A and C to about 12%) from the current value to 82%.

4.3. Managing the Scenarios and Analyzing the Model Outputs

As mentioned in the analysis of the steam system of the SRU unit, for a comprehensive analysis of the results, it is necessary to examine and evaluate the results in different price scenarios. The structure of scenario management is given in Figure 9. First, the modeling results will be examined in the current price scenario, and then the real price scenarios will be discussed.

4.3.1. Analysis of the Results Based on Current Prices

The simulation results show that at the current prices, the annual cost of operating the steam system (mainly fuel and demineralized water costs) equals 3.56 million USD. Accordingly, the cost of medium-pressure (22 bar) steam production will be 3.77 USD per ton, and the cost of low-pressure will be 3.77 USD per ton. The total fuel consumption of the natural gas processing plant to produce steam during the year will be 84 MCM, and its cost, including the current price of fuel in the country, will be 840 thousand USD. Moreover, the total electricity consumption of the unit is estimated at 9204 MWh.
According to the results of running the model with the designed solutions, the amount of energy saved by using small steam turbines instead of pressure relief valves (PRV), repairing steam traps, increasing the condensate recycling factor, and other solutions is equal to 6%, 8%, and 3%, respectively. Table 17 gives more details about the solution evaluation results.
As Table 17 shows, the investment return periods for each of the solutions are 185.8 months, 10.1 months, and 13.3 months, respectively. Therefore, the highest investment return period belongs to the solution of using a steam turbine instead of a pressure relief valve, and the best solution is to replace and repair steam traps.
The summary of the energy analysis in Table 18 shows that by implementing the solution of replacing and repairing the steam traps, the amount of fuel consumption will decrease by about 6.32 MCM of natural gas during the year, and in the same way, the amount of demineralized water will decrease by 26,974.2 ton/day.
Moreover, by implementing the steam turbine installation solution instead of the pressure relief valve (PRV), it is expected that the import of electricity to the unit will be completely cut off and the unit will be able to export 1318.6 kW of power. Assuming that the unit is active for 8322 h a year, it can send about 11 thousand MWh of additional electricity to other units. Moreover, with the implementation of other solutions, the energy consumption of the steam system, both electricity and fuel, will be reduced by about 3%. Estimates show that the total cost of steam production in each of the solutions of steam turbine installation, replacement and repair of traps, and other solutions will be 3.77, 3.77, and 3.47 USD per ton, respectively. The Sankey diagram of the energy flow of the steam system after the implementation of the small steam turbine installation solution is shown in Figure 10, revealing that 62.1% of the total input energy of the unit is spent on final consumption (process consumption). Moreover, 19.2% goes out of the chimney, 8.7% is wasted in the distribution system, 7.2% is lost through the waste of steam condensate, 2.5% is used in the steam turbine, and about 14.3% of energy is returned to the cycle. Figure 11 shows the energy balance diagram after implementing the steam trap repair/replacement solution.

4.3.2. Analysis of the Results Based on Real Prices

Assuming more realistic prices for natural gas (13 ¢/m3—approved by the Supreme Economic Council for energy-saving projects), electricity (5 ¢/kWh (the export price of electricity to Turkey and other countries is between 6 and 7 ¢/kWh, and the approved price of selling electricity for bitcoin mining is 16,500 IRR/kWh), and BFW (5 cents per liter), it is expected that the total operating cost of the steam system in the baseline scenario will be USD 23.9 million per year, in which case the total cost of steam production in the natural gas processing plant will be around 25.64 USD per ton. More details of the simulation results in the baseline scenario are shown in Figure 7.
As can be seen in Table 19, in the option of real energy and water prices, the investment return period is expected to drop sharply and reach 38 months (3.2 years), 2 months, and 1.7 months, respectively, for replacing the pressure relief valve, replacing/repairing steam traps, and other solutions. The total cost of steam production in each of the above solutions is estimated to be 25.66, 24.14, and 25.64 USD per ton, respectively, and other results do not show any significant difference.

5. Summary of Steam Network Solutions

5.1. Summary of SRU Steam Network Solutions (Unit 6100 and 6200)

The energy optimization in the SRU unit was evaluated using advanced MEASUR software, and the results showed that there is a high potential for saving energy and BFW in this unit.
While analyzing the results in the baseline scenario, the amount of savings in two options of current and real prices was examined, and the results are summarized in Table 20.

5.2. Summary of Steam Network Solutions for Unit 9200

The summary of evaluating the energy-saving solutions in unit 9200 conducted by advanced MEASUR software showed that there is a good potential for energy and BFW savings in the unit. The details of the evaluation results are given below.
Considering the real prices for energy carriers and BFW in Table 21, the implementation of energy-saving solutions in the steam system will be highly economical, and the amount of savings will exceed the investment.
As can be seen in the tables below, although the investment return time at low prices (close to unrealistic current prices) is low, the investment return time index in the next worst scenario is close to two years. By comparing the prices of natural gas and BFW to real prices, the investment return time is in the range of 1 year, which is considered a profitable investment in economic projects. Since the MEASUR tool is not able to calculate most of the economic indicators of the project, the RETScreen tool was used to evaluate the water and energy costs for a more accurate evaluation. The results of the evaluation are shown in the Table 22 and Table 23.

6. Conclusions

The purpose of this article is to analyze the current situation and search for and evaluate techno-economic solutions to improve the energy efficiency of the steam system in a real natural gas processing unit. For this purpose, it started with the collection of real information and data about the steam system of natural gas processing, including steam boilers, steam distribution systems (HPS, MPS, and LPS), steam traps, and a steam condensate collection network. System information and data, including drawings and the production process of various types of vapors, have been collected. Then, the energy loss bottlenecks of the steam system were identified, and energy-saving opportunities were analyzed.
The steam system is one of the most important gas consumers in the gas processing unit, and on the other hand, due to the weak preventive maintenance process, there is a high waste of energy in this system. Various solutions to improve the energy efficiency of the system were proposed. Next, the whole system was simulated using the MEASUR software platform.
Due to the high waste of energy and BFW, especially in the steam condensate collection network, the best solution in the SRU unit is the maximum recovery of steam condensate through the replacement of defective steam traps, the redesign of the low-pressure condensate collection network (from 3.5 bar steam), and the collection of high-pressure condensates. Moreover, the best solution in the main steam unit of the gas processing is to increase the efficiency of the boiler and automatic control of the boiler, repair and replace the steam traps, and finally design and install an expansion turbine instead of the existing PRU valve to let down the high-pressure steam. Solutions such as increasing boiler efficiency and replacing steam traps are relatively low-cost solutions, and these solutions usually bring benefits such as reducing the depreciation of the steam system, increasing stability, and, as a result, reducing production costs.
There are three options for fixing the refinery’s main steam system (unit 9200), including replacing and repairing damaged steam traps, switching out a steam pressure relief valve (PRV) for an expansion turbine, and other options such as improving boiler efficiency, automating boiler control, and energy recovery boiler blowdown. The simulation outcomes reveal that the investment return periods for each of the solutions at the present prices are 10.2, 186, and 13.3 years, respectively.

Author Contributions

Conceptualization, M.S. (Mohsen Salimi), M.A., M.A.M., E.S. and M.S. (Mehrzad Shams); Methodology, M.S. (Mohsen Salimi), M.A., M.A.M., M.H., E.S. and M.S. (Mehrzad Shams); Software, M.S. (Mohsen Salimi) and M.A.M.; Formal analysis, M.A.M., M.H. and M.S. (Mehrzad Shams); Investigation, M.S. (Mohsen Salimi), M.A.M., M.H. and E.S.; Resources, M.H., E.S. and M.S. (Mehrzad Shams); Writing—original draft, M.S. (Mohsen Salimi); Writing—review & editing, M.S. (Mohsen Salimi), M.A. and M.A.M.; Supervision, M.A.; Project administration, M.A. All authors have read and agreed to the published version of the manuscript.

Funding

This research received no external funding.

Conflicts of Interest

The authors declare no conflict of interest.

References

  1. Thollander, P.; Rohdin, P.; Rosenqvist, J.; Karlsson, M.; Wollin, J. Introduction to Industrial Energy Efficiency: Energy Auditing, Energy Management, and Policy Issues; Academic Press: Cambridge, MA, USA, 2020; pp. 1–380. [Google Scholar]
  2. Gasho, E.G.; Kiseleva, A.I. Analysis of energy-saving measures in industrial steam supply systems. IOP Conf. Ser. Mater. Sci. Eng. 2020, 791, 012042. [Google Scholar] [CrossRef]
  3. Slama, V.; Rudas, B.; Simurda, D.; Hala, J.; Luxa, M. Pressure Losses Analysis in Two High-Pressure Steam Turbine Control Valves Situated in One Valve Chamber. Am. Soc. Mech. Eng. 2022, 2, V009T23A007. [Google Scholar]
  4. Thollander, P.; Karlsson, M.; Rohdin, P.; Wollin, J.; Rosenqvist, J. Energy efficiency in steam and pumping systems. In Introduction to Industrial Energy Efficiency; Academic Press: Cambridge, MA, USA, 2020; pp. 159–182. [Google Scholar]
  5. Chikezie, N. Energy conservation: Successful management of steam traps. Filtr. Sep. 2008, 45, 27–29. [Google Scholar] [CrossRef]
  6. Singh, R.P.; Sorte, M.B.; Jagtap, M.M. Minimizing Steam Loss through Steam Distribution Network Using An Integrated Methodology—A Case Study of A Crude Oil Refinery. Int. Res. J. Eng. Technol. 2020, 7, 1–7. [Google Scholar]
  7. Balzamov, D.S.; Balzamova, E.Y.; Bronskaya, V.V.; Oykina, G.I.; Kharitonova, O.S.; Shaikhetdinova, R.S.; Khairullina, L.E. Increasing efficiency of technological steam consumption at oil and gas enterprise. IOP Conf. Ser. Mater. Sci. Eng. 2020, 862, 062043. [Google Scholar] [CrossRef]
  8. Glavaš, H.; Vidaković, D.; Sušenka, I. Infrared thermography in steam trap inspection. J. Energy-Energ. 2022, 70, 3–7. [Google Scholar] [CrossRef]
  9. Faria, J.R.C.; Semedo, S.M.V.; Cardoso, F.J.A.; Oliveira, J. Condition Monitoring and Diagnosis of Steam Traps with Wireless Smart Sensors. Int. J. Smart Sens. Intell. Syst. 2014, 7, 1–6. [Google Scholar] [CrossRef]
  10. Jouhara, H.; Khordehgah, N.; Almahmoud, S.; Delpech, B.; Chauhan, A.; Tassou, S.A. Waste heat recovery technologies and applications. Therm. Sci. Eng. Prog. 2018, 6, 268–289. [Google Scholar] [CrossRef]
  11. Malico, I.; Pereira, R.N.; Gonçalves, A.C.; Sousa, A.M.O. Current status and future perspectives for energy production from solid biomass in the European industry. Renew. Sustain. Energy Rev. 2019, 112, 960–977. [Google Scholar] [CrossRef]
  12. Einstein, D.; Worrell, E.; Khrushch, M. Steam systems in industry: Energy use and energy efficiency improvement potentials. Proc. ACEEE Summer Study Energy Effic. Ind. 2001, 1, 535–547. [Google Scholar]
  13. Advanced Manufacturing Office. Steam: Tip Sheets; Advanced Manufacturing Office: Washington, DC, USA, 2012.
  14. Bhatt, M.S. Energy audit case studies I—Steam systems. Appl. Therm. Eng. 2000, 20, 285–296. [Google Scholar] [CrossRef]
  15. Saidur, R. A review on electrical motors energy use and energy savings. Renew. Sustain. Energy Rev. 2010, 14, 877–898. [Google Scholar] [CrossRef]
  16. Thollander, P.; Danestig, M.; Rohdin, P. Energy policies for increased industrial energy efficiency: Evaluation of a local energy programme for manufacturing SMEs. Energy Policy 2007, 35, 5774–5783. [Google Scholar] [CrossRef]
  17. Sovacool, B.K. The cultural barriers to renewable energy and energy efficiency in the United States. Technol. Soc. 2009, 31, 365–373. [Google Scholar] [CrossRef]
  18. Umstattd, R.J. Future energy efficiency improvements within the US department of defense: Incentives and barriers. Energy Policy 2009, 37, 2870–2880. [Google Scholar] [CrossRef]
  19. Therkelsen, P.; McKane, A. Implementation and rejection of industrial steam system energy efficiency measures. Energy Policy 2013, 57, 318–328. [Google Scholar] [CrossRef]
  20. Industrial Efficiency & Decarbonization Office. MEASUR, DOE. Available online: https://www.energy.gov/eere/iedo/measur (accessed on 2 April 2023).
Figure 1. Modeling the structure of the SRU steam system in the MEASUR software.
Sustainability 15 14995 g001
Figure 2. Hourly consumption trend of boiler feed water (BFW) in the SRU unit.
Sustainability 15 14995 g002
Figure 3. Management structure of the steam system energy simulation scenarios in the SRU unit.
Sustainability 15 14995 g003
Figure 4. Structure of the steam system of the SRU unit after the implementation of the maximum steam condensate recycling solution.
Sustainability 15 14995 g004
Figure 5. Sankey diagram of energy flow in the steam system after implementing the solution.
Sustainability 15 14995 g005
Figure 6. Balance of energy consumption in the SRU unit after implementing the solution (condensate recovery energy usage).
Sustainability 15 14995 g006
Figure 7. Simulation of the main steam system of the natural gas processing plant (9200) in the MEASUR environment.
Sustainability 15 14995 g007
Figure 8. Loading rate of the main boilers in the natural gas processing plant (Unit 9200).
Sustainability 15 14995 g008
Figure 9. Management structure of the energy simulation scenario of the main steam system (unit 9200).
Sustainability 15 14995 g009
Figure 10. Sankey diagram of energy flow balance by implementing the steam turbine installation solution.
Sustainability 15 14995 g010
Figure 11. Energy balance of the steam system after implementing the solution of repair/replacement of steam traps.
Sustainability 15 14995 g011
Table 1. Evaluation of the operational costs of BFW and comparison with design consumption in the SRU unit.
Consumption TypeEquipmentUnitDesign Steam DemandOperational Steam Demand
1-DS-61001Steam desuperheaterTon/h23.12.5
1-DS-62001Steam desuperheaterTon/h2.5
1-E-6100 2,3,4 @1-V-61002Condenser and HP steam drumTon/h6.5
1-E-6200 2,3,4 @1-V-62002Condenser and HP steam drumTon/h8.1
Total-Ton/h23.119.6
Table 2. The main consumers of HP steam in the SRU unit (6100).
HP Steam Demand of EquipmentDesign Steam Demand (kg/h)
Acid Gas Preheater2726
Process Air Preheater1730
Second Stage Reheater778
Third Stage Reheater476
Table 3. Steam is produced by the 9200 and SRU units.
UnitSteam Demand (ton/h)
U-9200110.29
U-61004.86
U-62002.729
Total117.879
Table 4. The current state of the steam traps used in Unit 9200.
Steam Trap TypesTotal NumberGood ConditionBlockedLow TemperatureBlowingLeakNo Check
Disc type thermodynamic1124226100259364965
Thermostatic4000004
Floating221027040
Inverted bucket7417148261
Total12242531033143850610
Table 5. Operational data of the SRU unit.
Inlet Operation ParametersUnitAmount
1Annual operation hourshour8322
2Electricity imports to the SRU unitkW3047
3Make-up water temperature°C48
4Fuel price—natural gas equivalentUSD/cubic meter equivalent of natural gasOption 10.13
Option 10.01
5Electricity priceUSD/kWh0.01
0.05
6BFW priceUSD ¢/lit0.03
0.01
Table 6. Data related to steam production (boiler equivalent).
No.Operational Inlet ParametersUnitQuantity
1Fuel type-Heat of combustion reactions of acid gases
2Boiler Equivalent Combustion Efficiency%60.34
3Blowdown rate%1.2
4Does blowdown flash?-No
5Is the feed water preheated by blowdown heat?-No
6HP steam temperature°C252
Table 7. Data related to the details of steam headers.
No.Operational Inlet ParametersUnitQuantity
1Return steam condensate temperature°C104
2Are the return condensates flashed?-No
HP header
1Pressurebar40
2Amount of steam consumedton/h7.54
3Condensate collection rate%60
MP header
1Pressurebar6.7
2Amount of steam consumedton/h6.424
3Condensate collection rate%51
LP header
1Pressurebar3.5
2Amount of steam consumedton/h3
3Condensate collection rate%43
Table 8. Technical-economic characteristics of the solution to reduce the loss of steam condensate in the SRU unit.
No.ParameterUnitQuantityDetails
1Collectible condensateton/h5.15A more accurate amount will be measured and calculated in the next phases of the project.
2Condensate recovery factor%95Before collecting in high-pressure condensates, it is about 66%, in medium-pressure condensate (5–6.7 bar), equal to 90%, and in low-pressure condensate, equal to 0%, respectively.
3Operating hours per yearhour8322Including overhauls and annual repairs
4Price of demineralized water and energy carriersTable 5
5Estimated cost of implementing the solutionUSD450,000
Table 9. Evaluation of different energy improvement scenarios for the SRU steam system.
BaselineCondensate RecoveryOther ECMs
Percent saving (%)-%%
Power cost (USD/year)253,571253,571253,571
Savings (USD/year)-00
Fuel cost (USD/year)157,457152,685152,457
Savings (USD/year)-47725000
Make-up water cost (USD/year)542,37990,905526,290
Savings (USD/year)-451,47416,090
Annual cost (USD/year)9534.7497,161932,318
Annual savings (USD/year)-456,24621,089
Implementation cost-450,00041,000
Payback period (months)-11.83623.329
Table 10. Summary of saving energy and materials by implementing the maximum steam condensate recycling solution in the SRU unit.
BaselineCondensate RecoveryOther ECMs
Power (USD/year)253,571253,571253,571
Generation (kW)000
Demand (kW)304730473047
Import (kW)304730473047
Fuel (USD/year)157,457152,685152,457
Boiler (GJ/hour)69.3167.2167.11
Make-up water (USD/year)542,37990,905526,290
Flow (lit/min)108.6218.21150.4
Flow (lit/year)54,237,915.3590,090,526.7752,628,958.06
Marginal Steam Costs
HP Steam Cost (USD/ton)4.691.734.69
MP Steam Cost (USD/ton)2.241.732.24
LP Steam Cost (USD/ton)11.451.7311.45
Table 11. Management summary of the evaluation of the solution for the maximum steam condensate recycling in the SRU unit in the case of real prices.
BaselineCondensate RecoveryOther ECMs
Percent saving (%)-%%
Power cost (USD/year)1,267,8571,267,8571,267,857
Savings (USD/year)-00
Fuel cost (USD/year)2,046,9361,984,8991,981,939
Savings (USD/year)-62,03864,997
Make-up water cost (USD/year)1,627,137272,7161,578,869
Savings (USD/year)-1,354,42248,269
Annual cost (USD/year)4,971,9303,525,4714,828,665
Annual savings (USD/year)-1,416,459113,265
Implementation cost-450,00041,000
Payback period (months)-3.8124.344
Table 12. Evaluation results of implementing the solution of maximum steam condensate recycling in the SRU unit in the case of real prices.
BaselineCondensate RecoveryOther ECMs
Power (USD/year)1,267,8571,267,8571,267,857
Generation (kW)000
Demand (kW)304730473047
Import (kW)304730473047
Fuel (USD/year)2,046,9361,984,8991,981,939
Boiler (GJ/hour)69.3167.2167.11
Make-up water (USD/year)1,627,137272,7161,578,869
Flow (lit/min)108.6218.21105.4
Flow (lit/year)54,237,915.359,090,526.7752,628,958.06
Marginal Steam Costs
HP Steam Cost (USD/ton)25.215.9925.2
MP Steam Cost (USD/ton)17.5815.9917.58
LP Steam Cost (USD/ton)46.1715.9946.17
Table 13. Operational data for Unit 9200.
Inlet Operation ParametersUnitAmount
1Annual operation hourshour8322
2Electricity imports to Unit 9200kW1106
3Make-up water temperature°C48
4Fuel price—natural gas equivalentUSD/cubic meter equivalent of natural gasOption 10.13
Option 20.01
5Electricity priceUSD/kWh0.01
0.05
6BFW priceUSD ¢/L0.03
0.01
Table 14. Data related to steam production (boiler equivalent).
Inlet Operational ParametersUnitAmount
1Fuel type-Fuel Gas
2Equivalent combustion efficiency of the boiler%80.45
3Blowdown rate%0.94
4Is the blowdown being flashed?-No
5Is the feed water preheated by the heat of the blowdown?-Yes
6MP steam temperature°C239.9
Table 15. Data related to the details of the steam headers.
Inlet Operational ParametersUnitAmount
1Return condensate temperature°C104
2Is the returned condensate being flashed?-No
HP header
1Pressurebar21.2
2Amount of steam consumedTon/h56.02
3Condensate collection rate%72.1
MP header
1Pressurebar6
2Amount of steam consumedTon/h54.03
3Condensate collection rate%72.09
Table 16. Design conditions and results of using a small steam turbine instead of a pressure relief valve.
ParametersUnitDesignOperational
Inlet steam pressurebar2222
Outlet steam pressurebar55
Inlet flow rateTon/h75.254
Power generation capacitykW33772425
Turbine efficiency%3535
Annual operation timehour83228322
Nominal capacity of the steam turbine *kW35003500
The cost of purchasing and installing a steam turbineThousands USD31003100
* The size calculation of the steam turbine was conducted with MEASUR.
Table 17. Summary of the financial-economic evaluation of the solutions to improve the steam system of the natural gas processing plant, Unit 9200.
BaselineCondensate RecoveryOther ECMsSteam Turbine Installation
Percent saving (%)-%%%
Power cost (USD/year)92,04192,04189,188−109,730
Savings-02853201,771
Fuel cost (USD/year)777149775,003734,678778,584
Savings (USD/year)-214542,470−1436
Make-up water cost (USD/year)2,676,2612,406,5192,607,8982,676,430
Savings (USD/year)-269,74268,364−169
Annual cost (USD/year)3,545,4513,273,5643,431,7633,345,285
Annual savings (USD/year)-271,887113,688200,166
Implementation cost-230,000126,0003,100,000
Payback period (months)-10.15113.300185.845
Selected Energy Projects-Adjust Boiler Operations
Adjust Condensate Handling
Adjust General Operations
Adjust Boiler Operations
Modify High to Low Pressure Steam Turbine
Table 18. Summary of energy analysis of the steam system by implementing the solutions-unit 9200.
BaselineCondensate RecoveryOther ECMsSteam Turbine Installation
Power (USD/year)92,04192,04189,188−109,730
Generation (kW)0002424.6
Demand (kW)1106110611061106
Import (kW)110611061106−1318.6
Fuel (USD/year)777,149775,003734,678778,584
Boiler (GJ/hour)342.07341.12333.72342.7
Make-up water (USD/year)2,676,2612,406,5192,607,8982,676,430
Flow (lit/min)535.98481.96539536.02
Flow (lit/year)267,626,116.41240,651,903.14260,789,751.2267,643,033.93
Marginal Steam Costs
HP Steam Cost (USD/ton)3.773.473.773.77
LP Steam Cost (USD/ton)3.773.473.773.77
Table 19. Financial-economic evaluation of steam system energy-saving solutions.
BaselineCondensate RecoveryOther ECMsSteam Turbine Installation
Percent saving (%)-%%%
Power cost (USD/year)460,207460,207445,939−548,650
Savings (USD/year)-014,2671,008,856
Fuel cost (USD/year)10,102,93110,075,0449,550,81410,121,596
Savings (USD/year)-27,887552,116−18,665
Make-up water cost (USD/year)13,381,30612,032,59513,039,48813,382,152
Savings (USD/year)-1,348,711341,818−846
Annual cost (USD/year)23,944,44322,567,84623,036,24122,955,098
Annual savings (USD/year)-1,376,597908,202989,346
Implementation cost-230,000126,0003,100,000
Payback period (months)-2.0051.66537.601
Selected Energy Projects-Adjust Boiler Operations
Adjust Condensate Handling
Adjust General Operations
Adjust Boiler Operations
Modify High to Low Pressure Steam Turbine
Table 20. Summary of the evaluation results of the maximum steam condensate recycling solution in the SRU unit.
Price OptionsThe Amount of Savings of BFWAnnual Operating CostTotal Cost of Steam ProductionEnergy SavingReturn on Investment Time
SolutionsScenariosTons/YearMillions USDUSD/Ton%Months
BaselineCurrent prices45,1470.9532.24–11.45--
Real prices45,1474.95217.58–46.17--
Maximum recovery in SRUCurrent prices-0.4971.7329 percent
477 thousand cubic meters
11.8
Real prices-3.52515.9929 percent
477 thousand cubic meters
3.8
Table 21. Summary of the evaluation results of steam system improvement solutions in unit 9200.
Price OptionsThe Amount of Savings of BFWAnnual Operating CostTotal Cost of Steam ProductionEnergy SavingReturn on Investment Time
SolutionsScenariosTons/YearMillions USDUSD/Ton%Months
BaselineCurrent prices-3.53.77--
Real prices-23.925.64--
Replacement and repair of steam trapsCurrent prices13503.23.77810.2
Real prices135022.624.1482
Installing a small steam turbine instead of a PRVCurrent prices03.33.776186
Real prices022.925.66637.6
Other SolutionsCurrent prices3423.43.77313.3
Real prices3422325.4631.7
Table 22. The sensitivity analysis of the results by implementing the strategy of replacement and repair of damaged steam traps in Unit 9200 regarding different natural gas and BFW prices.
Natural Gas PriceBFW PriceFinancial IndicesConsiderations
USD Cent/CMUSD Cent/LiterReturn on Investment Time (Months)Annual Profitability of the Solution (Thousands of Dollars)
0.50.392.551.280Current utility prices
1128.0169.71
3137.4173,340The natural gas price in the budget of 2022
5126.7176,970Possible future prices
13124.8191,460Economic Council—The value of natural gas savings
13213.2359,360
1339.0527,260
2038.8539,970The real price of natural gas at low crude oil prices
4038.2576,240The real price of natural gas at high crude oil prices
Table 23. Estimation of the financial indicators of the implementation of the repair and replacement of damaged steam traps in the SRU unit, considering simultaneous natural gas and BFW savings.
Natural Gas PriceBFW PriceCompound Investment Return TimePresent Value IndexBenefit-Cost RatioProject Implementation Risk (Solution)
NPV
USD Cent/CMUSD Cent/LiteryearUSD-%
113.551,1161.329.84
513.277,5171.426.06
1312.7126,2581.721.42
1330.92539,3364.110.8
0.50.310.2−105,2610.3994.86
Disclaimer/Publisher’s Note: The statements, opinions and data contained in all publications are solely those of the individual author(s) and contributor(s) and not of MDPI and/or the editor(s). MDPI and/or the editor(s) disclaim responsibility for any injury to people or property resulting from any ideas, methods, instructions or products referred to in the content.

