Article

Analysis of Spatiotemporal Patterns of Undernutrition among Children below Five Years of Age in Uganda

by
Vallence Ngabo Maniragaba
1,*,
Leonard K. Atuhaire
2 and
Pierre Claver Rutayisire
1
1
African Center of Excellence in Data Science, College of Business and Economic, University of Rwanda, Kigali P.O. Box 3248, Rwanda
2
School of Statistical Methods, College of Management Sciences, Makerere University, Kampala P.O. Box 7072, Uganda
*
Author to whom correspondence should be addressed.
Sustainability 2023, 15(20), 14872; https://doi.org/10.3390/su152014872
Submission received: 1 July 2023 / Revised: 5 August 2023 / Accepted: 8 August 2023 / Published: 13 October 2023

Abstract

:
Background: This study aimed at examining the prevalence and variations in undernutrition among children below five years of age in Uganda while considering the influence of space and time factors. Various studies conducted in Uganda analyzed the undernutrition phenomenon among children below five years of age with a focus on the risk factors and spatial variations; however, no study has ever integrated the elements of time in examining the problem of undernutrition in Uganda. The approach of spatial and spatiotemporal analysis is essential in identifying cluster patterns, hotspots, trends, and emerging hotspots, which is crucial in making timely and location-specific interventions. Methods: Data from the six Uganda Demographic and Health Surveys spanning from 1990 to 2016 were used, with the main outcome variable being undernutrition among children below five years of age. A Composite Index of Anthropometric Failure was derived from the three undernutrition outcomes and subsequently used as a proxy of undernutrition in this study. All data that were relevant to this study were retrieved from the survey datasets and combined with the 2014 shape files of Uganda to enable spatial and spatiotemporal analysis. Spatial maps with the spatial distribution of the prevalence of undernutrition, both in space and time, were generated using ArcGIS Pro version 2.8. Moran’s I, an index of spatial autocorrelation, was used to test the hypothesis of no spatial autocorrelation, while the Getis–Ord (Gi*) statistic was used to examine hot and cold spot areas. Furthermore, space-time cubes were generated to establish the trend in undernutrition as well as to mirror its variations over time and across the country. Moreover, emerging hot spot analysis was done to help in identifying the patterns of undernutrition over time. Results: The national prevalence of undernutrition among children below five years of age was 31.96 percent, with significant spatial variations both in space across Uganda and in the time since 1989. The index of spatial autocorrelation (Moran’s I) confirmed spatial clustered patterns as opposed to random distributions of undernutrition prevalence. Four hot spot areas, namely, the Karamoja, the Sebei, the West Nile, and the Toro regions, were significantly evident. Most of the central parts of Uganda were identified as cold spot clusters, while most of Western Uganda, the Acholi, and the Lango regions had no statistically significant spatial patterns by the year 2016. The spatio-temporal analysis identified the Karamoja and Sebei regions as clusters of persistent, consecutive, and intensifying hot spots, West Nile region was identified as a sporadic hotspot area, while the Toro region was identified with both sporadic and emerging hotspots. In conclusions, undernutrition is a silent pandemic that calls for immediate and stringent measures. At 31.96 percent, the prevalence is still very high and unpleasant. To reduce the prevalence of undernutrition and to achieve SDG goal 2, policymakers, as well as implementers, should consider the spatial effects and spatial and spatiotemporal variations across the country and prioritize interventions to hot spot areas. This would ensure efficient, timely, and region-specific interventions.

1. Introduction

Undernutrition is a silent pandemic that globally affects the lives of more than 149 million (22%) children below five years of age [1]. It normally results from insufficient or unbalanced intake of food nutrients. It can also result from the body’s failure to absorb the food nutrients relative to its needs to function well. Undernutrition as a concept is a composite variable of three broad categories of conditions: stunting (low height-for-age), underweight (low-weight for-age), and wasting (low weight-for-height). The populations that are more at risk include the children, the chronically ill, the elderly, the food insecure households, but children, especially the under-fives, have greater nutritional needs than the adults. Undernourished children experience a high frequency of morbidity [2,3], loss of appetite and immunity [4], poor growth and cognitive development, as well as poor performance at school [5,6], and it increases the relative risk of mortality among the <5 s [7,8].
The effects of undernutrition are unpleasant in all circumstances, and this has led to calls for economies to invest in interventions that can reduce it. For efficient resource utilization, interventions to reduce undernutrition should be informed by the prevalence rates, the nature of its distribution, and variations over space as well as over time. The global distribution of undernutrition among under-fives has, for a long time now, been skewed towards developing countries, especially the countries within Asia and Africa. Asia and Africa together share more than 90% of all the world’s undernourished children [1]. With >30 percent of all undernourished under-fives, Eastern Africa is among the regions in Africa that are faced with alarming prevalence rates of undernutrition, and Uganda’s case is the worst [1]. Hunger is one of the avenues through which undernutrition affects the population, and thus, the United Nations (UN) Sustainable Development Goals (SDGs) considered reducing hunger to zero by 2030 [9] as one way to deal with undernutrition, especially within the poor communities. Most studies in Uganda were based on cross-sectional data, and they also lacked the idea of spatial considerations both in space and time, yet geographical and regional disparities, as well as the time variations, have a great influence on under-nutritional outcomes, especially among the children below five years of age. Thus, a study based on the composite index of anthropometric failure (CIAF) gives the best estimate of the prevalence rate of undernutrition. In addition, consideration of spatial and spatial-temporal variations adds value to the understanding of the undernutrition problem, its spatial disparities, its geographically based risk factors, as well as its location-specific evolution over time. Consequently, based on the CIAF as a proxy of undernutrition, the current study aimed at estimating the prevalence rate of undernutrition among children below five years of age, analyzing its geographically weighted influencing factors as well as its spatial and spatiotemporal variations in Uganda.

2. Materials and Methods
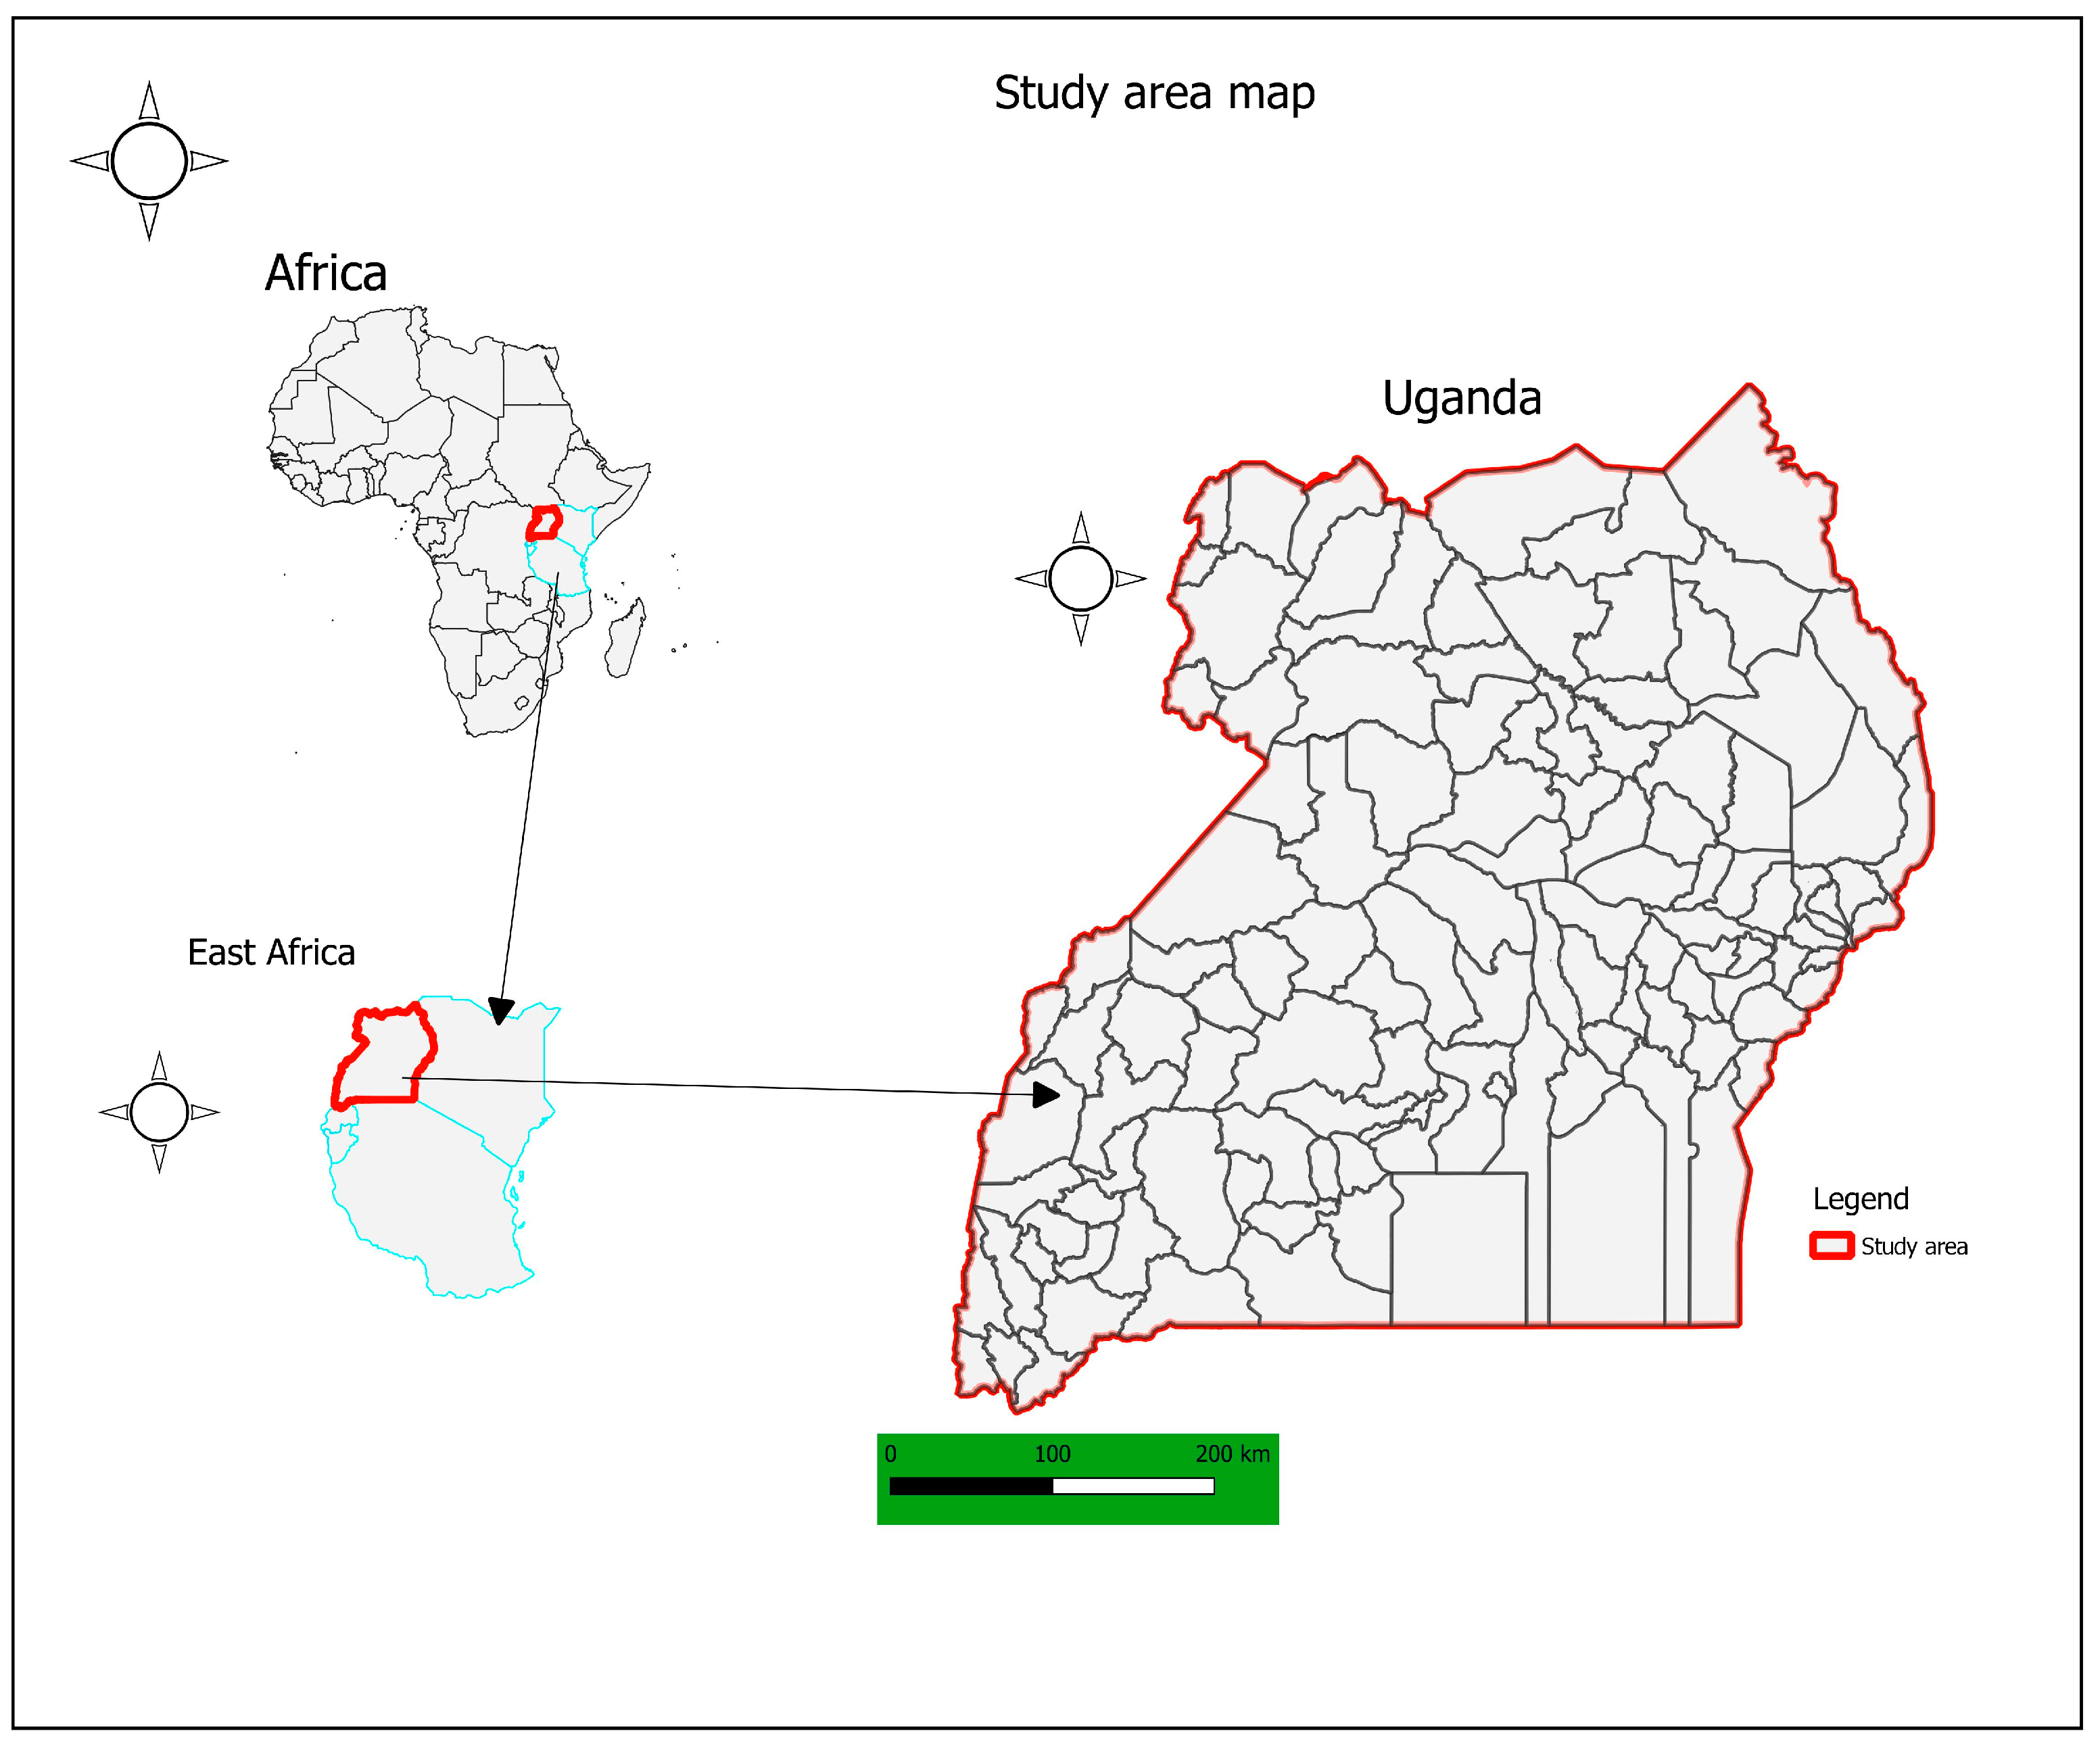
This section presents the study area, including the location variable (administrative district) as per the most recent and available dataset UDHS 2016, the variables of the study, data types and sources, and finally, the approaches to data analysis are discussed.

2.1. The Study Area

The study area, as displayed in Figure 1, consisted of the 2016 administrative districts of Uganda by the year 2016. The year 2016 was considered because the most recent and available Uganda Demographic and Health Survey (UDHS) dataset was conducted in that year. The data was collected from 112 districts of Uganda which were embedded within the 15 UDHS regions, namely, South Central, North Central, Kampala, Busoga, Bukedi, Bugisu, Teso, Karamoja, Lango, Acholi, West Nile, Bunyoro, Toro, Kigezi, Ankole [10]. Uganda is one of the currently seven countries that make the East African Community (EAC) block, the other six being Rwanda, Kenya, Burundi, Tanzania, South Sudan, and the Democratic Republic of Congo (DRC). Data were collected at the household level from women of childbearing age (15–45) who gave all necessary information about the children (0–5 years) that were under their care at that time. In this study, the spatial unit of analysis location was a district, and the prevalence rates and other variable observations were the average values per district.

2.2. Data and Data Sources

This study was based on purely secondary data and shape files of administrative units (districts) of Uganda by the year 2016. Data were retrieved from the Demographic and Health Survey (DHS) program portal. Data from the portal were publicly accessible on request from “The DHS Program—Uganda: Standard DHS, 2016 Dataset”. Altogether, six datasets (UDHS 1990, UDHS 1995, UDHS 2000, UDHS 2005, UDHS 2011, and UDHS 2016) were retrieved from the portal, and variables specific to this study were extracted, modified, or transformed into the vital form as discussed in the next section.

2.3. Methods of Data Analysis

In this section, the approach to data modification was discussed. In addition, discussed were the derivation of CIAF, the mode of estimation of the prevalence rate, the approach to test for spatial autocorrelation, and spatial and spatiotemporal analysis approaches. Data analysis commenced with the modification and derivation of variables based on the information that existed within the UDHS datasets. Among the derived variables were the z-scores for stunting, underweight, and wasting, the Composite Index of Anthropometric Failure (CIAF). In accordance with the WHO [11] guidelines, z-scores were calculated and used to categorize children into two groups where children whose z-scores < −2 standard deviations (SD) were categorized as having the respective anthropometric failure. Children were categorized as stunted or too short for their age when their standardized z-scores (height/age) were <−2 sd from the median population of the well-fed children of the same age. Likewise, a child was categorized as underweight or too light for their age whenever their standardized z-scores (weight/age) were <−2 sd from the median of the reference population, while a child was categorized as having body wasting or too thin for their height whenever their standardized z-scores (weight/height) were <−2 sd from the median of the reference population. Dummy variables with outcomes, 1 for a z-scores < −2 sd and 0 for z-scores ≥ −2 sd for all the anthropometric failures, were derived to categorize children as either undernourished or otherwise as shown in (Equations (1)–(3)).
d s t u n t e d = 1    i f   t h e   c h i l d   i s   s t u n t e d 0 i f   t h e   c h i l d   i s   n o t   s t u n t e d
d u n d e r w e i g h t = 1    i f   t h e   c h i l d   i s   s t u n t e d 0 i f   t h e   c h i l d   i s   n o t   s t u n t e d
d w a s t e d = 1    i f   t h e   c h i l d   i s   s t u n t e d 0 i f   t h e   c h i l d   i s   n o t   s t u n t e d
All the above three categories of anthropometric failures (stunting, underweight, or wasting) indicated a deficiency in body nutrients whenever the code was 1. A child with stunted growth, underweight, body wasting, or at least one of these is regarded as undernourished. It was thus prudent to derive an index of anthropometric failure that was a composite of all three outcomes [12]. The real prevalence of undernutrition was thus calculated as a percentage of positive outcomes (yes) out of the total number of children below five years of age in Uganda. The CIAF itself was binary in nature, with 1 indicating the presence of an anthropometric failure while representing the absence of such anthropometric failure. The CIAF was derived as a summation from the respective dummy outcomes (Equations (1)–(3)), and the process is indicated in Table 1 below.
From Table 1, a CIAF score of at least 1 implied that the child had at least one anthropometric failure, and thus, only those children whose CIAF score = 0 were normally nourished. Malnutrition status for a given child thus depended on the value of the CIAF (Equation (4) below).
C I A F = 1    i f   t h e   c h i l d   i s   u n d e r n o u r i s h e d 0 i f   t h e   c h i l d   i s   n o t   n o t   u n d e r n o u r i s h e d
After the harmonization of all the variables, all variables of interest were combined with the shape file for the study area (Uganda). The prevalence rate of undernutrition among children below five years of age was estimated as a percentage of the total number of children whose anthropometric measurements were recorded, as presented in Table 2 below. Spatial analysis was done with the objective of establishing spatial variations of undernutrition across the study area. The first step involved the generation of a spatial map that randomly showed the distribution of undernutrition across the country. The second step was to test for global spatial autocorrelation using Moran’s I index of spatial autocorrelation. The third step involved identifying hot spots using the Getis and Ord (GI*) statistic. The fourth step involved identifying outliers through the optimization process, for it is possible to have outliers in most statistical situations whereby high values may exist within a cluster of low values or lower values exist within clusters of high values.

3. The Moran’s I Statistic for Global Spatial Autocorrelation

Moran’s I index is one of the oldest inferential statistics used in testing both for local and global spatial autocorrelations among continuous data [13]. The spatial autocorrelation statistic measures spatial autocorrelation based on both feature locations and feature values simultaneously. The statistic takes into account both the value and location of a variable X i j it is able to reveal important information about the dependence or independence of the variable from the surroundings for a reasonable distance band, and it evaluates whether the pattern is clustered or random beyond reasonable doubt. The index is calculated as expressed in Equation (5).
I = n s i j W i j ( X i x ¯ ) ( X j x ¯ ) Σ i x i x ¯ 2
where:
n: the number of observations
x ¯ : is the mean value of the undernutrition prevalence rate in Uganda, w i j : are elements of the spatial weight matrix W based on the distance band between locations and j and this allows comparisons between different locations in relation to undernutrition and therefore;
W = Σ i Σ j w i j
X i is the prevalence of undernutrition at a certain location i
X j is the prevalence of undernutrition at a certain location j
The statistical value typically ranges between −1 to +1; the closer the value is to −1, the lower the cross-product of the values of undernutrition between districts, an indication of dissimilarity in undernutrition and hence negative spatial autocorrelation in undernutrition between close-by districts. Likewise, the closer the value is to +1, the higher the cross-product of the values of undernutrition between the districts, an indication of similarity between close-by districts hence positive spatial autocorrelation.
The expected values of Moran’s I index and all other indices can be calculated using the formulae in the subsequent equations.
E I = 1 n 1
The z-scores can be calculated using the formula in Equation (8) as;
z i = I E I v I
where E ( I ) is the expected value of I and v ( I ) is the variance of I as shown in Equations below.
X ¯ = J = 1 n x j n
s = J = 1 n x 2 j n x ¯ 2
and
E G d = W n n 1
Based on the assumption of a normal distribution with mean 0 and variance 1, the variance and standard error of G and Z statistics can be calculated as shown by Equations (12)–(14).
v a r G d = E G 2 E G 2
with standard error
S E G d = ν a r ( G d )
Hence,
Z G d = G ( d ) E [ G d ] S E . G d
To identify the spatial deployment patterns, we estimated the mean center and the standard distance. The mean center, as used in this study, was the latitude and longitude coordinates of all features within the study scope, and its calculation allows for tracking both the changes that happened in the spatial distribution of features and their associations. The mean center is calculated as in Equations (15) and (16) below.
x ¯ = 1 = 1 n x i N
y ¯ = 1 = 1 n y i N
x i and y i are the coordinates of the feature i while ( N ) is the total number of features.
The standard distance (Equation (17)) is a statistic that measures the degree to which features are concentrated or dispersed around the geometric mean center, while the standard deviation (SD) Statistic can be estimated as in Equation (18)
v I = E ( I 2 ) E ( I ) 2
S D = x i x ¯ 2 n + y i y ¯ 2 n

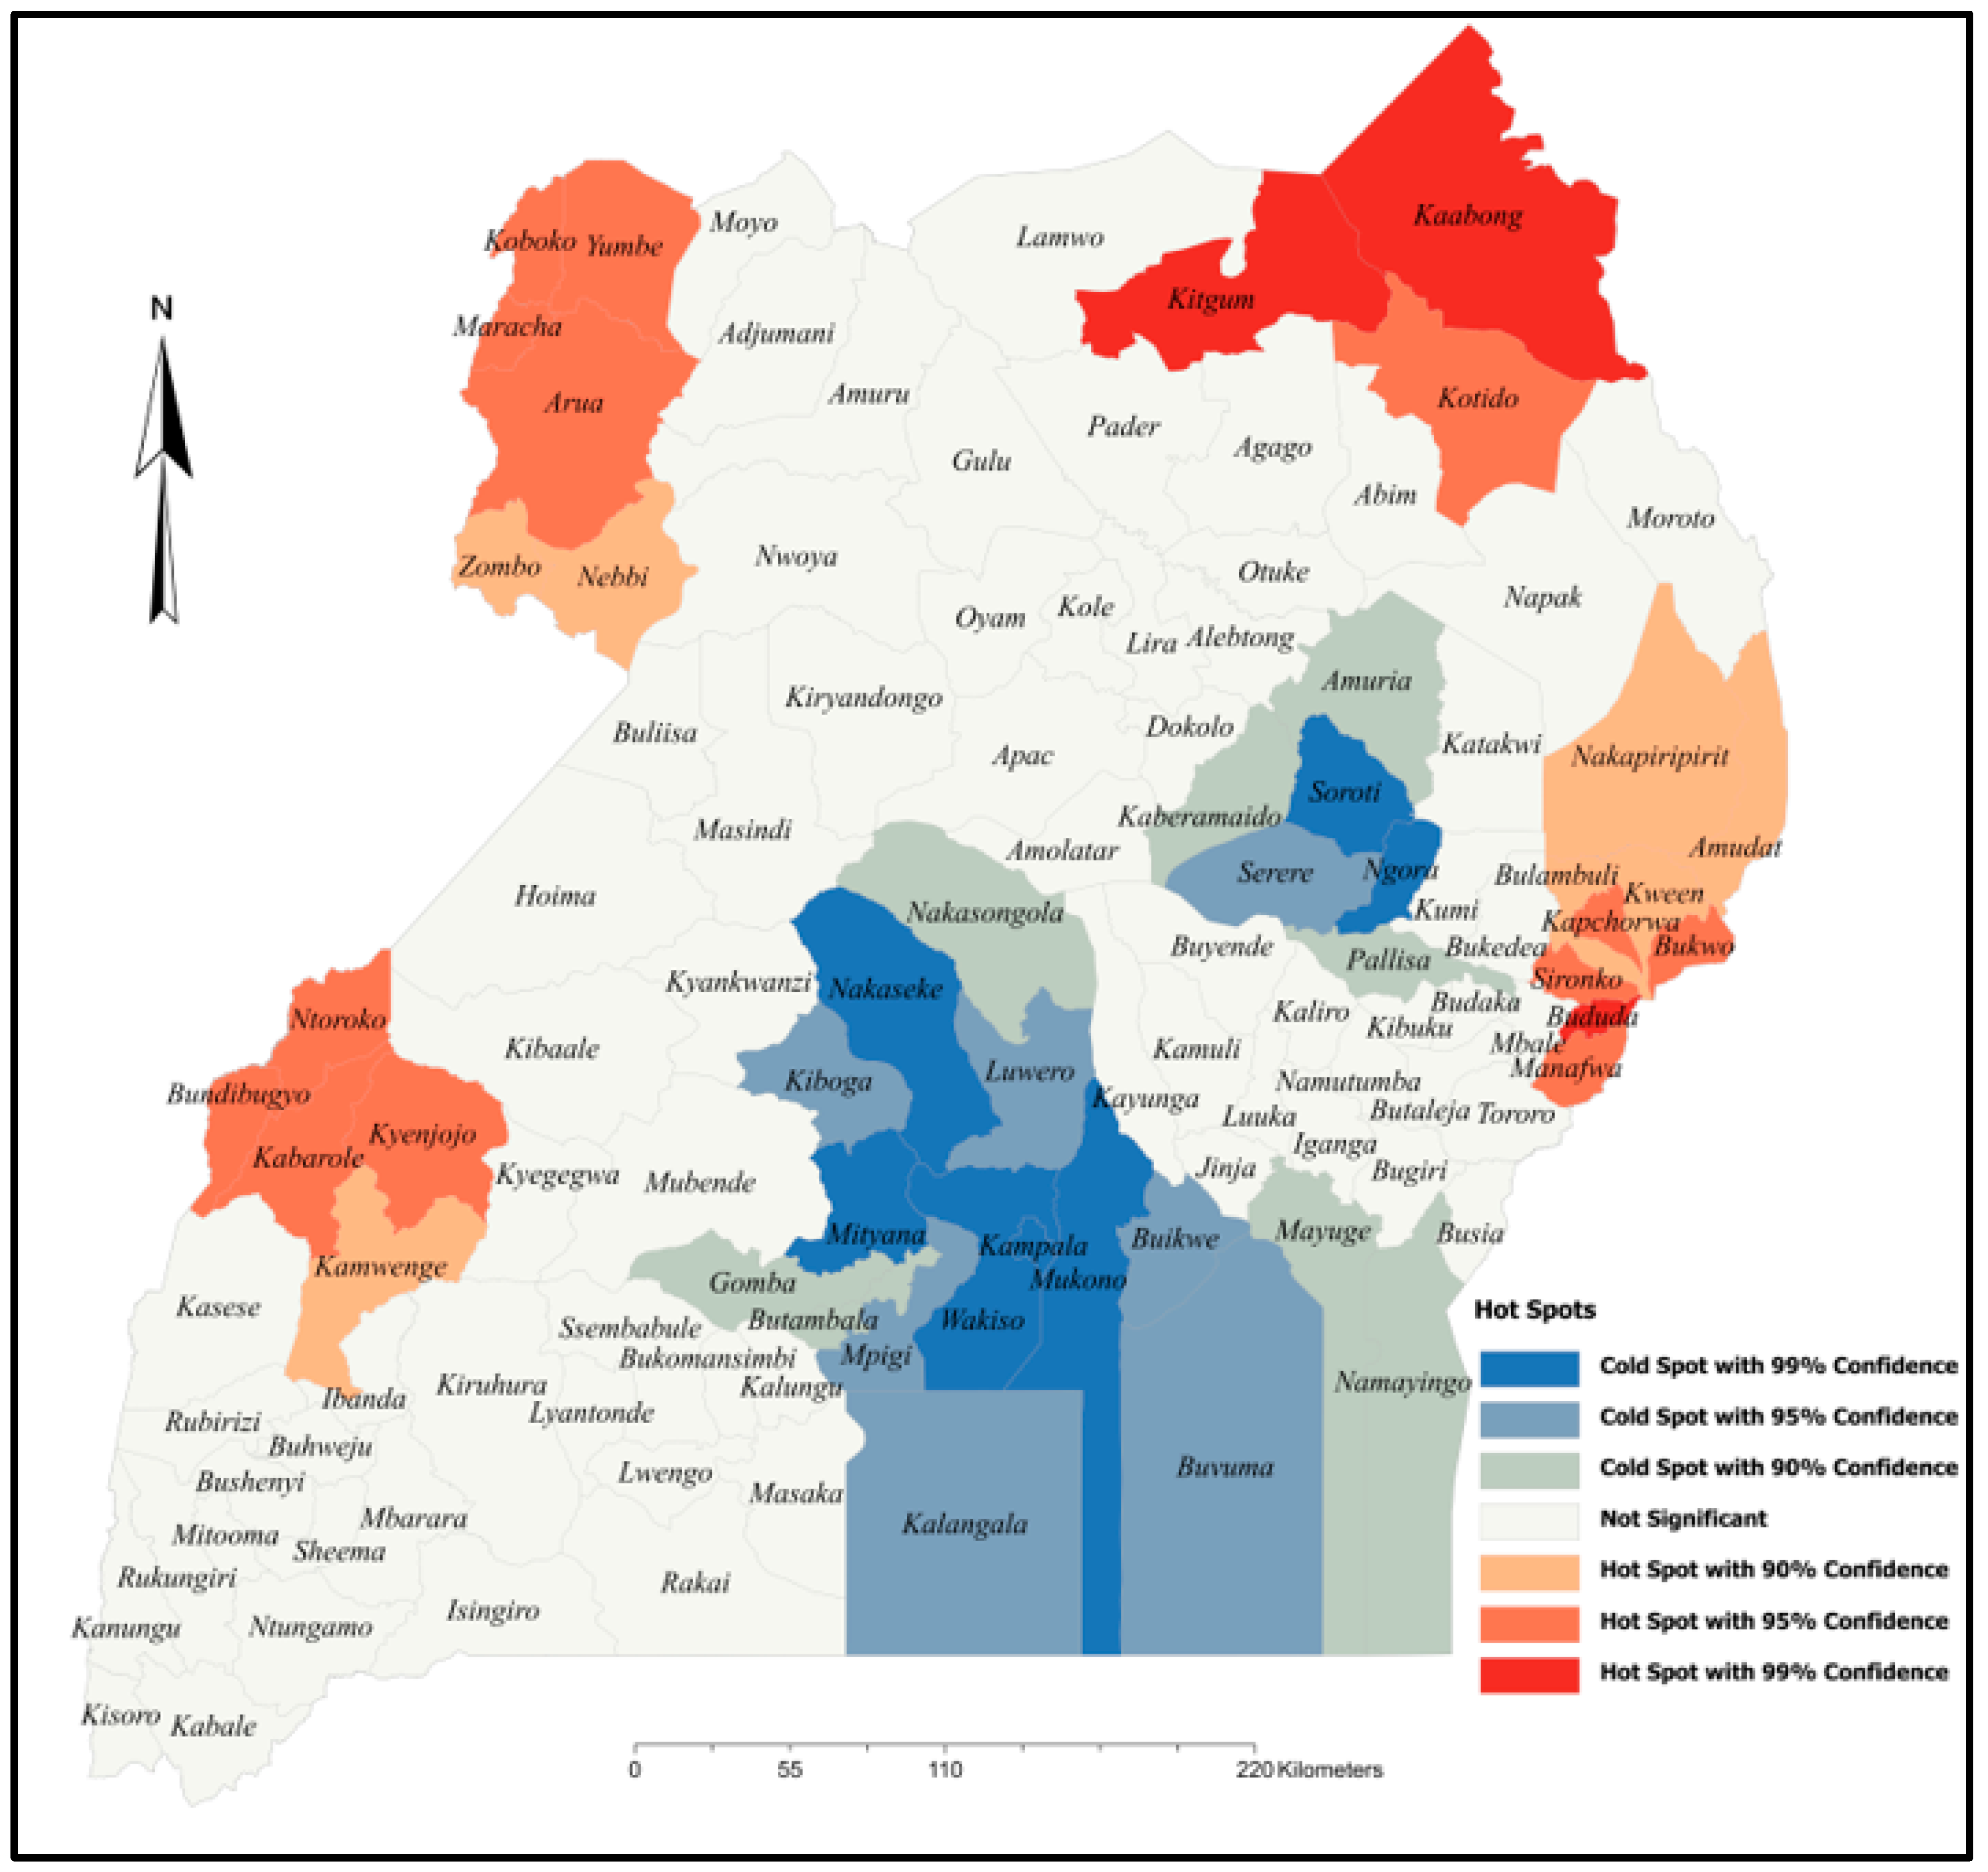
The Getis-Ord (Gi*) Statistic for Hot Spot Analysis

While Moran’s I index is able to identify positive or negative spatial autocorrelation, it doesn’t go further to differentiate the positive spatial autocorrelation with high values from positive spatial autocorrelation with low values, and yet the level of spatial heterogeneity may vary across space. Consequently, the Getis–Ord (Gi*) [14] statistic, which has the capacity to measure the concentration of high or low values that could help in identifying hot or cold spot areas, became more appropriate in this study.
G i = j = 1 n w i , j x j X ¯ j = 1 n w i , j s [ n Σ w i , j 2 w i , j ) 2 n 1
Accordingly, the Getis–Ord (Gi*) statistic can statistically be calculated as in Equation (19)
where:
x i the prevalence of undernutrition at location.
x j the prevalence of undernutrition at location.
w i , j the elements of weight matrix n the number of observations.
Moreover, spatiotemporal approaches were used to examine variations in undernutrition over space and time. Trend analysis, emerging hotspot analysis, and optimized outlier analysis were conducted in this aspect. All in all, spatial maps were generated, displayed, and analyzed with respect to the subject matter. Arc-GIS pro version 2.8 was used for all spatial analysis.

4. Results

This section presents the findings of the prevalence of undernutrition based on the Composite Index of Anthropometric Failure (CIAF) approach, spatial and spatiotemporal variations in undernutrition among children below five years of age in Uganda. Based on both the cross-sectional and time series data, the prevalence of undernutrition, its spatial variations across space and time, its geographically weighted risk factors as well as the emerging hotspots are examined.

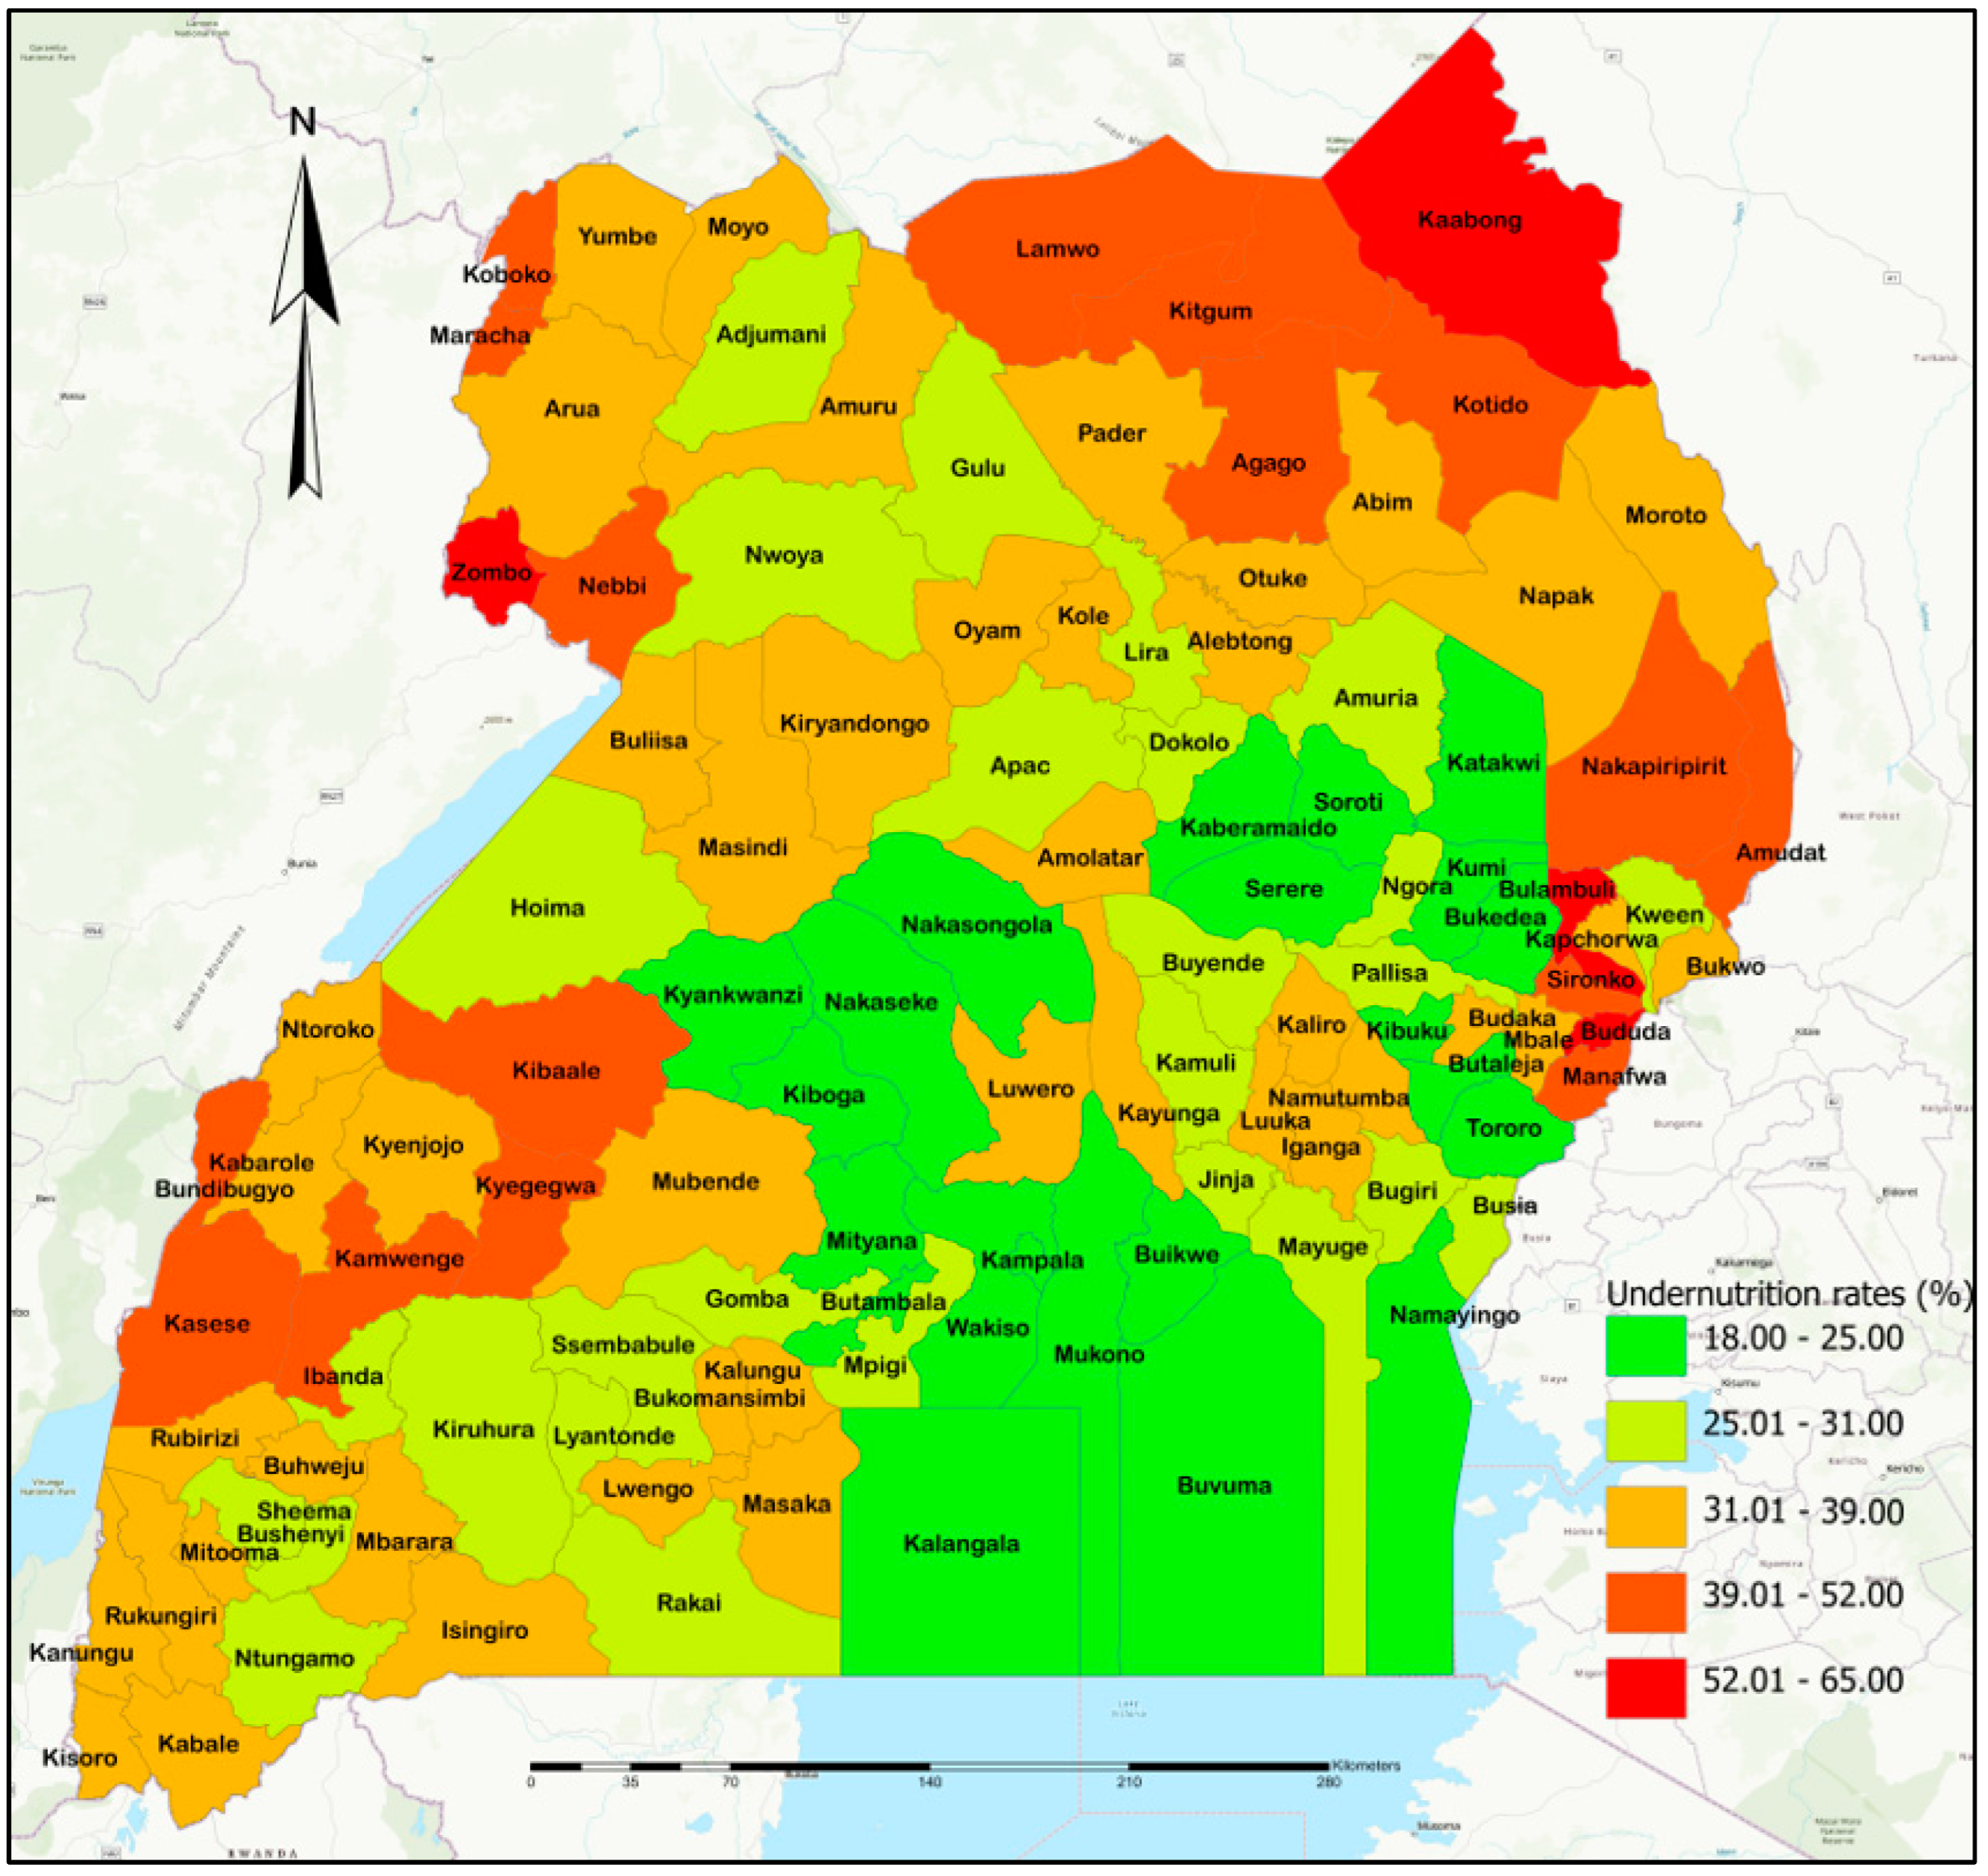
4.1. The Prevalence of Undernutrition among Childrem below 5 Years of Age in Uganda Based on the CIAF

The concept of CIAF as an index of undernutrition was used earlier in other studies elsewhere [1,2,3], but such an approach was yet to be applied to Ugandan data until the implementation of this study. Initially, studies dealt with undernutrition outcomes one by one; for example, some studies dealt with stunting [4,5,6,7,8,9,10,11,12,13], while others dealt with independent combinations of the outcomes [9,14,15,16]. CIAF as a proxy of undernutrition was given much attention in this study because of its ability to take into account all the children faced with at least one undernutrition outcome, and as such, it can help to deal with the problem once and for all. Table 2 shows that close to 32 percent of the 4390 children aged 0–5 years in Uganda had at least one outcome of undernutrition. Sexual-related disparities were also observed, and it was revealed that the male child was more at risk of being undernourished (34.3%) than the female child (29.6%) of the same age bracket.
As clearly indicated by Table 2, the problem of undernutrition among children below five years of age in Uganda is very serious, causing concern about whether the World Health Organization (WHO) global targets [5] for 2025 and the Sustainable Development Goals (SGD-2) of zero hunger and no malnutrition [17] will be achieved. Identification and categorization of areas in terms of severity of the matter would guide in prioritization and effective and timely deployment of meagre resources to accelerate the reduction of the prevalence rates. As such, the study commenced by making an analysis of spatial and spatial-temporal variations across the country. In addition, the study examined the risk factors of undernutrition among children below five years of age by bearing in mind the spatial and geographical effects. The next sections present the results.

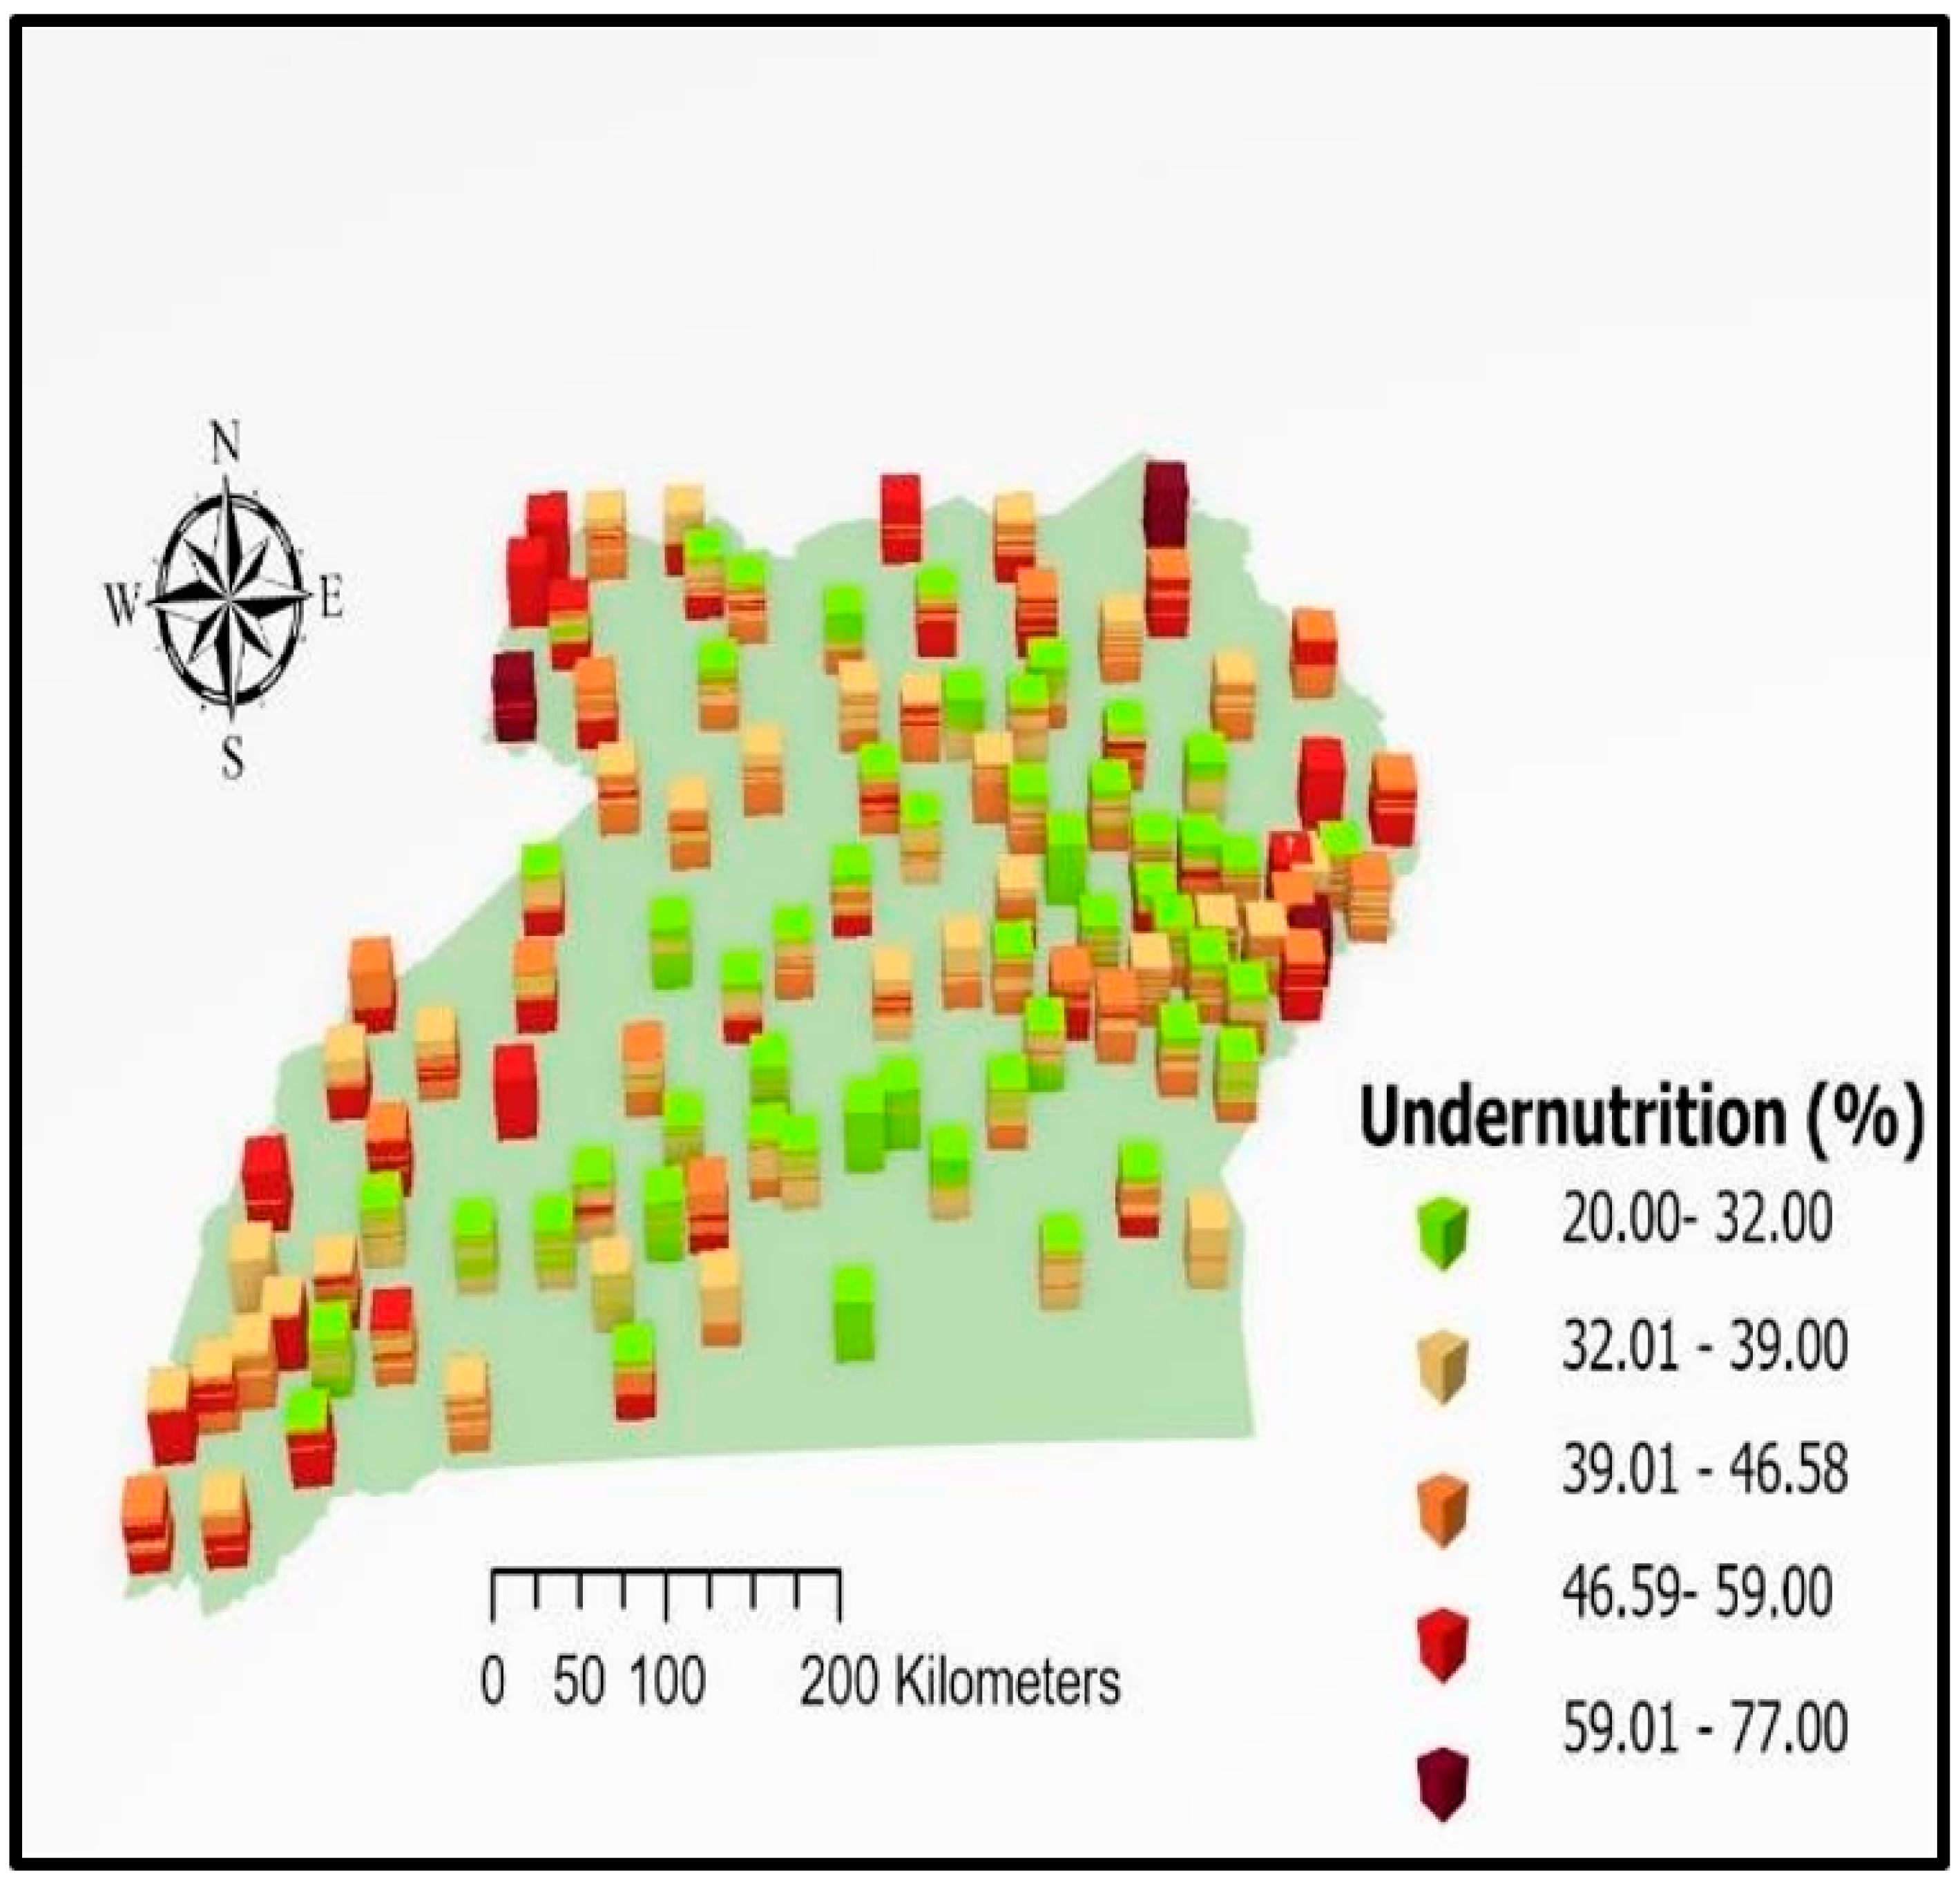
4.2. Spatial Variations of Undernutrition among Children below 5 Years of Age in Uganda

Understanding variations in the prevalence of undernutrition is important in designing timely and spot-on interventions. From the results as presented in Figure 2, it was clear that the prevalence of undernutrition spatially varied across the country. There were areas with high prevalence levels and areas with low prevalence levels, yet other areas had medium prevalence levels. Figure 2 also reveals that areas of higher values were blended with areas of low or medium values. However, children from most areas within the North Eastern, West Nile, and Toro regions of Uganda were highly undernourished. The geographical variability in the prevalence of undernutrition outcomes is common in many countries, as the literature reveals [18,19,20], but it was prudent to identify the hot spot areas and analyze the spatial effects, as well as the effect of time, which the current study fulfilled.
Furthermore, from Figure 2, the randomness of the prevalence rates of undernutrition across the country makes it hard for interventions to be successful. This could partly explain why by 2016, the overall prevalence of undernutrition was still high (31.2%). It is also likely that the prevalence of undernutrition in the neighboring locations was autocorrelated. Spatial autocorrelation describes the presence of systematic spatial variation in a mapped variable. Positive spatial autocorrelation is the tendency for areas or locations to have similar values with the neighborhood, while negative spatial autocorrelation is the tendency for areas or locations to have dissimilar values with the neighborhood. It is not uncommon to find that the prevalence rates of most epidemiological events like undernutrition and its associated risk factors within one location are autocorrelated with the level of the outcome of the same event in another location within the neighborhood. Bearing this in mind, the hypothesis of “no spatial autocorrelation” was tested with the aim of identifying cluster patterns and areas of hot and/or cold spots across the country. Consequently, Moran’s I, an index of spatial autocorrelation, was used to test whether the patterns identified would be a result of random chance, as displayed in Figure 3.

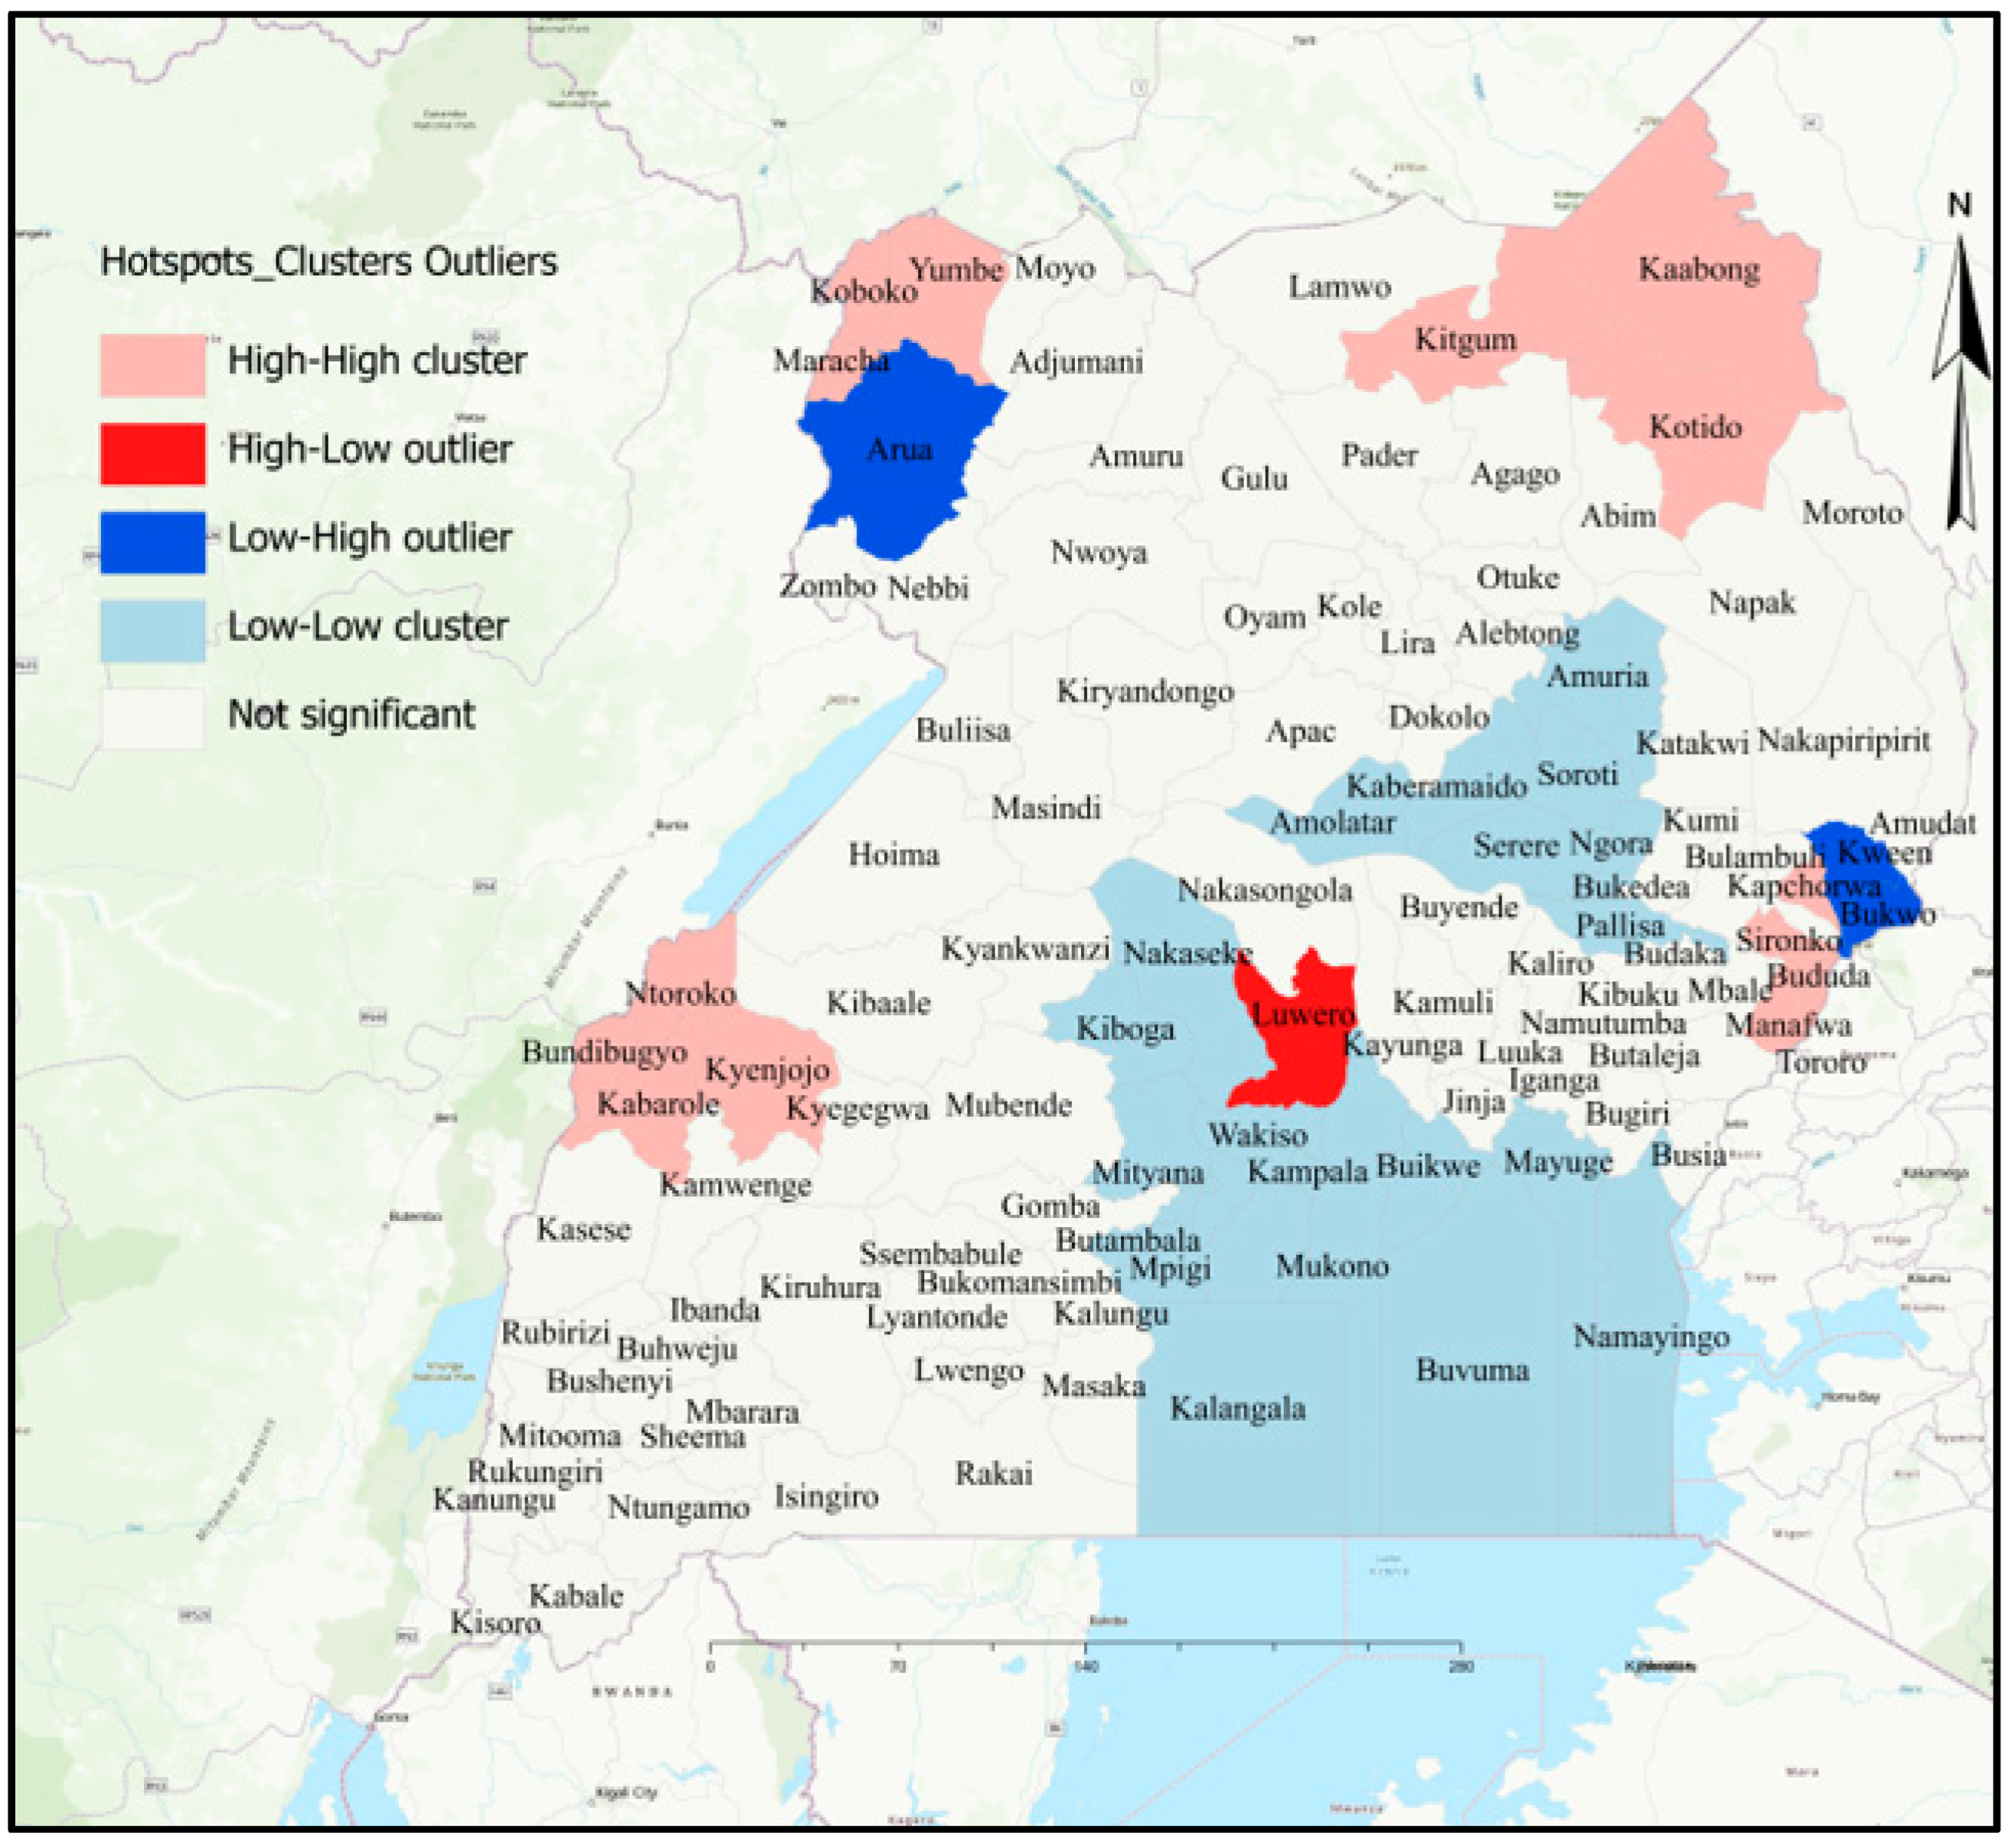
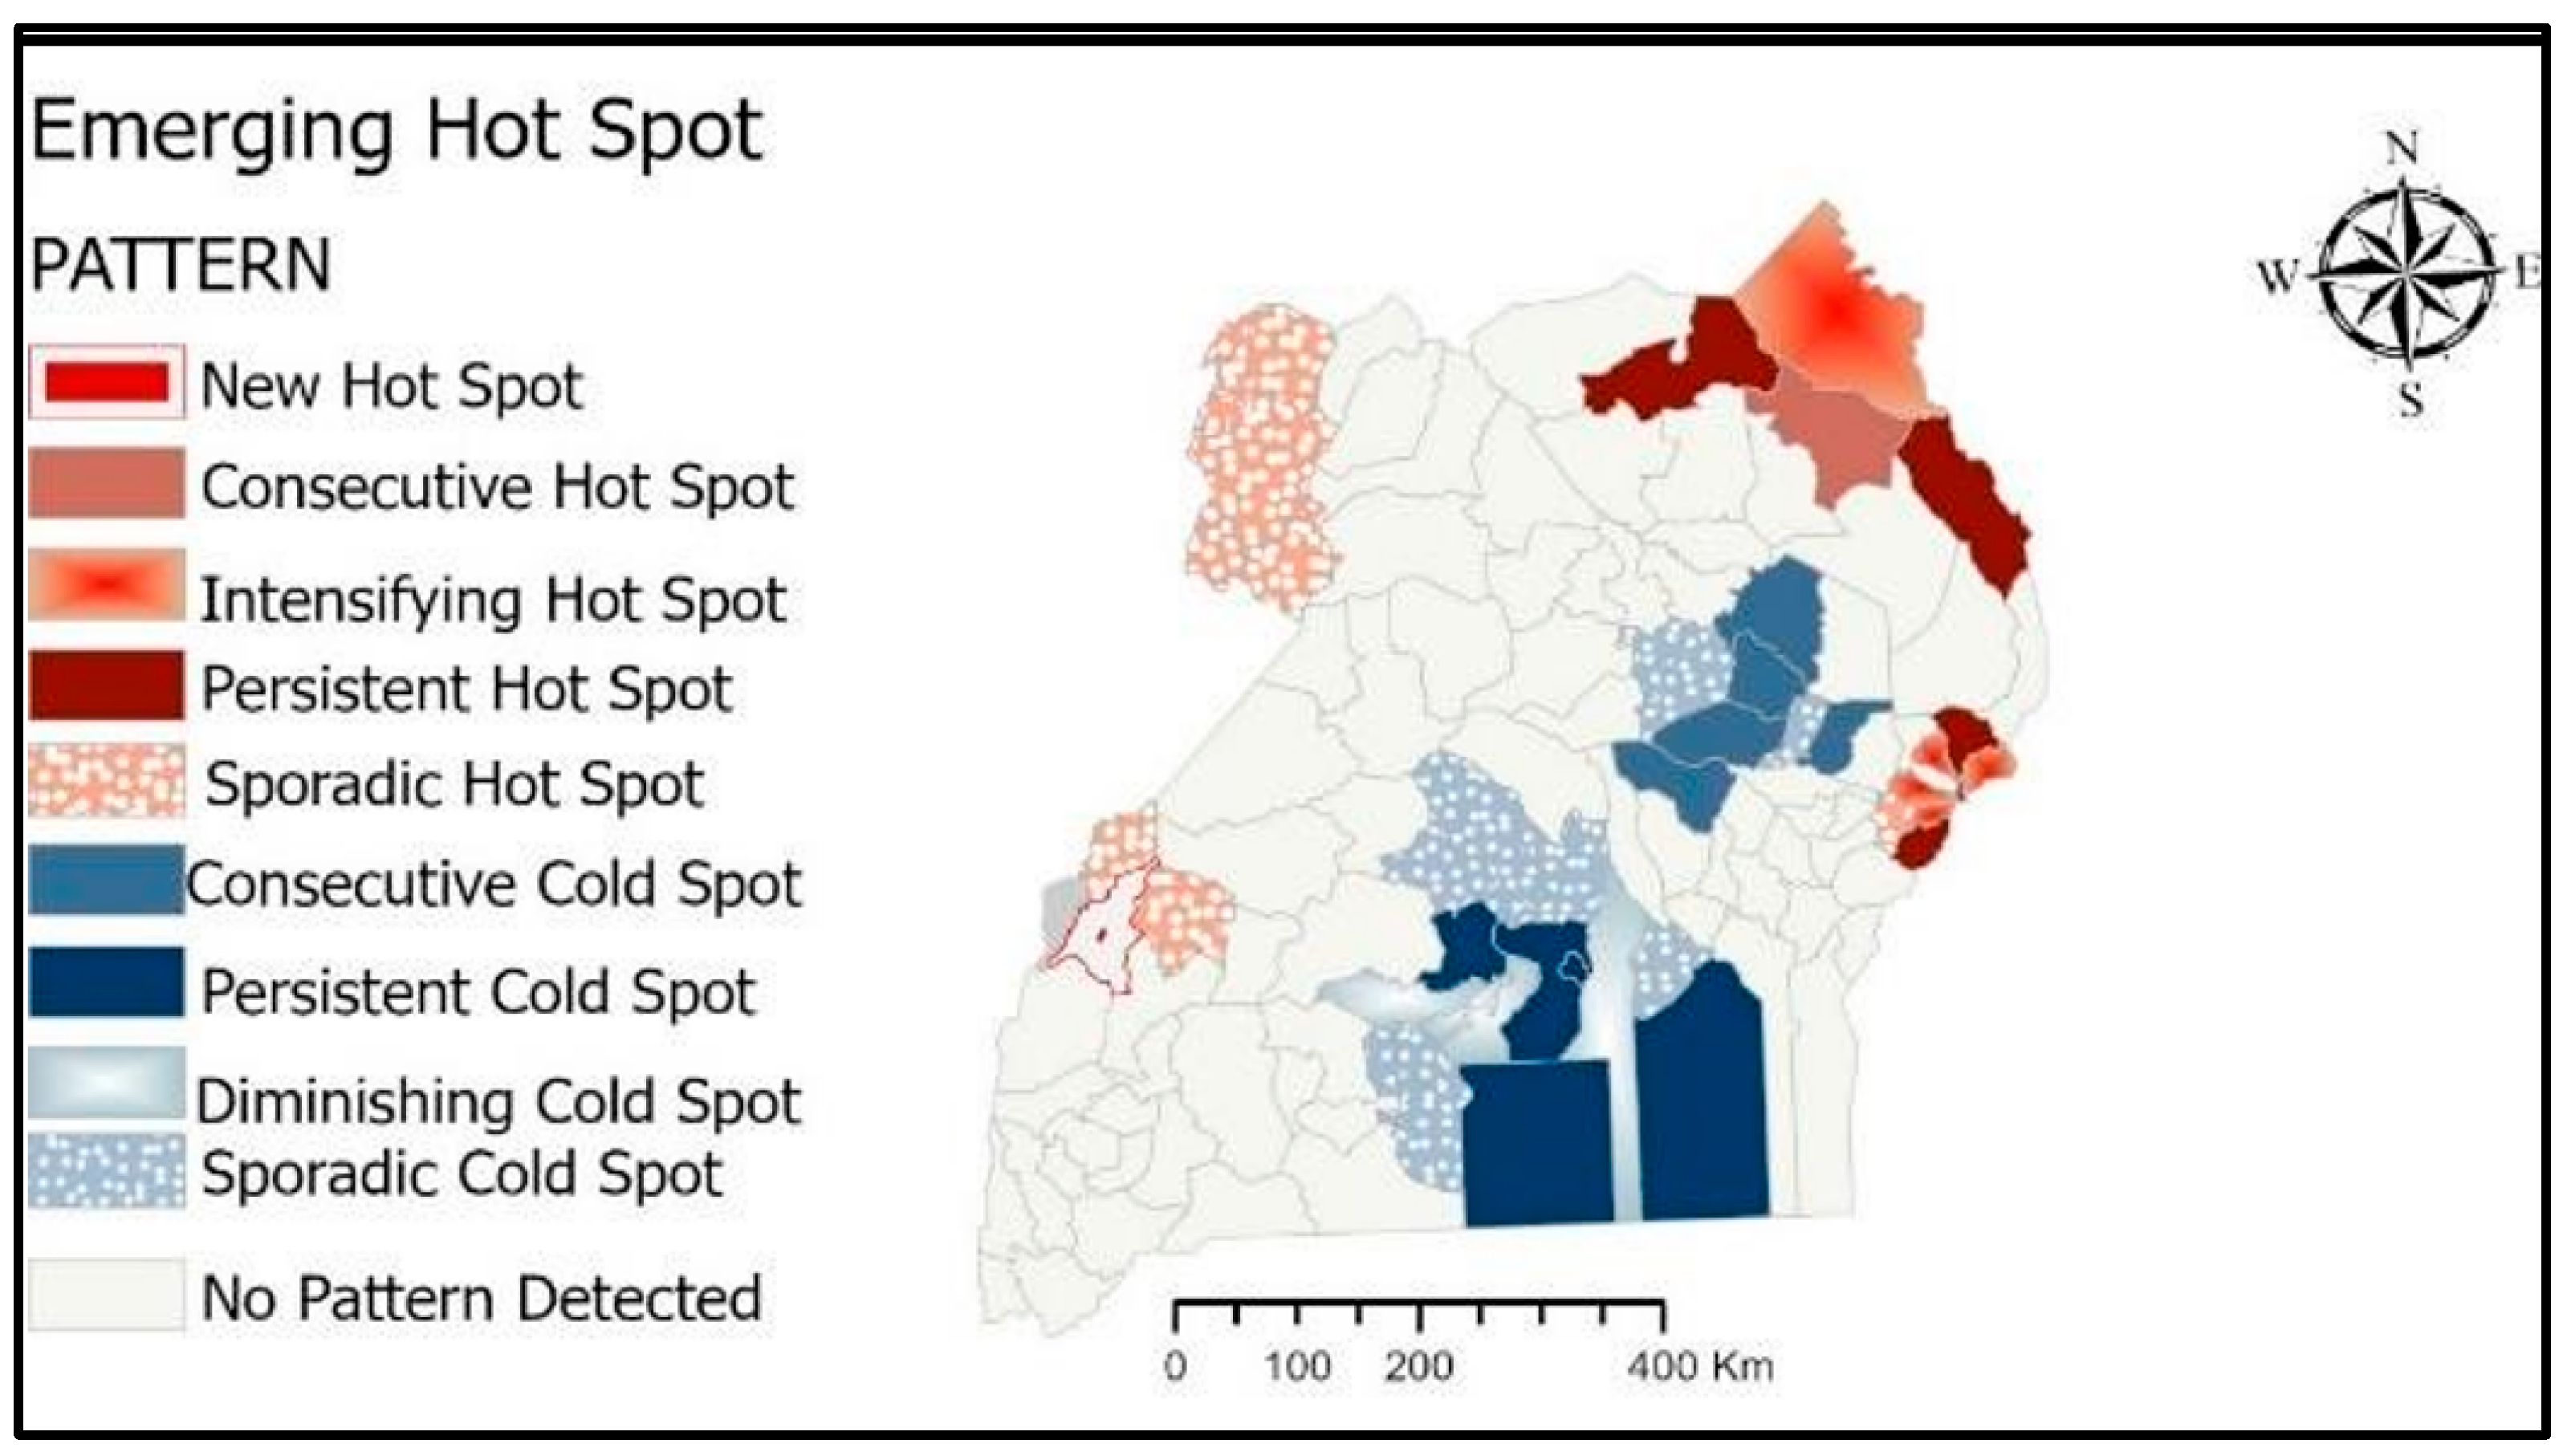
4.3. Cluster and Hot-Spots Analysis

From Figure 3, three core zones are feasible, namely; the region that confirms dispersed patterns or no spatial autocorrelation (z-scores < −1.645), the area of inconclusiveness (−1.645 < z-scores < 1.645), and the zone with z-scores > 1.645 which indicates the presence of cluster patterns or spatial autocorrelation. In addition, from Figure 3, the Moran’s I index’s z-score of 6.60, which is highly statistically significant (p-values < 0.01), indicates that we should reject the null hypothesis of no spatial autocorrelation since there is less than 1% likelihood that the clustered pattern could have been a result of random chance. Since the hypothesis of no spatial autocorrelation was rejected, then it was prudent to examine the locations and the nature of the clustered patterns as well as identify the possibility of hot and cold spots or epicenters of undernutrition in Uganda, as indicated in Figure 4.
Further analysis, indicated in Figure 4, reveals that most areas had non-significant cluster patterns even at a 10% level of statistical significance. Four epicenters of undernutrition among children below five years of age were identified as the Karamoja region (North Eastern Uganda), the West Nile region (North Western Uganda), the Toro region (Western Uganda), and some parts of the Sebei region (Eastern Uganda).
Areas of cold spot cluster patterns were mostly around the Lake Victoria basin, which is also known as the Buganda region. In this study, it was important to note that hotspot clusters imply clusters with significantly high values of undernutrition, while cold spot clusters imply clusters with significantly low values of undernutrition. Conceptually a hotspot does not automatically mean that we have high values, just as a cold spot does not automatically mean an area with low values. It is possible to have an area with low values marked as a hotspot as long its neighborhood is conceptually having high values with reference to the entire study area. Likewise, it is possible to have an area with high values marked as a cold spot as long its neighborhood is conceptually having low values with reference to the entire study area. It was thus necessary to test, via optimization and outlier analysis, for the possibility of outliers within the clusters, both hot and cold spots, as indicated in Figure 5.
A deeper analysis was conducted using optimized outlier analysis, and it helped to scan within the identified cluster patterns for possible outliers. What was interesting was identifying low-value outliers within hotspots or high-value outliers within cold spot clusters. Accordingly, within the central region, Luwero was identified as an outlier, with a high-value location within a cold spot. Likewise, Arua city was identified as a low–high outlier since it was a low-value location within a hotspot cluster; Kween and Bukwo districts were also identified as low–high-value outliers within the Sebei hotspot cluster.

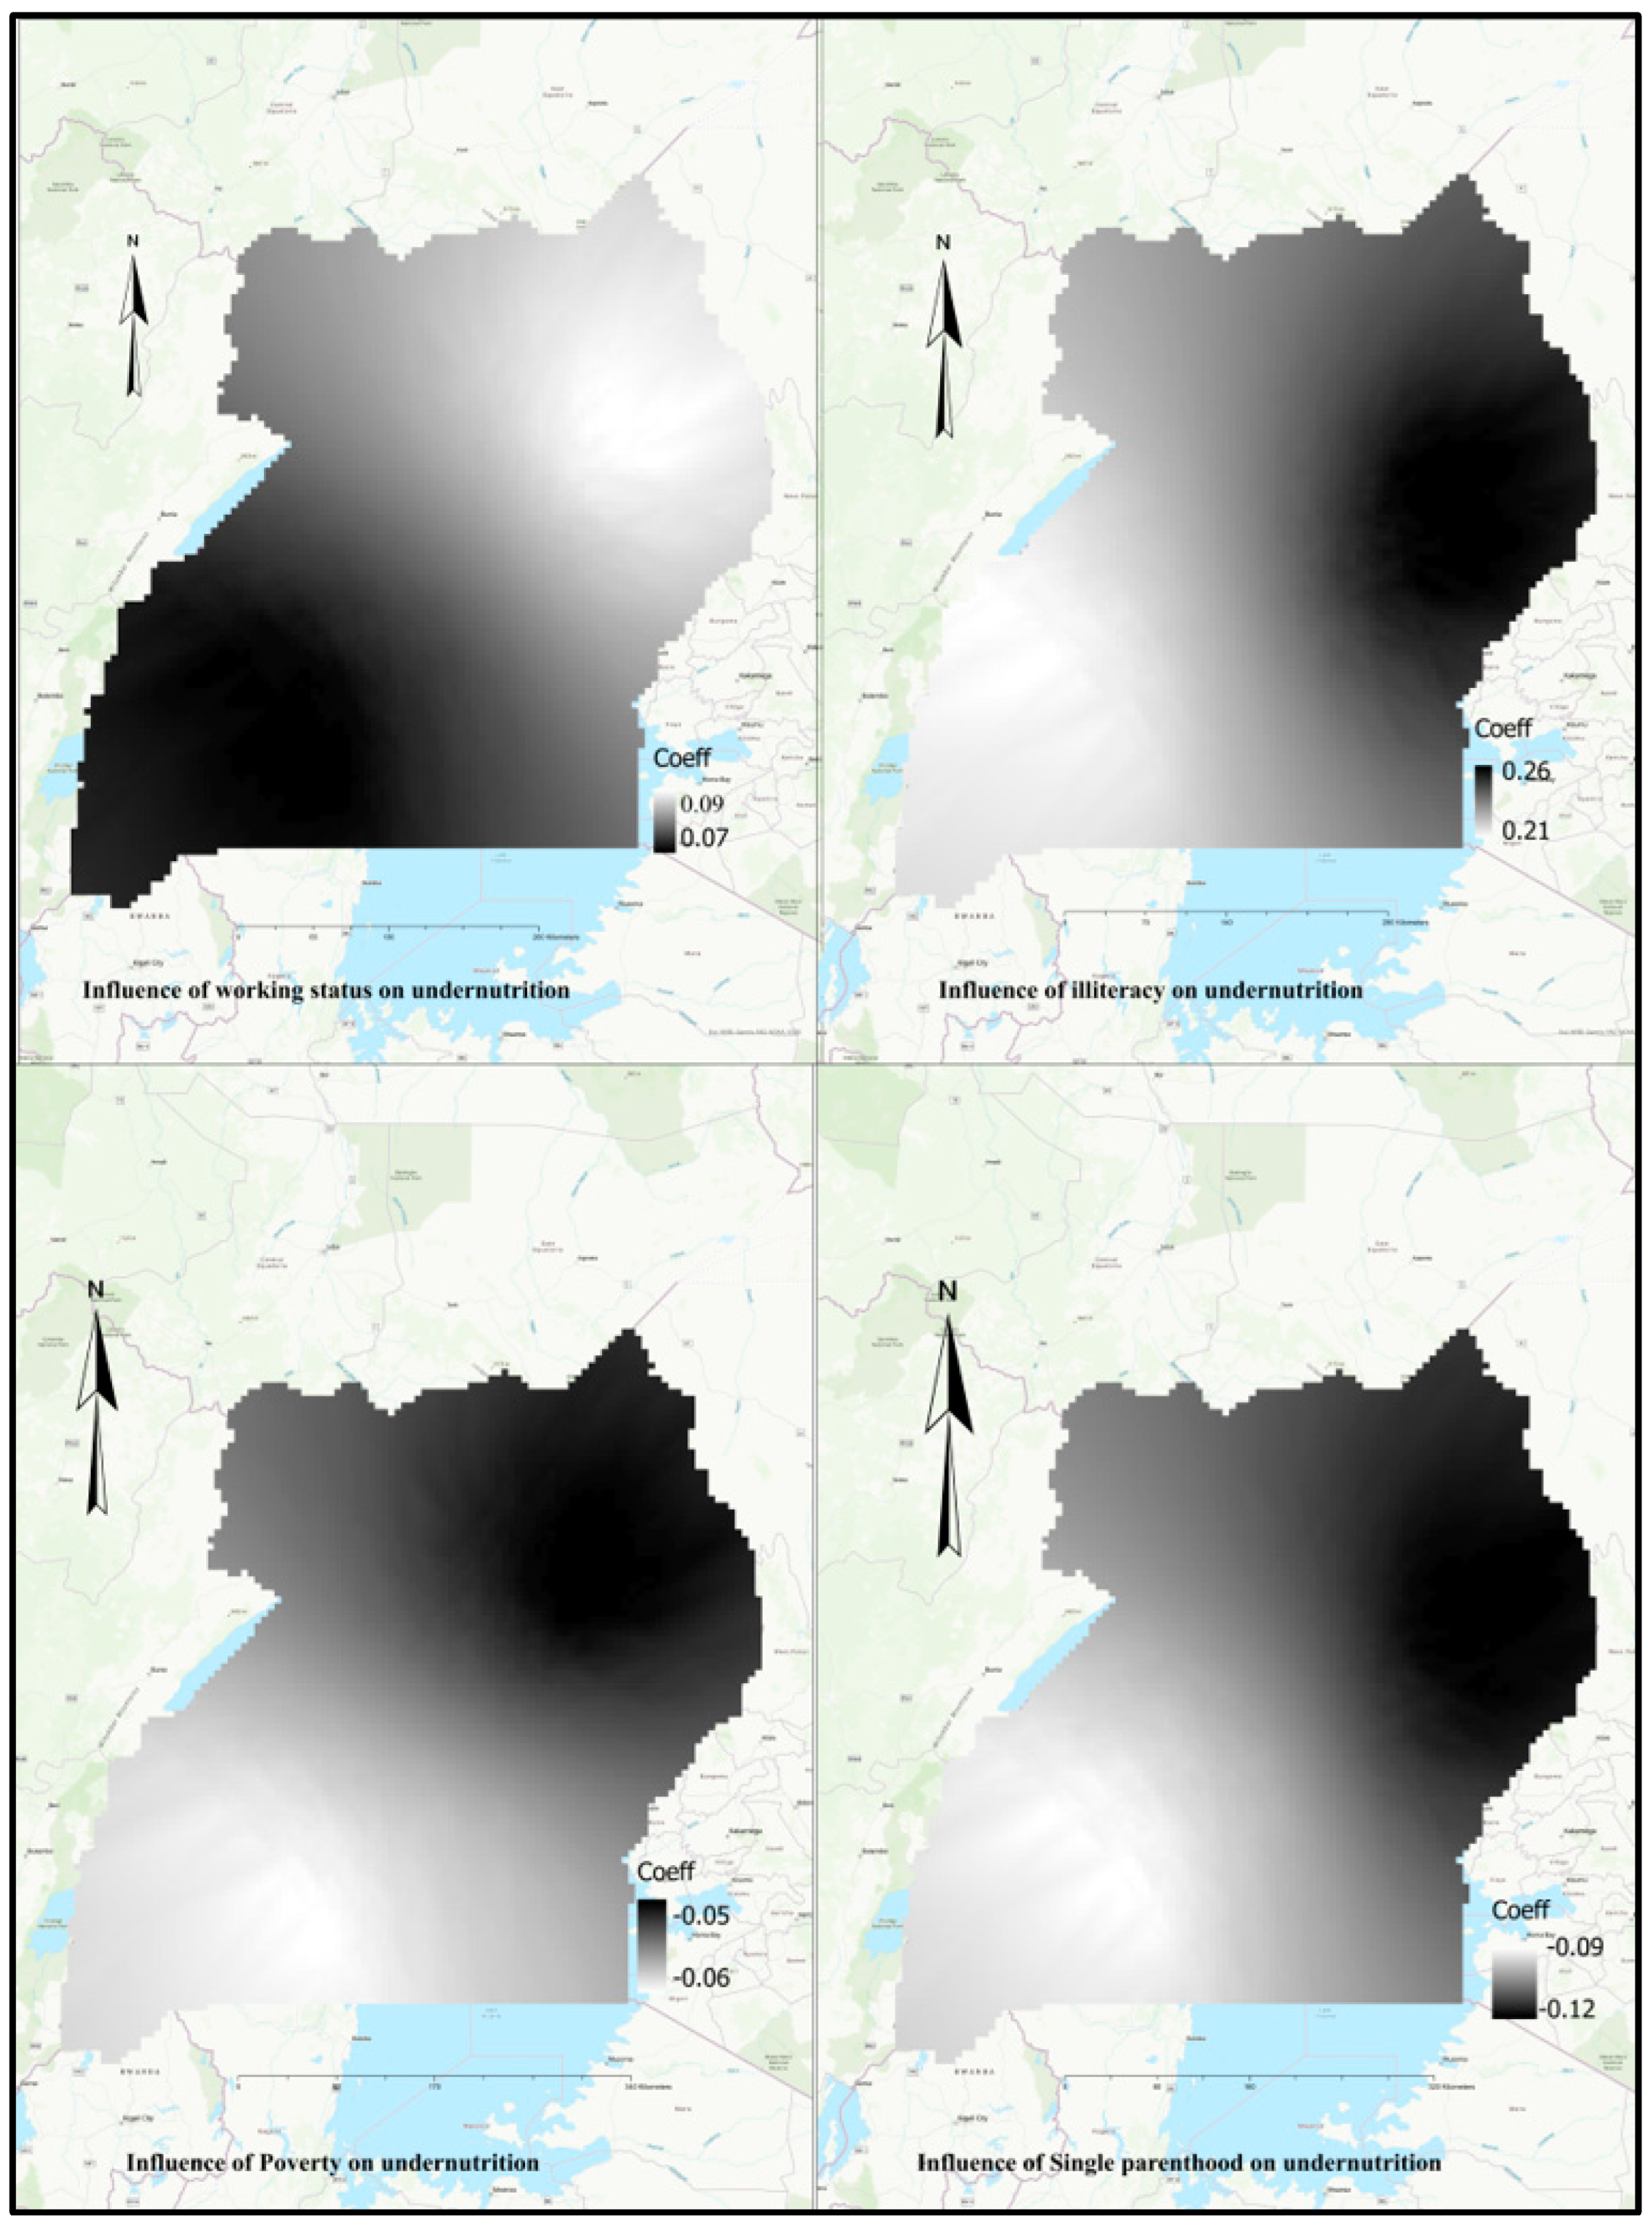
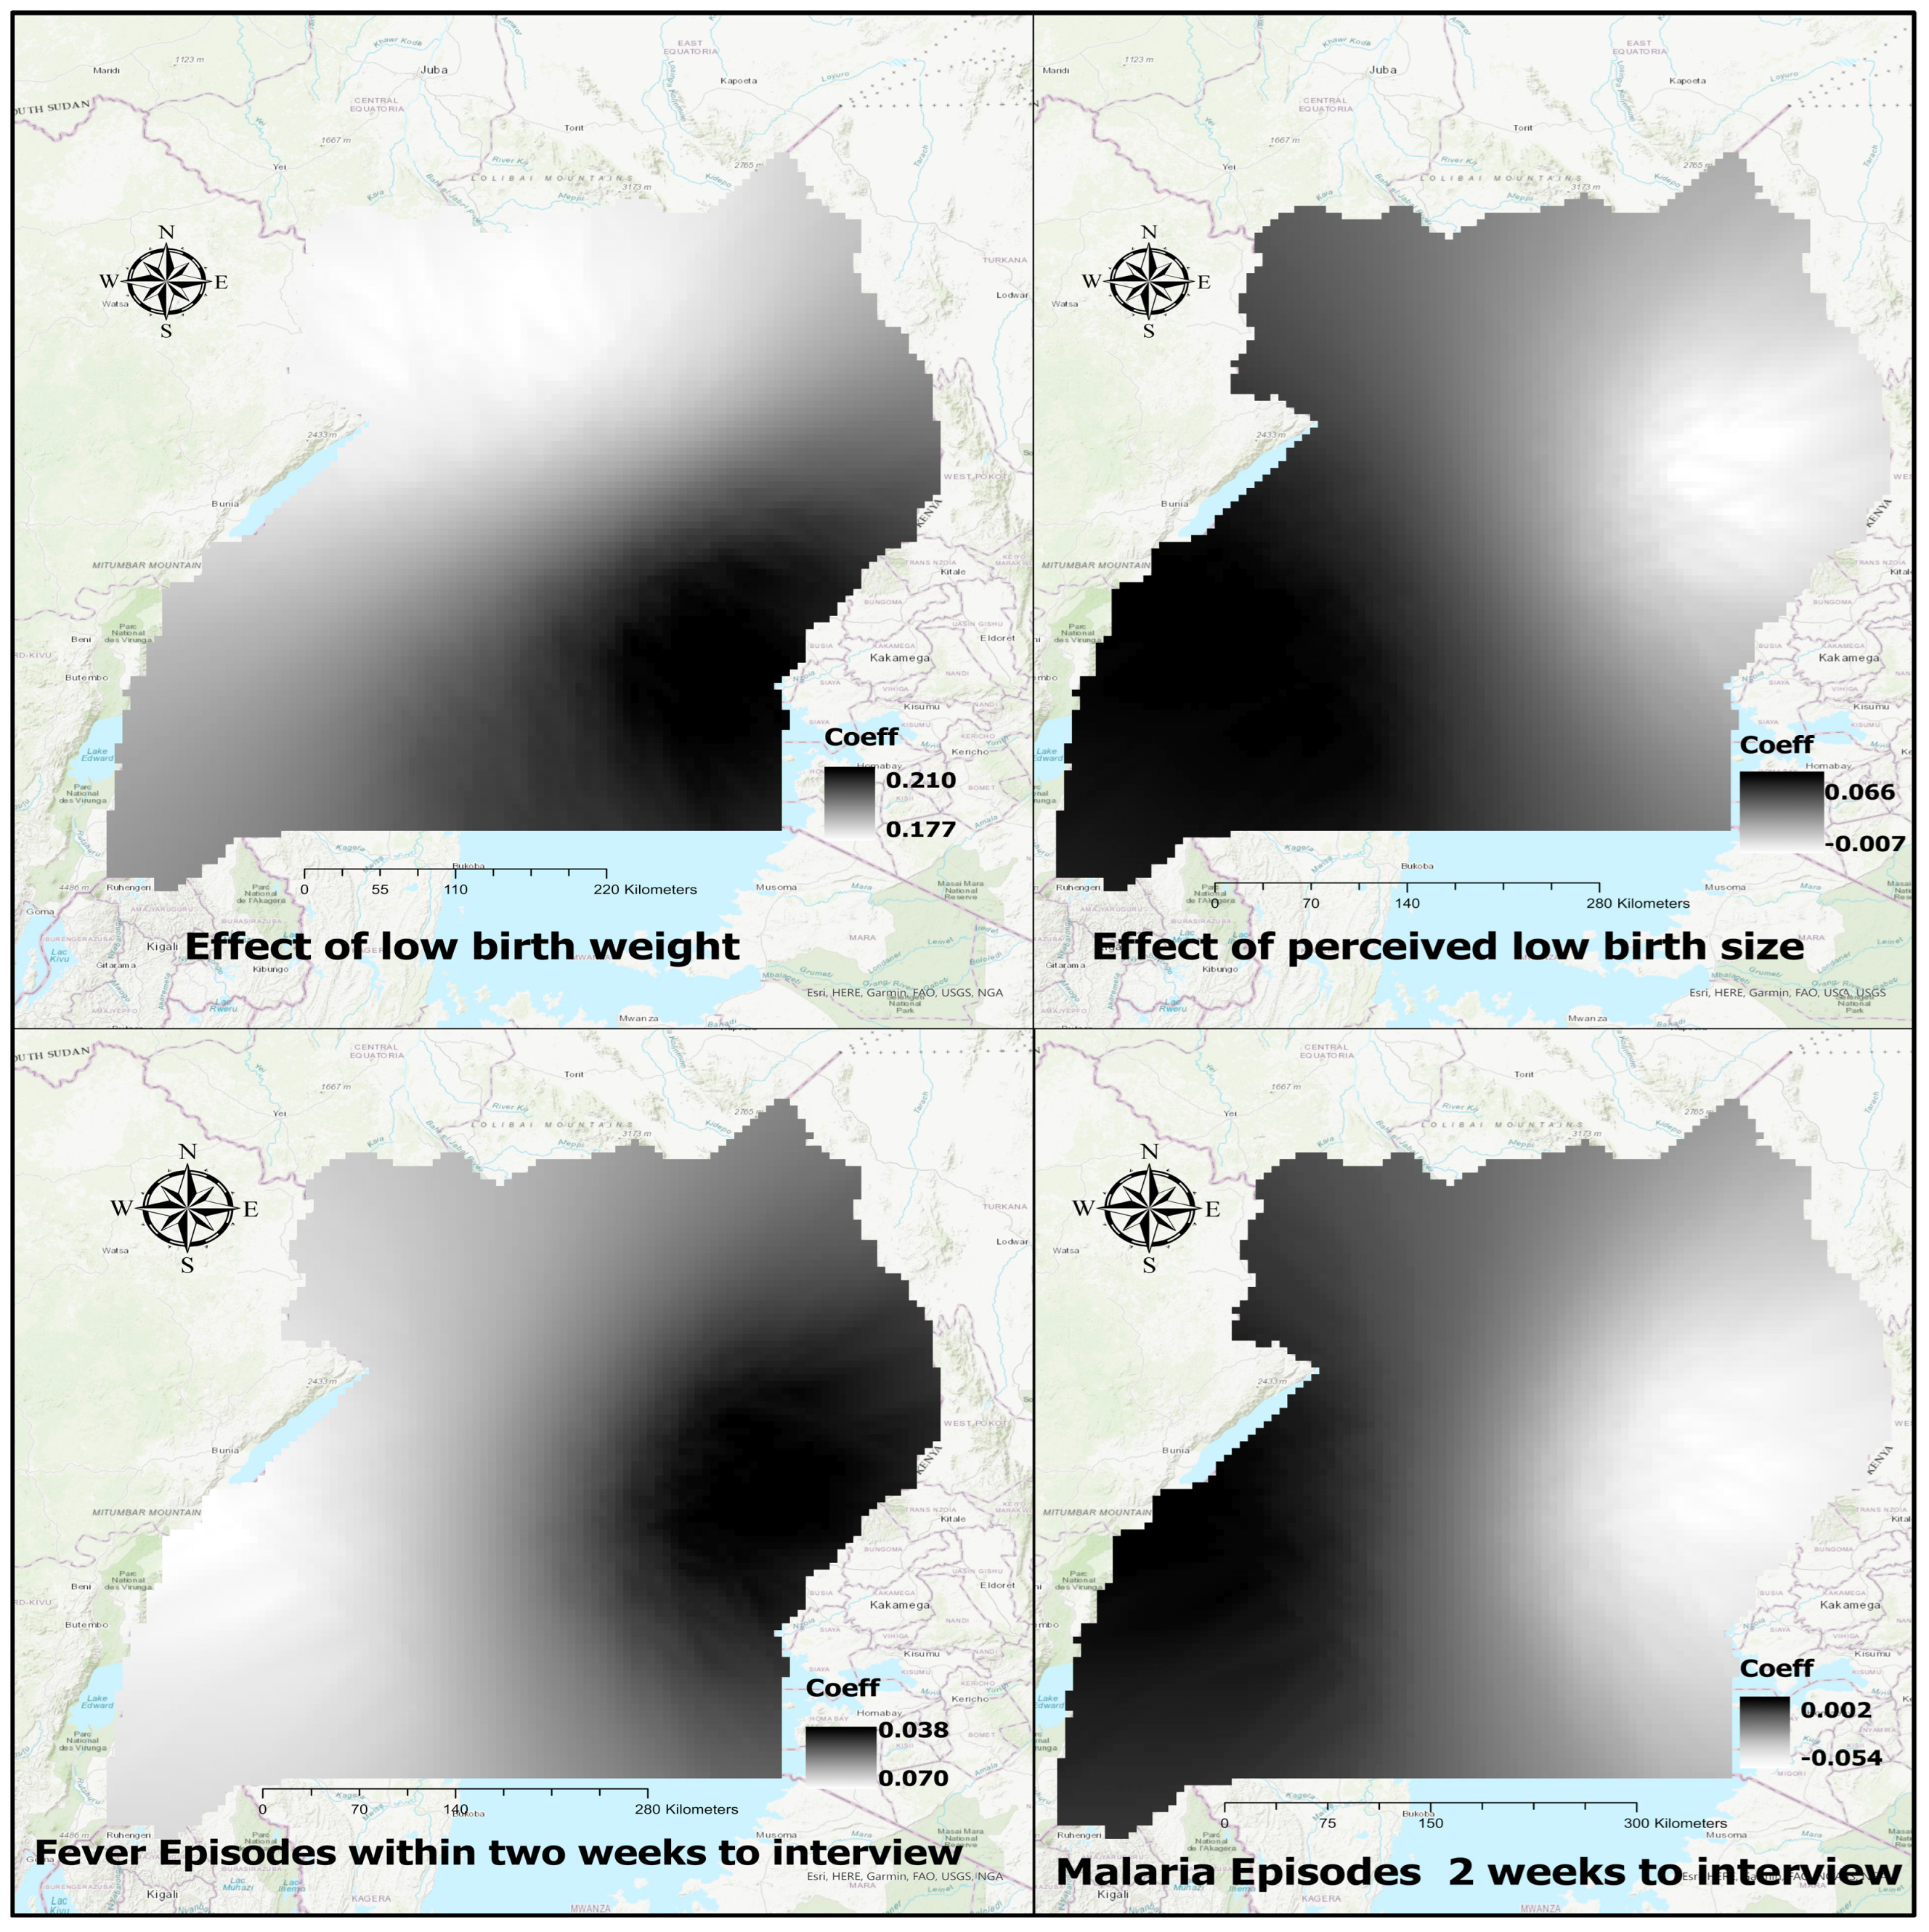
4.4. Geographically Weighted Regression Analysis

The revelation of clustered patterns of the prevalence of undernutrition among children below five years of age in Uganda necessitated an analysis approach that considers spatial or geographical effects. The Geographically Weighted Regression (GWR) modeling approach is an extension of ordinary least squares regression (OLS) and adds a level of modeling complexity by allowing the relationships between the independent and dependent variables to vary by locality. With GWR, the estimated model for an entire area is able to address local variations [21]. In this study, GWR was employed with two aims; prediction of future values and identifying factors that mostly influence the prevalence of undernutrition outcomes as displayed in Figure 6. The hypothesis tested here was based on the assumption that risk factors, for example, illiteracy rate, had the same spatial effect on the prevalence of undernutrition among children below five years of age across the country. The results are presented in Figure 6, Figure 7 and Figure 8.
Comparing the spatial map of predicted rates (Figure 6) with the spatial map of observed values (Figure 2) shows much closeness as far as the observed or real prevalence rates and the predicted prevalence rates of undernutrition among children below five years of age in Uganda was concerned. The prevalence of undernutrition was predicted to be very high in the North Eastern parts of Uganda, the West Nile, and the Toro regions, which shows great similarity with the observation made in Figure 2.
The variables entered in the GWR model included poverty (wealth Quintile I and II), illiteracy levels, prevalence of single parenthood, Percentage of Working, Low Birth Weight and Size, no toilet facilities, home delivery, number of antenatal visits, episodes of fever and diarrhea within two weeks preceding the interview. Multiple GWR models were generated, one for each location, together with the coefficients for each independent variable within each model. Model diagnostics were performed with an Adjusted R-squared of 0.67, indicating that about 67% of the variations in undernutrition across Uganda can be explained by the variations in the explanatory variables entered in the GWR model. The effect of each explanatory variable on undernutrition across the country varied from location to location, as indicated in Figure 6, Figure 7 and Figure 8 below.
Figure 6. Effects of environmental factors on undernutrition.
Sustainability 15 14872 g006
Figure 6 presented three of the environmental factors which, among others, emerged to have a significant spatial influence on the prevalence of undernutrition across the country. The map shows the distribution of the prediction of the prevalence rates of undernutrition in Uganda as per the results of the GWR model. Home delivery, number of antenatal visits (percentage with less than four visits), and absence of improved toilet facilities were among the environmental factors that were spatially significant. The dark the area on the map, the stronger the influence of the given factor. Hence, the effect of home delivery on undernutrition was positively stronger around the Eastern and South Eastern part of the country, antenatal visits (less than four visits) was positively stronger within the Eastern region, while the absence of toilet facilities strongly and positively influenced undernutrition within the Karamoja region.
Figure 7. Effects of child level factors on household and environmental factors.
Sustainability 15 14872 g007
The effect of household-level factors was also analyzed as well. Four factors among environmental factors were entered into the GWR model, and results were successfully returned. The working status of the mothers, poverty (percentage of households within the first and second wealth quintiles), the prevalence of illiteracy, and single parenthood (single mothers) were successfully analyzed. The results displayed in Figure 7 indicate that poverty, single motherhood, and working status at the time of the interview strongly influenced undernutrition within the Karamoja region, while illiteracy was strong within the South Western region of Uganda.
Figure 8. Effects of child level or immediate factors on undernutrition.
Sustainability 15 14872 g008
Child-level factors are among the factors that are immediate within the hierarchy of the risk factors of undernutrition. Malaria and diarrhea episodes within two weeks preceding the interview were hypothesized to cause undernutrition among the under-fives. Other immediate level factors examined in this study included the percentage of low birth weight and the percentage of low birth size of children across the country. According to the results shown in Figure 8, low birth weight strongly influenced undernutrition among under-fives within the South Eastern (Sebei) part of the country, malaria episodes and low birth sizes strongly influenced undernutrition among under-fives within the Kigezi region while diarrhea episodes were strongly influenced the under-fives undernutrition within both the Eastern and Karamoja regions, respectively.
Thus far, this study has concentrated on cross-sections or a point in time events in examining undernutrition in Uganda. Spatial variations across the country would tell the situation at a point in time, but there was a need to complete the picture by looking at what had been transpiring over time. A deep dive into space and time helped in examining the evolution of the prevalence of undernutrition over time and also helped to identify areas of emerging hot spots or cold spot patterns. Space-time cubes were analyzed with three-dimensional (3D) methods. The cubes present a series of time step intervals spanning 1989–2016, while variations in undernutrition were presented for each time step interval for different locations over time, as indicated in Figure 9. In this particular study, the locations were the administrative districts of Uganda as of 2016. As such, each cube is plotted for a series of time spans for a particular district in Uganda.
Furthermore, the results in Figure 9 reveal that some locations (districts or regions) have been victims of undernutrition for a long time. For example, most areas within the Karamoja region reflected cubes with higher and unpleasant values most of the time. Most areas of the western part of the country reflected cubes with high values, while most parts of central Uganda had alternating high and low prevalence across time. For the most recent time step, most areas were exhibiting low prevalence, as indicated by green slices on top of the cubes. A deep dive into space and time makes it possible to establish and test the direction and significance of the overall trend statistic for the whole time scope (1990 to 2016). Accordingly, the resultant statistic showed a statistically significant (p-value = 0.05) decreasing trend of 4.7 across the study area.
Each space-time cube is characterized by slices, with alternating colors that reflect the prevalence of undernutrition for a particular time span. The alternating time spans of high and low values across space and over time do not reveal much information that can guide policy interventions. Examining cluster patterns across space and time revealed great information that is key in designing timely and location-specific interventions. As a result, an emerging hotspot analysis was executed, as indicated by the results in Figure 10. The emerging hotspot analysis revealed one new, five intensifying, four persistent, and nine sporadic hot spot areas.
From Figure 10, it can be observed that at least 90 percent of the time, the Karamoja Sebei regions have been with hotspot areas with either intensifying (at least 90% of the time step intervals are hot and becoming hotter over time), consecutive (a single uninterrupted run of hot time step intervals, comprised of less than 90% of all time step intervals) or persistent (at least 90% of the time step intervals are hot, with no trend up or down hotspots). West Nile region was established to be a sporadic hot spot area implying that some of the time step intervals were hot while others were cold. The results also reveal that the Toro region is emerging as a hotspot area with sporadic hotspots in the neighborhood of the new hotspot area. Most parts of the central parts around Lake Victoria and the Bugisu regions had either sporadic, diminishing, or persistent cold spots. No clear patterns were identified within the Ankole region, some Eastern regions, and most regions within Northern Uganda. Kisoro and Kabale districts in the Kigezi regions were identified as high location values within a region that was initially identified as a non-significant hot spot cluster.
To confirm the presence or absence of homogeneity of cluster patterns within the identified emerging hot or cold spots, an optimized outlier analysis was conducted (Figure 11). The most significant result revealed by the optimized outlier analysis was the existence of low values around the Sebei region hotspot and a cluster of high values within the Kigezi region. The rest of the study area had no statistically significant or detectable outliers. It is important to note that the shape file of the 2014 districts of Uganda was used for this analysis because the sampling frame of the 2016 Uganda Demographic and Health Survey was based on the sampling frame of the 2014 Uganda national housing and population census.

5. Discussion of the Results

This study examined the undernutrition problem among children below five years of age based on Ugandan data as a case. The idea of calculating a composite index of anthropometric failure as a proxy of undernutrition was adopted. Consequently, the number of children with at least one undernutrition outcome was revealed as 31.96 percent. The prevalence rate of 31.96 is close but higher than the disaggregated values indicated in the Uganda Demographic and Health Survey [22], whereby the prevalence of stunting, underweight, and wasting were 29, 11, and 4 percent, respectively. The current findings reflect the reality that about 32 percent of children below five years of age in Uganda suffer from at least one of the three outcomes of undernutrition, a statistic that calls for the policymakers to move faster than usual in dealing with the problem.
The study also reveals that the prevalence of undernutrition among children below five years of age in Uganda varied from location to location, with some areas having significantly high prevalence rates while others had significantly low prevalence rates. Results also revealed cases of spatial autocorrelation that was confirmed by clustered patterns, revealing significant hot and cold spots. The current study confirms the findings of the study in Haiti that undernutrition occurs in clusters rather than being evenly distributed throughout the study area [19]. Similar to the study conducted in Ethiopia, the spatial analysis revealed that women’s undernutrition varied across the country, with significant hotspots of maternal undernutrition [23]. More so, significant spatial variations in the prevalence of undernutrition among children below five years of age were also evident from the analysis that was based on the 2016 Ethiopian Demographic and Health Survey in Ethiopia [24], and this indicates that whether young or old, geographical location matters as far as undernutrition is concerned. Many other studies [18,20,25,26,27,28] conducted across the globe also confirm that variations in the prevalence of undernutrition across geographical areas do exist and that the prevalence rates tend to cluster into hotspot and cold spot patterns.
The results of this study also revealed variations in the strength of influence of the risk factors on undernutrition. Different risk factors influenced the prevalence of undernutrition among the <5 s with different intensities across the country. Similar to the results of this study, the literature shows that having unimproved toilet facilities and illiteracy rates for mothers and their partners were among the geographically weighted significant factors of undernutrition in Ethiopia [28]. Poor wealth index, longer distance to the health center, and low education levels could increase the utilization of antenatal care services [29], yet in thias study, low utilization of antenatal care services was a significant predictor of undernutrition of <5 s in Uganda. Spatial diversity and geographic variation influence the distribution patterns and the strength of the risk factors of undernutrition among <5 s [30]. More so, similar to the results of this study, significant determinants of childhood malnutrition ranged from socio-demographic factors to child and maternal factors in the Democratic Republic of Congo [31].
Spatiotemporal analysis was another aspect analyzed in this study, and the results indicated a significant negative trend which implied a decline in undernutrition prevalence over time. A similar decline was found in a study done in South Africa found a decline in the prevalence rate from 11% to 7.6% from 2008 to 2017 [32]. The results of emerging hotspot analysis indicated some areas which were historically and continued to have high prevalence rates, while others revealed sporadic, intensifying, persistent hotspots, and yet others revealed emerging hotspots. Significant spatial and temporal effects on childhood undernutrition (stunting, to be specific) in the Democratic Republic of Congo [31]. Not much literature was found on the concepts of emerging hotspot analysis. However, a similar approach was used to assess the current and future hotspots of hunger in sub-Saharan Africa [33], and thus this would mark the being of such kind analysis in undernutrition research.

6. Conclusions

This paper aimed to analyze undernutrition among children below five years of age in Uganda. It relied on the CIAF as a composite index of undernutrition as a proxy to undernutrition to estimate the prevalence rates. Examination of the undernutrition phenomenon was then done using spatial and spatiotemporal approaches. At 31.96 percent, the prevalence rate of undernutrition among <5 s is very high and unpleasant. The distribution across the country is non-uniform with some areas such as the Karamoja, the west Nile, the Sebei, and Toro regions being hotspots of undernutrition. Over time, the same areas have experienced high undernutrition prevalence in Uganda. The results revealed that the factors that influence undernutrition are regional and location-specific. Policymakers and policy implementers should therefore bear in mind the spatial variations in undernutrition across the country and prioritize hotspot areas in order to have efficient, timely, and region-specific interventions. It is also crucial to pay attention to the specific factors that influence undernutrition in different regions. This will help in designing timely, relevant and region-specific interventions to the problem of undernutrition in Uganda and the world at large.

Author Contributions

Conceptualization, V.N.M. and L.K.A.; Supervision, P.C.R. All authors have read and agreed to the published version of the manuscript.

Funding

This research received no external funding.

Institutional Review Board Statement

Not applicable.

Informed Consent Statement

Informed consent to collect data on children was given by parents or care takers of the children.

Data Availability Statement

Not applicable.

Acknowledgments

The authors are grateful to World Bank for having provided the financial support for their PhD studies. More thanks go to the African Center of Excellence in Data Science (ACE-DS), School of Economics, Gikondo campus, University of Rwanda for providing an enabling environment. The authors are equally thankful to the DHS programme for granting them permission and access to the UDHS data, which made this manuscript possible.

Conflicts of Interest

The authors declare no conflict of interest.

References

  1. Jith, J.R.; Bedamatta, R. Child Undernutrition in the States of India: An Analysis Based on Change in Composite Index of Anthropometric Failure from 2006 to 2016. Rev. Dev. Change 2021, 26, 104–126. [Google Scholar] [CrossRef]
  2. Boah, M.; Azupogo, F.; Amporfro, D.A.; Abada, L.A. The epidemiology of undernutrition and its determinants in children under five years in Ghana. PLoS ONE 2019, 14, e0219665. [Google Scholar] [CrossRef]
  3. Luzingu, J.K.; Stroupe, N.; Alaofe, H.; Jacobs, E.; Ernst, K. Risk factors associated with under-five stunting, wasting, and underweight in four provinces of the Democratic Republic of Congo: Analysis of the ASSP project baseline data. BMC Public Health 2022, 22, 2422. [Google Scholar] [CrossRef] [PubMed]
  4. Vaivada, T.; Akseer, N.; Akseer, S.; Somaskandan, A.; Stefopulos, M.; Bhutta, Z.A. Stunting in childhood: An overview of global burden, trends, determinants, and drivers of decline. Am. J. Clin. Nutr. 2020, 112, 777S–791S. [Google Scholar] [CrossRef]
  5. World Health Organization. Global Nutrition Targets 2025: Stunting Policy Brief; World Health Organization: Geneva, Switzerland, 2014. [Google Scholar]
  6. Rah, J.H.; Cronin, A.A.; Badgaiyan, B.; Aguayo, V.M.; Coates, S.; Ahmed, S. Household sanitation and personal hygiene practices are associated with child stunting in rural India: A cross-sectional analysis of surveys. BMJ Open 2015, 5, e005180. [Google Scholar] [CrossRef]
  7. Soekatri, M.Y.E.; Sandjaja, S.; Syauqy, A. Stunting was associated with reported morbidity, parental education and socioeconomic status in 0.5–12-year-old Indonesian children. Int. J. Environ. Res. Public Health 2020, 17, 6204. [Google Scholar] [CrossRef]
  8. Thompson, A.L. Greater male vulnerability to stunting? Evaluating sex differences in growth, pathways and biocultural mechanisms. Ann. Hum. Biol. 2021, 48, 466–473. [Google Scholar] [CrossRef] [PubMed]
  9. Roba, A.A.; Assefa, N.; Dessie, Y.; Tolera, A.; Teji, K.; Elena, H.; Bliznashka, L.; Fawzi, W. Prevalence and determinants of concurrent wasting and stunting and other indicators of malnutrition among children 6–59 months old in Kersa, Ethiopia. Matern. Child Nutr. 2021, 17, e13172. [Google Scholar] [CrossRef]
  10. Prendergast, A.J.; Humphrey, J.H. The stunting syndrome in developing countries. Paediatr. Int. Child Health 2014, 34, 250–265. [Google Scholar] [CrossRef]
  11. Darteh, E.K.M.; Acquah, E.; Kumi-Kyereme, A. Correlates of stunting among children in Ghana. BMC Public Health 2014, 14, 504. [Google Scholar] [CrossRef]
  12. Vonaesch, P.; Tondeur, L.; Breurec, S.; Bata, P.; Nguyen, L.B.L.; Frank, T.; Farra, A.; Rafaï, C.; Giles-Vernick, T.; Gody, J.C. Factors associated with stunting in healthy children aged 5 years and less living in Bangui (RCA). PLoS ONE 2017, 12, e0182363. [Google Scholar] [CrossRef] [PubMed]
  13. Shrestha, M.L.; Perry, K.E.; Thapa, B.; Adhikari, R.P.; Weissman, A. Malnutrition matters: Association of stunting and underweight with early childhood development indicators in Nepal. Matern. Child Nutr. 2022, 18, e13321. [Google Scholar] [CrossRef] [PubMed]
  14. Kirolos, A.; Blacow, R.M.; Parajuli, A.; Welton, N.J.; Khanna, A.; Allen, S.J.; McAllister, D.A.; Campbell, H.; Nair, H. The impact of childhood malnutrition on mortality from pneumonia: A systematic review and network meta-analysis. BMJ Glob. Health 2021, 6, e007411. [Google Scholar] [CrossRef] [PubMed]
  15. Gribble, J.N.; Murray, N.J.; Menotti, E.P. Reconsidering childhood undernutrition: Can birth spacing make a difference? An analysis of the 2002-2003 El Salvador National Family Health Survey. Matern. Child Nutr. 2009, 5, 49–63. [Google Scholar] [CrossRef]
  16. Khan, A.Y.; Fatima, K.; Ali, M. Sanitation ladder and undernutrition among under-five children in Pakistan. Environ. Sci. Pollut. Res. Int. 2021, 28, 38749–38763. [Google Scholar] [CrossRef]
  17. United Nations. Department of Economic and Social Affairs, Sustainable Development Goals; United Nations Department of Economic and Social Affairs: New York, NY, USA, 2015. [Google Scholar]
  18. Alemu, Z.A.; Ahmed, A.A.; Yalew, A.W.; Birhanu, B.S. Non random distribution of child undernutrition in Ethiopia: Spatial analysis from the 2011 Ethiopia demographic and health survey. Int. J. Equity Health 2016, 15, 198. [Google Scholar] [CrossRef]
  19. Spray, A.L.; Eddy, B.; Hipp, J.A.; Iannotti, L. Spatial analysis of undernutrition of children in léogâne commune, haiti. Food Nutr. Bull. 2013, 34, 444–461. [Google Scholar] [CrossRef]
  20. Maniragaba, V.N.; Atuhaire, L.K.; Rutayisire, P.C. Undernutrition among the children below five years of age in Uganda: A spatial analysis approach. BMC Public Health 2023, 23, 390. [Google Scholar] [CrossRef]
  21. Marie-Pierre de Bellefon, J.-M.F. Geographically Weighted Regression. In Handbook of Spatial Analysis: Theory and Application with R; Insee: Paris, France, 2018. [Google Scholar]
  22. UBOS. Uganda Demographic and Health Survey 2016. UDHS. 2016, p. 625. Available online: https://www.dhsprogram.com/ (accessed on 14 May 2023).
  23. Tesema, A.K.; Liyew, A.M.; Alem, A.Z.; Yeshaw, Y.; Tesema, G.A.; Teshale, A.B. Spatial distribution and determinants of undernutrition among reproductive age women of Ethiopia: A multilevel analysis. PLoS ONE 2021, 16, e0257664. [Google Scholar] [CrossRef]
  24. Tamir, T.T.; Techane, M.A.; Dessie, M.T.; Atalell, K.A. Applied nutritional investigation spatial variation and determinants of stunting among children aged less than 5 y in Ethiopia: A spatial and multilevel analysis of Ethiopian Demographic and Health Survey 2019. Nutrition 2022, 103–104, 111786. [Google Scholar] [CrossRef]
  25. Amir-ud-Din, R.; Fawad, S.; Naz, L.; Zafar, S.; Kumar, R.; Pongpanich, S. Nutritional inequalities among under-five children: A geospatial analysis of hotspots and cold spots in 73 low- and middle-income countries. Int. J. Equity Health 2022, 21, 135. [Google Scholar] [CrossRef] [PubMed]
  26. Khan, J.; Mohanty, S.K. Spatial heterogeneity and correlates of child malnutrition in districts of India. BMC Public Health 2018, 18, 1027. [Google Scholar] [CrossRef] [PubMed]
  27. Amusa, L.B.; Yahya, W.B.; Bengesai, A.V. Spatial variations and determinants of malnutrition among under-five children in Nigeria: A population-based cross-sectional study. PLoS ONE 2023, 18, e0284270. [Google Scholar] [CrossRef] [PubMed]
  28. Muche, A.; Melaku, M.S.; Amsalu, E.T.; Adane, M. Using geographically weighted regression analysis to cluster under-nutrition and its predictors among under-five children in Ethiopia: Evidence from demographic and health survey. PLoS ONE 2021, 16, e0248156. [Google Scholar] [CrossRef]
  29. Melaku, M.S.; Aemro, A.; Aychiluhm, S.B.; Muche, A.; Bizuneh, G.K.; Kebede, S.D. Geographical variation and predictors of zero utilization for a standard maternal continuum of care among women in Ethiopia: A spatial and geographically weighted regression analysis. BMC Pregnancy Childbirth 2022, 22, 76. [Google Scholar] [CrossRef] [PubMed]
  30. Anismuslim, M.; Pramoedyo, H.; Andarini, S.; Sudarto. Modeling of Risk Factors of Childhood Stunting Cases in Malang Regency using Geographically Weighted Regression (GWR). Open Public Health J. 2023, 16, e187494452304120. [Google Scholar] [CrossRef]
  31. Mtambo, O.P.L. Spatio-Temporal Analysis of Childhood Malnutrition in Republic of Congo. Int. J. Stat. Appl. 2018, 8, 153–166. [Google Scholar]
  32. Sartorius, B.; Sartorius, K.; Green, R.; Lutge, E.; Scheelbeek, P.; Tanser, F.; Dangour, A.D.; Slotow, R. Spatial-temporal trends and risk factors for undernutrition and obesity among children (<5 years) in South Africa, 2008–2017: Findings from a nationally representative longitudinal panel survey. BMJ Open 2020, 10, e034476. [Google Scholar] [CrossRef]
  33. Liu, J.; Fritz, S.; van Wesenbeeck, C.F.A.; Fuchs, M.; You, L.; Michael Obersteiner, H.Y. A spatially explicit assessment of current and future hotspots of hunger in Sub-Saharan Africa in the context of global change. Glob. Planet. Change 2008, 64, 222–235. [Google Scholar] [CrossRef]
Figure 1. Map of Uganda by 2016 showing the study area.
Sustainability 15 14872 g001
Figure 2. Variation in undernutrition among children below five years of age in Uganda.
Sustainability 15 14872 g002
Figure 3. Moran’s I index for spatial autocorrelation.
Sustainability 15 14872 g003
Figure 4. Map of Uganda showing clustered patterns of hot and cold spots.
Sustainability 15 14872 g004
Figure 5. Map of Uganda indicating cluster outliers within the hot and cold spots.
Sustainability 15 14872 g005
Figure 9. Map of Uganda showing the evolution of the prevalence of undernutrition per district.
Sustainability 15 14872 g009
Figure 10. Emerging hotspot patterns across space over time.
Sustainability 15 14872 g010
Figure 11. Emerging hot spot-outlier analysis.
Sustainability 15 14872 g011
Table 1. Derivation of Composite Index of Anthropometric Failure (CIAF).
StuntedUnderweightWastedCIAFStatus
1113Undernourished
1102Undernourished
1102Undernourished
0011Undernourished
0011Undernourished
0000Normal
Table 2. Prevalence of undernutrition among children < 5 years of age in Uganda.
Undernutrition Status
Percentage of Children with at Least One Undernutrition OutcomeNi
Sex of the child
Male34.33759
Female29.55644
Total (N)31.964390
Disclaimer/Publisher’s Note: The statements, opinions and data contained in all publications are solely those of the individual author(s) and contributor(s) and not of MDPI and/or the editor(s). MDPI and/or the editor(s) disclaim responsibility for any injury to people or property resulting from any ideas, methods, instructions or products referred to in the content.

