Article

A Method for Dividing Rockburst Risk Zones—A Case Study of the Hegang Mining Area in China

1
School of Safety and Emergency Management Engineering, Taiyuan University of Science and Technology, Taiyuan 030024, China
2
Intelligent Monitoring and Control of Coal Mine Dust Key Laboratory of Shanxi Province, Taiyuan University of Science and Technology, Taiyuan 030024, China
3
State Key Laboratory for Geomechanics & Deep Underground Engineering, China University of Mining & Technology, Beijing 100083, China
4
School of Mechanics and Civil Engineering, China University of Mining & Technology, Beijing 100083, China
5
School of Civil Engineering, Hunan University of Science and Technology, Xiangtan 411201, China
*
Author to whom correspondence should be addressed.
Sustainability 2023, 15(20), 14808; https://doi.org/10.3390/su152014808
Submission received: 25 July 2023 / Revised: 6 October 2023 / Accepted: 10 October 2023 / Published: 12 October 2023
(This article belongs to the Special Issue Prevention and Control of Coal Mine Gas Disasters)

Abstract

:
Rockbursts are serious mine disasters. Through the division of rockburst risk zones, risks can be predicted in advance and measures can be implemented to prevent disasters. In this paper, taking the Hegang mining area as an example, we propose a method for dividing rockburst risk zones based on in-situ stress measurements. First, 24 survey points were established in the Hegang mining area to measure the in-situ stress. Second, based on the in-situ stress measurement data, eight representative prospecting lines were selected to establish a numerical model, and the distribution characteristics of the in-situ stress field at mining elevations of −330 m and −450 m in the Hegang mining area were obtained via the linear differential method. Afterward, division criteria for rockburst risk zones were proposed in accordance with the energy criterion and the minimum energy principle. Finally, the Hegang mining area was divided into rockburst risk zones in accordance with the in-situ microseismic monitoring data and simulation results for the in-situ stress field. Coal seam #3 was chosen as an example to illustrate rockburst risk-zone division in the Hegang mining area considering the division criterion proposed herein, and a rockburst risk zoning map of coal seam #3 in the Hegang mining area was finally obtained. The locations of the five rockbursts that have occurred in coal seam #3 of the Hegang mining area were marked on the risk zoning map and were found to have occurred in the threatened zone. Thus, it was shown that the proposed rockburst risk-zone division method is reasonable. Therefore, the results of this study could serve as a reference for the division of rockburst risk zones.

1. Introduction

Rockbursts are typical dynamic disasters in coal mining. When the ultimate strength of the mechanical system of coal and rock is reached, elastic energy is released suddenly, sharply, and violently, causing the instantaneous destruction of coal seams accompanied by the impact of pulverized coal and rock, potentially resulting in roadway destruction and personal injuries or casualties [1,2,3,4].
There are many influencing factors related to rockbursts, which can be mainly divided into geological factors and mining technology factors. The geological factors include high dip angles, thick hard roofs, hard floors, coal thickness changes, geological structures, and natural earthquakes [5,6,7,8,9,10]. The mining technology factors include coal pillars, island coal pillars, and blasting vibrations [11,12,13]. Rockburst mechanisms have been studied by many scholars worldwide, and the classical theories include stiffness theory, strength theory, energy theory, burst tendency theory, three criteria theory, and instability theory [14,15,16,17]. These theories have been adopted to explain the process of instability and failure of coal–rock masses under stress from different perspectives, and it has been shown that the stress on the coal–rock mass is the most fundamental cause of rockburst events.
Generally, stress manifests in two forms. One of these forms is in-situ stress, which comprises rock gravity and tectonic stress. It is affected by the mining depth, folds, faults, coal thickness variation, and other factors [18,19,20,21,22,23,24,25]. The other form is disturbance stress, which is affected by mining engineering conditions, such as coal pillars, goaves, island mining faces, mining layouts, and the mining of multiple coal seams [26,27,28,29,30,31,32]. A high in-situ stress is the most basic condition that provides an energy source for rockburst occurrence. Based on material mechanics and Winkler elastic foundation theory, Gu et al. established a mechanical model of an anticline structure and studied the variation trend of surplus energy during mining in the anticline area [33]. It was found that the closer the mining face is to the anticline axis, the higher the surplus energy and the higher the possibility of rockburst. He et al. studied the temporal and spatial evolution patterns of mine earthquakes during the mining process at a mining face in a folded area and found that the rockburst risk at the syncline axis was higher than that at other locations and that intense mine earthquakes in areas of high tectonic stress are highly destructive [34]. Wang et al. analyzed the stress environment of the structural area from the perspective of the structural formation mechanism and considered that the mechanisms of tectonic-induced rockburst, such as fault, fold, and coal thickness variations, entail the superposition of tectonic and mining stresses [21]. Li et al. and Jiang et al. studied the occurrence trend of rockbursts caused by faults through mechanical analysis and numerical simulations [35,36]. Sun found that in a local thinning area of a coal seam, the vertical in-situ stress could increase, causing an increase in the rockburst risk in this area [37].
Another important factor in determining the occurrence of rockbursts and the severity of the consequences is the residual energy. The residual energy is the energy that remains in the rock after the elastic energy stored in it has undergone path attenuation and reached the free surface upon the occurrence of dynamic failure. In this context, scholars have studied the inherent energy storage characteristics of rock. Wang et al. considered that the strain energy of the rock mass is the key factor inducing rockburst, which is also related to the stress concentration due to construction activities [38]. Bieniawski et al. analyzed the impact energy (KE) and elastic properties (WET) of rock [39,40]. Tang et al. used the energy storage and dissipation factor (K) as criteria for the rockburst tendency [41]. Other scholars have studied the energy dissipation process during rock deformation and failure. You et al. analyzed the energy dissipation behavior of rock samples during the failure process through mechanical experiments on various samples [42,43,44]. Weng et al. analyzed the process of energy accumulation and dissipation during the process of rock failure through numerical simulation in combination with practical engineering [45]. Xie et al. established a rock strength-loss criterion based on energy dissipation theory [46,47]. Based on the phenomenon that the energy actually released during dynamic failure of a rock mass is much higher than the induced energy, Zhao et al. proposed a minimum energy principle for rock mass dynamic failure, namely, the energy that truly causes dynamic failure of the rock mass is the energy necessary to cause rock mass failure in the unidirectional stress state [48]. Zhang et al. proposed a minimum energy storage limit for the dynamic failure of the surrounding rock caused by transient unloading [49]. Other scholars have conducted on-site monitoring of rockburst energy release. Tang et al. used microseismic monitoring equipment to record many rockburst events during the construction of the diversion tunnel for the Jinping II hydropower station, analyzed the rockburst monitoring results in comparison with normal microseismic monitoring results, and revealed the relationship between the temporal and spatial evolution characteristics of microseismic activities and rockbursts. The research results were also applied for the monitoring and early warning of rockbursts [50,51]. Yu et al. conducted 24 h continuous microseismic real-time monitoring in a deep buried tunnel, studied the macroscopic instability and failure mechanism in the rockburst nucleation process from the perspective of dynamic crack propagation, and concluded that the driving source of some rockburst events was the comprehensive result of local rockburst energy and transmitted energy [52].
In summary, the occurrence process of rockburst disasters includes two stages. The first stage is the process of energy storage in the rock, which is related to the energy storage characteristics and stress conditions. The second stage is the release of energy from the rock, i.e., the evolution and occurrence process of the rockburst event.
Based on the above work, scholars have used monitoring methods to predict the risk of rockbursts. Yin et al. [53] proposed an integrated CNN-Adam-BO algorithm (an optimized convolutional neural network algorithm) based on microseismic monitoring data, which achieved real-time prediction of the degree of rockburst danger. Dou and Wang [54,55] analyzed electromagnetic radiation signals before the failure of coal and rock specimens and before the occurrence of rockburst and found that the predicted values of rockburst risk contained errors. They used electromagnetic radiation technology to correct these errors. Other scholars have presented optimized methods for predicting the rockburst tendency in coal and rock. He et al. [56] proposed a new method that considers the strength ratio and friction characteristics of the rock materials, which can be employed to easily predict the on-site rockburst tendency. They used this method to predict the rockburst tendency for six types of rocks, and the results suitably agreed with indoor test results. This method was also successfully applied for the prediction of the surrounding rockburst tendency in the field. With the development of rock mechanics analysis software and risk analysis methods [57,58,59,60], Zhang et al. [61] established a neural network model for rockburst prediction, divided a given region into areas with different levels of rockburst danger, and proposed corresponding treatment methods based on these different levels of rockburst danger for preventing rockburst disasters. Based on field measurement data and experimental data, combined with the existing rockburst situation, numerical simulation and neural network methods were used to classify rockbursts. Xue et al. [62] used an extreme learning machine to predict and classify the risk of rockburst, and they used the particle swarm optimization (PSO) algorithm to optimize the input weight matrix and mitigate the hidden layer bias of the extreme learning machine. Other scholars have fully considered the influence of geological structures on rockburst risk and proposed a geological dynamic zoning method. From the perspective of geodynamic analysis, they have analyzed the influence of different levels of fault structures on the risk of rockbursts in mines and established a method for evaluating the rockburst danger. Based on the geological dynamic zoning method and the probabilistic method of multifactor pattern recognition, Lan et al. [63] proposed an evaluation method for predicting and classifying the risk of rockburst in mines, dividing the rockburst risk into four categories—namely, no, low, moderate, and high—and they adopted targeted measures to prevent rockburst.
However, although the fundamental cause of rockburst disasters is the combination of in-situ stress and disturbance stress induced by mining activities, existing research has mainly focused on the analysis of the rockburst tendency in coal and rock, the analysis of monitoring data and mathematical prediction models, and the analysis of the influence of geological structures. There is limited research on in-situ stress testing and the use of test data to assess the rockburst risk in mining areas.
In this paper, we choose the Hegang mining area as our research subject because it has always been a high-risk region for rockburst disasters in China and is very typical of such regions. The stress field and the regional energy density distribution in the study area are calculated based on in-situ stress test results. At the same time, based on the minimum energy principle and on-site microseismic monitoring data, a division criterion for rockburst risk zones is proposed, which can be used to evaluate the rockburst risk in the early stage of mine construction or before local coal mining begins, to facilitate the implementation of targeted protective measures in advance and avoid the occurrence of rockburst disasters.

2. Overview of Rockbursts in the Hegang Mining Area

The Hegang mining area is situated in Hegang City, northeastern Heilongjiang Province, China. The mining area has a monoclinic structure oriented approximately north–south and tilted to the east, with an inclination angle between 15° and 35°. The level of fault development is high in the mining area, and there are 167 faults with a drop of more than 70 m. There are nine producing mines and one mine under construction in the mining area. At present, the main mining levels in the mining area are distributed at elevations ranging from −330 to −830 m, and the mining depths range from 600 to 1110 m. Due to the complex geological tectonic conditions, the in-situ stress characteristics in the area are complex. During the mining process, the Hegang mining area is prone to the occurrence of stress concentration zones, making it an area with frequent occurrences of rockburst disasters in China.
According to statistics, a total of 5 mines in the Hegang mining area have experienced rockbursts; such events have occurred approximately 66 times, mainly during the processes of roadway excavation and working face mining, which is typical. Therefore, we chose the Hegang mining area as our research subject.

3. Distribution of the In-Situ Stress in the Hegang Mining Area

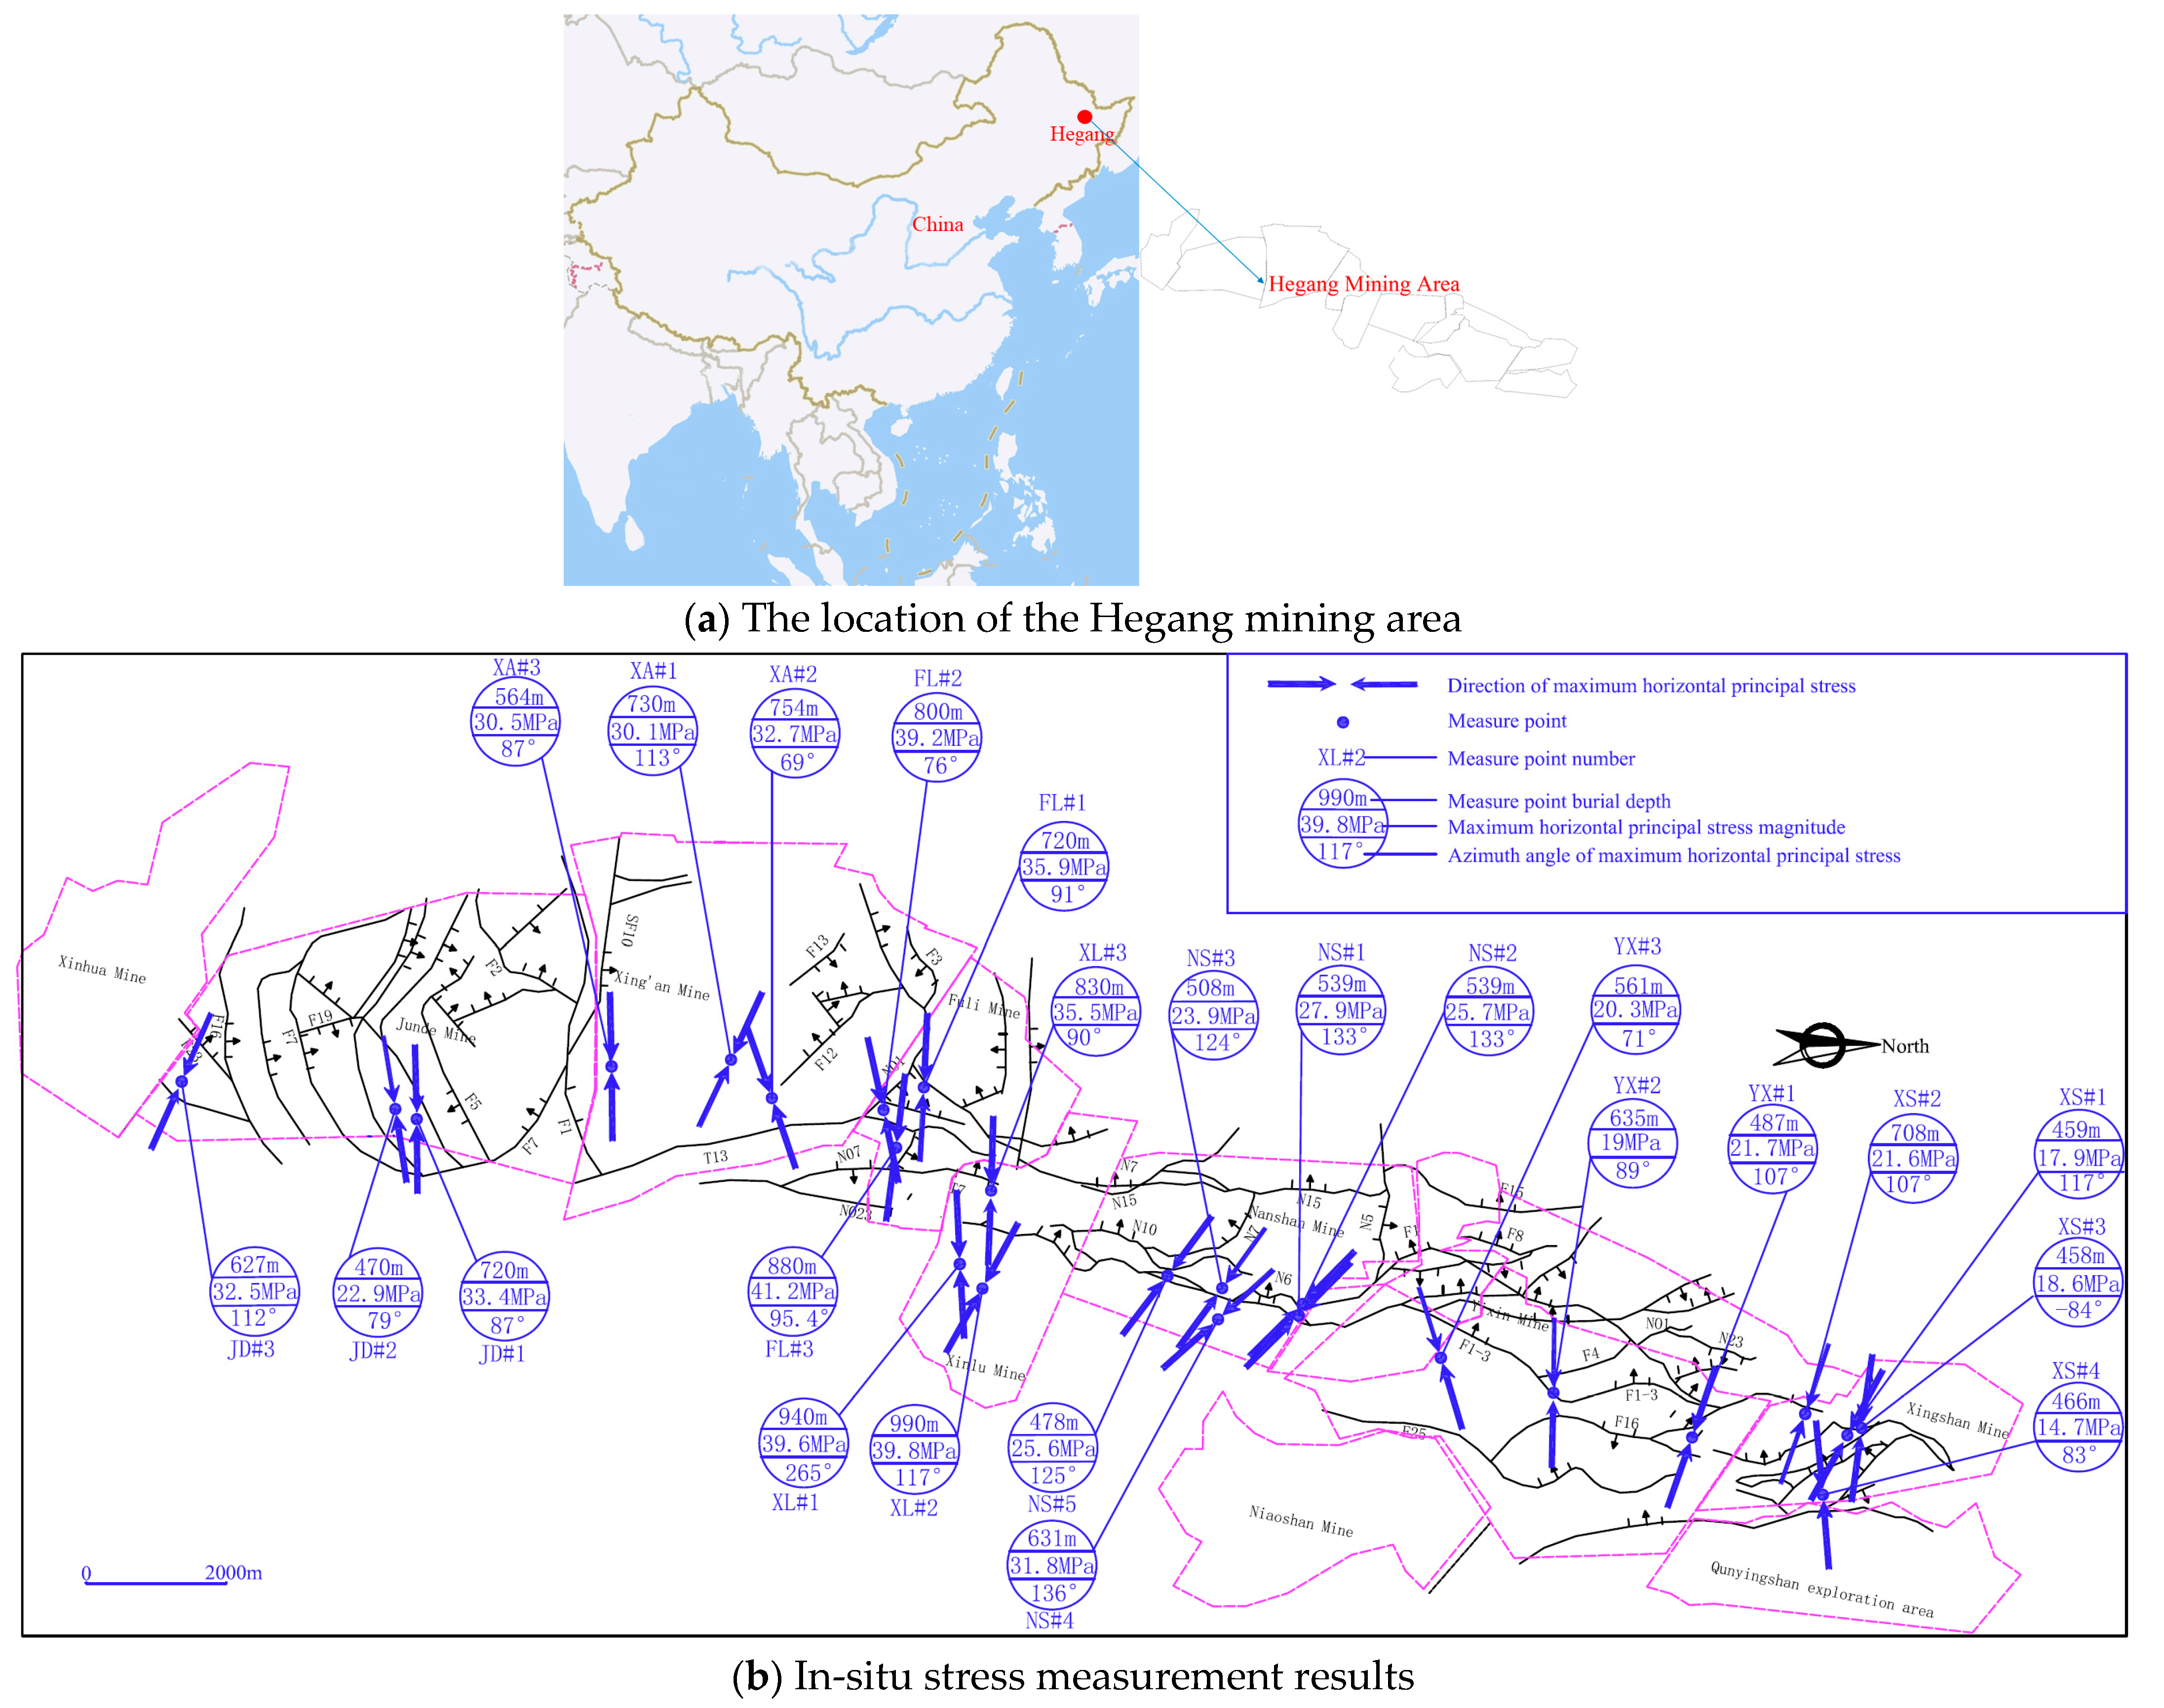
3.1. In-Situ Stress Measurement

In-situ stress measurement is the most effective and direct method to determine the regional stress state. When selecting in-situ stress measurement locations, the following principles should be followed:
  • Representativeness: The test locations should represent the general characteristics of the regional stress field.
  • Stability of the rock layers: The test locations should be chosen in stable rock layers with homogeneous and intact rocks.
  • Influence of geological structures: The test locations should not be strongly affected by geological structures and should be kept away from areas with complex geological structures.
  • Avoidance of mining impact: The test locations should not be located in areas with a dense distribution of tunnels and chambers and should be far from mining and excavation faces to minimize the influence of errors caused by mining activities.
  • Construction feasibility: The test locations should be chosen at positions favorable for in-situ stress measurement, considering factors such as the available construction space, water, and electricity, thereby ensuring that they do not conflict with other processes in coal mining production.
Based on these principles, 24 measurement points were selected in the Hegang mining area. The specific locations are shown in Figure 1. In-situ measurements were conducted using the hollow inclusion stress-relief method. The elastic strain of the borehole wall during the stress-relief process was acquired by a strain gauge rosette attached to the hollow inclusion, thereby achieving strain measurement. A corresponding mechanical calculation model was then established based on the constitutive relationship of the rock, namely, the stress–strain relationship. Moreover, based on the measured strain or displacement, the magnitudes and directions of the six components of the in-situ stress or the three principal stresses could be calculated. This measurement method provides high precision. Thus, the 3D stress could be obtained from a single borehole. The measurement results are shown in Figure 1.

3.2. Inversion of the In-Situ Stress Field in the Hegang Mining Area

The in-situ stress mainly includes self-weight stress and tectonic stress. The self-weight stress depends on the burial depth and the bulk density of the overburden. This relationship can be expressed as σ v = γ h , where γ is the bulk density of the overburden and h is the burial depth. The tectonic stress, which is generally oriented along the horizontal direction, is characterized by both the maximum horizontal principal stress and the minimum horizontal principal stress, between which the maximum horizontal principal stress exerts a greater influence on the construction and production processes of underground engineering.
The numerical simulation analysis of the in-situ stress involves a process of inversion and reproduction of the in-situ stress field distribution in the study area. The distribution characteristics of the in-situ stress field in the entire study area were inverted based on the in-situ stress values at known survey points, following the workflow shown in Figure 2.
In accordance with the principles for selecting exploration lines listed above, the purpose of which is to ensure that the selected exploration line profiles capture representative regional geological and structural features, we selected eight prospecting lines in the Hegang mining area and established a numerical model for each profile in FLAC 5.0 simulation software, version 5.0 (Figure 3). Based on the stratigraphic characteristics of the Hegang mining area (Table 1), the rock groups were classified for each model (Figure 3). The physical and mechanical parameters of the roof, interlayer and floor regions were selected from the sandstone rock groups. In addition, the fault weakening method was used for fault simulation, and grid units were assigned separately along the fault plane. The specific parameters are listed in Table 2.
The constitutive model follows the Mohr–Coulomb criterion, and the boundary load was determined based on the in-situ stress measurements. The upper boundary is uniformly loaded, the lower boundary is fully displacement constrained, and the left and right boundaries are characterized by horizontal stress gradient loading. In the simulation process, the weight of the overburden was adopted as the upper boundary load for each geological model, and gradient loads were adopted for the left and right boundary loads. The lithology and burial depth of the overburden along each prospecting line differed; therefore, we statistically analyzed the bulk density and burial depth of the overburden for the eight representative prospecting lines to obtain the upper boundary conditions for each geomorphic model. For the left and right boundaries, we selected the maximum horizontal principal stress values at three or four survey points in the nearby area and performed linear fitting to determine the load gradient model. The model load statistics are provided in Table 3.
The in-situ stress measurements indicated that the orientation of the maximum horizontal principal stress in the study area is east–northeast or nearly east–west. For the entire mining area of Hegang, the horizontal stress of each prospecting line profile can be approximately regarded as the maximum horizontal principal stress in the study area. We wrote a program in the Fish language to extract the horizontal stress value at the main mining level and associated the stress value with the geographic coordinates of each prospecting line. On this foundation, it was possible to generate contour maps of the maximum horizontal principal stress in the Hegang mining area at mining levels (elevations) of −330 and −450 (Figure 4).
A comparative analysis of the measured values and calculated results for the in-situ stress is provided in Table 4. The relative error distribution range of the maximum horizontal principal stress is 0.44 to 50.77%, with an average error of 17%. The relative error distribution range of the vertical stress is 0.36 to 33.42%, with an average error of 11.56%. The general error of the measured in-situ stress ranges from 20 to 30%. Therefore, the numerical simulation results for the in-situ stress indicate a certain degree of rationality.
The maximum horizontal principal stress at mining level −330 is 22 MPa on average, and the values vary between 8 and 36 MPa. The maximum horizontal principal stress values in the western regions of the Junde Mine, Xing’an Mine, Fuli Mine, and Nanshan Mine are generally higher than those in the central and eastern regions. Overall, the maximum horizontal principal stress values of each mine, which range from 18 to 24 MPa, are uniformly distributed. However, some areas affected by faults may contain zones of stress concentration and stress reduction.
Similarly, the maximum horizontal principal stress value at mining level −450 is 24 MPa on average, and the values range from 6 to 38 MPa. The maximum horizontal principal stress values in the eastern and western regions of each mine are higher than those in the central regions, and there are many stress reduction zones in the central regions.

4. Criteria for Dividing Rockburst Risk Zones

According to the energy criterion, when a coal–rock mass is damaged, a rockburst will occur if the instantaneous energy released is higher than the energy consumed, which can be expressed as
U e > U c
where U e is the instantaneous energy released by the coal–rock mass and U c is the energy consumed.
Based on the minimum energy principle of rock mass failure [48], a large amount of bulk elastic energy is stored in a rock mass under three-dimensional stress. Following rock mass failure, the stress state rapidly transforms from three-dimensional stress to two-dimensional stress and finally to unidirectional stress. As the stress state changes from the three-dimensional to the one-dimensional state, the consumed energy greatly varies, and the extra energy is converted into kinetic energy for rock ejection. The minimum energy required for rock mass failure can be expressed as
U m i n = σ c 2 2 E
where U m i n is the minimum energy required for rock mass failure, E is the elastic modulus of the rock, and σ c is the compressive strength of the rock.
Consequently, the process of energy release when a rockburst occurs can be summarized as follows: When the rockburst starts, the minimum energy required for rock mass failure will be reached first, and the rock mass will begin to break down. Then, excess energy will be consumed for plastic deformation, failure, and thermal energy generation in the rock mass along the release path of minimum energy. When the released energy reaches the free surface, the surplus energy is converted into kinetic energy for rock ejection. We use U e to denote the remaining energy when the energy released during the dynamic failure of the rock mass reaches the free surface, U m i n to denote the minimum energy required for dynamic failure of the rock mass, U c m i n to denote the energy consumed along the release path of minimum energy during the dynamic failure of the rock mass, and U s to denote the total energy stored before the dynamic failure of the rock mass. The energy criterion can thus be expressed as
U e = U s U m i n U c m i n > 0
The energy remaining after the energy released during the dynamic failure of the rock mass reaches the free surface (i.e., U e ) can be calculated based on the statistics of rockburst occurrence in the mining area, but the energy consumed along the release path of minimum energy during the dynamic failure of the rock mass (i.e., U c m i n ), which is related to the actual working conditions, the rock mass structure, and the physical and mechanical properties of the rock mass, is very complicated and difficult to determine. The energy stored before the dynamic failure of the rock mass (i.e., U s ) can be obtained from the original stress on the rock mass and can be calculated as shown in Equation (4).
U s = 1 2 E σ 1 2 + σ 2 2 + σ 3 2 2 μ σ 1 σ 2 + σ 2 σ 3 + σ 3 σ 1
If U e m i n is the minimum energy that reaches the free surface when a rockburst occurs, the rockburst energy criterion can be expressed as
U s > U m i n + U c m i n + U e m i n
As mentioned above, it is difficult to determine the energy consumed along the release path of minimum energy during the dynamic failure of the rock mass (i.e., U c m i n ). Accordingly, the term U c m i n can be omitted from the above expressions to obtain division criteria for rockburst risk zones, and the criteria obtained in this way can also meet the safety tolerance for the division of rockburst risk zones. Thus, the following can be obtained:
(1)
For coal seams with a weak tendency to suffer rockburst, the criteria for dividing rockburst risk zones can be expressed as:
U s < U m i n + U e m i n             safe   zone
U m i n + U e m i n U s < U m i n + U e m a x         threatened   zone
U s U m i n + U e m a x                                 dangerous   zone
where U e m a x is the early warning energy for rockburst monitoring.
(2)
Because coal seams with a strong tendency to suffer rockburst are easily affected by other factors that cause rockburst, there is no safe zone. The corresponding division criteria can be defined as follows:
U s < U m i n + U e m i n               threatened   zone
U s U m i n + U e m i n               dangerous   zone

5. Division of the Hegang Mining Area into Rockburst Risk Zones

In the Hegang mining area, rockburst disasters have mainly occurred in coal seams #3, #11, #17, and #18. Here, we adopt coal seam #3 as an example to illustrate the division of rockburst risk zones.
According to microseismic monitoring statistics from the Hegang mining area, the energy released in rockburst events in the Hegang mining area ranges from 3.57 × 10⁴ J to 9.12 × 10⁹ J; accordingly, U e m i n can be set to 3.57 × 10⁴ J.
In accordance with long-term microseismic monitoring data for the site and the research data and judgement of experts, a value of 105 J has been set as the critical value for early warning of rockburst in the mining area. Here, the critical value for early warning of rockburst is denoted by Uemax.
Based on the measured physical and mechanical parameters of coal seam #3 in the Hegang mining area, the minimum energy required for the dynamic failure of coal seam #3 was obtained, as shown in Table 5.
There is a marked difference in the rockburst tendency across different areas of coal seam #3, as indicated in Table 3. In particular, coal seam #3 shows a stronger rockburst tendency in the Yixin mining area than in most other areas (Table 6). In accordance with the criteria for dividing rockburst risk zones described above, the energy criteria were calculated for coal seam #3. For areas with a weak rockburst tendency, the criteria are as follows:
U s < 45,841.51                                                 safe   zone
5841.51 U s < 110,141.51                         threatened   zone
U s 110,141.5                                                 dangerous   zone
For areas with a strong rockburst tendency, the criteria are as follows:
U s < 47,513.04                     threatened   zone
U s 47,513.04                     dangerous   zone
We calculated the energy stored in coal seam #3 based on the numerical simulation results for the in-situ stress mentioned above and imported the calculation results and energy criteria into the Surfer 12 modelling software, version 12, to generate rockburst risk zoning maps for coal seam #3 in the Hegang mining area, as shown in Figure 5.
The rockburst records of coal seam #3 show that five rockburst events occurred coal seam #3 from 2004 to 2010. One occurred at the second mining level, and the other four occurred at the third mining level (−330). All rockburst events in coal seam #3 occurred in the threatened zone (Figure 5). Thus, it can be concluded that the stored energy in the coal seam due to in-situ stress plays a key role in rockburst occurrence. Furthermore, the stress superposition resulting from factors such as the thick and hard roof of the goaf and the adjacent goaf, the remaining coal pillars in the upper section, and working face mining directly impact the occurrence of rockburst events.
At present, mining of coal seam #3 in the Hegang mining area is mainly concentrated in the Junde Mine and Yixin Mine, at both mining level −330 and mining level −450. In the Junde Mine, coal seam #3 exhibits only a weak rockburst tendency. The same coal seam, however, shows a strong tendency to suffer rockburst in the Yixin Mine, and the roofs of the coal seam in both mines demonstrate high burst proneness. According to the rockburst risk zoning maps, the Junde Mine is situated in the threatened zone, and the Yixin Mine lies in the dangerous zone. In addition, both roofs of the coal seam show a high burst potential. Consequently, the Junde Mine and Yixin Mine are both prone to rockbursts during the mining of coal seam #3.
According to statistical data, five rockburst accidents have occurred at the −330 level in the Junde Coal Mine, of which four occurred during the mining of the working face and one occurred during tunneling. The rockburst occurrence area is shown in Figure 5a. According to the zoning results, the rockburst events that have occurred were all located in the threatened zone. It can be concluded that the method presented in this paper for dividing rockburst risk zones is reasonable and feasible. The findings also indicate that the in-situ stress exerts a notable influence on rockburst phenomena in the Hegang mining area and should not be ignored during coal mining at the current mining levels.

6. Discussion

Compared to other regions in China, the Hegang mining area has a relatively high frequency of rockburst disasters. According to statistical data from 2004 to 2010, rockburst disasters occurred as many as 66 times in this area. Therefore, the Hegang mining area is considered typical in terms of the conditions that are conducive to rockburst disasters.
Currently, it is widely believed in the academic community that the combined effect of in-situ stress and mining stress is the fundamental cause of rockburst events. In this study, based on the selection principles for in-situ stress measurement points, a total of 24 measurement points were selected in the Hegang mining area, and the in-situ stress was measured using the hollow inclusion stress-relief method.
However, the data from the selected measurement points may not reflect the in-situ stress distribution characteristics of the entire mining area. In contrast to the in-situ stress inversion method proposed by Singha et al. [64], eight representative exploration lines were selected in this study and used to determine the model loading conditions based on measured in-situ stress data. By applying interpolation to extract the maximum horizontal principal stress values at the main mining level, a contour map of the maximum horizontal principal stress at the main mining level was generated. This method is simple and accounts for regional tectonic conditions, enabling the rapid determination of the distribution characteristics of the maximum horizontal principal stress in the mining area. The simulated results were compared with the measured results, and the average relative error of 17% indicated low-accuracy but nevertheless reasonable simulation results.
In contrast to the method of rockburst tendency evaluation based on the mechanical properties of rock, the research method proposed in this paper can not only be used to consider the rockburst tendency of coal but also to calculate the elastic energy of the coal seams in the Hegang mining area based on measured in-situ stress data. Criteria for evaluating rockburst risk were formulated to divide the Hegang mining area into different rockburst risk zones. The proposed evaluation of rockburst risk accounts for both the coal seam characteristics and the in-situ stress conditions, resulting in more accurate and meaningful prediction results, especially for rockburst prediction before coal seam mining begins. Therefore, based on the evaluation results, preventive measures can be implemented at coal mines to prevent the occurrence of rockburst disasters.

7. Conclusions

(1)
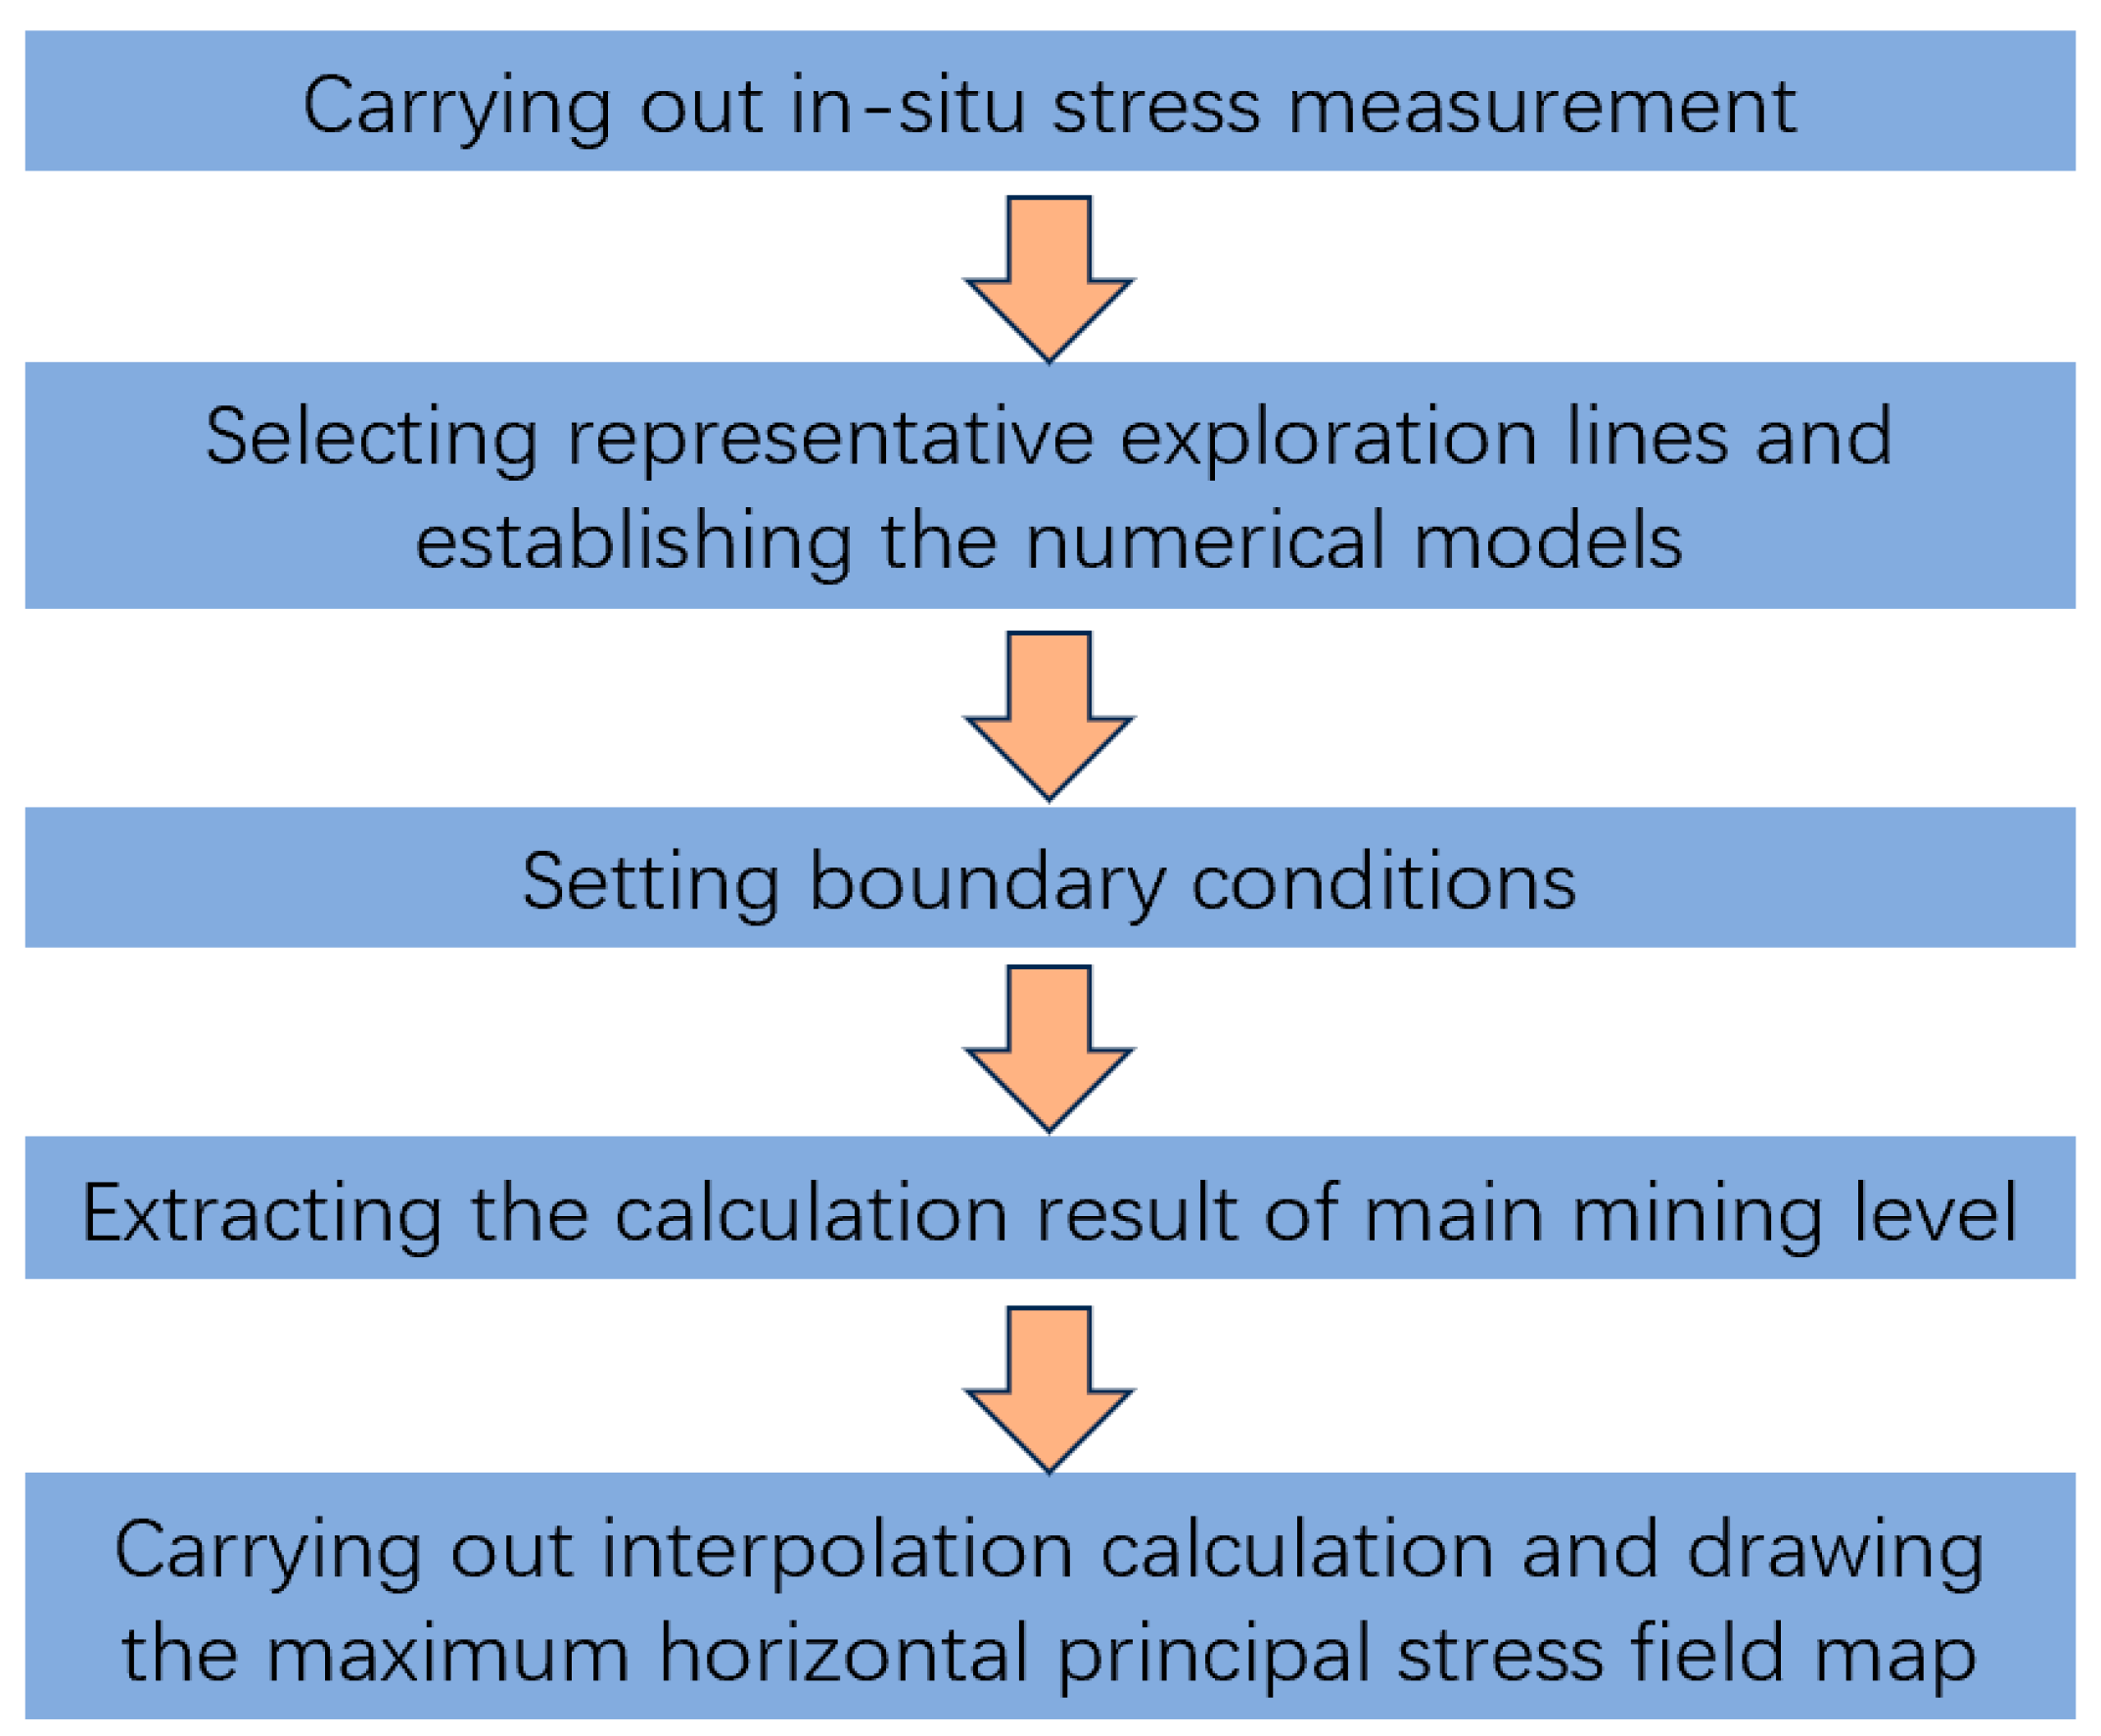
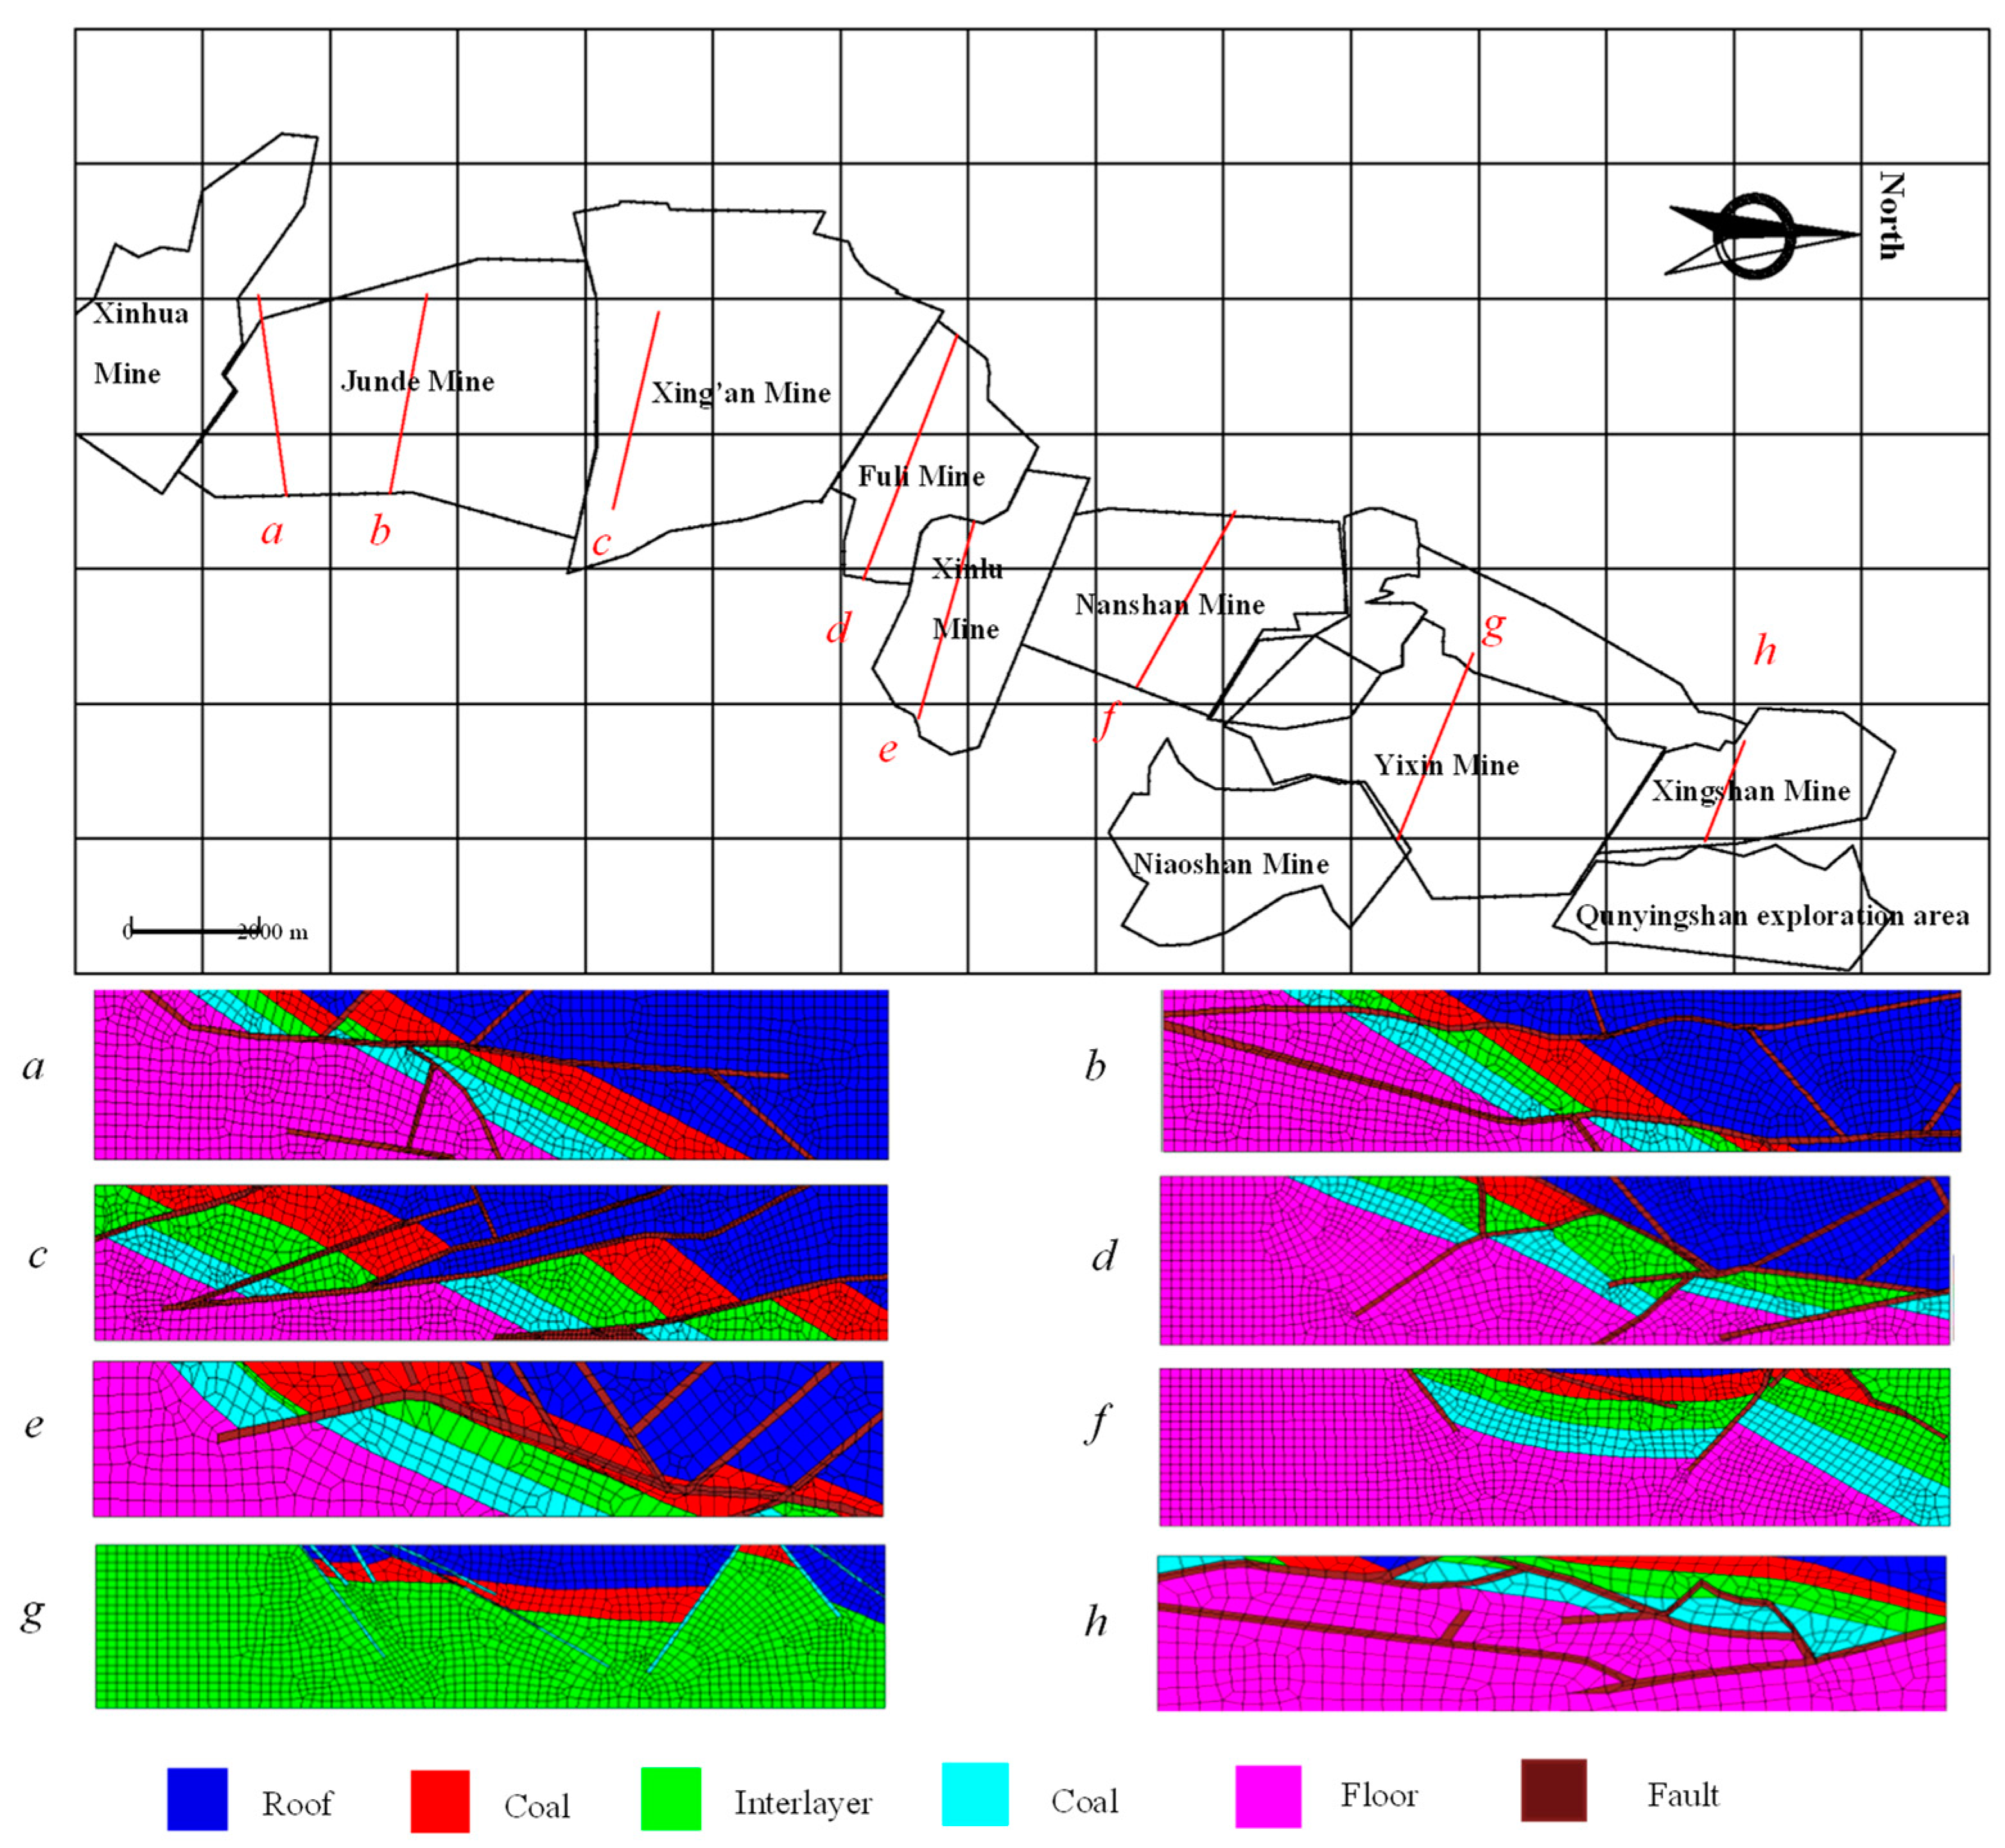
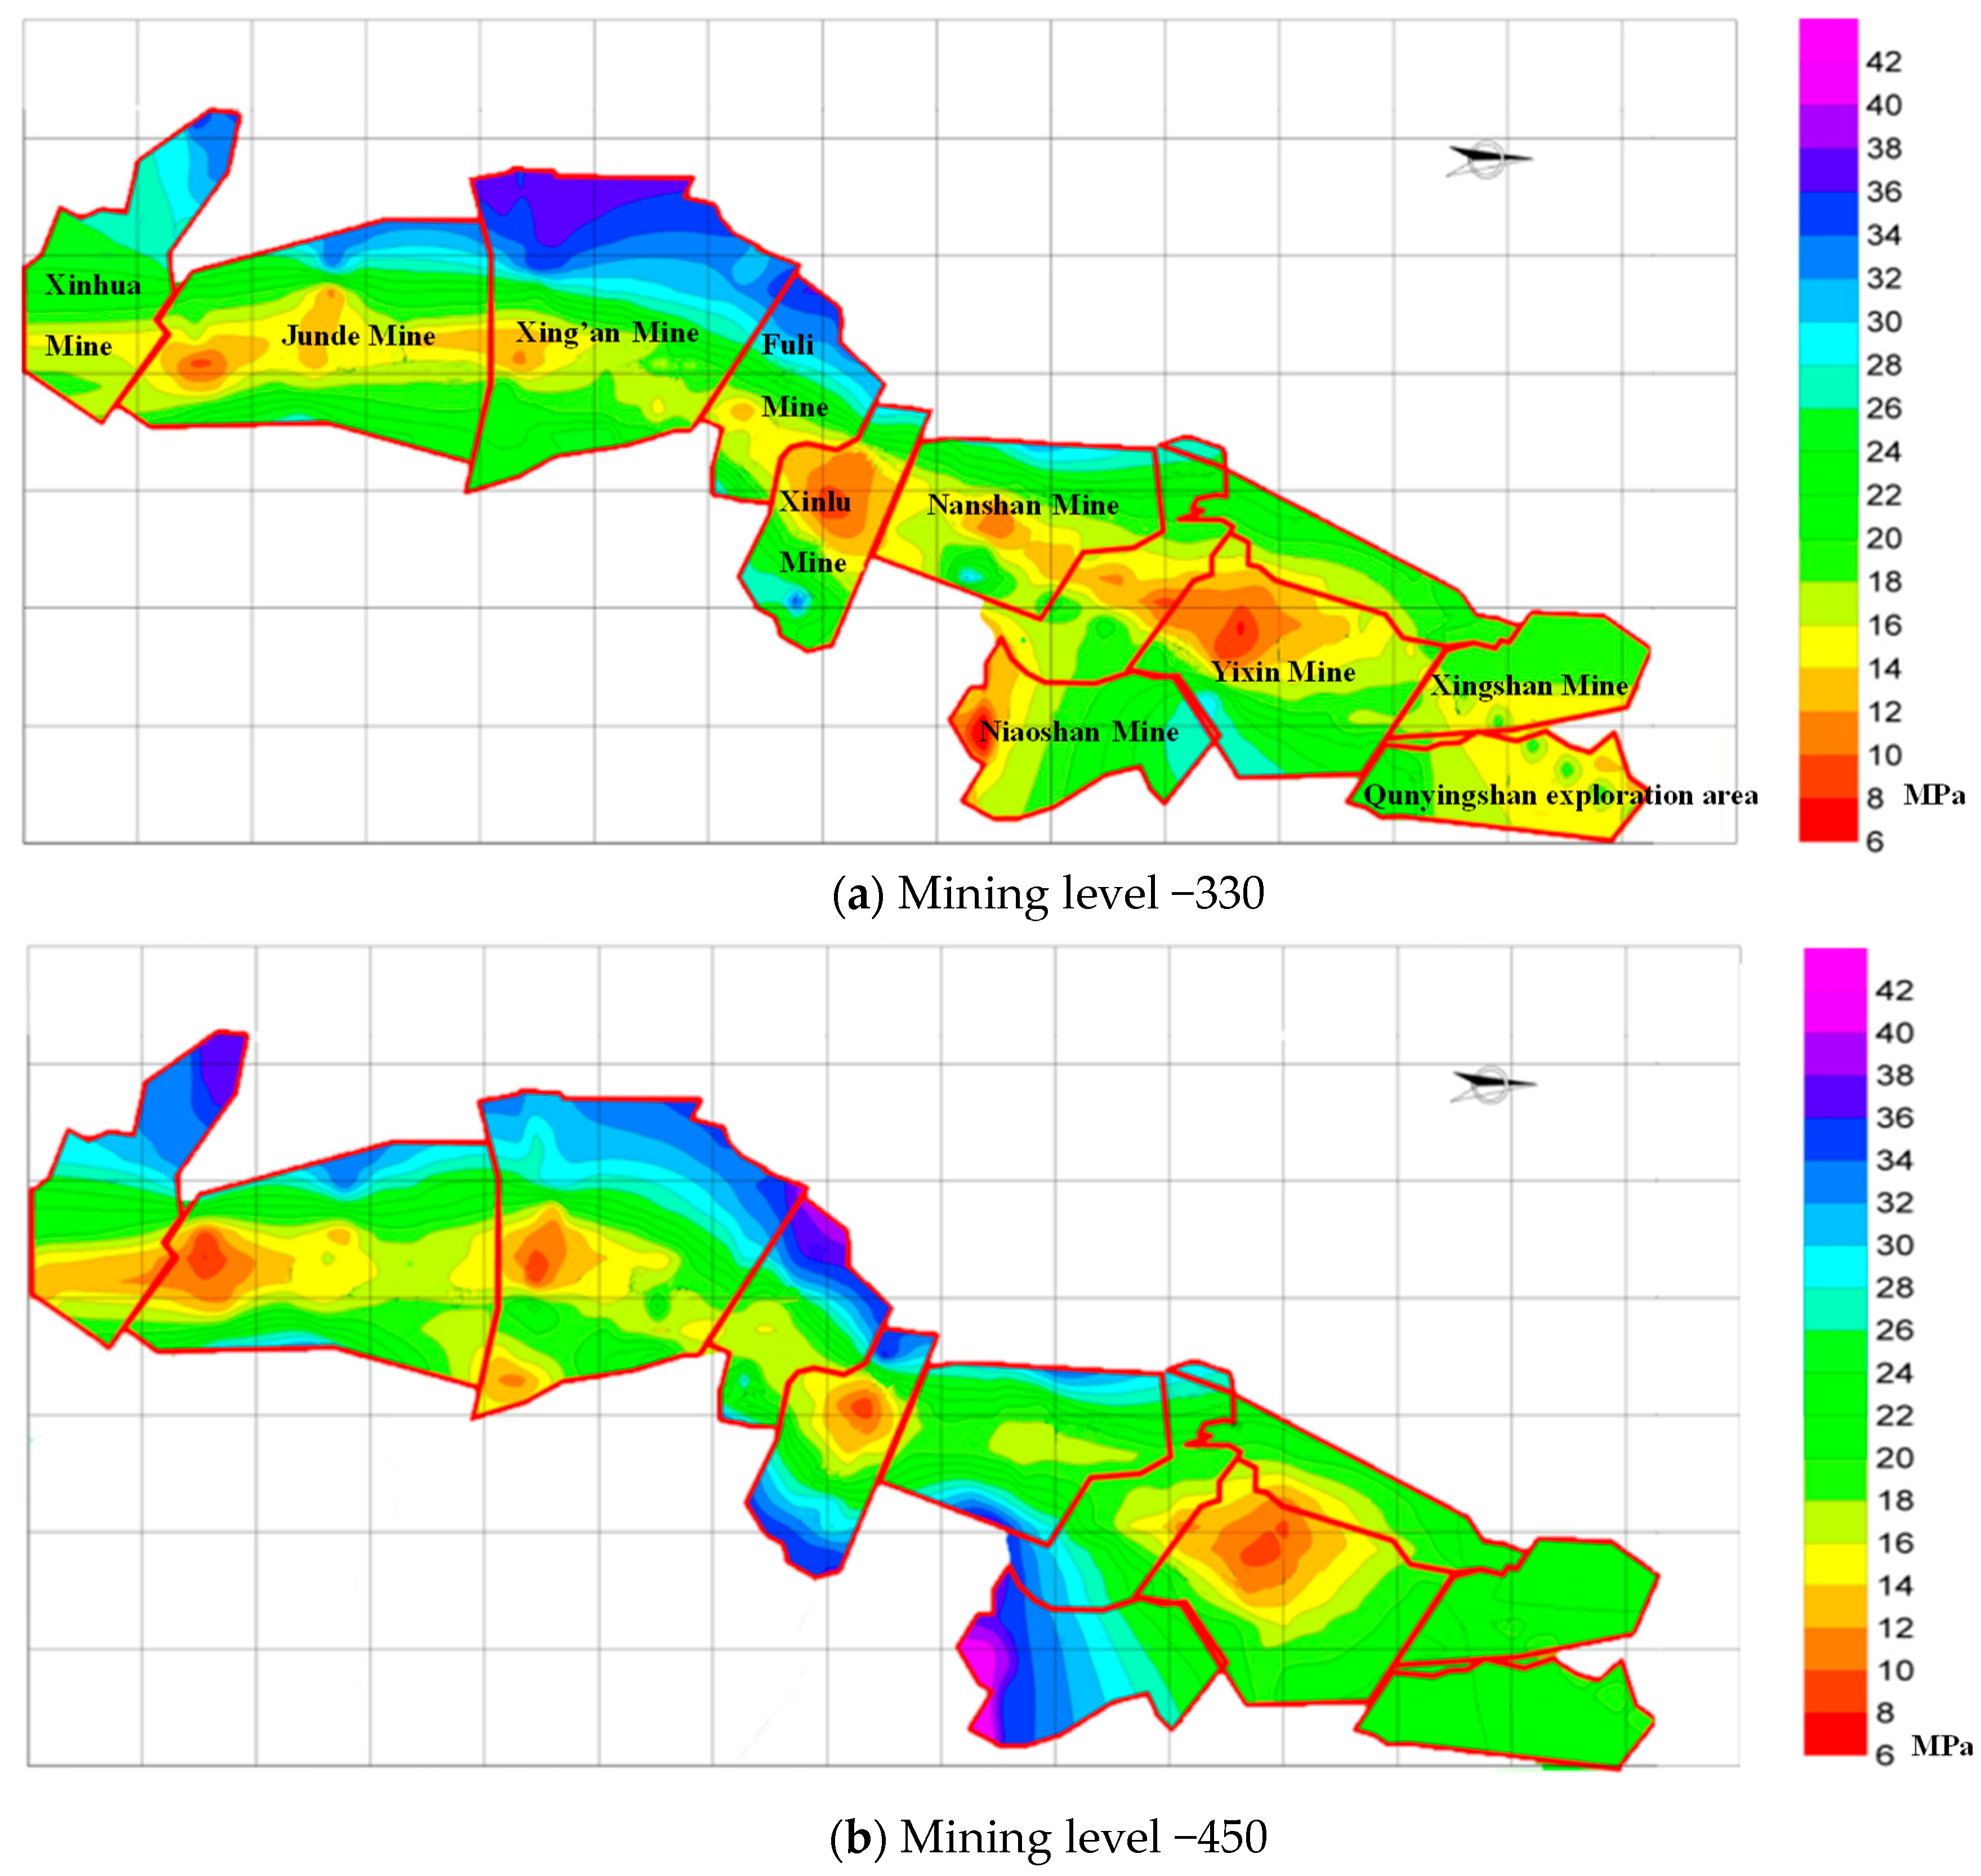
To enable the inversion of the in-situ stress, first, representative measurement points were selected in the Hegang mining area; second, numerical models were established based on representative exploration lines in the region; third, the model loads were calculated based on the measured in-situ stress results; and finally, the maximum horizontal principal stress values at the main mining level were extracted through an interpolation method to generate a maximum horizontal-principal-stress contour map for the main mining level. By comparing the measured and simulated data, the relative error distribution range of the maximum horizontal principal stress was found to be 0.44 to 50.77%, with an average error of 17%. Thus, the numerical simulation results for the in-situ stress indicated a certain degree of rationality.
(2)
Based on energy theory, the minimum energy principle, field microseismic monitoring, and early warning data, we proposed criteria for the division of the Hegang mining area into rockburst risk zones and calculated the total stored energy in the coal–rock mass at mining elevations of −330 m and −450 m based on the inversion results for the in-situ stress field in the Hegang mining area. Then, we adopted coal seam #3 as an example to illustrate the division of the Hegang mining area into rockburst risk zones based on the division criteria proposed herein and generated rockburst risk zoning maps accordingly. When the five rockburst events that occurred in coal seam #3 in the Hegang mining area were marked on the risk zoning map, it was found that their locations coincided with the threatened zone.
(3)
The division method for rockburst risk zones proposed in this paper accounts for both the coal seam characteristics and the in-situ stress conditions, resulting in more accurate and meaningful prediction results, especially for rockburst prediction before coal seam mining begins. Therefore, coal mines can take preventive measures based on these evaluation results to prevent the occurrence of rockburst disasters.

Author Contributions

Conceptualization, X.Y. and J.X.; Methodology, J.P.; Software, Q.H.; Validation, Y.H.; Writing—review & editing, S.Y. All authors have read and agreed to the published version of the manuscript.

Funding

This research was funded by the National Natural Science Foundation of China (42202321), the Scientific and Technological Innovation Programs of Higher Education Institutions in Shanxi (2019L0641), the Fundamental Research Program of Shanxi Province (202203021212311, 202203021222184), and the Taiyuan University of Science and Technology Scientific Research Initial Funding (20222112).

Institutional Review Board Statement

Not applicable.

Informed Consent Statement

Not applicable.

Data Availability Statement

The data used to support the findings of this study are available from the corresponding author upon request.

Acknowledgments

The authors thank the State Key Laboratory for Geomechanics and Deep Underground Engineering for providing assistance with this research.

Conflicts of Interest

The authors declare no conflict of interest.

References

  1. Zhao, T.B.; Guo, W.Y.; Tan, Y.L.; Yin, Y.C.; Cai, L.S.; Pan, J.F. Case studies of rockbursts under complicated geological conditions during multiseam mining at a depth of 800 m. Rock Mech. Rock Eng. 2018, 51, 1539–1564. [Google Scholar] [CrossRef]
  2. Kaiser, P.K.; Cai, M. Design of rock support system under rockburst condition. J. Rock Mech. Geotech. Eng. 2012, 4, 215–227. [Google Scholar] [CrossRef]
  3. Feng, X.T.; Zhang, C.Q.; Qiu, S.L.; Zhou, H.; Jiang, Q.; Li, S.J. Dynamic design method for deep hard rock tunnels and its application. J. Rock Mech. Geotech. Eng. 2016, 8, 443–461. [Google Scholar] [CrossRef]
  4. Zhao, T.B.; Guo, W.Y.; Tan, Y.L.; Yu, F.H.; Huang, B.; Zhang, L.S. Failure mechanism of layer-crack rock models with different vertical fissure geometric configurations under uniaxial compression. Adv. Mech. Eng. 2017, 9, 1–15. [Google Scholar] [CrossRef]
  5. Vižintin, G.; Kocjančič, M.; Vulić, M. Study of Coal Burst Source Locations in the Velenje Colliery. Energies 2016, 9, 507. [Google Scholar] [CrossRef]
  6. Wang, J.; Ning, J.; Jiang, L.; Jiang, J.-Q.; Bu, T. Structural characteristics of strata overlying of a fully mechanized longwall face: A case study. J. S. Afr. Inst. Min. Met. 2018, 118, 1195–1204. [Google Scholar] [CrossRef]
  7. Jiang, Y.D.; Pan, Y.S.; Jiang, F.X.; Dou, L.M.; Ju, Y. State of the art review on mechanism and prevention of coal bumps in China. J. China Coal Soc. 2014, 39, 205–213. [Google Scholar]
  8. Xiao, Y.X.; Feng, X.T.; Li, S.J.; Feng, G.L.; Yu, Y. Rock mass failure mechanisms during the evolution process of rockbursts in tunnels. Int. J. Rock Mech. Min. Sci. 2016, 83, 174–181. [Google Scholar] [CrossRef]
  9. Liu, X.S.; Tan, Y.L.; Ning, J.G.; Lu, Y.W.; Gu, Q.H. Mechanical properties and damage constitutive model of coal in coal-rock combined body. Int. J. Rock Mech. Min. Sci. 2018, 110, 140–150. [Google Scholar] [CrossRef]
  10. Guo, W.; Gu, Q.; Tan, Y.; Hu, S. Case Studies of Rockbursts in Tectonic Areas with Facies Change. Energies 2019, 12, 1330. [Google Scholar]
  11. Dou, L.M.; Mu, Z.L.; Li, Z.L.; Cao, A.; Gong, S. Research progress of monitoring, forecasting, and prevention of rockburst in underground coal mining in China. Int. J. Coal Sci. Technol. 2014, 1, 278–288. [Google Scholar] [CrossRef]
  12. He, J.; Dou, L.M.; Gong, S.Y.; Li, J.; Ma, Z. Rockburst assessment and prediction by dynamic and static stress analysis based on microseismic monitoring. Int. J. Rock Mech. Min. Sci. 2017, 93, 9346–9353. [Google Scholar] [CrossRef]
  13. Li, Z.L.; Dou, L.M.; Wang, G.F.; Cai, W.; He, J. Risk evaluation of rockburst through theory of static and dynamic stresses superposition. J. Cent. South Univ. 2015, 22, 676–683. [Google Scholar] [CrossRef]
  14. Cook, N.G.W.; Hoek, E.; Pretorius, J.P.G.; Ortlepp, W.D.; Salamon, H.D. GRock mechanics applied to the study of rockbursts. J. S. Afr. Inst. Min. Metall. 1966, 66, 435–528. [Google Scholar]
  15. Vardoulakis, I. Rockbursting as a surface instability phenomenon. Int. J. Rock Mech. Min. Sci. Geomech. Abstr. 1984, 21, 137–144. [Google Scholar] [CrossRef]
  16. Zhou, J.; Li, X.; Shi, X. Long-term prediction model of rockburst in underground openings using heuristic algorithms and support vector machines. Saf. Sci. 2012, 50, 629–644. [Google Scholar] [CrossRef]
  17. Afraei, S.; Shahriar, K.; Madani, S.H. Statistical assessment of rockburst potential and contributions of considered predictor variables in the task. Tunn. Undergr. Space Technol. 2018, 72, 250–271. [Google Scholar] [CrossRef]
  18. Bräuner, G. Rockbursts in Coal Mines and Their Prevention; Routledge: London, UK, 2017. [Google Scholar]
  19. Peng, S.S. Coal Mine Ground Control; Department of Mining Engineering/College of Engineering and Mineral Resources: Morgantown, WV, USA, 2008. [Google Scholar]
  20. Whyatt, J.K.; Varley, F. Regional bumps: Case studies from the 1958 bump symposium. Trans. Soc. Min. Metall. Explor. 2009, 326, 101–105. [Google Scholar]
  21. Wang, C.W.; Jiang, F.X.; Liu, J.H. Analysis on control action of geologic structure on rockburst and typical cases. J. China Coal Soc. 2012, 37, 263–268. [Google Scholar]
  22. Wang, J.M.; Zeng, X.H.; Zhou, J.F. Practices on rockburst prevention and control in headrace tunnels of Jinping II hydropower station. J. Rock Mech. Geotech. Eng. 2012, 4, 258–268. [Google Scholar] [CrossRef]
  23. Huang, W.P.; Yuan, Q.; Tan, Y.L.; Wang, J.; Liu, G.L.; Qu, G.L.; Li, C. An innovative support technology employing a concrete-filled steel tubular structure for a 1000-m-deep roadway in a high in situ stress field. Tunn. Undergr. Space Technol. 2017, 11, 26–36. [Google Scholar] [CrossRef]
  24. Feng, G.L.; Feng, X.T.; Chen, B.R.; Xiao, Y.X.; Yu, Y. A microseismic method for dynamic warning of rockburst development processes in tunnels. Rock Mech. Rock Eng. 2015, 48, 2061–2076. [Google Scholar] [CrossRef]
  25. Feng, G.L.; Feng, X.T.; Chen, B.R.; Xiao, Y.X. Microseismic sequences associated with rockbursts in the tunnels of the Jinping II hydropower station. Int. J. Rock Mech. Min. Sci. 2015, 80, 89–100. [Google Scholar] [CrossRef]
  26. Corkum, A.G.; Board, M.P. Numerical analysis of longwall mining layout for a Wyoming Trona mine. Int. J. Rock Mech. Min. Sci. 2016, 89, 94–108. [Google Scholar] [CrossRef]
  27. Li, X.H.; Pan, F.; Li, H.Z.; Zhao, M.; Ding, L.X.; Zhang, W.X. Prediction of rock-burst-threatened areas in an island coal face and its prevention: A case study. Int. J. Min. Sci. Technol. 2016, 26, 1125–1133. [Google Scholar] [CrossRef]
  28. Yu, B.; Zhang, Z.Y.; Kuang, T.J.; Liu, J.R. Stress changes and deformation monitoring of longwall coal pillars located in weak ground. Rock Mech. Rock Eng. 2016, 49, 3293–3305. [Google Scholar] [CrossRef]
  29. Tan, Y.L.; Yu, F.H.; Ning, J.G.; Zhao, T.B. Design and construction of entry retaining wall along a gob side under hard roof stratum. Int. J. Rock Mech. Min. Sci. 2015, 77, 115–121. [Google Scholar] [CrossRef]
  30. Tan, Y.L.; Liu, X.S.; Ning, J.G.; Lv, Y.W. In situ investigations on failure evolution of overlying strata induced by mining multiple coal seams. Geotech. Test. J. 2017, 40, 244–257. [Google Scholar] [CrossRef]
  31. Ning, J.G.; Wang, J.; Tan, Y.L.; Zhang, L.S.; Bu, T.T. In situ investigations into mining-induced overburden failures in close multipleseam longwall mining: A case study. Geomech. Eng. 2017, 12, 657–673. [Google Scholar] [CrossRef]
  32. Zhang, G.C.; Liang, S.J.; Tan, Y.L.; Xie, F.X. Numerical modelling for longwall pillar design: A case study from a typical longwall panel in China. J. Geophys. Eng. 2018, 15, 121–134. [Google Scholar] [CrossRef]
  33. Gu, S.T.; Huang, R.F.; Tan, Y.L.; Li, W.S.; Xiao, Z.M. Formation mechanism of anticline structure and its disastrous mechanism of rockburst. J. Min. Saf. Eng. 2015, 32, 59–64. [Google Scholar]
  34. He, H.; Dou, L.M.; Gong, S.Y.; Zhou, P.; Xue, Z.J.; Jiang, H. Study of mining shock in high tectonic stress zones. J. China Univ. Min. Technol. 2011, 40, 7–13. [Google Scholar]
  35. Li, Z.H.; Dou, L.M.; Lu, C.P.; Mu, Z.L.; Can, A.Y. Study on fault induced rockbursts. Int. J. Min. Sci. Technol. 2008, 18, 321–326. [Google Scholar]
  36. Jiang, Y.D.; Wang, T.; Zhao, Y.X.; Wang, C. Numerical simulation of fault activation pattern induced by coal extraction. J. China Univ. Min. Technol. 2013, 42, 1–5. [Google Scholar]
  37. Sun, Z.W. Numerical simulation on stress field distribution in partial transformation area of coal seam. Ground Press Strata Control 2003, 20, 95–100. [Google Scholar]
  38. Wang, J.-A.; Park, H. Comprehensive prediction of rockburst based on analysis of strain energy in rocks. Tunn. Undergr. Space Technol. 2001, 16, 49–57. [Google Scholar] [CrossRef]
  39. Bieniawski, Z.T.; Denkhaus, H.G.; Vogler, U.W. Failure of fractured rock. Int. J. Sci. Geomech. 1969, 6, 323–341. [Google Scholar] [CrossRef]
  40. Kidybiński, A. Bursting liability indices of coal. Int. J. Rock Mech. Min. Sci. Géoméch. Abstr. 1981, 18, 295–304. [Google Scholar] [CrossRef]
  41. Tang, L.Z.; Wang, W.X. A new rockburst tendency index. Chin. J. Rock Mech. Eng. 2002, 21, 874–878. [Google Scholar]
  42. You, M.Q.; Hua, A.Z. Energy analysis of rock sample failur. Chin. J. Rock Mech. Eng. 2002, 21, 778–781. [Google Scholar]
  43. Zhang, L.M.; Gao, S.; Ren, M.Y.; Wang, Z.Q.; Ma, S.Q. Rock elastic strain energy and dissipation strain energy evolution characteristics under conventional triaxial compression. Chin. J. Coal Soc. 2014, 39, 1238–1242. [Google Scholar]
  44. Zhu, Z.Q.; Sheng, Q.; Xiao, P.W.; Liu, J.G. Analysis of energy dissipation in process of unloading confining pressure failure of rocks. Chin. J. Rock Mech. Eng. 2011, 30, 2675–2681. [Google Scholar]
  45. Weng, L.; Huang, L.; Taheri, A.; Li, X. Rockburst characteristics and numerical simulation based on a strain energy density index: A case study of a roadway in Linglong gold mine, China. Tunn. Undergr. Space Technol. 2017, 69, 223–232. [Google Scholar] [CrossRef]
  46. Xie, H.P.; Peng, R.D.; Ju, Y.; Zhou, H.W. On energy analysis of rock failure. Chin. J. Rock Mech. Eng. 2005, 24, 2603–2608. [Google Scholar]
  47. Xie, H.P.; Peng, R.D.; Ju, Y. Energy dissipation of rock deformation and fracture. Chin. J. Rock Mech. Eng. 2004, 23, 3565–3570. [Google Scholar]
  48. Zhao, Y.S.; Feng, Z.C.; Wan, Z.J. Least energy principle of dynamical failure of rock mass. Chin. J. Rock Mech. Eng. 2003, 22, 1781–1783. [Google Scholar]
  49. Zhang, Z.Q.; Luo, C.; Zhang, H.; Gong, R.K. Rockburst identification method based on energy storage limit of surrounding rock. Energies 2020, 13, 343. [Google Scholar] [CrossRef]
  50. Ma, T.H.; Tang, C.A.; Tang, L.X.; Zhang, W.D.; Wang, L. Rockburst characteristics and microseismic monitoring of deep–buried tunnels for Jinping II Hydropower Station. Tunn. Undergr. Space Technol. 2015, 49, 345–368. [Google Scholar] [CrossRef]
  51. Tang, C.A.; Wang, J.M.; Zhang, J.J. Preliminary engineering application of microseismic monitoring technique to rockburst prediction in tunneling of Jinping II project. J. Rock Mech. Geotech. 2010, 2, 193–208. [Google Scholar] [CrossRef]
  52. Yu, Q.; Tang, C.A.; Li, L.; Cheng, G.; Tang, L.X. Study on rockburst nucleation process of deep-buried tunnels based on microseismic monitoring. Shock Vib. 2015, 2015, 685437. [Google Scholar] [CrossRef]
  53. Yin, X.; Liu, Q.; Huang, X.; Pan, Y. Real-time prediction of rockburst intensity using an integrated CNN-Adam-BO algorithm based on microseismic data and its engineering application. Tunn. Undergr. Space Technol. 2021, 117, 104133. [Google Scholar] [CrossRef]
  54. Cai, W.; Dou, L.; Zhang, M.; Cao, W.; Shi, J.-Q.; Feng, L. A fuzzy comprehensive evaluation methodology for rock burst forecasting using microseismic monitoring. Tunn. Undergr. Space Technol. 2018, 80, 232–245. [Google Scholar] [CrossRef]
  55. Dou, L.; Cai, W.; Cao, A.; Guo, W. Comprehensive early warning of rock burst utilizing microseismic multi-parameter indices. Int. J. Min. Sci. Technol. 2018, 28, 767–774. [Google Scholar] [CrossRef]
  56. He, M.; Zhang, Z.; Zhu, J.; Li, N.; Li, G.; Chen, Y. Correlation between the rockburst proneness and friction characteristics of rock materials and a new method for rockburst proneness prediction: Field demonstration. J. Pet. Sci. Eng. 2021, 205, 108997. [Google Scholar] [CrossRef]
  57. Lei, M.; Lin, D.; Huang, Q.; Shi, C.; Huang, L. Research on the construction risk control technology of shield tunnel underneath an operational railway in sand pebble formation: A case study. Eur. J. Environ. Civ. Eng. 2018, 24, 1558–1572. [Google Scholar] [CrossRef]
  58. Huang, L.; Huang, S.; Lai, Z. On the optimization of site investigation programs using centroidal Voronoi tessellation and random field theory. Comput. Geotech. 2020, 118, 103331. [Google Scholar] [CrossRef]
  59. Lin, Y.; Wang, X.; Ma, J.; Huang, L. A finite-discrete element based appoach for modelling the hydraulic fracturing of rocks with irregular inclusions. Eng. Fract. Mech. 2022, 261, 108209. [Google Scholar] [CrossRef]
  60. Lin, Y.; Ma, J.; Lai, Z.; Huang, L.; Lei, M. A FDEM approach to study mechanical and fracturing responses of geo-materials with high inclusion contents using a novel reconstruction strategy. Eng. Fract. Mech. 2023, 282, 109171. [Google Scholar] [CrossRef]
  61. Zhang, J.; Wang, M.; Xi, C. Prediction and Evaluation of Rockburst Based on Depth Neural Network. Adv. Civ. Eng. 2021, 2021, 8248443. [Google Scholar] [CrossRef]
  62. Xue, Y.; Bai, C.; Qiu, D.; Kong, F.; Li, Z. Predicting rockburst with database using particle swarm optimization and extreme learning machine. Tunn. Undergr. Space Technol. 2020, 98, 103287. [Google Scholar] [CrossRef]
  63. Lan, T.; Fan, C.; Li, S.; Zhang, H.; Batugin, A.S. Probabilistic Prediction of Mine Dynamic Disaster Risk Based on Multiple Factor Pattern Recognition. Adv. Civ. Eng. 2018, 2018, 7813931. [Google Scholar] [CrossRef]
  64. Singha, D.K.; Chatterjee, R. Geomechanical modeling using finite element method for prediction of in-situ stress in Krishna–Godavari basin, India. Int. J. Rock Mech. Min. Sci. 2015, 73, 15–27. [Google Scholar] [CrossRef]
Figure 1. In-situ stress measurement results.
Sustainability 15 14808 g001
Figure 2. Flowchart of in-situ stress inversion.
Sustainability 15 14808 g002
Figure 3. Numerical models.
Sustainability 15 14808 g003
Figure 4. Numerical models of the eight prospecting lines in the Hegang mining area.
Sustainability 15 14808 g004
Figure 5. Rockburst risk-zone division of coal seam #3.
Sustainability 15 14808 g005
Table 1. Stratigraphic characteristics of the Hegang mining area.
Rock StratumThickness/mHistogramLithology Description
sandstone80Sustainability 15 14808 i001Mainly fine grey sandstone, intercalated thin conglomerate and black–grey siltstone
#3 coal3.5Sustainability 15 14808 i002Coal
sandstone50Sustainability 15 14808 i003Fine siltstone interbedding, grey horizontal bedding
#7 coal3.0Sustainability 15 14808 i004Coal
fine sandstone40.0Sustainability 15 14808 i005Fine sandstone, light grey
#8 coal1.43Sustainability 15 14808 i006Coal
medium-grained sandstone8.0Sustainability 15 14808 i007Medium-grained sandstone with fine siltstone
#9 coal0.8Sustainability 15 14808 i008Low-quality coal
sandstone25Sustainability 15 14808 i009Mainly fine sandstone with medium-grained sandstone in the upper part, coarse- to medium-grained sandstone with fine sandstone in the lower part
#10 coal0.6Sustainability 15 14808 i010Coal; poor quality at the top, good quality at the bottom
sandstone18Sustainability 15 14808 i011Fine sandstone in the upper and lower parts and medium sandstone in the middle part, light grey–white grey
#11 coal1Sustainability 15 14808 i012Coal, containing layers of rock
sandstone23Sustainability 15 14808 i013Medium-grained sandstone and fine sandstone, with a thin siltstone layer
#12 and #13 coal6Sustainability 15 14808 i014Coal, possible ash siltstone in the middle
sandstone20Sustainability 15 14808 i015Coarse, medium-grained sandstone with fine siltstone; grey to light grey
#15-1 coal9Sustainability 15 14808 i016Coal; coal–shale interbed at the top, with several intercalated layers of rock
fine sandstone55Sustainability 15 14808 i017Fine sandstone
#15-2 coal3.5Sustainability 15 14808 i018Good-quality, hard coal
sandstone2Sustainability 15 14808 i019Siltstone and medium sandstone, all grey–white
#18-1 coal3.6Sustainability 15 14808 i020Coal; the quality of the lower part is good, with a thin layer of fine sandstone, brown and contains water
sandstone38Sustainability 15 14808 i021Fine and medium sandstone, with siltstone
#18-2 coal4.55Sustainability 15 14808 i022Coal
fine sandstone25Sustainability 15 14808 i023Fine sandstone
#18-2-2 coal1.1Sustainability 15 14808 i024Coal
sandstone6Sustainability 15 14808 i025Siltstone, fine sandstone, sandstone, coarse sandstone; mostly grey
#18-3 coal1.5Sustainability 15 14808 i026Coal, semi-bright, hard
sandstone25Sustainability 15 14808 i027Siltstone in the upper part and fine sandstone in the lower part
#21 coal1.5Sustainability 15 14808 i028Coal, semi-bright, brown locally
sandstone20Sustainability 15 14808 i029Fine sandstone in the upper and lower parts and coarse sandstone in the middle, with poor sorting and local gravel
#22 coal6.4Sustainability 15 14808 i030Coal with two layers of fine sandstone and rock
sandstone40Sustainability 15 14808 i031Fine siltstone intertexture
#27 coal3.3Sustainability 15 14808 i032Good-quality coal containing beaded inclusion stones
sandstone22Sustainability 15 14808 i033Fine siltstone interbedded
#29-1 coal0.6Sustainability 15 14808 i034Coal
fine sandstone8Sustainability 15 14808 i035Fine sandstone
#29-2 coal2.03Sustainability 15 14808 i036Coal
fine sandstone5Sustainability 15 14808 i037Fine sandstone
#29-3 coal2.68Sustainability 15 14808 i038Low-quality coal
sandstone15Sustainability 15 14808 i039Fine sandstone, medium sandstone
#30 coal5.6Sustainability 15 14808 i040Coal, containing several layers of rock
sandstone30Sustainability 15 14808 i041Fine, silty sandstone in the upper part; coarse, coarse sandstone in the lower part, with glutenite
#31 coal1.7Sustainability 15 14808 i042Low-quality coal
sandstone35Sustainability 15 14808 i043Medium sandstone, coarse sandstone, fine sandstone
#32 coal1.6Sustainability 15 14808 i044Low-quality coal
sandstone28Sustainability 15 14808 i045Fine sandstone, gravel, coarse sandstone, fine sandstone, conglomerate
#33 coal1.69Sustainability 15 14808 i046Low-quality coal
sandstone30Sustainability 15 14808 i047Fine sandstone, medium sandstone, tuffaceous siltstone, medium sandstone
#34 coal2Sustainability 15 14808 i048Low-quality coal
sandstone30Sustainability 15 14808 i049Tuffaceous siltstone, fine sandstone, coarse sandstone, tuffaceous siltstone
#35 coal0.7Sustainability 15 14808 i050Low-quality coal
fine sandstone35Sustainability 15 14808 i051Mainly fine sandstone with some tuff mudstone
#36 coal0.8Sustainability 15 14808 i052Low-quality coal
siltstone035Sustainability 15 14808 i053Tuffaceous siltstone
Table 2. Physical and mechanical parameters of representative prospecting lines in the Hegang mining area.
No.LithologyBulk Density
(kg/m3)
Bulk Modulus
(GPa)
Shear Modulus
(GPa)
Tensile Strength
(MPa)
Cohesive Force
(MPa)
Internal Friction Angle
(deg)
1Sandstone26302.191.870.011.21136
2Coal Seam13801.050.950.0150.18842
3Fault13020.0360.0660.0010.00730
Table 3. Summary of the model load statistics.
Prospecting LineAverage Elevation
(m)
Upper Boundary Burial Depth
(m)
Average Bulk Density
(N·m−3)
Upper Boundary Load
(MPa)
Horizontal Load Gradient Equation (m)
a2543040.0288.72.82 + 0.044 h
b2593090.0288.82.82 + 0.044 h
c2663160.0309.431.1
d2853350.0268.812.27 + 0.033 h
e2903400.0279.211.94 + 0.029 h
f3303800.02710.21.31 + 0.048 h
g3103600.0238.520.3
h3303800.0249.18.82 + 0.018 h
Note: In this table, h is the burial depth, in meters.
Table 4. Comparison of the calculated and measured in-situ stress values in the Hegang mining area.
Measurement Point σ H σ v
Measured Value (MPa)Calculated Value (MPa)Relative ErrorMeasured Value (MPa)Calculated Value (MPa)Relative Error
JD#133.422331.18%21.161624.39%
JD#222.87230.57%13.2131.52%
JD#332.51650.77%17.49168.52%
XA#130.12516.94%23.611632.23%
XA#232.722620.54%24.031633.42%
XA#330.481647.51%13.95140.36%
FL#135.92822.01%21.671816.94%
FL#239.22828.57%18.69207.01%
FL#341.23027.18%22.372010.59%
XL#139.64369.18%26.142215.84%
XL#239.793219.58%27.932221.23%
XL#335.492626.74%20.981814.20%
NS#127.878280.44%14.223141.57%
NS#225.729261.05%14.438143.03%
NS#323.892240.45%12.946127.31%
NS#431.8132521.42%17.258167.29%
NS#525.576261.66%13.435133.24%
YX#121.72619.82%13.6142.94%
YX#219.01236.84%13.41619.40%
YX#320.3201.48%12.01416.67%
XS#117.9180.56%11.7122.56%
XS#221.61816.67%15.761411.17%
XS#318.6183.23%11.10128.11%
XS#414.7144.76%11.11128.01%
Table 5. Minimum energy required for dynamic failure of the coal–rock mass due to rockburst in the Hegang mining area.
Coal SeamCompressive Strength
(MPa)
Elastic Modulus
(GPa)
Minimum Energy
(J)
#313.5119.0010,141.51
Yixin #314.5829.0011,813.04
Table 6. Measurement results for the coal rockburst tendency.
Coal SeamIndexMeasurement Results
DTWETKERcClassificationName
Yinxin #313562.9256.68414.582IIIstrong tendency
Disclaimer/Publisher’s Note: The statements, opinions and data contained in all publications are solely those of the individual author(s) and contributor(s) and not of MDPI and/or the editor(s). MDPI and/or the editor(s) disclaim responsibility for any injury to people or property resulting from any ideas, methods, instructions or products referred to in the content.

