Article

An Assessment Framework for Human Health Risk from Heavy Metals in Coal Chemical Industry Soils in Northwest China

1
School of Environmental Science and Engineering, Tianjin University, Tianjin 300072, China
2
China Geo-Engineering Corporation, Beijing 100093, China
3
School of Chemical and Environmental Engineering, China University of Mining & Technology (Beijing), Beijing 100083, China
*
Author to whom correspondence should be addressed.
Sustainability 2023, 15(20), 14768; https://doi.org/10.3390/su152014768
Submission received: 19 September 2023 / Revised: 7 October 2023 / Accepted: 10 October 2023 / Published: 11 October 2023
(This article belongs to the Special Issue Environmental Exposure, Risk Assessment and Public Health)

Abstract

:
Coal chemical industry (CCI) sites are characterized by complex environmental media, combined heavy metal pollution, and diverse exposure routes. However, existing human health risk assessment (HHRA) methods have multiple drawbacks, such as their small scope of application, limited assessment factors, and insufficient case applications. After 128 soil samples were collected, the contents of Be, V, Ni, Cu, Zn, As, Cd and Hg in the soils were analyzed based on general risk assessment guideline of China. Then, risk levels were calculated based on oral ingestion, skin contact and inhalation as the main exposure routes to compare and screen priority heavy metals. Furthermore, control values were identified through a contribution rate calculation model when CR > 10−6 or HQ > 1. As reference values, risk thresholds were proposed for heavy metals, and then a soil HHRA framework for the CCI site was constructed. Under the three exposure routes, the total CR was As > 10−6, and the total HQ was 1 > As > Cd; the HHRs related to As and V via the oral ingestion, dermal contact, and inhalation pathways were 76.67%, 13.13%, and 10.18% and 1.66%, 0, and 98.34%, respectively. The risk control value of As was 1.59 mg/kg and that of V was 25.1 mg/kg. Based on these results, the threshold values for priority heavy metals should be based on comprehensive considerations of the elemental background of a specific area, the contaminant criteria in different areas, the regional industrial development plan, and the most important control criterion, as well as the control value. Through the development of an HHRA framework and case verification, the authors of this article aim to guide CCI managers in screening priority heavy metals, formulating protection measures, developing improved operational procedures and improving the HHRA system for polluted CCI sites.

1. Introduction

Four chemical processing technologies, namely, coal coking, coal gasification, coal liquefaction, and coal pyrolysis [1], are applied in the coal chemical industry (CCI). Pollution problems associated with CCI need to be urgently addressed, as coal is used to produce energy in a variety of industrial processes [2]. Environmental problems related to CCI sites can be roughly divided into three categories: (1) gaseous waste production, including CO2, a greenhouse gas [3,4], methanol [5], and coke oven gas [6]; (2) wastewater production, including coking wastewater [7] and high-salt wastewater [7,8,9,10,11,12]; and (3) soil pollutants, including soil PAHs [13,14,15] and heavy metals [16,17]. Among the three types of CCI pollution, pollution of soil, which is the ultimate receptor of all types of pollutants, is characterized by long contamination times and complex environmental media, and the remediation technologies for soil pollution are underdeveloped. Compared with the two other types of environmental problems, soil pollution and remediation technologies have received little attention from researchers. Soil pollution from CCIs directly harms microorganisms and other organisms [18] and indirectly threatens environmental health through pollutant accumulation in crops and transmission through the food chain [6,19], and finally causes risk, which can be concepted as the possibility of suffering damage or harm, to human body characterizing as carcinogenic and non-carcinogenic risks. To quantitatively characterize the health hazards of pollutants [20,21], it is necessary to bring together knowledge and techniques from chemistry, physiology, mathematics, medicine and other related disciplines to reveal the pollution sources affecting biological and environmental receptors [22] and to formulate a human health risk assessment (HHRA) method that includes hazard identification, exposure assessment, toxicity assessment, and risk characterization [23,24,25,26,27].
Some countries or regions have developed HHRA systems or requirements. For example, the EU and many nations clearly require the use of HHRAs as the first step in the selection of locations for industrial plants [28]. At present, HHRA is widely used in many fields, such as in the assessment of industrial field soils [23,24,29,30], agricultural field soils [31,32,33,34,35,36] and residential site soils [28,37]. It is particularly used for industrial field soils, which has resulted in the generation of various methods and complete evaluation objects. Based on the Technical guidelines for risk assessment of soil contamination of land for construction (HJ25.3-2019) [38] formulated by the Ministry of Environmental Protection of China, Hu et al. identified carcinogenic risks associated with oilfield waste with respect to PAHs and heavy metals (As, Cd, Cu, Cr, Ni, Zn), the main exposure routes, and high-risk areas [25]. Li et al. applied the USA’s environmental protection agency (USEPA) (2014, 1015) reference concentration (RfC) and respiratory unit risk (RUR) to identify the HHR risks of As, Ba, Cd, Co, Cr, Mn, Ni, Pb, Se, and V via the respiratory inhalation of atmospheric particulates from the Great Lakes Industrial Base [39].
However, there are still no HHRA systems or frameworks for CCI site soils. Additionally, there are no advanced HHRA methods that can be used to estimate soil contamination in CCI areas. To address pollution problems in CCI areas and develop an effective and reliable HHRA method, some researchers have carried out HHRA work in CCI areas based on the existing HHRA technical guidelines. For example, based on the Technical guidelines for risk assessment of soil contamination of land for construction (HJ25.3-2019), some work was carried out, and this included coal mine areas, storage sites for solid waste from coal gasification plants, thermal power plants, and coking plant sites. The health risk levels of As, Cd, Be, Ni, Hg and F were analyzed based on general methods and processes. Most of these HHRAs in CCI environments were conducted by the direct application of the existing technical guidelines, and they failed to fully consider the scope of application of the method, environmental media, and target pollutants. Additionally, shortcomings exist in the assessments: the datasets are small, only a small number of pollutants are considered, and no special exposure pathways are included; therefore, the conclusions are not convincing [40,41]. Thus, it is necessary to formulate an HHRA framework that is applicable to CCI environments and includes the selection of polluted areas and the environmental media and pollutants representing a CCI to allow for comprehensive data analysis.
Coal gasification plants are typical CCI-contaminated sites, and heavy metal quantification in soils can be used to characterize the HHR of polluted environments in these industrial areas [42]. To construct an HHRA framework for CCI sites, the HHR (carcinogenic risk CR and hazard quotient HQ) of typical heavy metals (Be, V, Ni, Cu, Zn, As, Cd, Hg) was calculated according to the Technical guidelines for risk assessment of soil contamination of land for construction (HJ25.3-2019). Then, the distribution of priority heavy metal HHRs among exposure routes and HHR distribution along a longitudinal sampling profile were characterized, and risk thresholds for priority heavy metals were proposed. As a reference system, the HHRA framework could be used to guide managers at CCI sites to screen for risks, develop protection measures, formulate pollution remediation strategies and implement control steps for high-risk heavy metals in CCI sites.

2. Materials and Methods

2.1. Overview of the Study Area

Coal gasification plants, which are major CCI sites [2,5,6,8,43,44,45,46,47], are important representative industrial sites for studying the status of CCI pollution. To this end, the authors chose a coal gasification plant in Northwest China (38°10′08″ N, 106°3′45″ E) as the study area, which is located at the edge of the Mausu Desert and is in a temperate arid climatic zone. The coal gasification plant mainly consists of three gasification workshops.
Soil samples were collected from the coal gasification plant from the coal cinder composite point of the site. Sampling points were selected along a longitudinal profile in the southeast direction, and samples were collected at distances of 0 m, 10 m, 50 m, 80 m, and 150 m along the longitudinal profile. The vertical sampling area was divided into a surface layer (0~20 cm), a middle layer (20~35 cm) and a bottom layer (35~50 cm). After the samples were collected, they were placed in zip lock bags, stored in a low-temperature incubator, transferred to a refrigerator, and finally sent to a laboratory for analysis.

2.2. Methods for Detecting Heavy Metals in Soil Samples

The soil samples were dried in an oven for 8 h at 105 °C and then sieved to a 200 mesh size. Soil samples measuring 0.5 g were placed in a microwave digestion tank. HNO3 and H2O2 were added, and then digestion was performed. The digested samples were kept in a thermostatic drying oven at 120–140 °C for 3–4 h and cooled to room temperature, and then the digested solution was placed in a 10 mL volumetric flask. Inductively coupled plasma-mass spectrometry (ICP-MS, ThermoScientific Xseries 2, Shenzhen, China) was used for the determination of Be, V, Ni, Cu, Zn, As, and Cd. A mercury meter was used for the determination of Hg.

2.3. HHRA Framework of CCI Soil

2.3.1. General Framework for HHRA of CCI Soils

An HHRA framework for CCI soils in Northwest China was developed in this study (Figure 1). Based on a screening of high-risk heavy metals, combined with land-use patterns and planning and metal contamination characteristics, a risk assessment was carried out on CCI soils. Then, an exposure assessment method was developed by identifying the specific exposure pathways and exposure parameters for CCI soils, and the exposure level was calculated. Additionally, toxicity parameters, including carcinogenic effects and noncarcinogenic effects, were identified. Based on these assessments, risk characterization of CCI soils could be performed to quantify carcinogenic risk and the hazard quotient based on three typical exposure routes, namely, direct ingestion, dermal contact, and inhalation. The risk assessment could be terminated if the total risk level determined was acceptable; otherwise, uncertainty analysis and heavy metal threshold values were identified. The risk threshold of heavy metals should be based on comprehensive considerations of land development and planning and the background value of elements at CCI sites to yield important soil risk control values for heavy metals.

2.3.2. HHR Calculation and Priority Heavy Metal Screening

The contaminated site selected is industrial land, which belongs to the second land use category. The risk receptors are the on-site managers of coal gasification plants [24]. Exposure pathway include soil oral ingestion, soil dermal contact and inhalation of soil particles. Exposure through the above exposure routes was calculated based on the model of the Technical Guidelines for Risk Assessment of Soil Pollution in Construction Land HJ 25.3-2019 and the recommended values in Appendix G of Technical guidelines for risk assessment of soil contamination of land for construction (HJ25.3-2019). Toxicity assessments were quantified by the carcinogenic slope factor (SF) and reference dose/concentration (RfD/RfC). There are four types of data sources and calculation methods [24]: (1) adopt the recommended values in Appendix B of Technical guidelines for risk assessment of soil contamination of land for construction (HJ25.3-2019); (2) adopt values reported in the literature [48]; (3) obtain values from the US EPA IRIS database [32]; or (4) obtain the inhalation slope factor for carcinogenicity (SFi), reference dose for inhalation (RfDi), dermal contact slope factor for carcinogenicity (SFd), and reference dose for dermal contact (RfDd) based on parameter extrapolation [25]. The HHR of heavy metals is quantified by the carcinogenic risk (CR) and the hazard quotient (HQ). The CR and HQ of pollutants through individual exposure pathways are calculated by the formula in Table 1, and the HHR of pollutants through multiple exposure pathways can be calculated by the summation of the respective values [23]. The formulas and data in Table 1, Table 2 and Table 3 are obtained from the Technical Guidelines for Risk Assessment of Soil Pollution in Construction Land HJ 25.3-2019.
The screening method for priority heavy metals involves the sorting and ordering of HHR values of heavy metals as calculated in the above steps and screening for heavy metals with CR > 10−6 or HQ > 1 [26,29] as the criteria. The screened heavy metals were selected and used for further analysis.
Table 1. Cancer risk and hazard quotient calculation formulas for three soil exposure pathways.
No.Exposure PathwayRisk TypeEquations
1Soil oral ingestionCarcinogenic risk C R o i s = O I S E R c a × C s u r × S F 0
2Hazard quotient H Q o i s = O I S E R n c   ×   C s u r R f D o   ×   S A F
3Soil dermal contactCarcinogenic risk C R d c s = D C S E R c a × C s u r × S F d
4Hazard quotient H Q d c s = D C S E R n c   ×   C s u r R f D d   ×   S A F
5Inhalation of soil particlesCarcinogenic risk C R p i s = P I S E R c a × C s u r × S F i
6Hazard quotient H Q p i s = P I S E R n c   ×   C s u r R f D i   ×   S A F
CRis—carcinogenic risk from oral ingestion, dimensionless; CRdcs—carcinogenic risk from dermal contact, dimensionless; CRpis—carcinogenic risk from inhalation of soil particles, dimensionless. HQois—Hazard quotient for oral ingestion, dimensionless; HQdcs—hazard quotient for dermal contact, dimensionless; HQpis—hazard quotient for inhalation of soil particles, dimensionless. Other abbreviations in the formulas in Table 1 are defined in Table 2.
Table 2. Major parameters in the characterization risk formulas.
ParameterImplicationValueUnit
O I S E R c a Predicted soil oral exposure (carcinogenic)4.18 × 10⁻⁷kg kg−1 d−1
C s u r Pollutant concentrationSee Table 4mg kg−1
S F o Oral ingestion slope factor for carcinogenicity1.5(mg kg−1 d−1)−1
O I S E R n c Predicted soil oral exposure (noncarcinogenic)1.21 × 10⁻⁶kg kg−1 d−1
R f D o Reference dose for oral ingestion3.00 × 10−4mg kg−1 d−1
S A F Soil exposure reference dose distribution coefficient0.2/
D C S E R c a Soil skin exposure dose (carcinogenic)7.17 × 10⁻⁸kg kg−1 d−1
S F d Skin contact slope factor for carcinogenicity1.5(mg kg−1 d−1)−1
D C S E R n c Soil skin exposure dose (noncarcinogenic)2.07 × 10⁻⁷kg kg−1 d−1
R f D d Reference dose for skin contact3.00 × 10−4mg kg−1 d−1
P I S E R c a Exposure dose for inhalation of soil particles (carcinogenic)4.95 × 10⁻⁹kg kg−1 d−1
S F i Inhalation slope factor for carcinogenicity16.84(mg kg−1 d−1)−1
P I S E R n c Soil particle inhale exposure dose (noncarcinogenic)1.43 × 10⁻⁸kg kg−1 d−1
R f D i Reference dose for inhalation3.83 × 10−6mg kg−1 d−1
Table 3. Formulas for calculating safety thresholds for the three soil exposure pathways.
No.Exposure PathwayRisk TypeEquations
9Soil oral exposureCarcinogenic risk R C V S o i s = A C R O I S E R c a   ×   S F o
10Hazard quotient H C V S o i s = R f D o   ×   S A F   ×   A H Q O I S E R n c
11Soil dermal contactCarcinogenic risk R C V S d c s = A C R D C S E R c a   ×   S F d
12Hazard quotient H C V S d c s = R f D d   ×   S A F   ×   A H Q D C S E R n c
13Inhalation of soil particlesCarcinogenic risk R C V S p i s = A C R P I S E R c a   ×   S F i
14Hazard quotient H C V S p i s = R f D i   ×   S A F   ×   A H Q P I S E R n c
ACR-Acceptable carcinogenic risk, dimensionless, 10−6. AHQ-acceptable hazard quotient, dimensionless, 1. RCVSdcs—Soil risk control values based on the carcinogenic effects of the oral ingestion route. HCVSois—Soil risk control values based on noncarcinogenic effects of the oral ingestion of soil pathway. RCVSdos—Soil risk control values based on carcinogenic effects of the dermal route of exposure. HCVSdcs—Soil risk control values based on the noncarcinogenic effects of dermal contact with the soil pathway. RCVSpis—Soil risk control values based on the carcinogenic effects of the inhalation of soil particulate matter pathway. HCVSpis—Soil risk control values based on the noncarcinogenic effects of the inhalation of soil particulate matter pathway.
Table 4. Pollutant concentrations.
Sampling SiteBeVNiCuZnAsCdHg
Distance (m),
Depth (cm)
(mg kg−1)
Office area1.3344.4730.9916.2237.916.360.260.008
0–201.0729.5323.1117.9228.784.710.250.003
020–351.1924.3617.6110.5527.723.180.220.005
35–501.2723.4414.6810.2520.973.100.160.003
0–201.5540.0929.3821.6723.055.260.220.002
1020–351.5830.7521.7116.5229.265.600.240.001
35–501.2619.9415.809.7417.533.000.150.001
0–201.1619.7313.808.9328.103.660.140.033
5020–351.1217.2612.298.0916.192.620.130.001
35–501.1220.8015.039.3518.223.080.140.001
0–201.1520.4613.269.0318.613.220.160.001
8020–351.1922.8413.849.3119.763.350.180.001
35–501.2933.4119.7615.3229.444.010.250.001
0–201.1021.9713.568.9019.033.240.150.001
15020–351.2429.2416.4610.8724.614.480.220.001
35–501.2533.8718.5013.0028.815.080.220.001

2.3.3. Distribution of HHR in Exposure Routes

To compare the distribution of heavy metal HHRs in each exposure route and guide coal gasification plant site managers in preventing risks related to heavy metal pollution, the distribution of HHR under each exposure route was calculated based on the identified main exposure routes of heavy metals with reference to the Technical Guidelines for Risk Assessment of Soil Pollution in Construction Land HJ 25.3-2019 contribution rate model:
P C R = C R i C R i × 100 %
P H Q i = H Q i H I n × 100 %
where PCRi, PHQi—the contribution rate of carcinogenic risk and the hazard quotient of an exposure pathway; Cri, HQi—the carcinogenic risk and hazard quotient of an exposure pathway, dimensionless; and CRn, HIn—the total carcinogenic risk or the total hazard quotient.

2.3.4. Spatial Distribution of HHR

To analyze the distribution trends in heavy metal HHR along the longitudinal section and guide measures to remediate and treat heavy metal pollution in the coal gasification plant soil, the HHR-related pollution trends were analyzed based on horizontal distance (0 m, 10 m, 50 m, 80 m and 150 m) along the longitudinal profile for heavy metal HHR. Based on the heavy metal HHR in the longitudinal profile surface layer (0~20 cm), middle layer (20~35 cm) and bottom layer (35~50 cm), the vertical pollution trend in HHR was analyzed. Finally, measures to remediate and treat heavy metal pollution were proposed.

2.3.5. Determination of the Risk Threshold Value

If a priority heavy metal shows values of CR > 10−6 or HQ > 1, that is, the heavy metal HHR is higher than the acceptable risk, it is necessary to propose a heavy metal risk threshold, which provides control targets for heavy metal pollution for site managers. Through the risk control value model in the Technical Guidelines for Risk Assessment of Soil Pollution in Construction Land HJ 25.3-2019, the control value for soil heavy metals was calculated. For strict risk control, the minimum control value of each exposure route was selected as the risk threshold value for heavy metals in soil. Under the three exposure routes, the formula for calculating the risk control value is shown in Table 3.

3. Results and Discussion

3.1. Screening of Priority Heavy Metals

The results are presented in Table 4. According to toxicity [26,48], the high-toxicity pollutants As, Cd, Be, Hg, and V and the low-toxicity heavy metals Cu, Zn, and Ni were selected from known pollutants in coal as target pollutants that were used for carrying out subsequent research. The office area of the plant was found to be more polluted than other sampling points due to combined pollution or the prevailing wind direction and other reasons.
There is no surface water around the CCI, and the groundwater is not used as drinking water, so groundwater exposure routes are not considered. The main exposure pathways for pollutants in soil are direct ingestion, dermal contact, and inhalation [41,49]. Moreover, CCI pollutants typically have low volatility, and these three exposure routes are the main exposure routes. Therefore, these three exposure routes were chosen to evaluate the HHR of pollutants. The literature [25,28,29,50] shows that an HHRA based on these three exposure routes can produce reliable assessment results.
Based on heavy metal toxicity parameters, the main exposure routes and HHR characterization models, the respective CR and HQ of heavy metals were calculated and ranked. Notably, although eight heavy metals and three main exposure routes were considered in the method, the toxicity parameters of heavy metals under each exposure route could not be obtained, and the HHR of other heavy metals could only be characterized by CR or HQ, except for As. The final results are shown in Figure 2. (1) When only respiratory inhalation exposure exists, the order of CR is V >10−6 > Ni > Be > Cd. (2) When there is only oral ingestion exposure, the order of HQ is 1 > Zn > Cu. (3) When both oral and inhalation exposure exist, the total HQ order is V(9/15) > 1 > V(6/15) > Ni > Be > Hg. (4) When the above three exposure routes are considered at the same time, the order for total CR is As > 10−6, and the order of the total hazard quotient was 1 > As > Cd.
Among the selected target pollutants, both V and As had HHRs exceeding acceptable risk levels in CCI soils. The oral ingestion exposure route had a higher level risk, which was a key consideration in the following risk characterization and contribution ratio calculations, even in the risk control step.

3.2. Distribution of HHR Based on Different Exposure Routes

Based on the priority heavy metals As and V, the respective HHR distribution of each of the three exposure pathways was analyzed. Under the three exposure routes, the As total CR was higher than the acceptable risk level. The pie chart shown in Figure 3a was constructed to show the risk contribution ratio for As. For V under the oral ingestion and respiratory inhalation exposure routes, the total HQ was higher than the acceptable risk level, including risk from the 0 m and 10 m surface layer, the 10 m and 150 m middle layer, and the 80 m and 150 m bottom layer. Based on these results, a pie chart was constructed, as shown in Figure 3b.
Figure 3 shows that under the three exposure routes of oral intake, dermal contact and inhalation, the As CR distributions were 76.67%, 13.13%, and 10.18%, respectively; under the same exposure routes, the HQ distributions of V were 1.66% and 0, 98.34%, respectively; and the CR of V under only the respiratory inhalation exposure route was higher than the acceptable risk level.
The data showed that As had toxicity related to volatilization, and its main transformation mechanism was the formation of As2O3 and As2O5, which enter the atmosphere and remain there or are enriched in coal gasification residues. In addition, when these compounds enter the human body, they can cause As poisoning in the body. V is an easily absorbed toxic substance that enters the body and causes poisoning of the human intestine, heart, and nervous system. V is mostly distributed via the respiratory inhalation route, and it can irritate the human respiratory system and cause cancer [51].
The above analysis showed that the strict prevention of soil intake via the mouth and nose and mask wearing could be crucial protective measures for on-site staff, which are the most important receptors to the heavy metals in soils of the CCI sites.

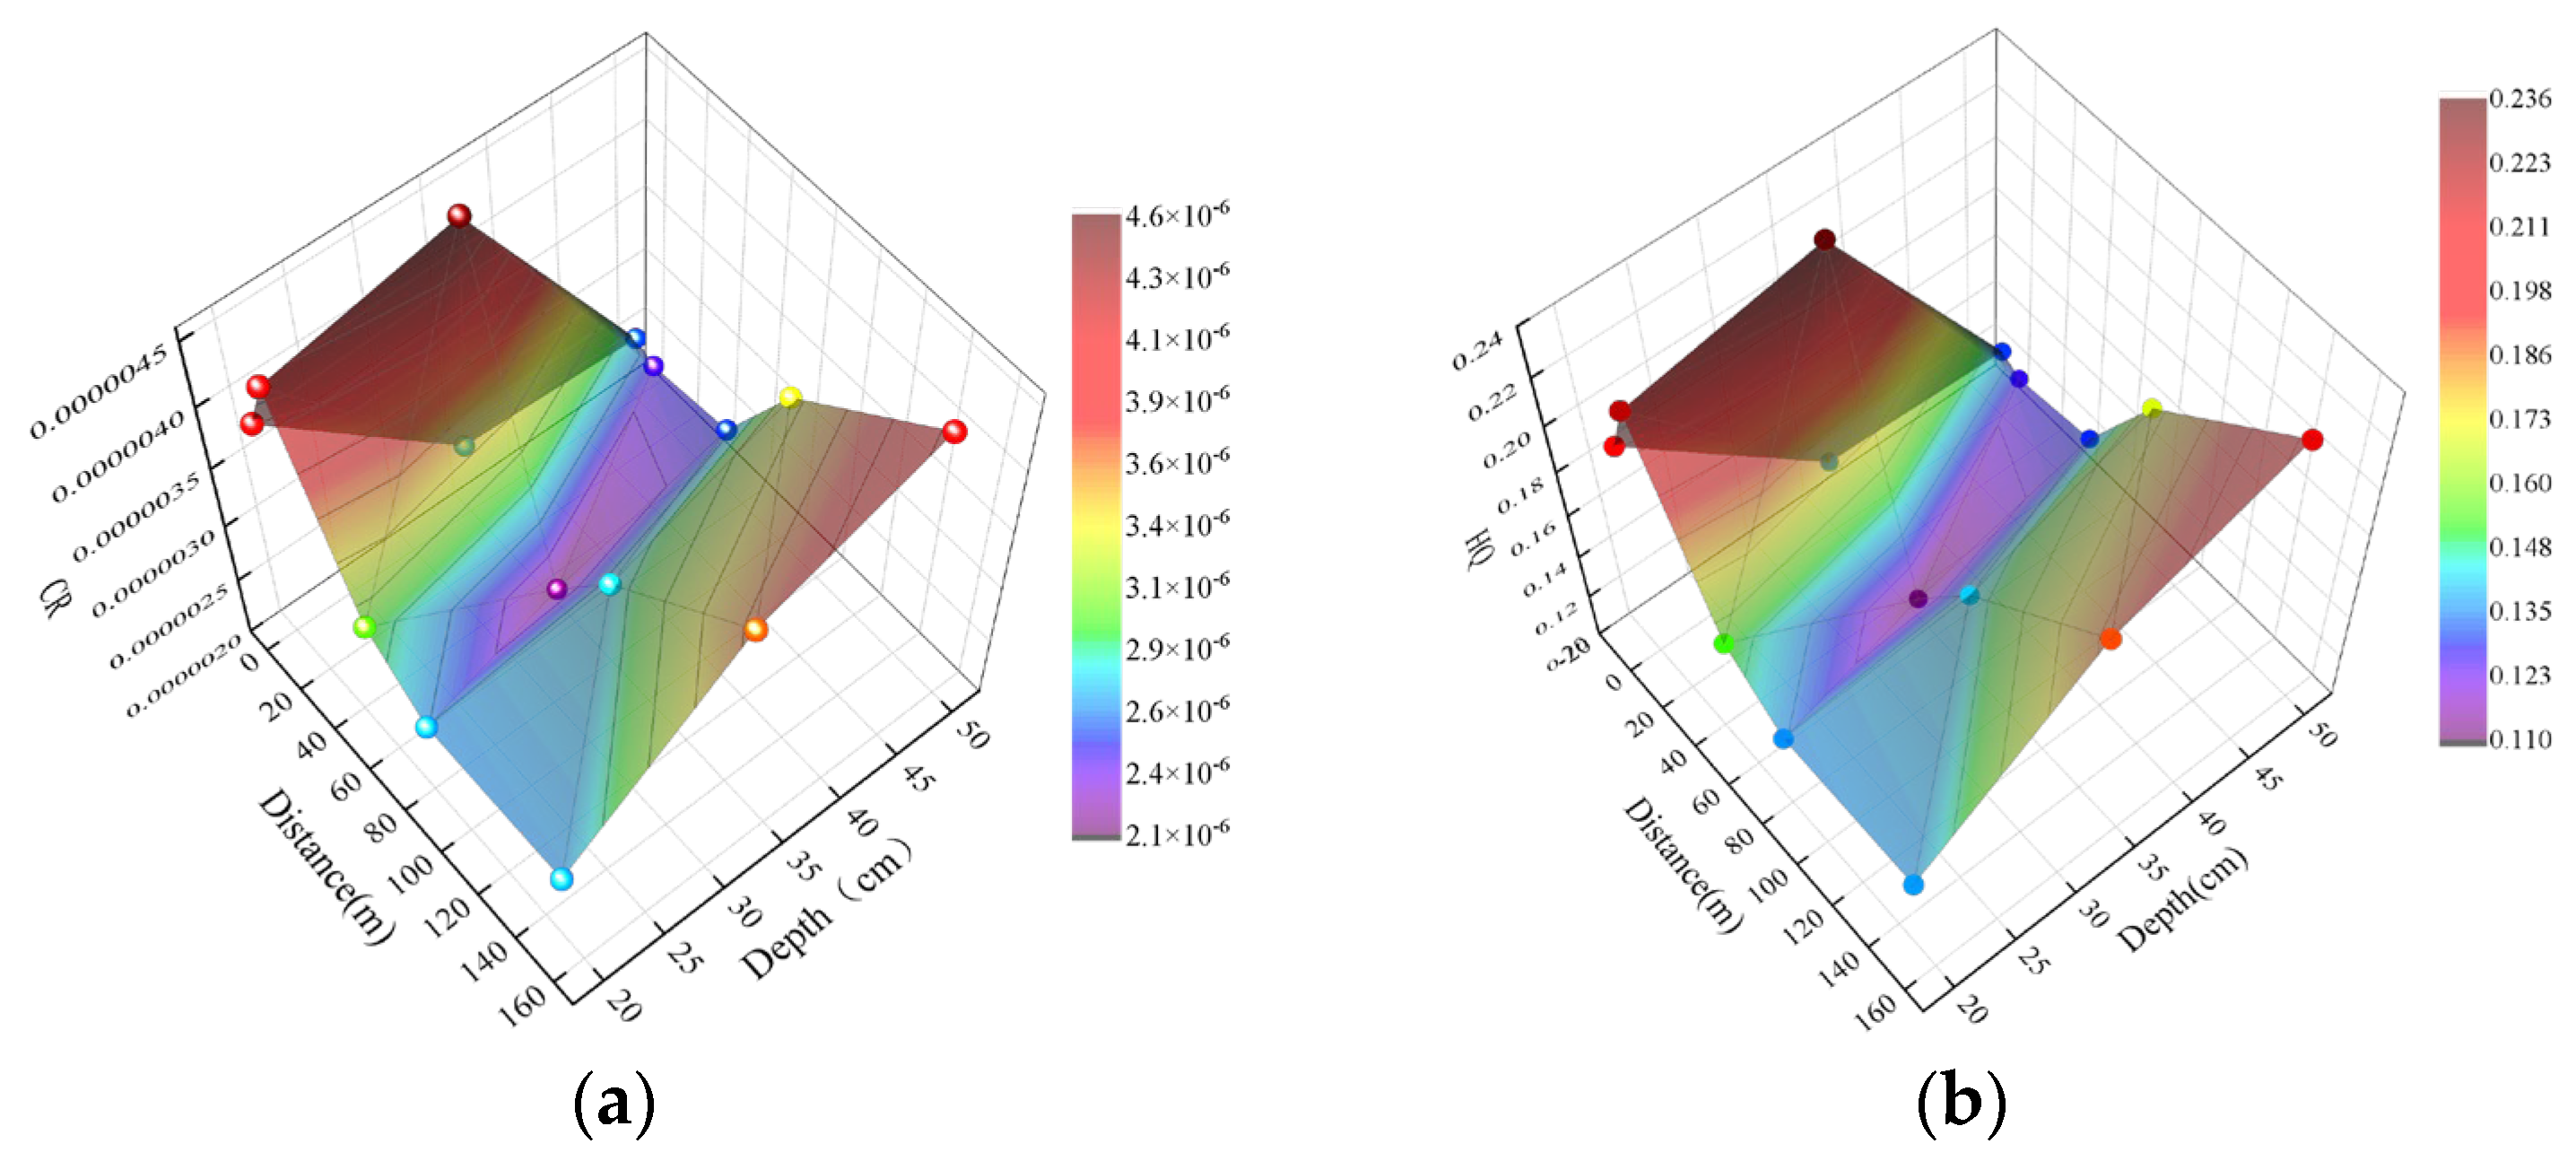
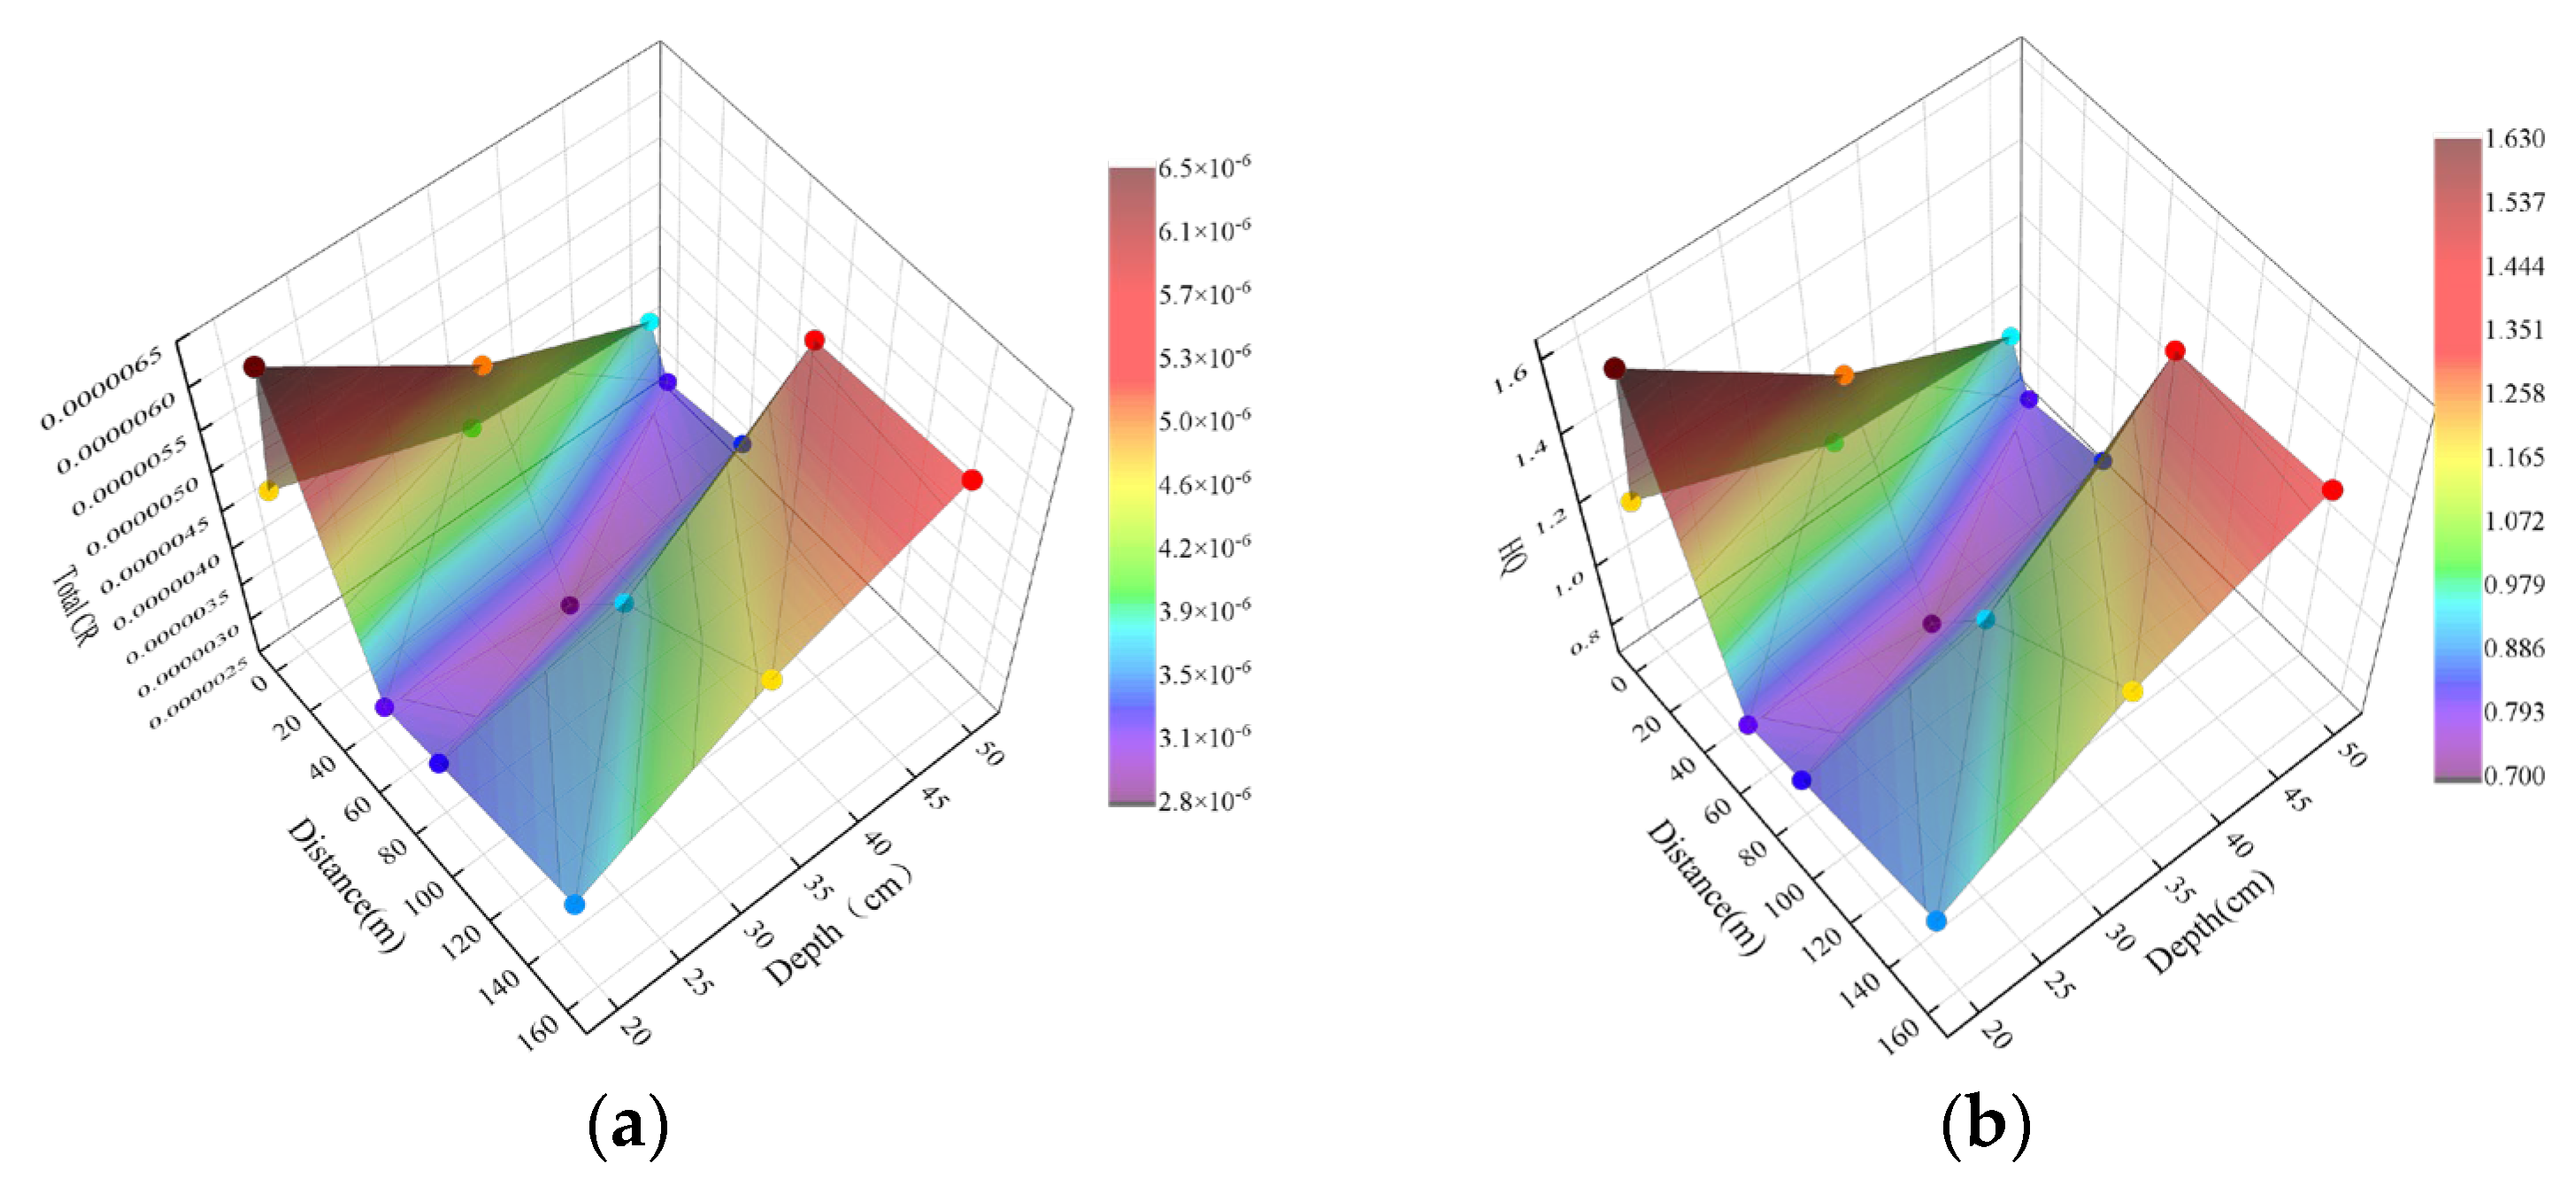
3.3. Spatial Distribution of HHR

To understand the spatial distribution trends in the priority heavy metal HHR, the method described in Section 2.3.3 was used to analyze the distribution of the respective HHRs of As and V along the longitudinal sampling section and predict the respective spatial distribution trends.
As shown in Figure 4, the total CR of As varies from 2.14 × 10⁻⁶ to 4.59 × 10⁻⁶, the CR at each sampling point is higher than the acceptable risk level (1.00 × 10⁻⁶), and the maximum value is 4 times the standard value. In the horizontal direction, in the surface layer and middle layer of the longitudinal section, HHR first increases and then decreases. Along the horizontal section from 0 to 10 m, CR and HQ gradually increased from 2.61 × 10⁻⁶~4.59 × 10⁻⁶ and 1.34 × 10⁻¹~2.36 × 10⁻¹, respectively; from 10 to 150 m, CR and HQ gradually decreases from 4.59 × 10⁻⁶ to 2.14 × 10⁻⁶ and 1.89 × 10⁻¹ to 1.10 × 10⁻¹, respectively; and at the bottom of the longitudinal section, HHR first decreases and then increases. From 0 to 10 m, CR and HQ gradually decreases from 2.54 × 10⁻⁶ to 2.45 × 10⁻⁶ and 1.31 × 10⁻¹ to 1.26 × 10⁻¹, respectively. From 10 to 150 m, CR and HQ gradually increase from 2.45 × 10⁻⁶~4.16 × 10⁻⁶ and 1.26 × 10⁻¹~2.14 × 10⁻¹, respectively. In general, the above trends follow the regular patterns of rainfall leaching and soil boundaries. A peak appears at the 150 m position in the bottom soil. In the vertical direction, with increasing depth, the total CR and HQ gradually decrease in the range of 0~50 m and are 4.59 × 10⁻⁶~2.14 × 10⁻⁶ and 2.22 × 10⁻¹~1.10 × 10⁻¹, respectively. This trend agrees with generally accepted patterns; that is, the degree of pollution decreases with increasing depth. In the range of 50~150 m, the total CR and HQ continue to increase with increasing depth, which is 2.14 × 10⁻⁶~4.16 × 10⁻⁶ and 1.10 × 10⁻¹~2.14 × 10⁻¹, respectively. The analysis shows that around the target point (within 50 m), As pollution is mainly concentrated at the surface; far from the target point (beyond 80 m), As pollution is mainly concentrated in the deep soil.
Therefore, near the target point, the surface layer should be the focus of As pollution control measures, and away from the target point, As pollution control measures should be focused on the bottom layer.
As shown in Figure 5, the CR of V ranges from 2.78 × 10⁻⁶ to 6.45 × 10⁻⁶, the maximum value is 6 times the acceptable risk, the minimum value is 2 times the standard value, and the range of HQ is 7.01 × 10⁻¹~1.63 × 100. In the horizontal direction, in the surface layer and middle layer of the longitudinal section, the horizontal range is 0–50 m, and the trend in the CR and HQ of V shows an increase (3.92 × 10⁻⁶~6.45 × 10⁻⁶, 9.88 × 10⁻¹~1.63 × 100) and then a decrease (6.45 × 10⁻⁶~2.78 × 10⁻⁶, 1.63 × 100~7.01 × 10⁻¹); at the bottom of the longitudinal section, in the horizontal range of 0–50 m, the trend in the CR and HQ of V shows a decrease (3.77 × 10⁻⁶~3.21 × 10⁻⁶, 9.51 × 10⁻¹~8.08 × 10⁻¹) and then an increase (3.21 × 10⁻⁶~3.35 × 10⁻⁶, 8.08 × 10⁻¹~8.44 × 10⁻¹); in the range of 50~150 m, the CR and HQ of V show a continuous increase, ranging from 2.78 × 10⁻⁶ to 5.45 × 10⁻⁶ and then an increase (7.01 × 10⁻¹ to 1.37 × 100). In the vertical direction, with increasing depth, in the range of 0~50 m, the trends in the CR and HQ of V show a gradual decrease from 6.45 × 10⁻⁶~2.78 × 10⁻⁶ and 1.63 × 100~7.01 × 10⁻¹, respectively. Within the range of 50~150 m, the trends in the CR and HQ of V show continuous increases at 2.78 × 10⁻⁶~5.45 × 10⁻⁶ and 7.01 × 10⁻¹~1.37 × 100, respectively.
The above analysis shows that V, which exhibits high levels of pollution in this area, has both carcinogenic risk and an appreciable hazard quotient, and the carcinogenic risk is 6 times higher than the acceptable risk level criteria. Therefore, within a distance of 50 m from the sampling point, the focus of V pollution control measures should be the surface layer; outside a range of 50 m from the sampling point, the focus of V pollution control measures should be the surface and bottom layers.
When controlling the human health risks of heavy metals in actual CCI sites, the overall risk levels of various heavy metals including As and V in different layers should be considered, in order to provide a comprehensive layered control strategy for soil heavy metals. Then, as a comprehensive consideration of risk control, we should combine different levels of spatial distribution, exposure pathways, and exposure time of different risk receptors to achieve the ultimate goal of protecting human health.

3.4. Risk Threshold Value Recommendations

Based on the method proposed in this study, an As control value of 1.59 mg kg−1 is recommended, which is calculated from the oral ingestion exposure pathway [52]. To strictly control heavy metal pollution risk, the As risk threshold value could be set to 1.59 mg kg−1, and the V risk threshold could be set to 25.1 mg kg−1. However, the threshold value should be identified based on comprehensive considerations of the elemental background of a specific area, the contaminant criteria based on different areas, the regional industrial development plan, and the most important control criterion.

4. Conclusions

(1)
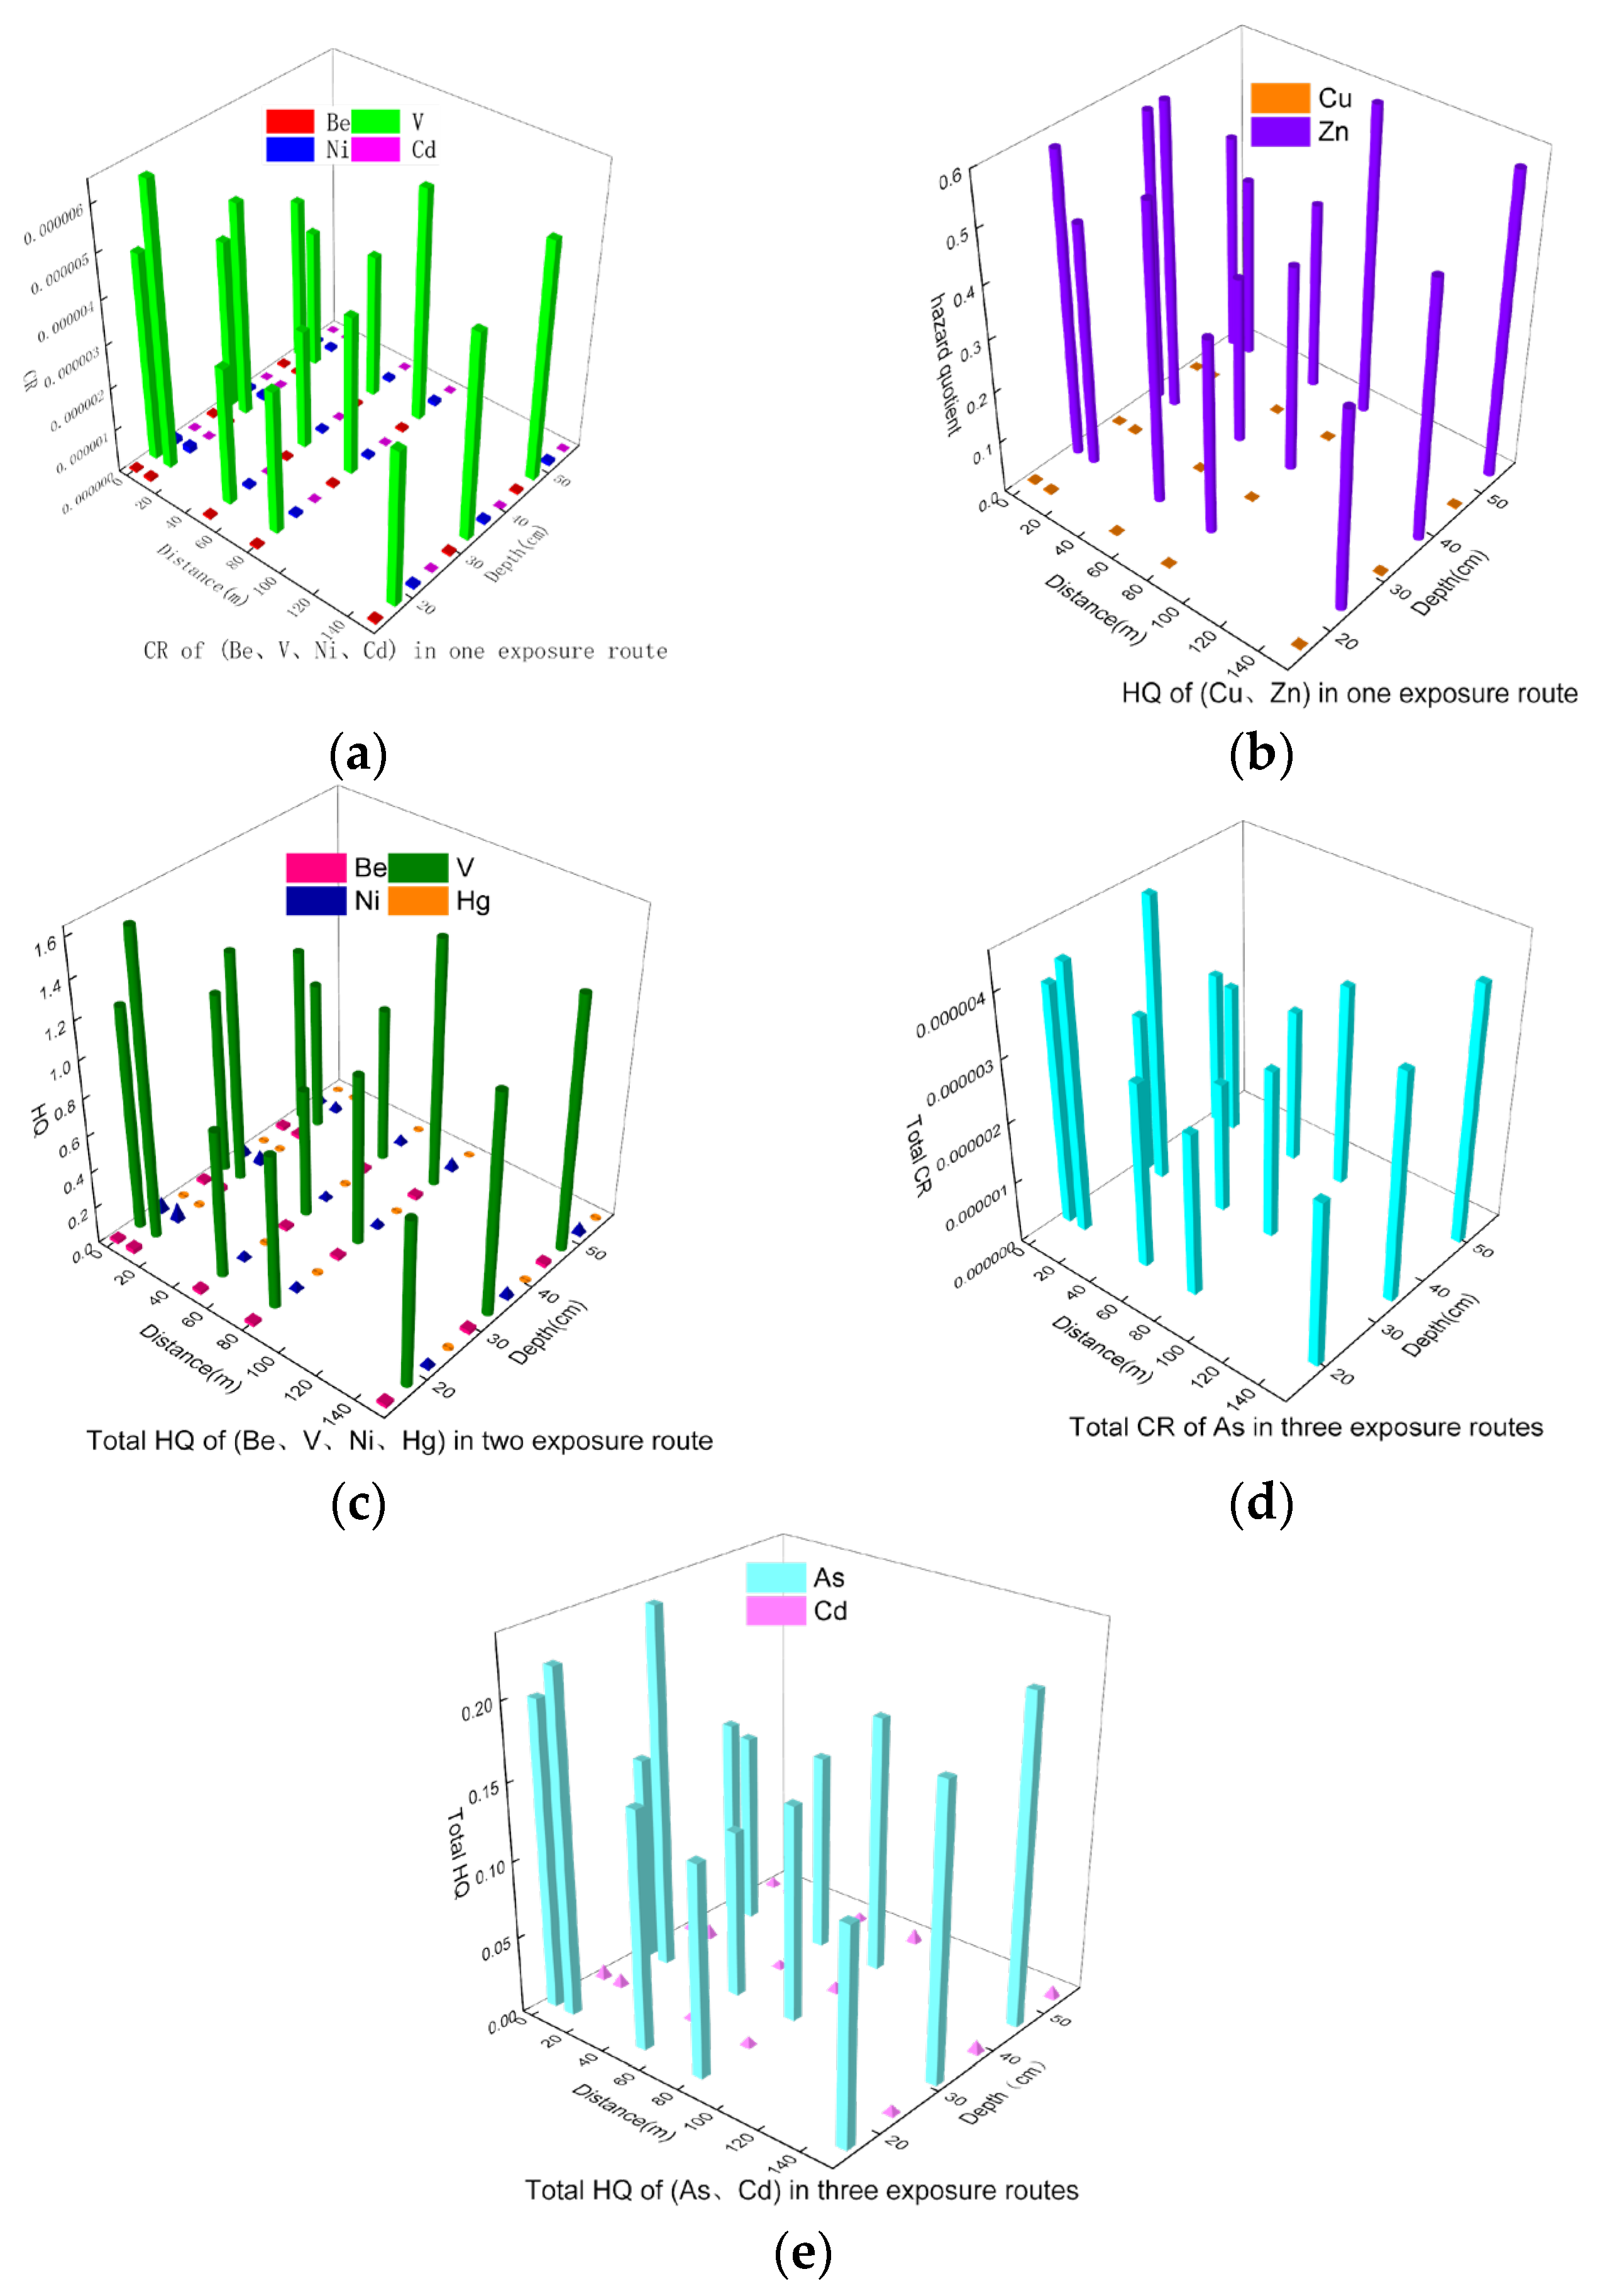
Oral ingestion, dermal contact and inhalation are the main three exposure routes for HHR in CCI site soils. Comparison of HHRs for As, Cd, Be, Hg, V, Cu, Zn, and Ni under various exposure routes showed that only the CRs for V and As and some HQs for V were higher than the acceptable risk level, and the HHRs of other heavy metals were lower than the acceptable HHR. Therefore, As and V were screened as the priority heavy metals in the CCI soil. Under the respiratory inhalation exposure route, the order of CR was V > 10−6 > Ni > Be > Cd; under the three exposure routes, the total CR order was As > 10−6; under the oral ingestion and respiratory inhalation exposure routes, the total HQ order was V(9/15) > 1 > V(6/15) > Ni > Be > Hg.
(2)
According to the three main exposure routes of the priority heavy metals, the CR of As was 76.67%, 13.13%, and 10.18% from oral ingestion, dermal contact, and inhalation, respectively. This indicated that risk managers at the CCI site should strictly prevent oral and nasal intake. Therefore, mask wearing and working hours limits should be established to protect staff against oral ingestion and inhalation exposure.
(3)
To strictly control heavy metal risk, a risk threshold value of 1.59 mg kg−1 for As and 25.1 mg kg−1 for V should be set based on the analysis of control values of heavy metals under the three exposure routes of oral intake, dermal contact and inhalation. However, the threshold value should be identified based on comprehensive considerations of the elemental background of a specific area, the contaminant criteria based on different areas, the regional industrial development plan, and the most important control criterion, in addition to the control value. According to the HHR framework for heavy metals proposed in this research, environmental management, remediation, and land reuse projects can be undertaken at CCI sites to make the sites safer in the future.

Author Contributions

Methodology, W.W.; writing—original draft, Y.Z.; data curation, Y.M.; investigation, C.G.; supervision, J.J. All authors have read and agreed to the published version of the manuscript.

Funding

This research received no external funding.

Institutional Review Board Statement

Not applicable.

Informed Consent Statement

Not applicable.

Data Availability Statement

Not applicable.

Conflicts of Interest

The authors declare no conflict of interest. The funding agencies had no role in the design of the study; in the collection, analyses, or interpretation of data; in the writing of the manuscript; or in the decision to publish the results.

References

  1. Li, H.; Zhou, H.; Liu, K.; Gao, X.; Li, X. Retrofit application of traditional petroleum chemical technologies to coal chemical industry for sustainable energy-efficiency production. Energy 2021, 218, 119493. [Google Scholar] [CrossRef]
  2. Shi, J.; Xu, C.; Han, Y.; Han, H. Case study on wastewater treatment technology of coal chemical industry in China. Crit. Rev. Environ. Sci. Technol. 2020, 51, 1003–1044. [Google Scholar] [CrossRef]
  3. Ma, S.; Chen, G.; Guo, M.; Zhao, L.; Han, T.; Zhu, S. Path analysis on CO2 resource utilization based on carbon capture using ammonia method in coal-fired power Plants. Renew. Sustain. Energy Rev. 2014, 37, 687–697. [Google Scholar] [CrossRef]
  4. Liu, H.; Ren, Y.; Wang, N. Energy efficiency rebound effect research of China’s coal industry. Energy Rep. 2021, 7, 5475–5482. [Google Scholar] [CrossRef]
  5. Wang, L.; Yan, F.; Wang, F.; Li, Z. FMEA-CM based quantitative risk assessment for process industries—A case study of coal-to-methanol plant in China. Process Saf. Environ. Prot. 2021, 149, 299–311. [Google Scholar] [CrossRef]
  6. Chen, J.; Yang, S.; Qian, Y. A novel path for carbon-rich resource utilization with lower emission and higher efficiency: An integrated process of coal gasification and coking to methanol production. Energy 2019, 177, 304–318. [Google Scholar] [CrossRef]
  7. Ban, Q.; Zhang, L.; Li, J. Correlating bacterial and archaeal community with efficiency of a coking wastewater treatment plant employing anaerobic-anoxic-oxic process in coal industry. Chemosphere 2022, 286, 131724. [Google Scholar] [CrossRef]
  8. Shi, J.; Huang, W.; Han, H.; Xu, C. Pollution control of wastewater from the coal chemical industry in China: Environmental management policy and technical standards. Renew. Sustain. Energy Rev. 2021, 143, 110883. [Google Scholar] [CrossRef]
  9. Shi, J.; Huang, W.; Han, H.; Xu, C. Review on treatment technology of salt wastewater in coal chemical industry of China. Desalination 2020, 493, 114640. [Google Scholar] [CrossRef]
  10. Li, W.; Zhang, M.; Wang, H.; Lian, J.; Qiang, Z. Removal of recalcitrant organics in reverse osmosis concentrate from coal chemical industry by UV/H(2)O(2) and UV/PDS: Efficiency and kinetic modeling. Chemosphere 2022, 287, 131999. [Google Scholar] [CrossRef]
  11. Liu, M.; Zhu, Z.; Zhang, Z.; Chu, Y.; Yuan, B.; Wei, Z. Development of highly porous mullite whisker ceramic membranes for oil-in-water separation and resource utilization of coal gangue. Sep. Purif. Technol. 2020, 237, 116483. [Google Scholar] [CrossRef]
  12. Suo, Y.; Ren, Y. Research on the mechanism of nanofiltration membrane fouling in zero discharge process of high salty wastewater from coal chemical industry. Chem. Eng. Sci. 2021, 245, 116810. [Google Scholar] [CrossRef]
  13. Boente, C.; Baragano, D.; Gallego, J.R. Benzo[a]pyrene sourcing and abundance in a coal region in transition reveals historical pollution, rendering soil screening levels impractical. Environ. Pollut. 2020, 266, 115341. [Google Scholar] [CrossRef]
  14. Wang, H.; Huang, X.; Kuang, Z.; Zheng, X.; Zhao, M.; Yang, J.; Huang, H.; Fan, Z. Source apportionment and human health risk of PAHs accumulated in edible marine organisms: A perspective of “source-organism-human”. J. Hazard. Mater. 2023, 453, 131372. [Google Scholar] [CrossRef]
  15. Bi, S.; Cao, H.; Zhang, B.; Dong, H.; Gao, Y.; Zhou, X.; Jiang, Y.; Jiang, W. PM2.5-bound PAHs near a typical industrial park: Determining health risks associated with specific industrial sources. Atmos. Environ. 2023, 302, 119715. [Google Scholar] [CrossRef]
  16. Hossen, M.A.; Chowdhury, A.I.H.; Mullick, M.R.A.; Hoque, A. Heavy metal pollution status and health risk assessment vicinity to Barapukuria coal mine area of Bangladesh. Environ. Nanotechnol. Monit. Manag. 2021, 16, 100469. [Google Scholar] [CrossRef]
  17. Tian, W.; Zhang, M.; Zong, D.; Li, W.; Li, X.; Wang, Z.; Zhang, Y.; Niu, Y.; Xiang, P. Are high-risk heavy metal(loid)s contaminated vegetables detrimental to human health? A study of incorporating bioaccessibility and toxicity into accurate health risk assessment. Sci. Total Environ. 2023, 897, 165514. [Google Scholar] [CrossRef]
  18. Wang, R.; Ma, Q.; Ye, X.; Li, C.; Zhao, Z. Preparing coal slurry from coking wastewater to achieve resource utilization: Slurrying mechanism of coking wastewater-coal slurry. Sci. Total Environ. 2019, 650, 1678–1687. [Google Scholar] [CrossRef]
  19. Li, S.; Zhao, Y.; Xiao, W.; Yue, W.; Wu, T. Optimizing ecological security pattern in the coal resource-based city: A case study in Shuozhou City, China. Ecol. Indic. 2021, 130, 108026. [Google Scholar] [CrossRef]
  20. Senathirajah, K.; Attwood, S.; Bhagwat, G.; Carbery, M.; Wilson, S.; Palanisami, T. Estimation of the mass of microplastics ingested—A pivotal first step towards human health risk assessment. J. Hazard. Mater. 2021, 404, 124004. [Google Scholar] [CrossRef]
  21. Ojo, A.F.; Peng, C.; Ng, J.C. Assessing the human health risks of per- and polyfluoroalkyl substances: A need for greater focus on their interactions as mixtures. J. Hazard. Mater. 2021, 407, 124863. [Google Scholar] [CrossRef]
  22. Dong, Z.; Liu, Y.; Duan, L.; Bekele, D.; Naidu, R. Uncertainties in human health risk assessment of environmental contaminants: A review and perspective. Environ. Int. 2015, 85, 120–132. [Google Scholar] [CrossRef]
  23. Pizzol, L.; Hristozov, D.; Zabeo, A.; Basei, G.; Wohlleben, W.; Koivisto, A.J.; Jensen, K.A.; Fransman, W.; Stone, V.; Marcomini, A. SUNDS probabilistic human health risk assessment methodology and its application to organic pigment used in the automotive industry. NanoImpact 2019, 13, 26–36. [Google Scholar] [CrossRef]
  24. Kumar, A.; Xagoraraki, I. Human health risk assessment of pharmaceuticals in water: An uncertainty analysis for meprobamate, carbamazepine, and phenytoin. Regul. Toxicol. Pharmacol. 2010, 57, 146–156. [Google Scholar] [CrossRef]
  25. Hu, G.; Liu, H.; Chen, C.; Hou, H.; Li, J.; Hewage, K.; Sadiq, R. Low-temperature thermal desorption and secure landfill for oil-based drill cuttings management: Pollution control, human health risk, and probabilistic cost assessment. J. Hazard. Mater. 2021, 410, 124570. [Google Scholar] [CrossRef] [PubMed]
  26. Hu, G.; Rana, A.; Mian, H.R.; Saleem, S.; Mohseni, M.; Jasim, S.; Hewage, K.; Sadiq, R. Human health risk-based life cycle assessment of drinking water treatment for heavy metal(loids) removal. J. Clean. Prod. 2020, 267, 121980. [Google Scholar] [CrossRef]
  27. Cattaneo, I.; Kalian, A.D.; Di Nicola, M.R.; Dujardin, B.; Levorato, S.; Mohimont, L.; Nathanail, A.V.; Carnessechi, E.; Astuto, M.C.; Tarazona, J.V.; et al. Risk Assessment of Combined Exposure to Multiple Chemicals at the European Food Safety Authority: Principles, Guidance Documents, Applications and Future Challenges. Toxins 2023, 15, 40. [Google Scholar] [CrossRef]
  28. Paladino, O.; Moranda, A. Human Health Risk Assessment of a pilot-plant for catalytic pyrolysis of mixed waste plastics for fuel production. J. Hazard. Mater. 2021, 405, 124222. [Google Scholar] [CrossRef] [PubMed]
  29. Ancione, G.; Lisi, R.; Milazzo, M.F. Human health risk associated with emissions of volatile organic compounds due to the ship-loading of hydrocarbons in refineries. Atmos. Pollut. Res. 2021, 12, 432–442. [Google Scholar] [CrossRef]
  30. Zhang, S.; Han, Y.; Peng, J.; Chen, Y.; Zhan, L.; Li, J. Human health risk assessment for contaminated sites: A retrospective review. Environ. Int. 2023, 171, 107700. [Google Scholar] [CrossRef] [PubMed]
  31. Zheng, S.; Wang, Q.; Yuan, Y.; Sun, W. Human health risk assessment of heavy metals in soil and food crops in the Pearl River Delta urban agglomeration of China. Food Chem. 2020, 316, 126213. [Google Scholar] [CrossRef] [PubMed]
  32. Juang, K.W.; Chu, L.J.; Syu, C.H.; Chen, B.C. Assessing human health risk of arsenic for rice consumption by an iron plaque based partition ratio model. Sci. Total Environ. 2021, 763, 142973. [Google Scholar] [CrossRef] [PubMed]
  33. Jolodar, N.R.; Karimi, S.; Bouteh, E.; Balist, J.; Prosser, R. Human health and ecological risk assessment of pesticides from rice production in the Babol Roud River in Northern Iran. Sci. Total Environ. 2021, 772, 144729. [Google Scholar] [CrossRef] [PubMed]
  34. Langdon, K.A.; Chandra, A.; Bowles, K.; Symons, A.; Pablo, F.; Osborne, K. A preliminary ecological and human health risk assessment for organic contaminants in composted municipal solid waste generated in New South Wales, Australia. Waste Manag. 2019, 100, 199–207. [Google Scholar] [CrossRef]
  35. Tadic, D.; Bleda Hernandez, M.J.; Cerqueira, F.; Matamoros, V.; Pina, B.; Bayona, J.M. Occurrence and human health risk assessment of antibiotics and their metabolites in vegetables grown in field-scale agricultural systems. J. Hazard. Mater. 2021, 401, 123424. [Google Scholar] [CrossRef]
  36. Sharafi, K.; Nodehi, R.N.; Yunesian, M.; Hossein Mahvi, A.; Pirsaheb, M.; Nazmara, S. Human health risk assessment for some toxic metals in widely consumed rice brands (domestic and imported) in Tehran, Iran: Uncertainty and sensitivity analysis. Food Chem. 2019, 277, 145–155. [Google Scholar] [CrossRef]
  37. Chou, W.C.; Lin, Z. Probabilistic human health risk assessment of perfluorooctane sulfonate (PFOS) by integrating in vitro, in vivo toxicity, and human epidemiological studies using a Bayesian-based dose-response assessment coupled with physiologically based pharmacokinetic (PBPK) modeling approach. Environ. Int. 2020, 137, 105581. [Google Scholar] [CrossRef] [PubMed]
  38. HJ25.3-2019; Technical Guidelines for Risk Assessment of Soil Contamination of Land for Construction. Ministry of Environmental Protection of China: Beijing, China, 2019.
  39. Li, W.; Dryfhout-Clark, H.; Hung, H. PM(10)-bound trace elements in the Great Lakes Basin (1988–2017) indicates effectiveness of regulatory actions, variations in sources and reduction in human health risks. Environ. Int 2020, 143, 106008. [Google Scholar] [CrossRef]
  40. Zhao, L.; Xu, Y.; Hou, H.; Shangguan, Y.; Li, F. Source identification and health risk assessment of metals in urban soils around the Tanggu chemical industrial district, Tianjin, China. Sci. Total Environ. 2014, 468–469, 654–662. [Google Scholar] [CrossRef]
  41. Zhang, K.; Li, H.; Cao, Z.; Shi, Z.; Liu, J. Human health risk assessment and risk source analysis of arsenic in soil from a coal chemical plant in Northwest China. J. Soils Sediments 2019, 19, 2785–2794. [Google Scholar] [CrossRef]
  42. Singh, V.; Singh, N.; Verma, M.; Kamal, R.; Tiwari, R.; Sanjay Chivate, M.; Rai, S.N.; Kumar, A.; Singh, A.; Singh, M.P.; et al. Hexavalent-Chromium-Induced Oxidative Stress and the Protective Role of Antioxidants against Cellular Toxicity. Antioxid. 2022, 11, 2375. [Google Scholar] [CrossRef]
  43. Huang, Y.; Yi, Q.; Kang, J.-X.; Zhang, Y.-G.; Li, W.-Y.; Feng, J.; Xie, K.-C. Investigation and optimization analysis on deployment of China coal chemical industry under carbon emission constraints. Appl. Energy 2019, 254, 113684. [Google Scholar] [CrossRef]
  44. Ma, H.-P.; Wang, H.-L.; Tian, C.-C.; Chang, Y.-L.; Yuan, W.; Qi, Y.-H.; Chao, Z.-L.; Chen, W.-Y.; Lv, W.-J. An optimized design for zero liquid discharge from coal chemical industry: A case study in China. J. Clean. Prod. 2021, 319, 128572. [Google Scholar] [CrossRef]
  45. Fan, C.; Guo, S.; Jin, H. Numerical study on coal gasification in supercritical water fluidized bed and exploration of complete gasification under mild temperature conditions. Chem. Eng. Sci. 2019, 206, 134–145. [Google Scholar] [CrossRef]
  46. Xia, Z.; Wang, W.; Wang, G. Study of the crystal structure effect and mechanism during chemical looping gasification of coal. J. Energy Inst. 2019, 92, 1284–1293. [Google Scholar] [CrossRef]
  47. Wang, W.; Han, H.; Yuan, M.; Li, H.; Fang, F.; Wang, K. Treatment of coal gasification wastewater by a two-continuous UASB system with step-feed for COD and phenols removal. Bioresour. Technol. 2011, 102, 5454–5460. [Google Scholar] [CrossRef] [PubMed]
  48. Mehta, N.; Cipullo, S.; Cocerva, T.; Coulon, F.; Dino, G.A.; Ajmone-Marsan, F.; Padoan, E.; Cox, S.F.; Cave, M.R.; De Luca, D.A. Incorporating oral bioaccessibility into human health risk assessment due to potentially toxic elements in extractive waste and contaminated soils from an abandoned mine site. Chemosphere 2020, 255, 126927. [Google Scholar] [CrossRef]
  49. Singh, V.; Singh, N.; Rai, S.N.; Kumar, A.; Singh, A.K.; Singh, M.P.; Sahoo, A.; Shekhar, S.; Vamanu, E.; Mishra, V. Heavy Metal Contamination in the Aquatic Ecosystem: Toxicity and Its Remediation Using Eco-Friendly Approaches. Toxics 2023, 11, 147. [Google Scholar] [CrossRef] [PubMed]
  50. Xiao, X.; Zhang, J.; Wang, H.; Han, X.; Ma, J.; Ma, Y.; Luan, H. Distribution and health risk assessment of potentially toxic elements in soils around coal industrial areas: A global meta-analysis. Sci. Total Environ. 2020, 713, 135292. [Google Scholar] [CrossRef]
  51. Saleem, M.; Sens, D.A.; Somji, S.; Pierce, D.; Wang, Y.; Leopold, A.; Haque, M.E.; Garrett, S.H. Contamination Assessment and Potential Human Health Risks of Heavy Metals in Urban Soils from Grand Forks, North Dakota, USA. Toxics 2023, 11, 132. [Google Scholar] [CrossRef] [PubMed]
  52. Zhang, K.; Li, X.; Song, Z.; Yan, J.; Chen, M.; Yin, J. Human Health Risk Distribution and Safety Threshold of Cadmium in Soil of Coal Chemical Industry Area. Minerals 2021, 11, 678. [Google Scholar] [CrossRef]
Figure 1. Assessment framework for human health risk of CCI soils.
Sustainability 15 14768 g001
Figure 2. Carcinogenic risk and hazard quotient for contaminant exposure via three exposure routes. (a) CR of (Be, V, Ni, Cd) in one exposure route; (b) HQ of (Cu, Zn) in one exposure route; (c) Total HQ of (Be, V, Ni, Hg) in two exposure route; (d) Total CR of As in three exposure routes; (e) Total HQ of (As, Cd) in three exposure routes.
Sustainability 15 14768 g002
Figure 3. The risk contribution ratio of CR (As) and HQ (V). (a) Risk contribution ratio of As; (b) risk contribution ratio of V.
Sustainability 15 14768 g003
Figure 4. The HHR distribution of As in CCI site soils. (a) CR; (b) HQ.
Sustainability 15 14768 g004
Figure 5. HHR distribution of V. (a) CR; (b) HQ.
Sustainability 15 14768 g005
Disclaimer/Publisher’s Note: The statements, opinions and data contained in all publications are solely those of the individual author(s) and contributor(s) and not of MDPI and/or the editor(s). MDPI and/or the editor(s) disclaim responsibility for any injury to people or property resulting from any ideas, methods, instructions or products referred to in the content.

