

Predicting the Choice of Online or Offline Shopping Trips Using a Deep Neural Network Model and Time Series Data: A Case Study of Tehran, Iran


Abstract
:1. Introduction
- What are the main factors that influence the type of shopping trip in Tehran?
- How can a deep learning approach improve the accuracy and reliability of estimating the type of shopping trip in Tehran?
- How does the proposed model compare with other methods for estimating the type of shopping trip in Tehran?
- A cost-effective method is presented to accurately estimate the type of shopping trip.
- Providing an effective alternative method for transportation decision-making and urban traffic resource allocation.
- Integration of decision models and machine learning methods in order to improve the travel type estimation system.
- Using a CNN-based approach to estimate shopping trips.
2. Literature Review
- Online and offline shopping behavior and the factors that influence it.
- Machine learning methods for predicting online and offline shopping trips.
2.1. Online and Offline Shopping Behavior and the Factors That Influence It
2.1.1. Shao et al. [7]
2.1.2. Xiong [8]
2.1.3. Espinoza et al. [9]
2.1.4. Shi et al. [10]
2.2. Machine Learning Methods for Predicting Online and Offline Shopping Trips
2.2.1. Dong et al. [11]
2.2.2. Xiahou and Harada [12]
2.2.3. Lee et al. [13]
2.2.4. Chawla et al. [14]
- Using the deep learning approach to estimate online and offline shopping trips.
- Examining and prioritizing the factors that affect the generation of online and offline shopping trips.
3. Methodology
4. Results
5. Discussion
6. Conclusions and Future Work
Author Contributions
Funding
Institutional Review Board Statement
Informed Consent Statement
Data Availability Statement
Conflicts of Interest
Appendix A
References
- Archetti, C.; Bertazzi, L. Recent challenges in Routing and Inventory Routing: E-commerce and last-mile delivery. Networks 2021, 77, 255–268. [Google Scholar] [CrossRef]
- Global Ecommerce. 2019. Available online: https://www.emarketer.com/content/global-ecommerce-2019 (accessed on 27 June 2019).
- Stocchi, L.; Michaelidou, N.; Pourazad, N.; Micevski, M. The rules of engagement: How to motivate consumers to engage with branded mobile apps. J. Mark. Manag. 2018, 34, 1196–1226. [Google Scholar] [CrossRef]
- Annual Report of Urban Traffic and Transportation Organization in Tehran City. 2020. Available online: https://www.ictte.ir/data/cnf1668321135/uploads/amar/1399.pdf (accessed on 20 January 2021).
- World Urbanization Prospects. United Nations. New York. 2019. Available online: https://population.un.org/wup/publications/Files/WUP2018-Highlights.pdf (accessed on 11 February 2020).
- Moshayedi, A.J.; Roy, A.S.; Taravet, A.; Liao, L.; Wu, J.; Gheisari, M. A secure traffic police remote sensing approach via a deep learning-based low-altitude vehicle speed detector through uavs in smart cites: Algorithm, implementation and evaluation. Future Transp. 2023, 3, 189–209. [Google Scholar] [CrossRef]
- Shao, R.; Derudder, B.; Witlox, F. The geography of e-shopping in China: On the role of physical and virtual accessibility. J. Retail. Consum. Serv. 2022, 64, 102753. [Google Scholar] [CrossRef]
- Xiong, Y. The Impact of Artificial Intelligence and Digital Economy Consumer Online Shopping Behavior on Market Changes. Discret. Dyn. Nat. Soc. 2022, 2022, 9772416. [Google Scholar] [CrossRef]
- Espinoza, M.C.; Ganatra, V.; Prasanth, K.; Sinha, R.; Montañez, C.E.O.; Sunil, K.M.; Kaakandikar, R. Consumer behavior analysis on online and offline shopping during pandemic situation. Int. J. Account. Financ. Asia Pac. 2021, 4, 75–87. [Google Scholar] [CrossRef]
- Shi, F.; Guegan, C.G. Adapted Decision Support Service Based on the Prediction of Offline Consumers’ Real-Time Intention and Devices Interactions. In Proceedings of the 42nd Annual Computer Software and Applications Conference (COMPSAC), Tokyo, Japan, 23–27 July 2018; IEEE: Piscataway, NJ, USA, 2018; Volume 2, pp. 266–271. [Google Scholar] [CrossRef]
- Dong, Y.; Tang, J.; Zhang, Z. Integrated Machine Learning Approaches for E-commerce Customer Behavior Prediction. In Proceedings of the 2022 7th International Conference on Financial Innovation and Economic Development (ICFIED 2022), Zhuhai, China, 14–16 January 2022; Atlantis Press: Amsterdam, The Netherlands, 2022; pp. 1008–1015. [Google Scholar] [CrossRef]
- Xiahou, X.; Harada, Y. B2C E-Commerce Customer Churn Prediction Based on K-Means and SVM. J. Theor. Appl. Electron. Commer. Res. 2022, 17, 458–475. [Google Scholar] [CrossRef]
- Lee, R.J.; Sener, I.N.; Mokhtarian, P.L.; Handy, S.L. Relationships between the online and in-store shopping frequency of Davis, California residents. Transp. Res. Part A Policy Pract. 2017, 100, 40–52. [Google Scholar] [CrossRef]
- Chawla, A.; Singh, A.; Lamba, A.; Gangwani, N.; Soni, U. Demand forecasting using artificial neural networks—A case study of American Retail Corporation. In Applications of Artificial Intelligence Techniques in Engineering; Springer: Singapore, 2019; pp. 79–89. [Google Scholar] [CrossRef]
- Jiang, H.; He, M.; Xi, Y.; Zeng, J. Machine-Learning-Based User Position Prediction and Behavior Analysis for Location Services. Information 2021, 12, 180. [Google Scholar] [CrossRef]
- Zubaidi, S.L.; Al-Bugharbee, H.; Ortega-Martorell, S.; Gharghan, S.K.; Olier, I.; Hashim, K.S.; Kot, P. A novel methodology for prediction urban water demand by wavelet denoising and adaptive neuro-fuzzy inference system approach. Water 2020, 12, 1628. [Google Scholar] [CrossRef]
- Punia, S.; Nikolopoulos, K.; Singh, S.P.; Madaan, J.K.; Litsiou, K. Deep learning with long short-term memory networks and random forests for demand forecasting in multi-channel retail. Int. J. Prod. Res. 2020, 58, 4964–4979. [Google Scholar] [CrossRef]
- Kennedy, I. Sample Size Determination in Test-Retest and Cronbach Alpha Reliability Estimates. Br. J. Contemp. Educ. 2022, 2, 17–29. [Google Scholar] [CrossRef]
- Collins, L.M. Research Design and Methods. In Encyclopedia of Gerontology; Elsevier: Amsterdam, The Netherlands, 2007; Volume 2, pp. 419–429. [Google Scholar] [CrossRef]
- Kamel, S.R.; YaghoubZadeh, R.; Kheirabadi, M. Improving the performance of support-vector machine by selecting the best features by Gray Wolf algorithm to increase the accuracy of diagnosis of breast cancer. J. Big Data 2019, 6, 90. [Google Scholar] [CrossRef]
- Dou, Z.; Sun, Y.; Zhu, J.; Zhou, Z. The Evaluation Prediction System for Urban Advanced Manufacturing Development. Systems 2023, 11, 392. [Google Scholar] [CrossRef]

| Type | Number | Percent (%) |
|---|---|---|
| Online shopping trip | 52,621 | 4.91 |
| Offline shopping trip | 1,018,652 | 95.09 |
| Total | 1,071,273 | 100.00 |
| Author | Objective | Variable | Method | Result |
|---|---|---|---|---|
| [7] | Physical and virtual accessibility evaluation based on the geographic location. | Number of physical accesses, public transportation, and virtual access | General Spatial Model (SAC) | Physical and virtual access increase affects shopping trip. |
| [8] | Evaluation of the impact of artificial intelligence and consumer online shopping behavior in the digital economy on market changes. | Number of trips by age in online services | Statistical analysis based on the questionnaire | Purchase forecasting until the end of 2022 and increasing. |
| [9] | Evaluation of consumer behavior in online and offline shopping trips in the conditions of the coronavirus epidemic. | Consumers’ behavior and their relative familiarity with the Internet and delivery time | The chi-square test and Cronbach’s alpha test | The results showed that the indicators of the ability to use the Internet, the variety of products, and the delivery time had a positive and significant effect on the online shopping trip, with coefficients of 0.35, 0.28, and 0.21, respectively. |
| [10] | Predicting offline consumer interactions and intent in real-time. | User behavioral characteristics, such as return rate, conversion rate | Time series algorithms | The results showed that the context-aware interaction increased the consumers’ shopping satisfaction. |
| [11] | Customer Behavior Prediction in the online shopping trip. | User behavioral data, such as purchasing new products and staying loyal to a particular product | Pipeline and random forest algorithms | Prediction accuracy achieved 96% and user ID and user session were the most important features in predicting the next purchase of the user. |
| [12] | Predicting offline shopping trips for customer churn. | User behavioral characteristics, such as return rate, conversion rate | K-means clustering, support vector machine, and logistic regression | SVM or support vector machine had higher accuracy than the other two methods. |
| [13] | Machine learning algorithms comparison and interpretation for online shopping trip prediction. | Based on recorded data and user return rate | Neural networks, Extreme Gradient Boosting model | The results showed that using the incremental gradient model with the aim of frequent and effective advertising for users increased the conversion rate of online to offline shopping. |
| [14] | Predicting offline shopping demand in an American retail company. | Number of offline purchases for a product | Artificial neural networks, ANFIS model | The results showed that the ANFIS method was more effective than the artificial neural network structure in predicting travel demand. |
| [15] | Customer location and behavior prediction and analysis based on machine learning for location services in e-commerce. | Location of stores, location of users | LSTM neural network | The results showed that adding the speed-accuracy index increased the accuracy of the algorithm. |
| [16] | Predicting online and offline shopping trip demand. | Annual sales of a particular product | Artificial Neural Network (ANN), Fuzzy Neural Network (FNN) | The results showed that the accuracy of the fuzzy neural network was significantly higher than other methods for demand forecasting. |
| [17] | Predicting online shopping trip demand in multi-channel retailing. | The number of online purchases compared to the number of offline purchases | Deep learning based on short-term memory (LSTM) networks and random forests | The results showed that the method presented in this paper had better results than other methods. |
| Indicator | Qualitative Variable | Label |
|---|---|---|
| Age | Between 18 and 25 years | 1 |
| Between 25 and 30 years | 2 | |
| Between 30 and 35 years | 3 | |
| Above 35 years | 4 | |
| Gender | Male | 1 |
| Female | 0 | |
| Marital status | Married | 1 |
| Single | 0 | |
| Car ownership status | Car owner | 1 |
| Lack of car ownership | 0 | |
| Income level | Less than 5 million tomans | 1 |
| Between 5 and 10 million tomans | 2 | |
| Between 10 and 15 million tomans | 3 | |
| More than 15 million tomans | 4 | |
| Employment status | Self-employed | 1 |
| Student | 2 | |
| Full-time employee | 3 | |
| Part-time employee | 4 | |
| Retired | 5 | |
| No job | 6 | |
| Others | 7 | |
| Education | Diploma and sub-diploma | 1 |
| Associate degree | 2 | |
| Bachelor | 3 | |
| Masters | 4 | |
| Above master’s degree (doctor and doctorate and higher) | 5 | |
| Delivery cost | Low | 1 |
| Medium | 2 | |
| Much | 3 | |
| Delivery time | Low | 1 |
| Medium | 2 | |
| Much | 3 | |
| Product price | Low | 1 |
| Medium | 2 | |
| Much | 3 | |
| Type of shopping trip | Online shopping | 1 |
| Offline shopping trip | 0 |
| Parameter | Value of Cronbach’s Alpha Coefficient |
|---|---|
| Age | 0.71 |
| Gender | 0.73 |
| Marital status | 0.72 |
| Car ownership status | 0.79 |
| Income level | 0.78 |
| Employment status | 0.79 |
| Education | 0.78 |
| Delivery cost | 0.73 |
| Delivery time | 0.76 |
| Product price | 0.77 |
| Age | Gender | Marital Status | Car Ownership | Income | Employment Status | Education | Delivery Cost | Delivery Time | Product Price | Type of Shopping Trip |
|---|---|---|---|---|---|---|---|---|---|---|
| 3 | 1 | 1 | 0 | 2 | 7 | 1 | 3 | 2 | 1 | 1 |
| 2 | 0 | 1 | 0 | 2 | 4 | 5 | 1 | 1 | 2 | 0 |
| 1 | 0 | 0 | 1 | 3 | 7 | 3 | 1 | 1 | 3 | 1 |
| 3 | 1 | 0 | 0 | 2 | 2 | 3 | 3 | 2 | 1 | 0 |
| 3 | 1 | 0 | 0 | 1 | 2 | 1 | 3 | 2 | 1 | 0 |
| 2 | 0 | 0 | 1 | 3 | 5 | 5 | 3 | 2 | 2 | 1 |
| 1 | 0 | 1 | 1 | 3 | 2 | 1 | 3 | 3 | 3 | 1 |
| 1 | 0 | 0 | 0 | 3 | 2 | 1 | 1 | 2 | 2 | 1 |
| 2 | 0 | 1 | 0 | 1 | 2 | 2 | 2 | 3 | 3 | 0 |
| 1 | 1 | 1 | 1 | 2 | 3 | 3 | 3 | 1 | 2 | 1 |
| 2 | 0 | 1 | 0 | 3 | 4 | 2 | 2 | 3 | 2 | 1 |
| 4 | 1 | 0 | 1 | 4 | 3 | 5 | 3 | 2 | 3 | 0 |
| Variable | Sub-Variable | Number | Percent (%) |
|---|---|---|---|
| Age | Between 18 and 25 years | 350 | 35.00 |
| Between 25 and 30 years | 321 | 32.10 | |
| Between 30 and 35 years | 198 | 19.80 | |
| Above 35 years | 131 | 13.1 | |
| Gender | Male | 532 | 53.20 |
| Female | 468 | 46.80 | |
| Marital status | Married | 415 | 41.50 |
| Single | 585 | 58.50 | |
| Car ownership status | Car owner | 486 | 48.60 |
| Lack of car ownership | 514 | 51.40 | |
| Income level | Less than 5 million tomans | 56 | 5.60 |
| Between 5 and 10 million tomans | 225 | 22.50 | |
| Between 10 and 15 million tomans | 413 | 41.30 | |
| More than 15 million tomans | 306 | 30.60 | |
| Employment status | Self-employed | 182 | 18.20 |
| Student | 246 | 24.60 | |
| Full-time employee | 292 | 29.20 | |
| Part-time employee | 229 | 22.90 | |
| Retired | 36 | 3.60 | |
| No job | 10 | 1.00 | |
| Others | 5 | 0.50 | |
| Education | Diploma and sub-diploma | 89 | 8.90 |
| Associate degree | 186 | 18.60 | |
| Bachelor | 394 | 39.40 | |
| Masters | 298 | 29.80 | |
| Above master’s degree (doctor and doctorate and higher) | 33 | 3.30 |
| Parameter | Value |
|---|---|
| Initial learning coefficient | 0.00611 |
| A factor in reducing the learning rate | 0.1 |
| The number of repetitions | 50 |
| The solver | Adam |
| Network architecture | Xception |
| Training function | Trainbr |
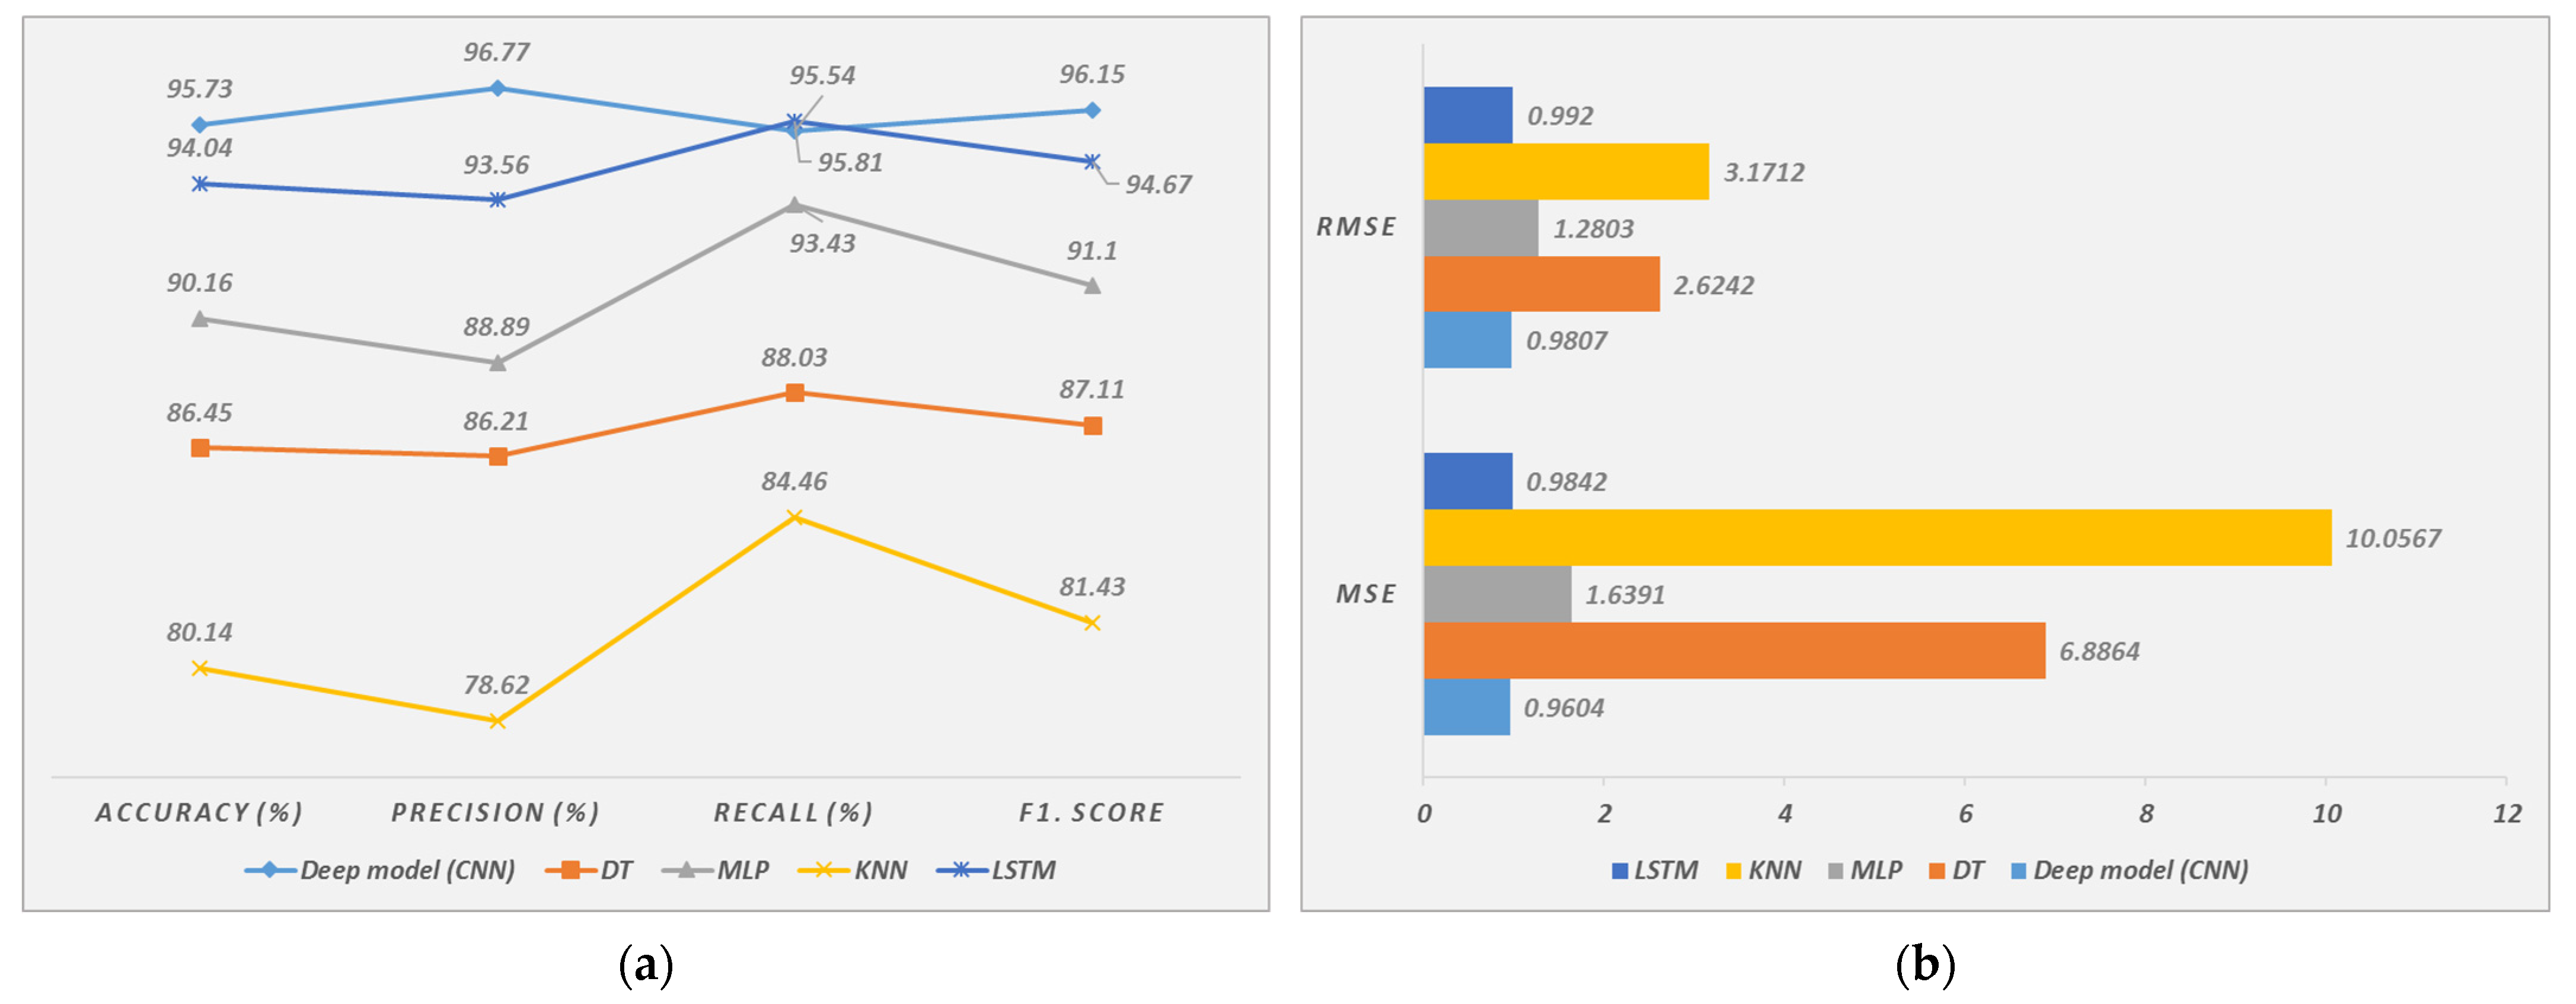
| Deep Model (CNN) | DT | MLP | KNN | LSTM | |
|---|---|---|---|---|---|
| Accuracy (%) | 95.73 | 86.45 | 90.16 | 80.14 | 94.04 |
| Precision (%) | 96.77 | 86.21 | 88.89 | 78.62 | 93.56 |
| Recall (%) | 95.54 | 88.03 | 93.43 | 84.46 | 95.81 |
| F1·Score | 96.15 | 87.11 | 91.10 | 81.43 | 94.67 |
| MSE | 0.9604 | 6.8864 | 1.6391 | 10.0567 | 0.9842 |
| RMSE | 0.9807 | 2.6242 | 1.2803 | 3.1712 | 0.9920 |
Disclaimer/Publisher’s Note: The statements, opinions and data contained in all publications are solely those of the individual author(s) and contributor(s) and not of MDPI and/or the editor(s). MDPI and/or the editor(s) disclaim responsibility for any injury to people or property resulting from any ideas, methods, instructions or products referred to in the content. |
© 2023 by the authors. Licensee MDPI, Basel, Switzerland. This article is an open access article distributed under the terms and conditions of the Creative Commons Attribution (CC BY) license (https://creativecommons.org/licenses/by/4.0/).
Share and Cite
Dasoomi, M.; Naderan, A.; Allahviranloo, T. Predicting the Choice of Online or Offline Shopping Trips Using a Deep Neural Network Model and Time Series Data: A Case Study of Tehran, Iran. Sustainability 2023, 15, 14764. https://doi.org/10.3390/su152014764
Dasoomi M, Naderan A, Allahviranloo T. Predicting the Choice of Online or Offline Shopping Trips Using a Deep Neural Network Model and Time Series Data: A Case Study of Tehran, Iran. Sustainability. 2023; 15(20):14764. https://doi.org/10.3390/su152014764
Chicago/Turabian StyleDasoomi, Mohammadhanif, Ali Naderan, and Tofigh Allahviranloo. 2023. "Predicting the Choice of Online or Offline Shopping Trips Using a Deep Neural Network Model and Time Series Data: A Case Study of Tehran, Iran" Sustainability 15, no. 20: 14764. https://doi.org/10.3390/su152014764
APA StyleDasoomi, M., Naderan, A., & Allahviranloo, T. (2023). Predicting the Choice of Online or Offline Shopping Trips Using a Deep Neural Network Model and Time Series Data: A Case Study of Tehran, Iran. Sustainability, 15(20), 14764. https://doi.org/10.3390/su152014764