Article

Is the Urban Landscape Connected? Construction and Optimization of Urban Ecological Networks Based on Morphological Spatial Pattern Analysis

1
Jilin Provincial Key Laboratory of Tree and Grass Genetics and Breeding, College of Forestry and Grassland Science, Jilin Agricultural University, Changchun 130118, China
2
College of Horticulture, Jilin Agricultural University, Changchun 130118, China
3
College of Information Technology, Jilin Agricultural University, Changchun 130118, China
*
Author to whom correspondence should be addressed.
Sustainability 2023, 15(20), 14756; https://doi.org/10.3390/su152014756
Submission received: 21 August 2023 / Revised: 9 October 2023 / Accepted: 10 October 2023 / Published: 11 October 2023

Abstract

:
Urban green ecological space is an important measure of sustainable urban development. Among them, landscape connectivity is one of the key factors in maintaining landscape function. Ecological networks can effectively improve regional ecological quality and promote urban landscape connectivity. However, previous studies on ecological networks have mainly focused on biodiversity conservation and lack research on landscape connectivity. This study used morphological spatial pattern analysis methods and utilized connectivity indices to identify ecological sources in the Chaoyang and Nanguan districts of China’s Changchun City and selected environmental and anthropogenic factors to construct an integrated resistance surface. The minimum cumulative resistance model and network structure index were used for urban ecological network construction and node optimization. The results show that the potential ecological network comprises 17 ecological sources and 34 potential corridors, primarily located in forests and water bodies in the east and south regions. However, the northwest has poor habitat quality and uneven distribution of ecological corridors, that warrant prioritization in future planning, construction, and protection efforts. By introducing six supplemental sources and 25 additional corridors, the function and overall connectivity of the regional ecological network can be improved. The study confirmed that the selection of appropriate connectivity thresholds can improve the accuracy of ecological sources identification, and that the influence of anthropogenic factors on ecological resistance cannot be ignored. This study will provide a scientific basis for promoting urban construction and ecological balance.

1. Introduction

Rapid land expansion has resulted in the fragmentation of urban ecological landscapes, causing several ecological problems worldwide, such as the decline of ecosystem service functions and reduction in biodiversity [1,2,3]. To cope with the deteriorating ecological environment, China has introduced a policy to develop an ecological civilization, with the aim to promote ecosystem integrity and landscape connectivity and protect the diversity of urban forest resources [4,5]. However, in regions characterized by rapid urbanization and high urban density, ecological green patches are continuously eroded by construction land, leading to increased landscape fragmentation and reduced connectivity between patches, which directly affects the sustainable development of cities [6,7,8]. Planned sprawl is necessary to promote orderly urban development [9,10]. The establishment of ecological networks is crucial for maintaining a balance between regional ecological protection and economic development [11,12].
Ecological network construction is based on the theory of landscape ecology, and its purpose is to connect different ecological sources to form a spatially interconnected network system [13,14]. The ecological network facilitates the exchange of material, energy, and information among species, mitigates patch fragmentation, and enhances inter-patch connectivity. In recent years, scholars have focused on climate change [15], biodiversity, and habitat quality, and have carried out a lot of practical explorations for the construction of urban green infrastructure and ecological network patterns [16,17,18,19,20]. Most studies have the geographical scope of a basin [21,22], an urban agglomeration [23,24], or a province [25,26,27], with fewer studies on small-scale urban areas. However, similar to counties (shire) in Europe and the United States, districts in China belong to the basic administrative unit at the mesoscale level, occupying a key position in the hierarchy of territorial spatial restoration, which is significant for carrying out the work of ecological protection and controlling urban development boundaries [28]. Therefore, research at the mesoscale level deserves more attention.
The basic paradigm of ecological network research is “ecological source identification, resistance surface setting, and corridor extraction” based on the “source-sink” theory [21]. Ecological sources perform important radiative functions in ecological processes. Previous studies have identified ecological sources through direct selection methods, such as utilizing nature reserves and large areas of forested land as ecological sources [29], or by analyzing ecological sensitivity [30], habitat quality, and importance assessment of ecosystem service values using the INVEST model (Integrated Valuation of Ecosystem Services and Tradeoffs) [31,32,33] to determine sources. These methods often rely on researchers’ assessment of ecological functions, lack validation, and overemphasize functional attributes, thus tending to overlook small but important patches. It is crucial to identify ecological patches with significant value for ecosystem integrity and establish inter-patch connectivity for maintaining ecological processes and biological flows [14]. In recent years, the morphological spatial pattern analysis (MSPA) method has been widely applied in the fields of ecology and geography [34]. It can accurately identify the landscape types and structure of ecological patches at the image metric level [35], so as to screen out the areas with important ecological values. Scholars have realized the identification of ecological sources through MSPA. In order to ensure the integrity of ecological sources, some scholars have also combined the MSPA method with the above methods, thus making up for the previous shortcomings [36,37,38]. However, the previous studies discussed mostly the effects of edge width on source identification and lacked research on landscape connectivity [39]. For urbanized areas with serious fragmentation of ecological patches, combining the MSPA method with the landscape connectivity indices can improve the accuracy and rationality of ecological source identification [36,40,41].
The ecological resistance surface represents the degree of difficulty or disturbance level that ecological flow needs to overcome when moving between heterogeneous patches [42]. The construction of ecological resistance surfaces is key to extracting ecological corridors. Studies had assessed the resistance value of ecological surfaces based on land use type, elevation, and slope [29,43]. Although this method requires less data, it ignores the interaction between human construction activities and biological flows. Some studies calculated the resistance value of human activity-intensive areas by introducing different types of spatial data, such as the nighttime light index, topographic position index, disaster interference risk index, and other related indices [44,45,46]. The results of these studies were relatively objective, but they still could not comprehensively assess the effects of natural factors and human activities on ecological resistance. Ecological corridors are pathways formed through areas of low resistance according to the specific migration needs of species. Several methods have been used to identify ecological corridors, such as simulating the random wandering of bioelectric currents through a resistive algorithm and applying the ant colony algorithm to identify ecological corridors in megacities [47,48]. Although these methods are highly accurate and reliable, they are not suitable for this study which places more emphasis on the connectivity between ecological sources. The minimum cumulative resistance (MCR) model is often used to extract ecological corridors. The MCR model can represent the data in a lower dimensional space more flexibly and can better explain the spatial structure and interaction relationships between ecological patches [49,50]. Moreover, the MCR model is similar to the MSPA method in that it analyzes the landscape structure based on the image element level, and they can accurately reflect the landscape characteristics and improve the planning efficiency [51]. However, the MCR model can only identify the spatial location of corridors and cannot determine the importance of a corridor [50]. To address this deficiency, we introduced the gravity model from physics to calculate the gravitational force between patches, further determining the importance of corridors and enabling the extraction of ecological corridors that require prioritized protection.
In recent years, extensive urbanization and large-scale land reclamation have led to increased fragmentation of the urban landscape and a decline in the ability of the ecosystem to repair itself. Therefore, it is crucial to construct an ecological network within the city center. This study aimed to identify source patches using the MSPA method and landscape connectivity indices. Additionally, we gave special consideration to the negative impacts of economic development on urban ecology. To this end, we constructed an integrated resistance surface that incorporated both natural environment and social factors. Subsequently, we extracted and prioritized ecological corridors using the MCR model and the gravity model to establish an urban ecological network.
The study aims to address the following questions:
Research Question 1 (RQ 1): How can we accurately identify ecologically connected sources in a city ecosystem that is subject to high levels of human disturbance?
Research Question 2 (RQ 2): How can we fully account for the effects of natural and human disturbances on ecological resistance?
Research Question 3 (RQ 3): How can we scientifically evaluate and optimize ecological networks in a region to support biological flows and enhance landscape connectivity?

2. Materials and Methods

2.1. Study Area

The Chaoyang and Nanguan districts in the Changchun City of China (124°18′–127°05′ E, 43°05′–45°15′ N) were chosen as the key study regions (Figure 1). The total study area is about 816.81 km2. The Nanguan district occupies a prominent position within the Dahei Mountain Range Belt, located along the Yitong River, a tributary of the Songhua River, and is a pivotal driver in the future construction of the Southern New City. Chaoyang District is the economic, political, and cultural center of Changchun. Rapid urban expansion has led to major land use conflicts in the central urban areas of the two districts, causing serious damage to the regional ecosystem. The study area is unique as it combines fragile forest ecosystems with rapid urbanization. This unique combination distinguishes the study area from other regions and produces ecological features that deviate significantly from the norm.

2.2. Data Sources

The data used in this study include (1) the administrative boundaries of the study area were taken from the Planning Cloud website (http://guihuayun.com/ accessed on 1 August 2022), (2) land use data for 2020 sourced from the global GlobeL and geographic information public product (http://www.globallandcover.com/ accessed on 1 August 2022), (3) a 30 m resolution digital elevation model and Landsat8 OLI imagery of 2020 (http://www.gscloud.cn/ accessed on 1 August 2022), (4) the road network data for the study area from the Open Street Map (https://www.openstreetmap.org/ accessed on 1 August 2022), and (5) the Changchun City Statistical Yearbook 2020 from Changchun City Bureau of Statistics (http://intellsearch.changchun.gov.cn/ accessed on 25 August 2022).

2.3. Methods

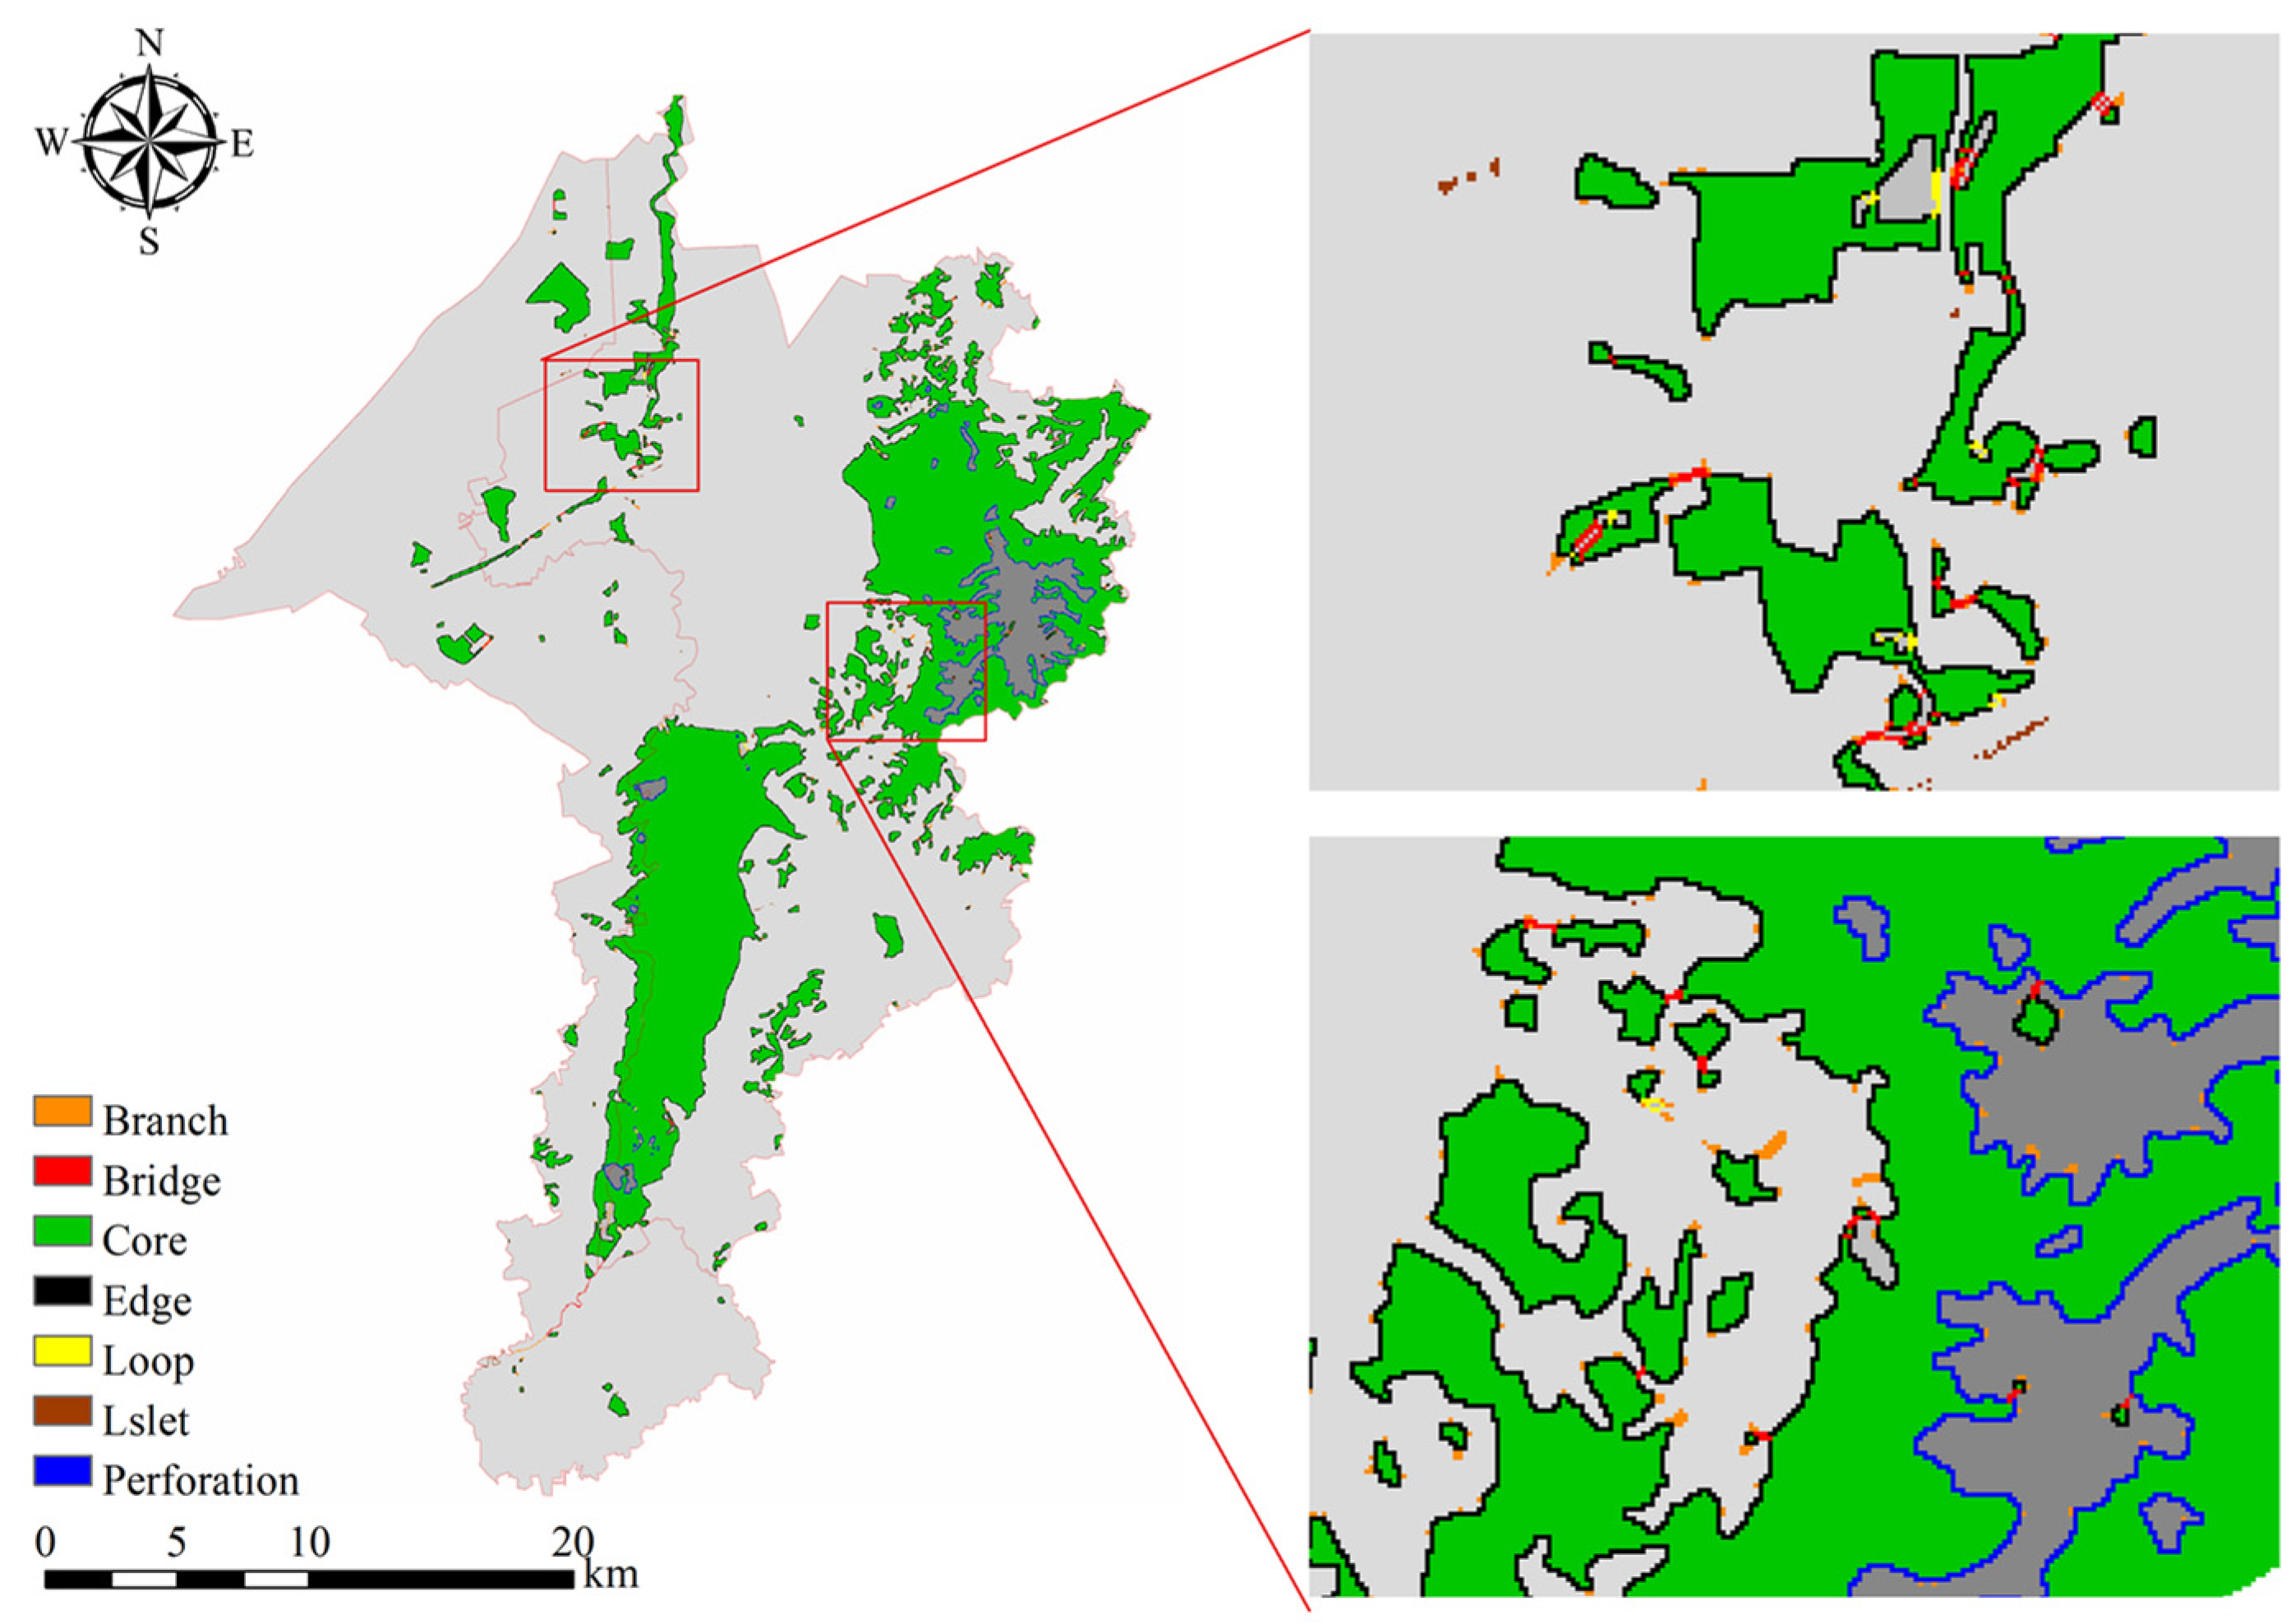
2.3.1. Landscape Pattern Analysis Based on MSPA

MSPA can measure, identify, and segment the spatial pattern of the grid images of the study area [34,35]. It can accurately identify the landscape type and structure and divide them into seven types of non-overlapping network structure elements, such as core, islet, and bridge.
Referring to prior research [40,52], the woodland and water area were set as foreground files, and the other land types were set as background files. We used the eight-neighborhood analysis method in the MSPA on Guidos Toolbox 2.8 software to analyze the landscape pattern. As different parameter sets will lead to different analysis results, and the number of landscape types and areas will change with the distance threshold, after many trials, the final image size was set to 30 m × 30 m, and the edge width was set to 1 [53].

2.3.2. Ecological Source Area Identification

A landscape connectivity analysis of the core patches identified by the MSPA was conducted, and the final ecological source was determined according to the commonly used landscape connectivity indices [54]. The landscape connectivity indices reflect the degree of connectivity between patches in the landscape, and it is an effective measure of whether the landscape types in the region are conducive to biological migration and energy flow [55]. Commonly used landscape connectivity indices include the integral index of connectivity (IIC), the probability of connectivity (PC) index, and the patch importance (dPC) index [56]. The calculation formulae are as follows:
IIC = i = 1 n j = 1 n ( a i a j 1 +   nl ij ) A 2 ,
PC = i = 1 n j = 1 n a i a j p ij A 2 ,
dPC = PC     PC remove PC × 100 % ,
where i = j, n is the total number of patches within the study range; ai and aj represent the areas of patches i and j, respectively; nl ij represents the number of connections between patches; A 2   is the total area of study patches; and Pij represents the maximum possibility of species diffusion between patches. The PC value range is [0, 1], the smaller the value, the lower the connectivity between the patches, the more detrimental to the species communication; PCremove represents the landscape connectivity after removing a plaque, and the PC value changes with the removal of a plaque. The more important the plaque, the greater the value change.

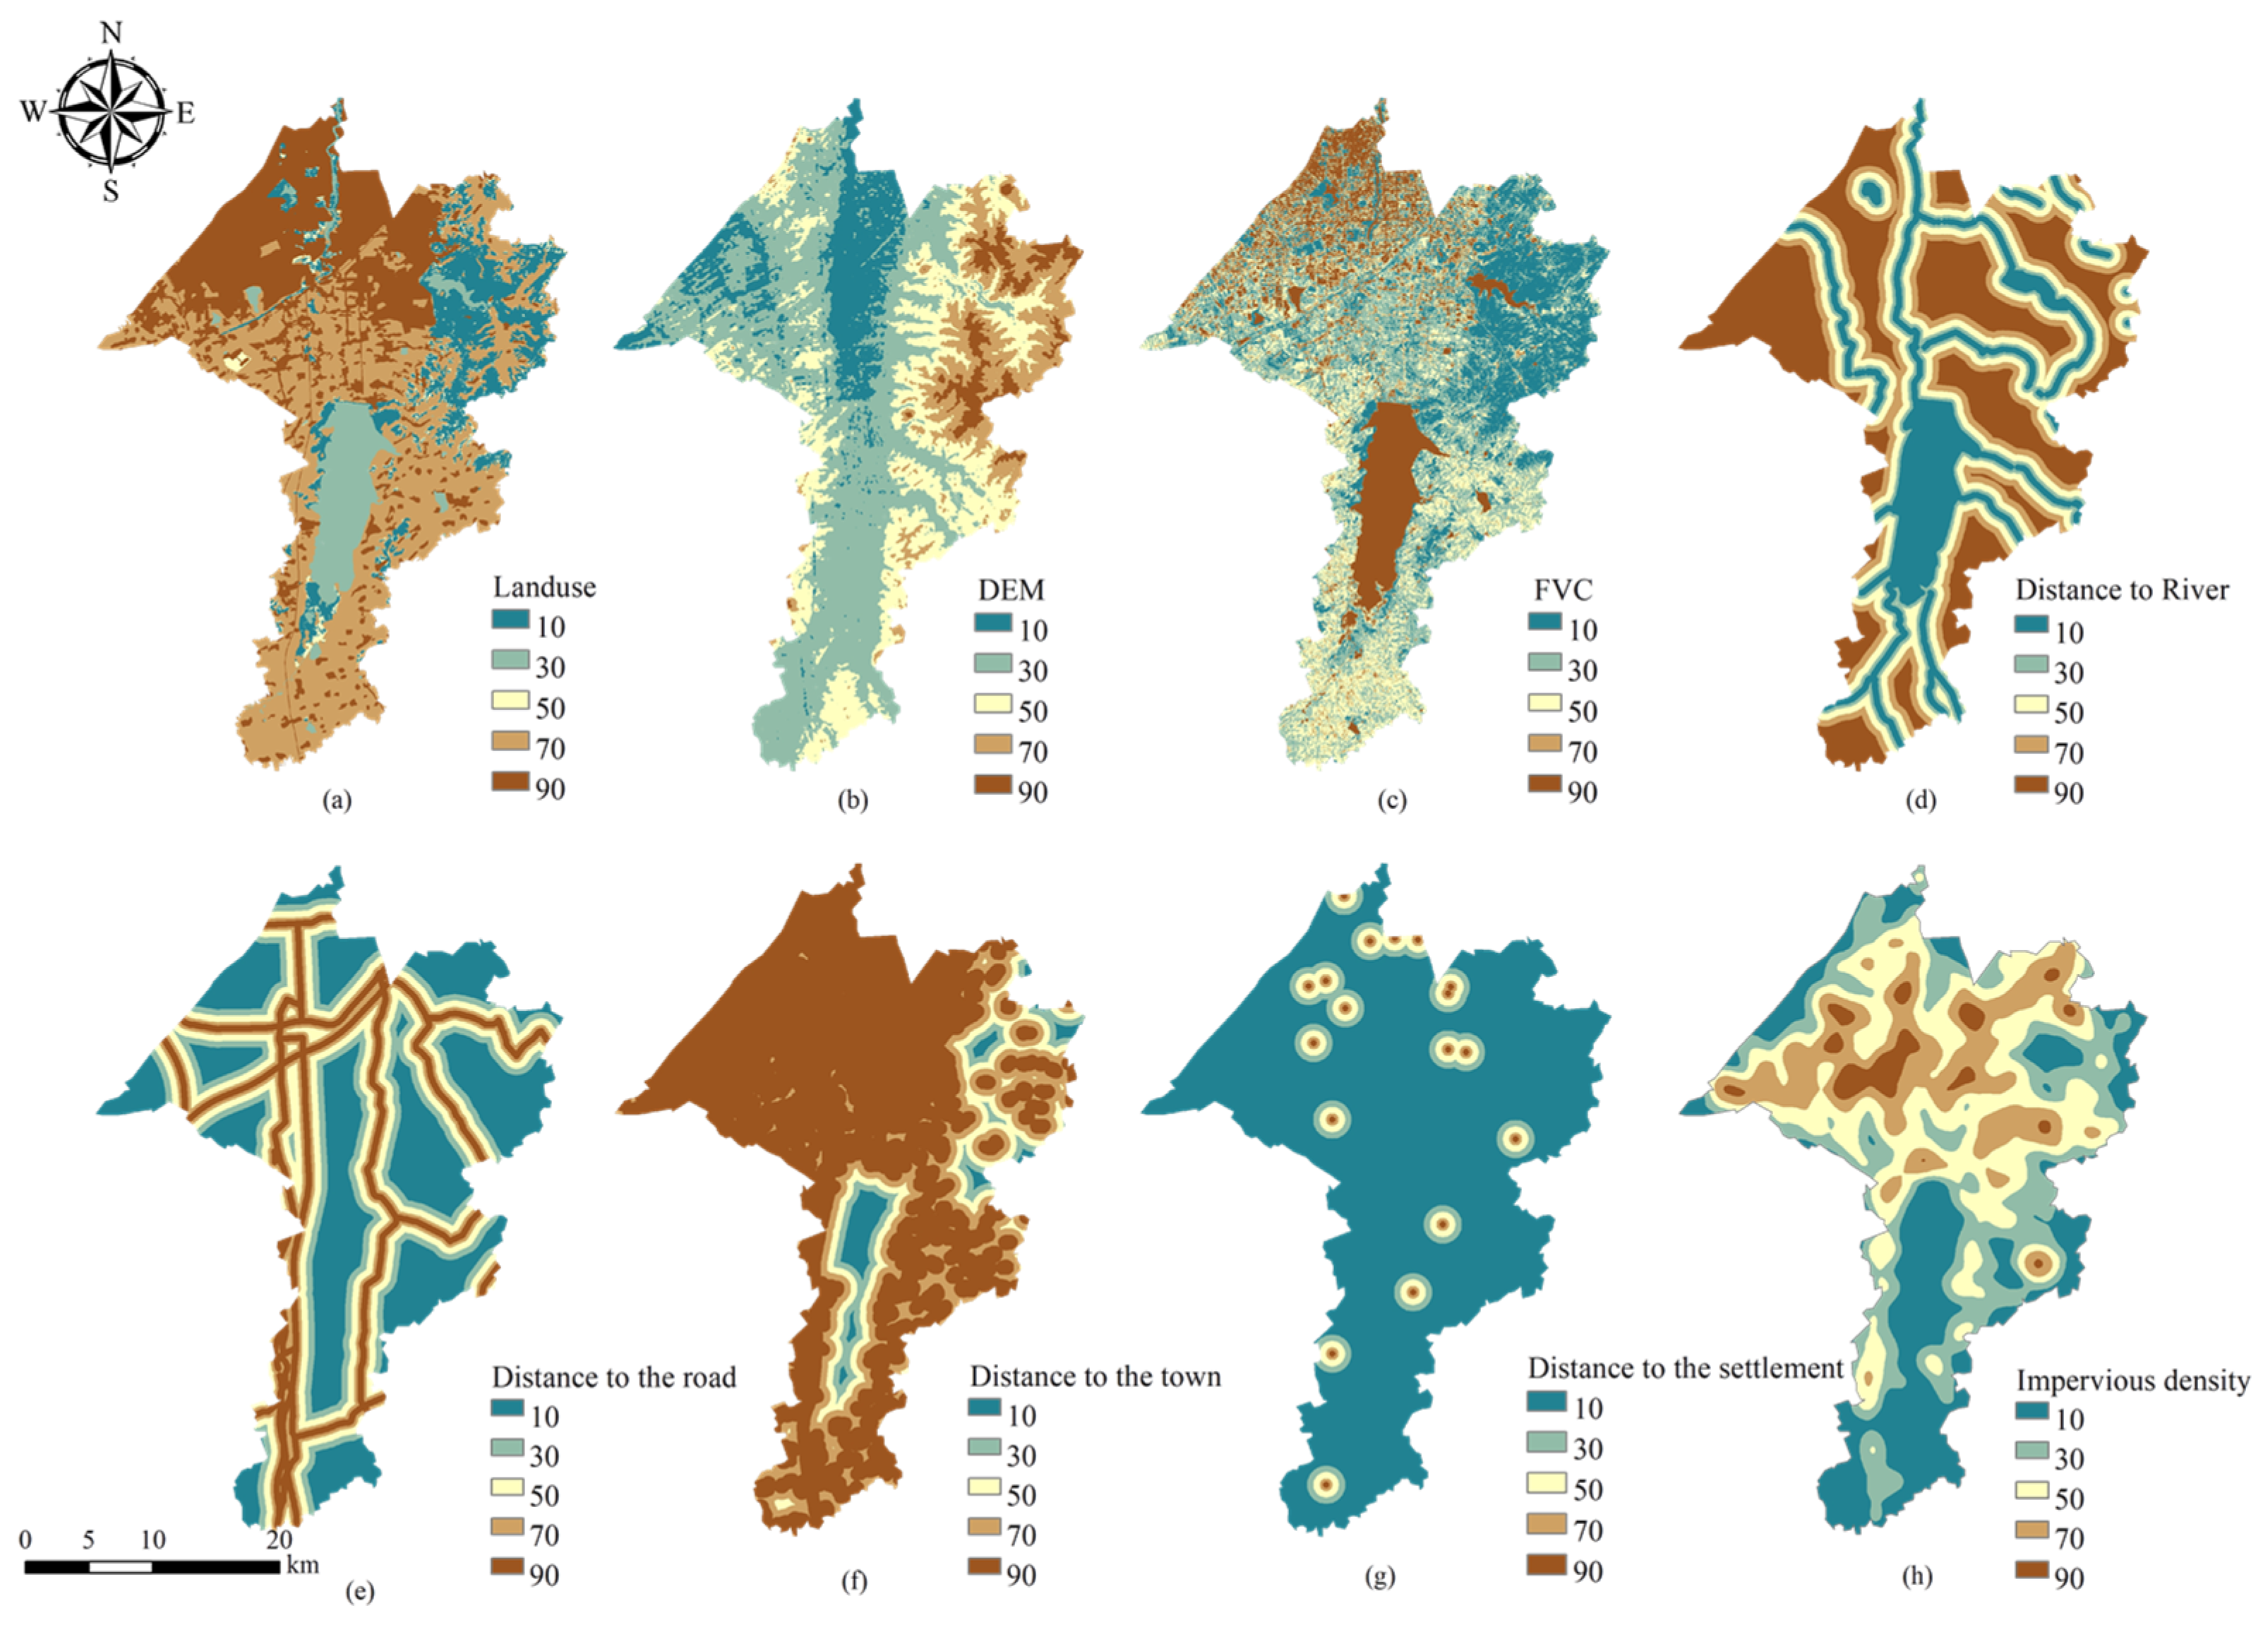
2.3.3. Eco-Resistance Surface Construction

The ecological resistance coefficient reflects the obstruction of biological flows in the migration process [47]. Considering that the study area is highly urbanized, the flow of organisms is inevitably disturbed by human activities. Therefore, we selected eight factors comprising both natural conditions and human disturbances as resistance indicators to compensate for the partiality of single factor evaluation. Among them, land use type reflects land use and nature, elevation has a higher impact on species migration, vegetation cover can reflect biodiversity to a certain extent, and elements such as roads, settlements, and construction land have an ecological stimulating effect and can impede the flow of organisms. We assigned values to the resistance factors at all levels with reference to previous research results [57,58]. The Hierarchical Analysis Method (AHP) was used to calculate the weights of each resistance factor and constructed a comprehensive resistance factor index system(Table 1).

2.3.4. Ecological Corridor Extraction

The Minimum Cumulative Resistance (MCR) model was first proposed by Knaapen and used for ecological model evaluation [59]. The MCR model obtains the optimal path for species migration by calculating the least-cost paths constructed on the basis of resistance surfaces between “sources” and “sinks” [49]. The calculation formula is as follows:
MCR =   min j = n i = m ( D ij × R i ) ,
where m denotes the number of patches i; n denotes the number of ecological sources j; Dij denotes the spatial distance from i to j; and Ri denotes the resistance coefficient of i to the movement process of a certain species.
The strength of interaction between the ecological sources and the target can be quantitatively assessed using the gravity model. With a higher interaction value, the importance of the potential corridor in the regional ecosystem increases [28]. The calculation formula is as follows:
G ij = L max 2 ln ( S i ) ln ( S j ) L ij 2 P i P j ,
where G ij denotes the interaction strength between ecological sources i and j; Si, Sj are the areas of sources i and j, respectively; Lij indicates the corridor resistance values between sources i and j; and Lmax is the maximum resistance value in each corridor in the study area.

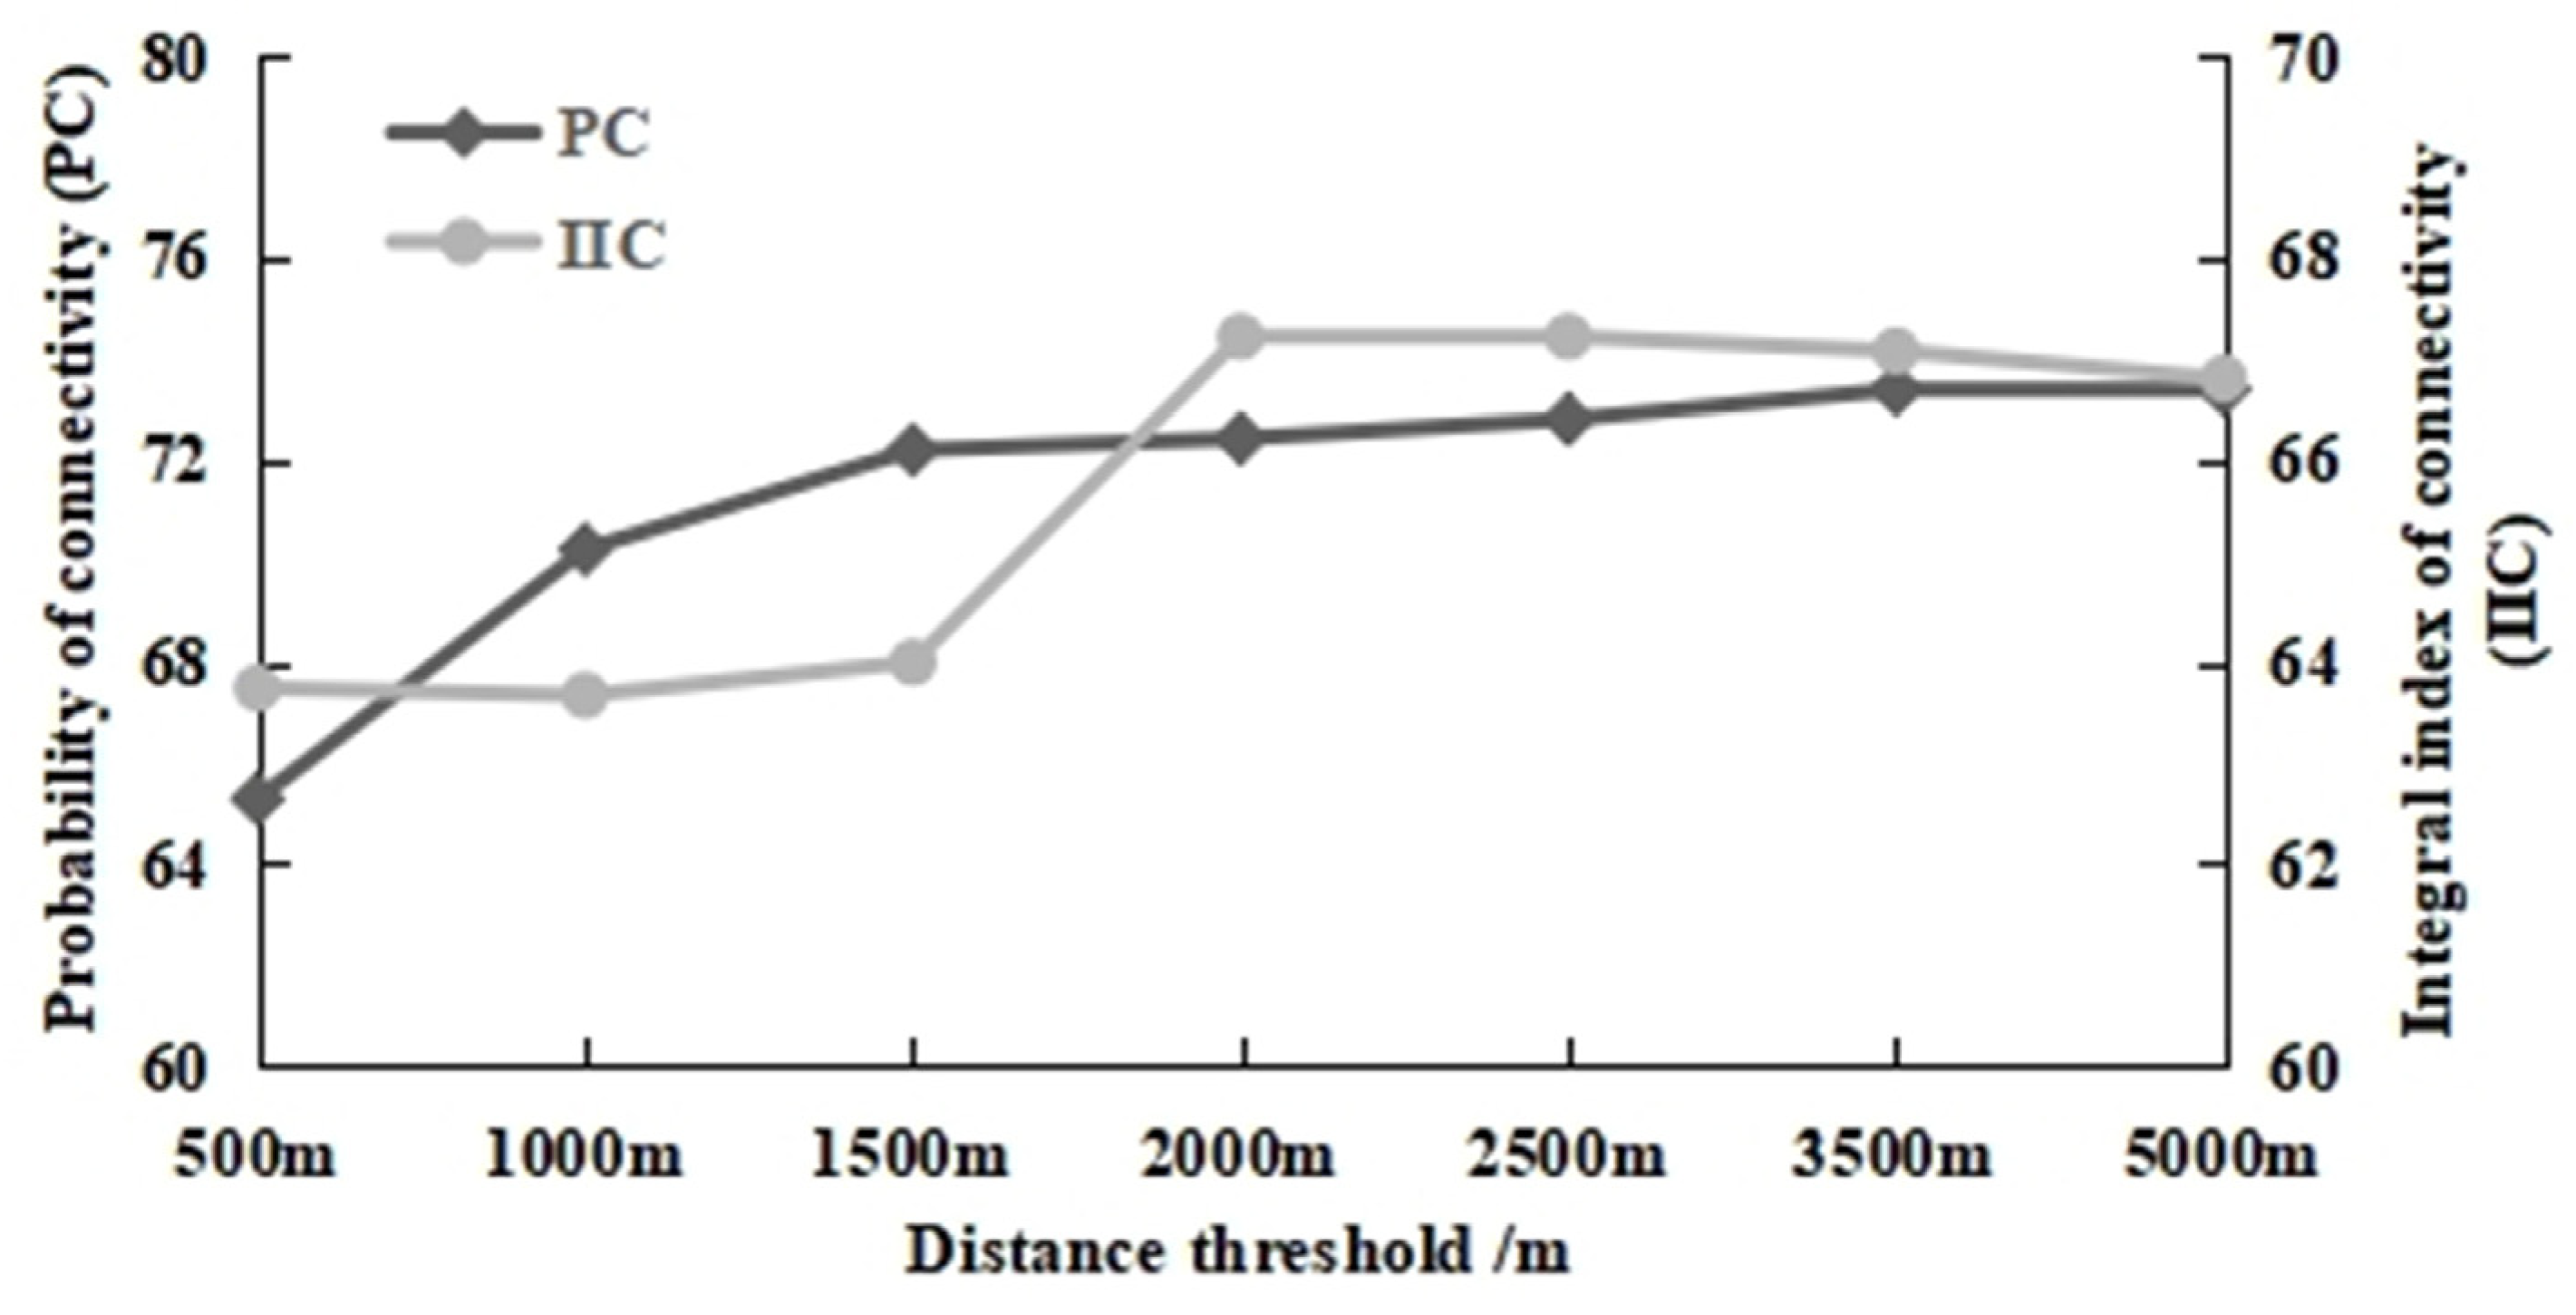
2.3.5. Ecological Network Connectivity Evaluation

Network connectivity quantifies the degree of connectivity of a regional ecological network [60]. In this study, the intersection point of the cost path and the shortest path, that is the ecological node, was identified using the network closure index ( α index), network connectivity index ( β index), and network connectivity rate index ( γ index) [61]. This was done to assess the ecological network system. Additionally, it reflected the connection between the ecological sources and corridors and the benefits of ecological network optimization. The formulae are as follows:
α = L     V   + 1 2 V   5 ,
β = L V ,
γ = L 3 ( V   2 ) ,
where L is the number of ecological corridors and V is the number of ecological nodes.

3. Results and Analysis

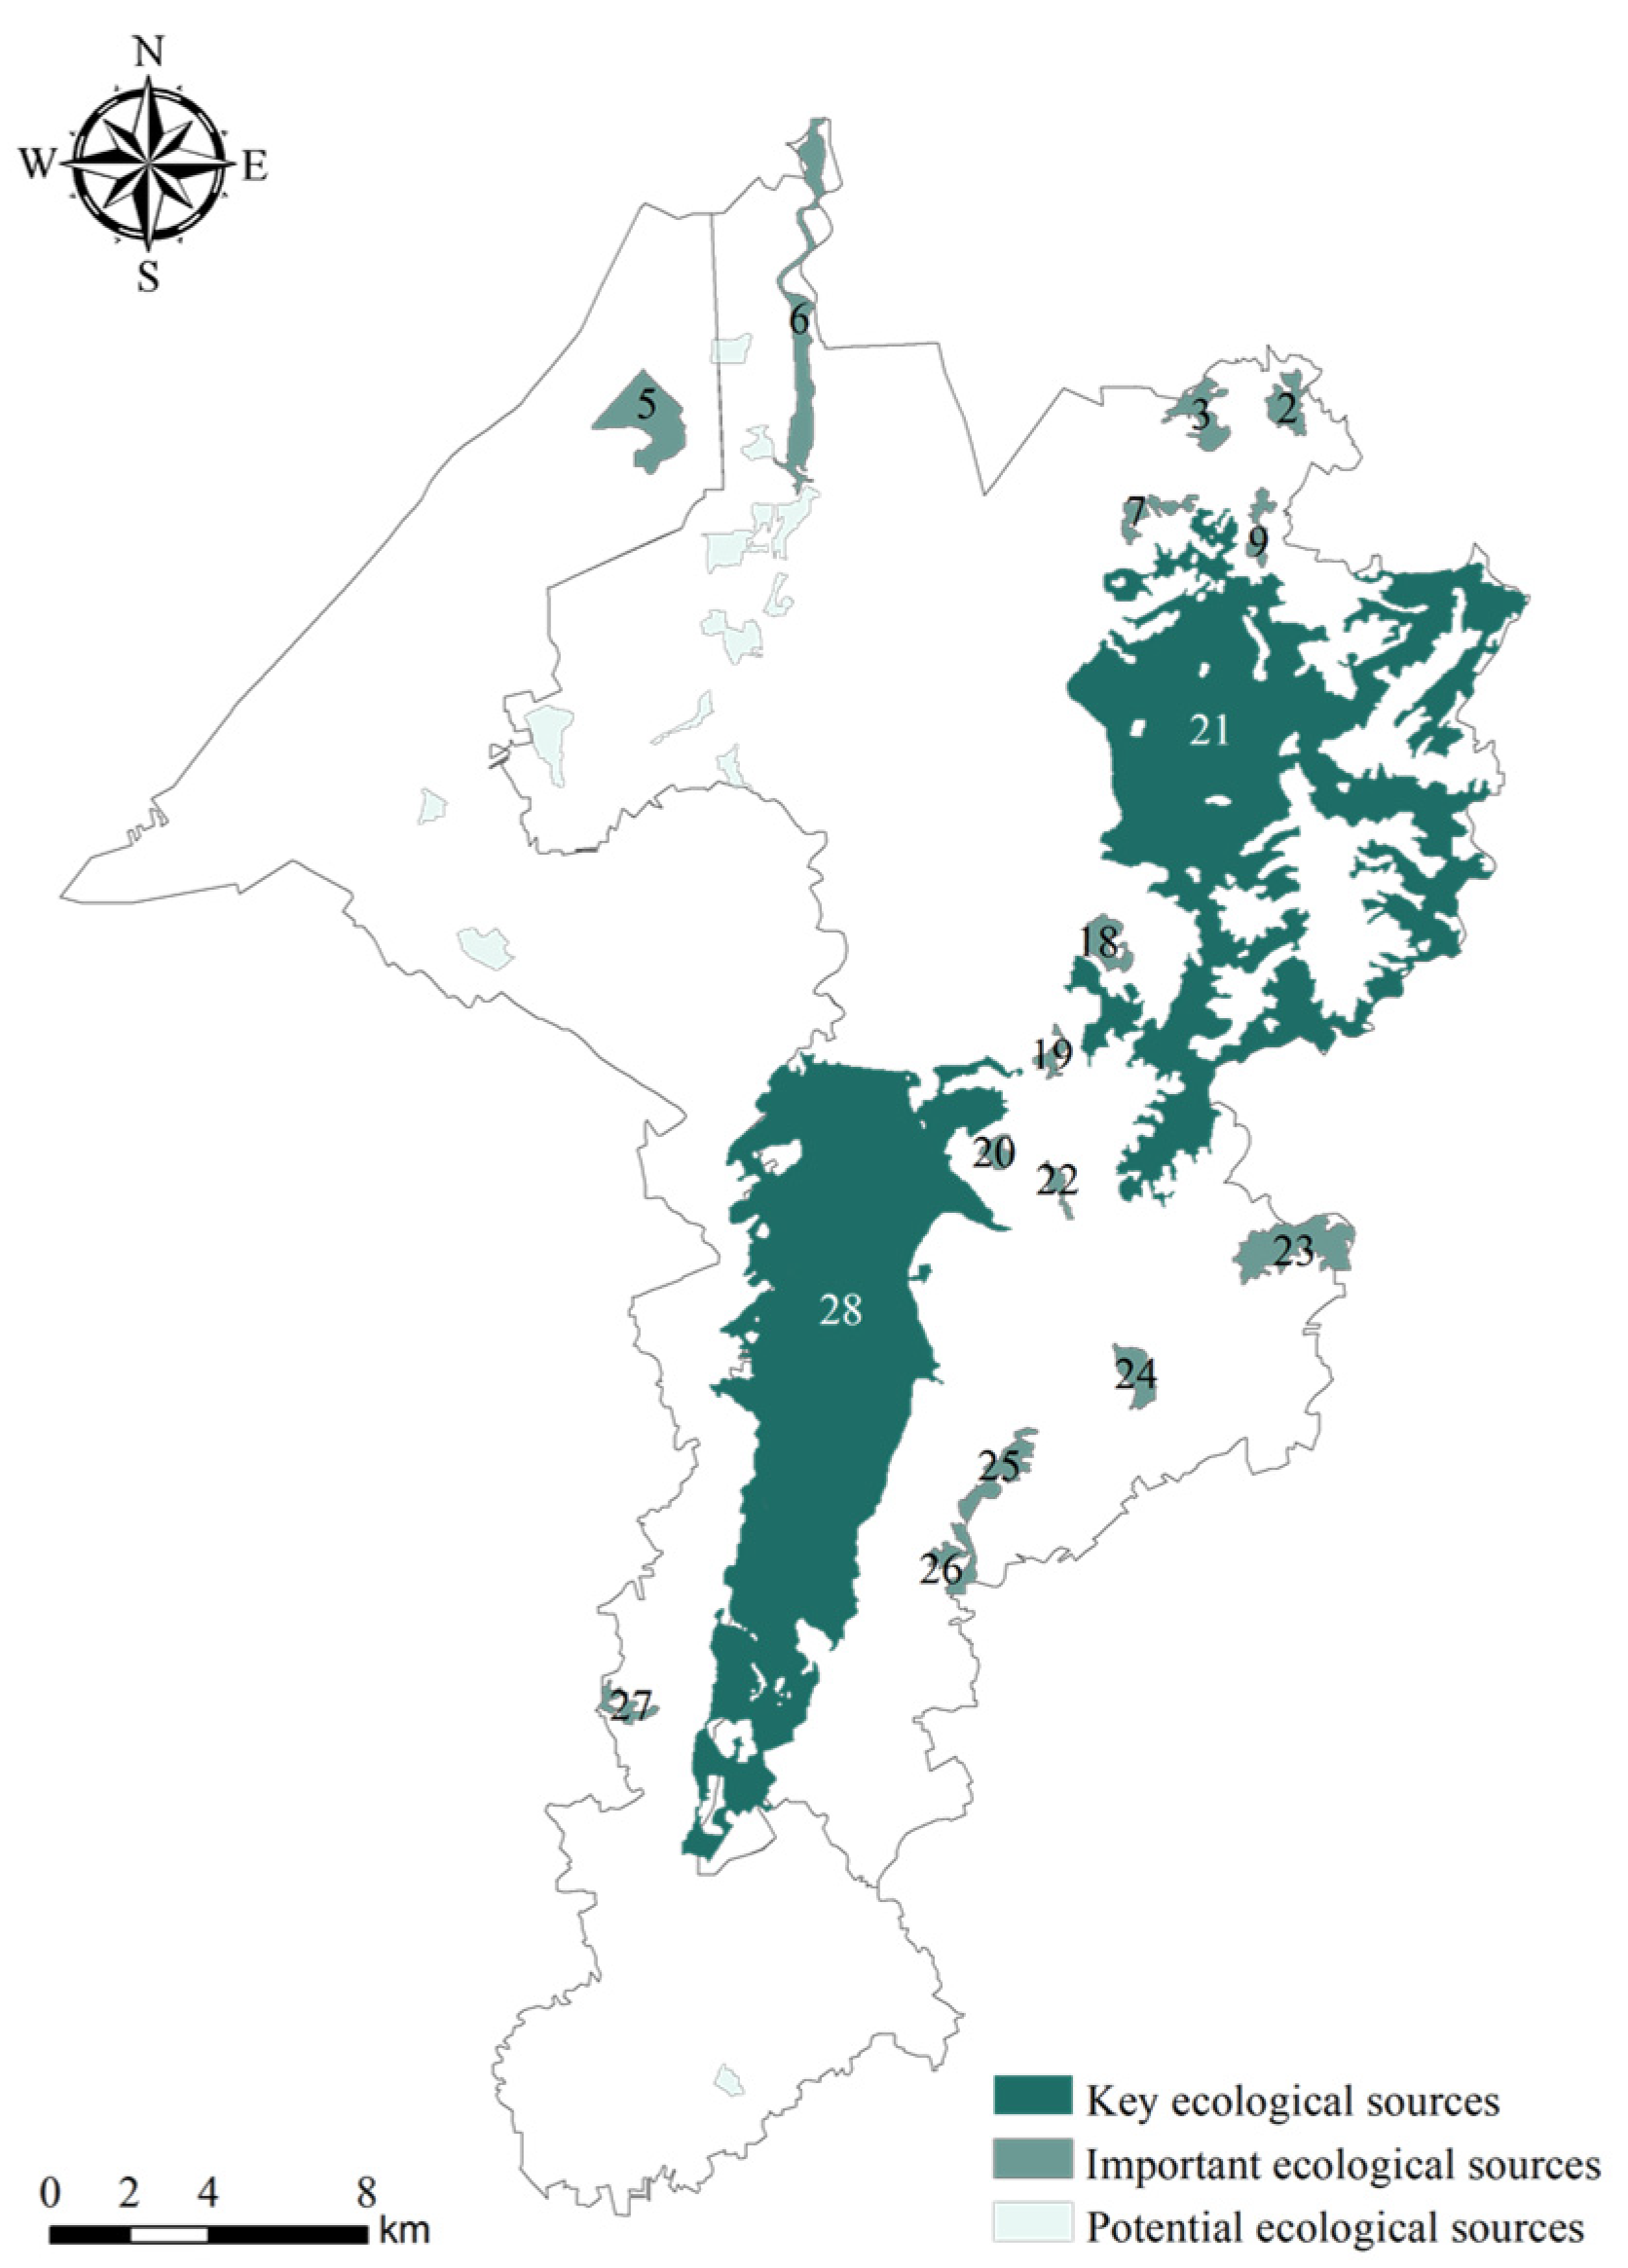
3.1. Identification Results of Ecological Sources

The area of each MSPA class in Figure 2 was calculated and is shown in Table 2. The total foreground area according to the MSPA was 201.67 km², accounting for 24.7% of the total region, of which the core area was 173.97 km2, the largest proportion of all landscape types. The edge transition zone had the second largest area after the core zone, indicating that the patches had a good edge effect but there was higher patch fragmentation. The bridging zone occupied a small proportion of the foreground area, indicating that there were few corridors and poor connectivity between patches. The loop accounted for just 0.13% of the foreground area, indicating few internal migration paths and high migration costs. Islands made up only 0.15% of the foreground area, suggesting that the area could provide temporary habitat for migrating species. The branch constituted 0.91% of the foreground area, indicating that the landscape patches were weakly connected to the external environment.
To answer RQ 1, we used the MSPA and identified 289 ecological patches with more severe overall fragmentation. However, the ecological source needs to have a certain area to provide a habitat for organisms and perform the ecological radiation function. Therefore, according to previous relevant research and the actual situation, we considered core patches with an area greater than 0.3 km² as the potential ecological sources and found 29 core patches matching the criterion.
The landscape connectivity index was calculated for the 29 potential ecological sources. To improve the accuracy and scientificity of the calculation results, it was imperative to set an appropriate patch connection distance threshold before calculating the landscape connectivity indices [62]. We defined seven distance thresholds based on the distance gradient method [63,64]. The Conefor 26 was used for calculating the connectivity index between patches for each threshold value. Table 3 and Figure 3 show the results.
Landscape connectivity is influenced by the threshold value when it ranges from 50–1500 m. This suggests that the distance threshold within this range does not accurately reflect the landscape connectivity of the area. However, when the threshold value exceeds 2000–2500 m, the curve’s growth slows down, indicating a more stable landscape connectivity. In this interval, all the important patches in the region are connected to each other [65,66]. When the distance threshold exceeds 2500 m, the PC and IIC values remain unchanged, suggesting that all the patches in the region are interconnected. However, this does not align with the actual situation. Therefore, we determined that 2500 m was the appropriate connectivity threshold. To calculate the importance index of potential ecological sources, we set the connectivity probability to 0.5 and used the Conefor 2.6 software for analysis [22]. Seventeen ecological patches including two key source patches with a dPC value greater than 0.1 were extracted as important ecological sources. The total area of the 17 patches was 165.74 km², accounting for 95.27% of the core area. The patches were distributed across urban woodlands and water bodies and had good overall quality, but showed obvious north-south spatial differences, with few habitat patches found in the urban center (Table 4, Figure 4).

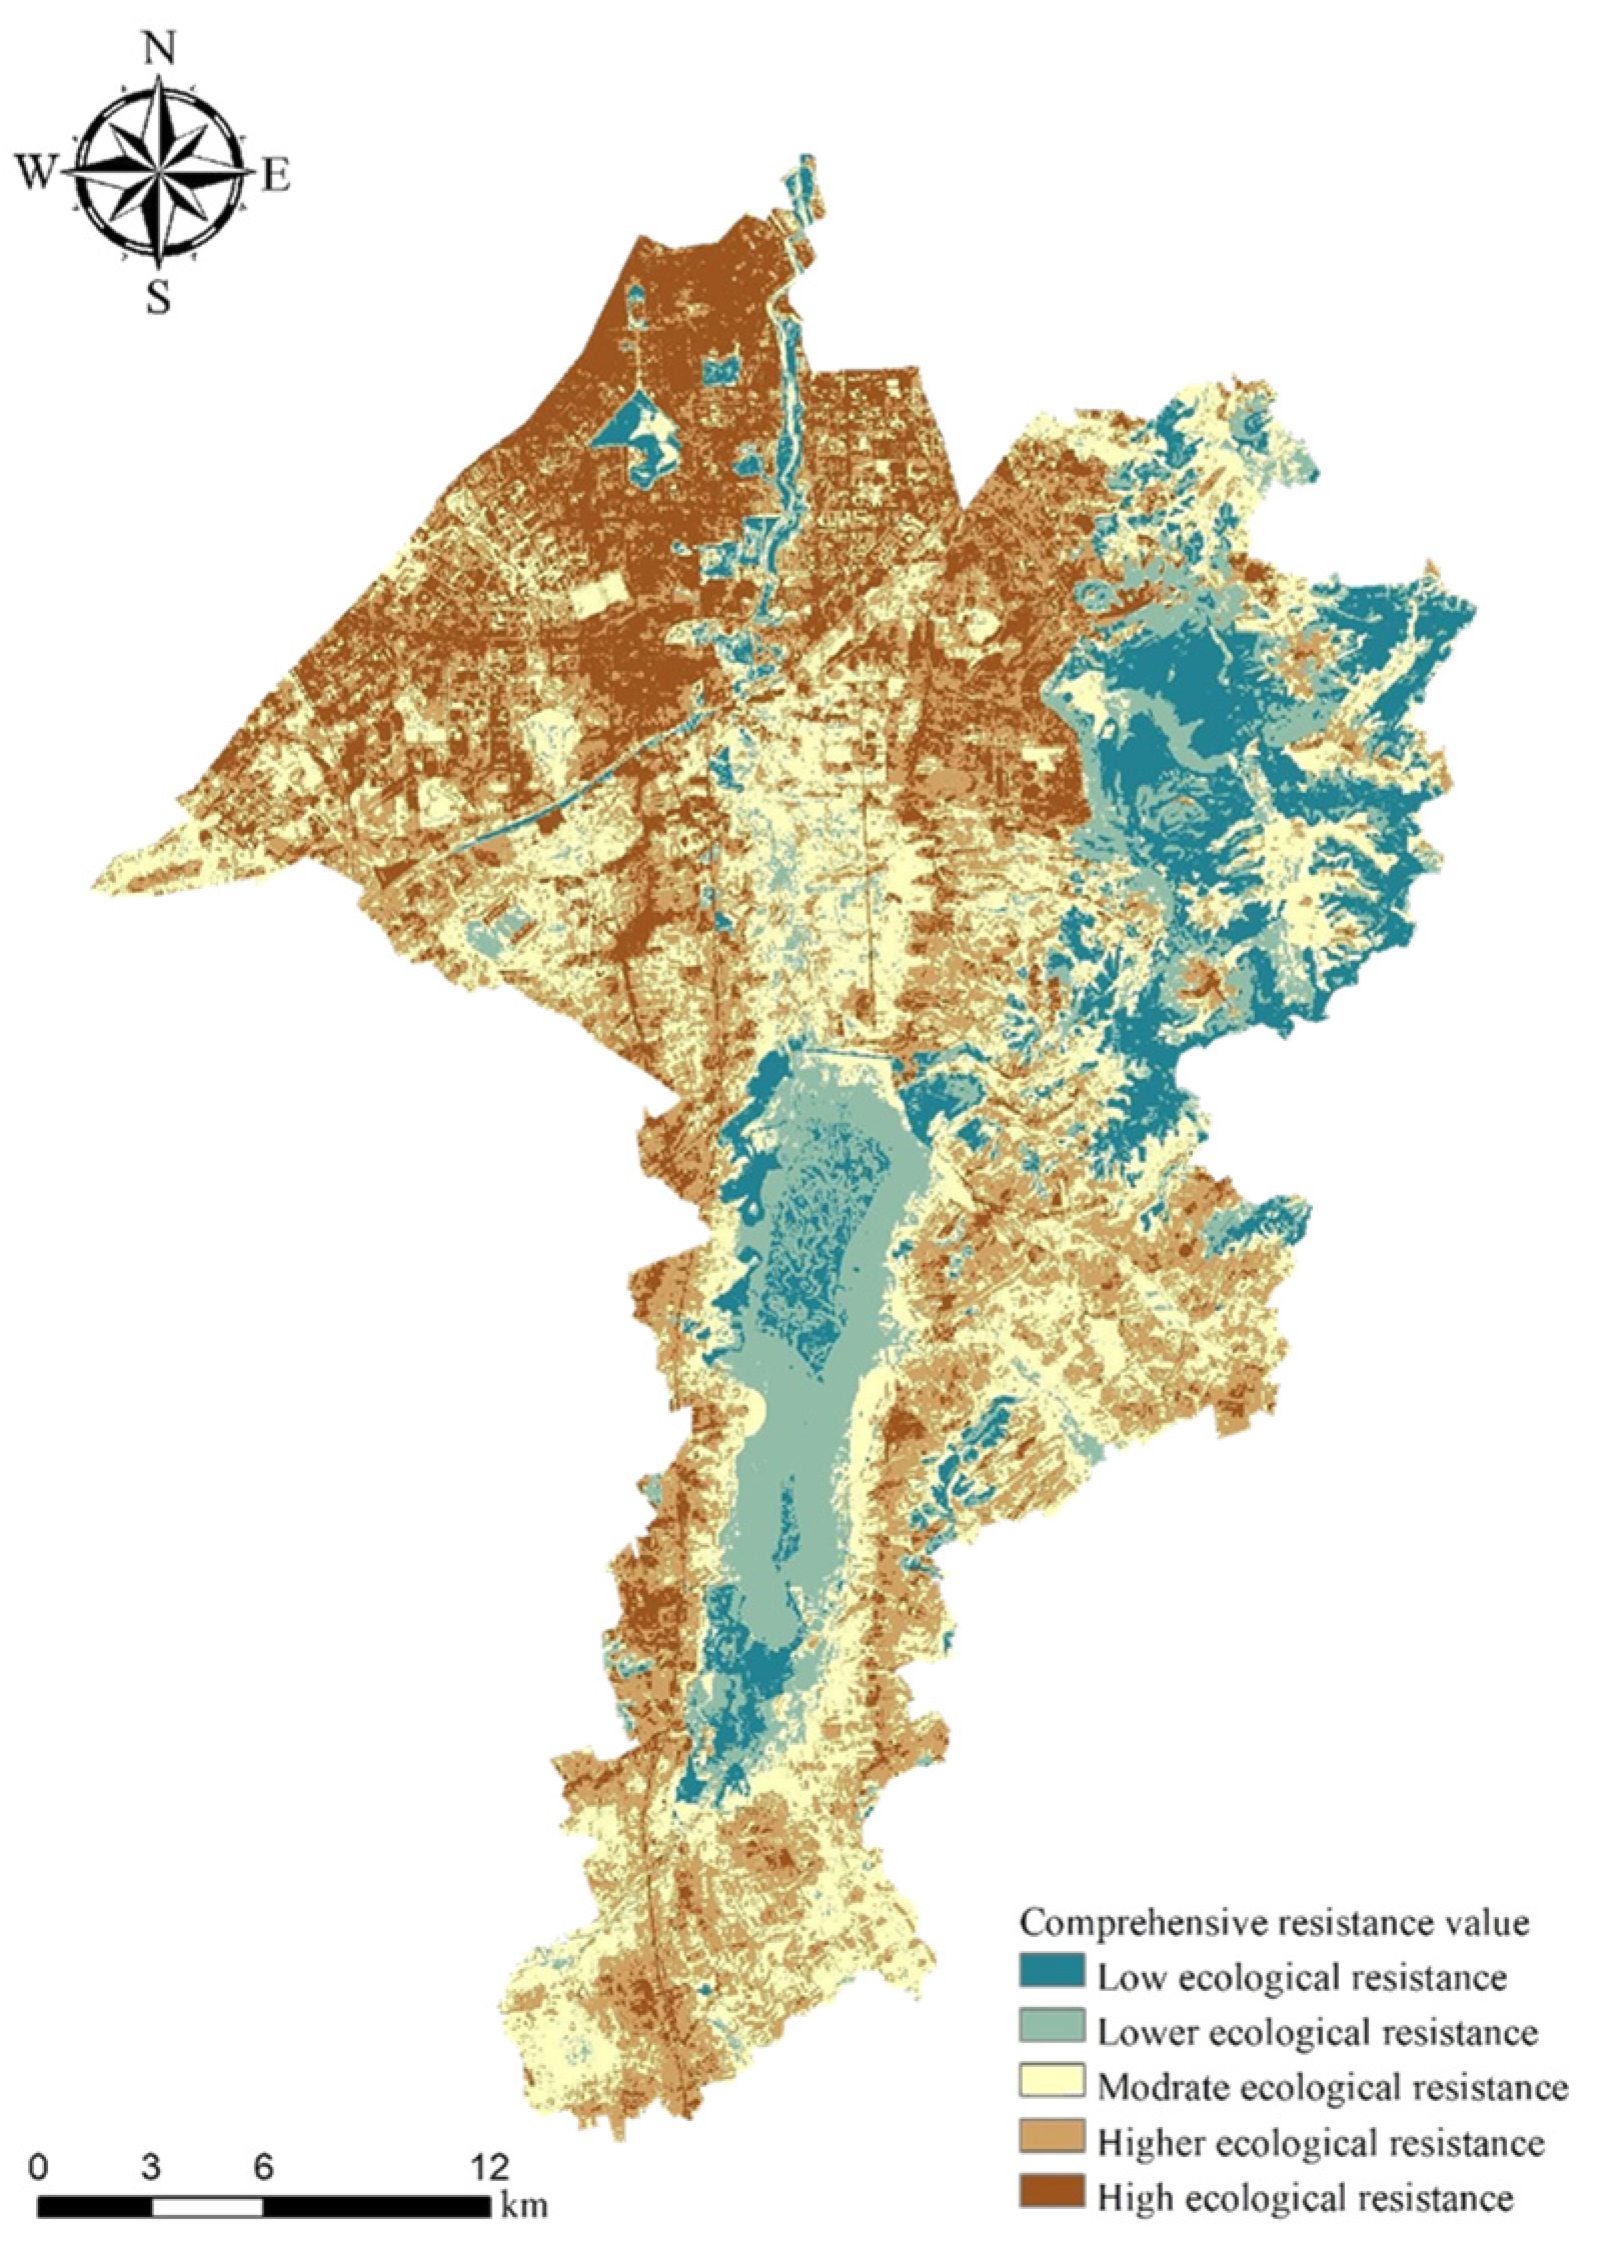
3.2. Construction of Ecological Resistance Surfaces

To answer RQ 2, we chose land type, elevation, vegetation cover, and distance from the river as natural resistance factors. As shown in Figure 5a–d, the study area was gently terraced and ecological resistance was mainly influenced by land type and vegetation cover. The forest resources were concentrated in the eastern mountainous region. Ecological resistance was the lowest near water sources, and there was higher ecological resistance around natural mountainous areas. Urban construction space had the strongest resistance effect on ecological flow. Social factor resistance was assessed in terms of distance from roads, distance from towns, distance from settlements, and impervious surface density (Figure 5e–h). As can be seen from the figure, built-up land occupied the majority of the study area. The area with high building density was concentrated in the north-central part and gradually expanded to the southeast, increasing the impervious surface density of the city. An integrated resistance surface was constructed by combining natural and anthropogenic factors. As shown in Figure 6, the overall resistance in the study area was high in the northwest and low in the southeast. The southern part was rich in ecological sources and had a low integrated resistance value. The high ecological resistance area was located in the northern part of the study area, which had a higher concentration of economic development zones such as Happiness Township, Dongfeng Village, Nanling, and Hongcheng Street.

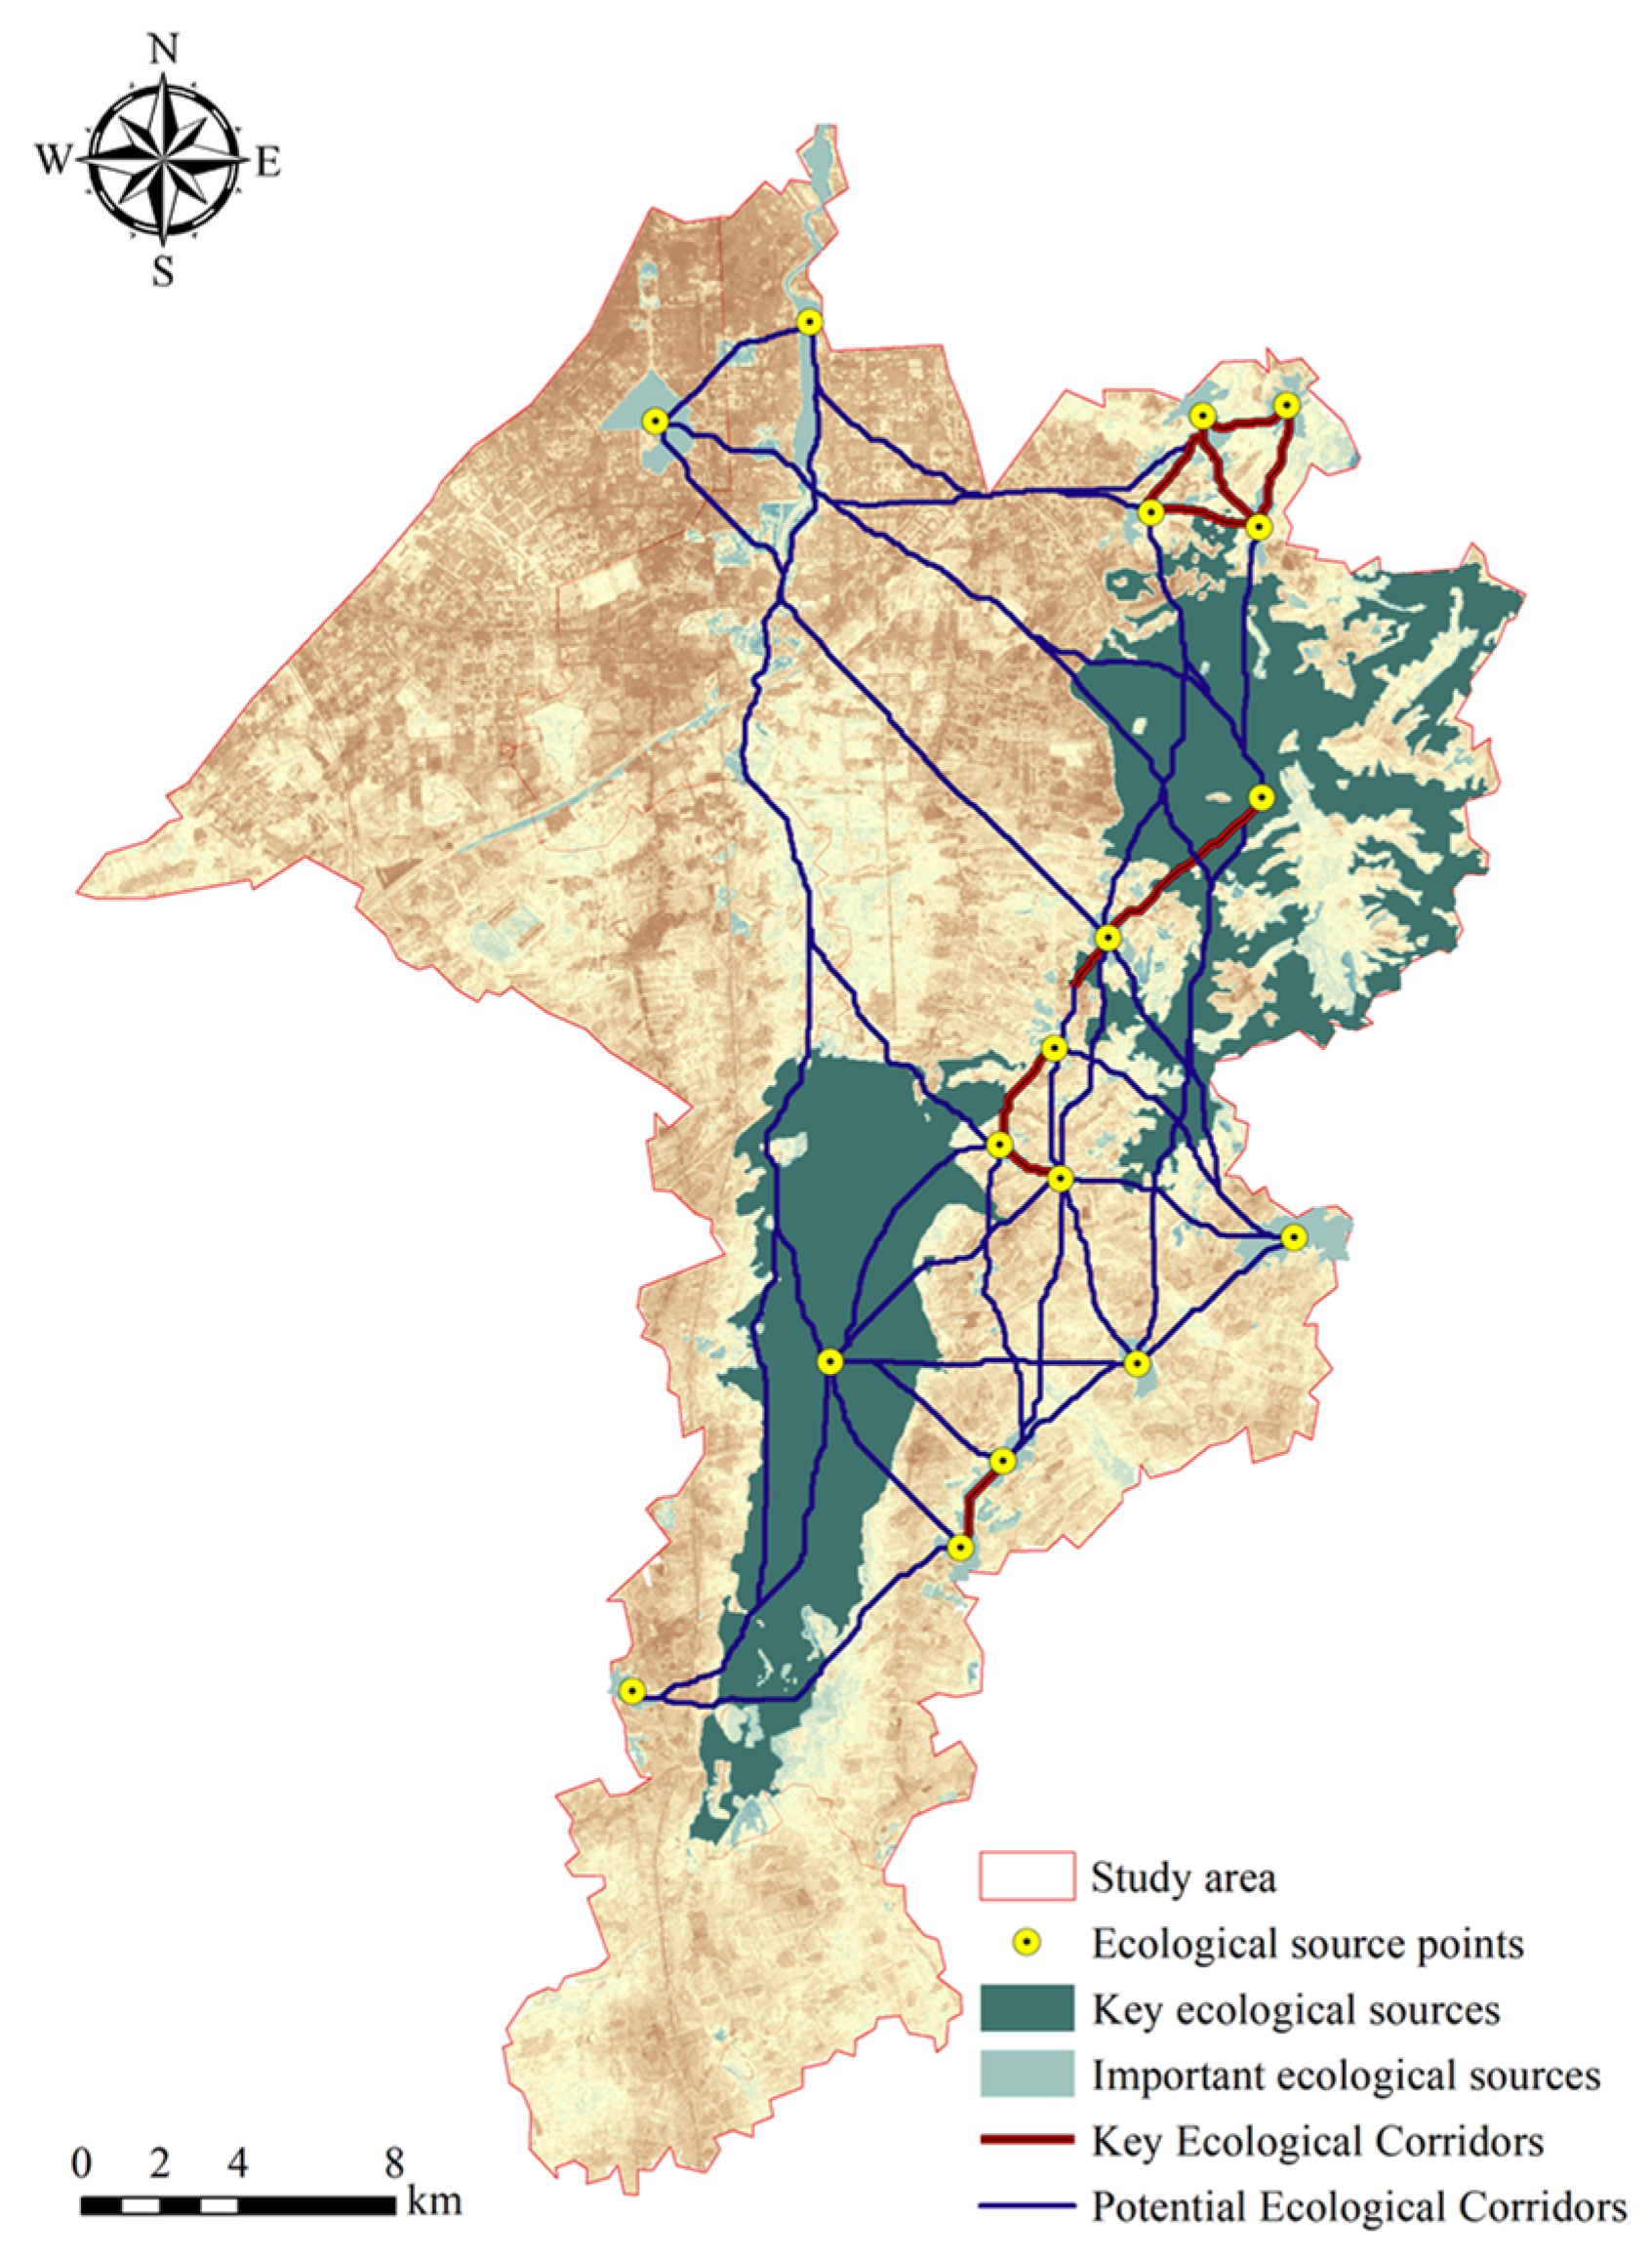
3.3. Ecological Network Construction

Based on the identification of ecological sources and the developed integrated resistance surface, we used the ArcGIS 10.8 to calculate cost paths and generated 136 ecological corridors using the MCR model. After eliminating redundant corridor data, 34 potential corridors with a total length of 246.27 km were identified (Figure 7). The simulation results showed that ecological corridors were concentrated in the southeast. This is mainly attributed to the lower density of ecological sources in the north and longer distance between patches, resulting in higher connectivity costs, which could cause corridor breaks and unsatisfactory connectivity. The eastern region, including Yutan Town, Shengli Village, Fengyang Village, Xinlizheng Village, and Xinfengtun Village, had a relatively dense distribution of ecological corridors with shorter flow paths and was therefore appropriate for ecological self-restoration efforts.
To further assess the importance of ecological corridors, we calculated the interaction strength between sources using a gravity model. The constructed gravity model interaction force judgment matrix was used to grade the ecological corridors. Eventually, ten important ecological corridors with interaction force values exceeding 10 were identified (Table 5). These relatively low-risk corridors were mainly connected through woodlands and water bodies. Thus, we successfully constructed an ecological network for the Changchun city center area.

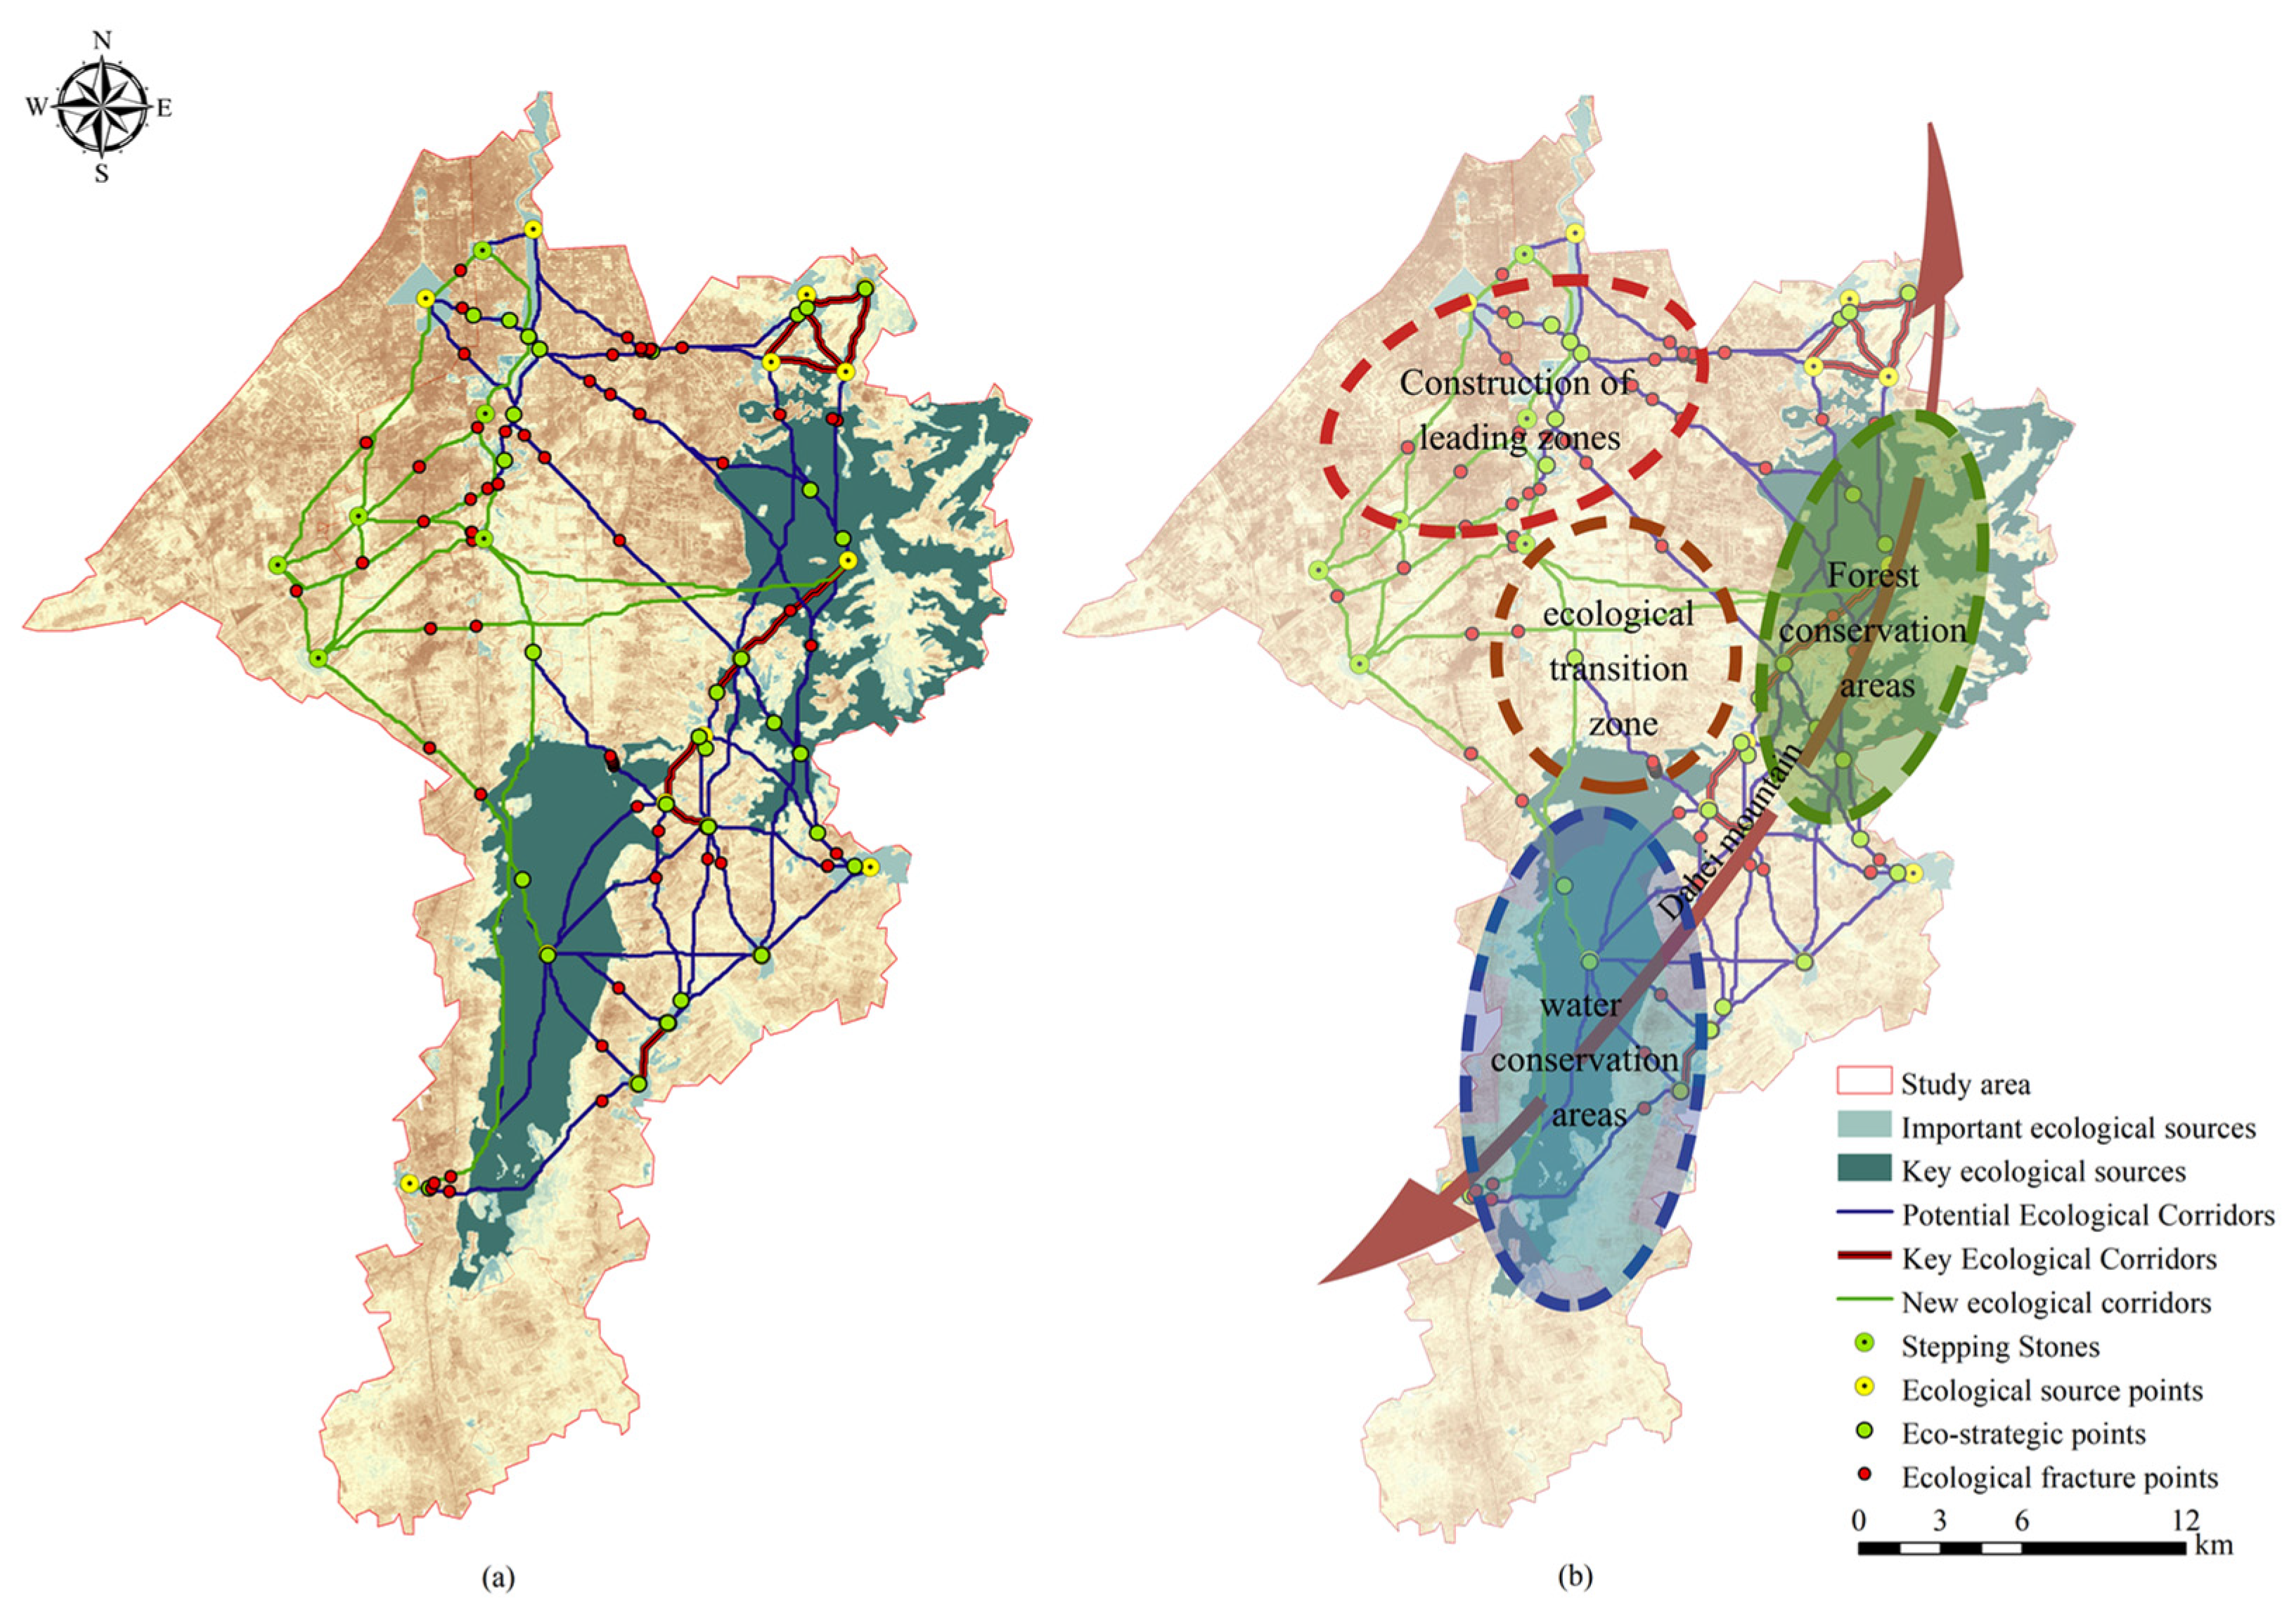
3.4. Ecological Network Optimization

Given its location in the city center, the north-central area experienced higher development and construction activities, resulting in a scarcity of ecological resources and a lack of corridor connectivity. In response to this issue, findings have confirmed that increasing source patches and ecological corridors was an important means of maintaining regional biodiversity [67]. Therefore, we used the importance index to guide the selection of supplemental sources and identified six core green patches within the northern study area as ecological source supplements. These patches were primarily located in green areas and water bodies along the periphery of the parks in the city. The integration of supplemental sources effectively achieved a balanced ecological layout between the northern and southern regions. We calculated the minimum cost distance between the original and supplemental sources using the MCR model and identified 25 potential corridors to connect with the original corridors using the gravity model.
Ecological nodes include ecological strategic points and ecological breakpoints. Ecological strategic points play a crucial role in facilitating high ecological flow within ecological corridors. Recognized for their irreplaceable nature and their ability to enhance landscape connectivity, ecological strategic points have emerged as a top priority in ecological conservation [58]. Critical ecological strategic points serve as vital “stepping stones” for organisms, facilitating their rest and transportation, as well as the flow of energy. By improving connectivity between patches, they offer security and support for the migration of organisms [68].
As shown in Figure 8a, 32 ecological strategic points were extracted for priority protection and restoration at the intersection of key corridors. These strategic points were primarily located in woodlands, watersheds, and croplands. Specifically, 24 strategic points were located in woodlands, predominantly scattered throughout the Nanguan District. Strategic measures, like nurturing young and medium-sized forests and transforming low-yielding forests, can be implemented to enhance the habitat quality of these stepping-stone patches [69]. There were three strategic points in water areas, where suitable aquatic plants can be selected to improve water quality and provide temporary habitats for organisms according to the region’s own ecological conditions. Additionally, five strategic points were observed in cropland and other land types. These areas require further reinforcement through restrictive measures to control human activities and enhance green infrastructure.
Ecological breakpoints are areas that impede movement between patches of ecological significance. By enhancing habitat restoration at these varied barrier points, landscape connectivity can be maximized, and the cost associated with species migration can be reduced [69,70,71]. We identified the intersections of ecological corridors with roads as ecological breakpoints, and there were 64 such points in the study area. Twenty-three of these breakpoints were located along national highways and seven breakpoints were located along provincial highways. For future planning and construction, it is crucial to ensure that sufficient green spaces are preserved at these breakpoints. Additionally, the construction of flyovers, green corridors, and culverts at these specific points can effectively reduce the likelihood of traffic accidents involving wildlife during their migration. The final ecological network optimization diagram is shown in Figure 8a.
Network analysis was conducted to assess the ecological network indices before and after optimizing the study area. Before optimization, the α, β, and γ indices were 0.62, 2.00, and 0.76, respectively. These values indicate favorable ecological network loop numbers, corridor structures, and connection strengths within the study area. However, the high construction costs of the ecological network were attributed to the extensive spatial coverage of ecological source areas from north to south and their uneven distribution. After the optimization, notable improvements were observed and the values of α, β, and γ increased to 0.9, 2.57, and 0.94, respectively. This enhancement decisively substantiated the significance of ecological network planning in augmenting the network’s connection levels within the study area.

3.5. Ecological Security Model

In accordance with the Changchun Urban Regional Spatial Master Plan (2021–2035) and the result of the ecological network optimization, we proposed a “one belt, two cores, and four zones” model. The primary objective of this model was to optimize the regional spatial pattern and strengthening the different spatial functions. Moreover, it aimed to facilitate the sustainable development of the ecosystem, and help governments, city administrators and city planners to make better decisions about the future sustainability of the city [61]. (Figure 8b).
The belt in the model is the Dahei Mountain Range ecological protection belt. The Dahei mountain range is located in the southeastern part of the region and is one of the “three veins” in the land spatial layout of Changchun City. The ecological sources were mainly concentrated in the Dahei Mountain Range belt, which bore the ecological service function of Changchun City by its excellent resource conditions. It was of great significance for the ecological sustainable development of Changchun City. Therefore, the government and city managers should prioritize the protection and restoration of this area in future urban construction.
The two cores and four zones in the model include the following regions: (1) the forest reserve centered around the Jingyuetan National Forest Park serves as the ecological green heart of the study area and plays a vital role in maintaining the ecological cycle and promoting sustainable development in the region. However, this particular region, situated atop the mountains, lacks connectivity with the patches in the city center. To address this problem, it is essential to enhance the protection, monitoring, management, and restoration of the core green areas and degraded forested areas. Additionally, a rational approach is needed to plan and maintain green areas on the outer edges by constructing green corridors. These corridors will ensure the continuous and stable flow of ecological resources throughout the region. (2) Xinlicheng Reservoir serves as a crucial water supply source for Changchun City and is the core component of the water resource protection zone. Currently, the ecological resistance in the surrounding region is high, making the stability of ecosystem function prone to disturbances. To address this issue, it is paramount to standardize the management of the nature reserve, strengthen the protection of the natural ecological environment in the reservoir basin, and promote the restoration of the water system coastline [72]. (3) The ecological transition area is primarily composed of arable land and construction land, lacking internal ecological source areas. First, the potential ecological value of arable land can be tapped, and the area can be strongly encouraged to develop modern urban agriculture, establish rice paddy theme parks, and create habitat space for wildlife. Second, the planned agglomeration of rural populations in key counties and townships can, to a certain extent, alleviate the problem of landscape fragmentation brought about by disorderly construction [73]. (4) Construction-led areas have a high economic development level and low regional eco-efficiency. Blindly expanding the area of green space is not a viable solution. City managers and planners ought to explore the historical and cultural significance of the city and construct artificial greenways to maximize the ecological service value of the region in limited space. The restoration of connectivity between core patches through the construction of artificial greenways is crucial for the protection and development of the region.

4. Discussion

4.1. Optimal Connectivity Threshold Facilitates the Identification of Key Patches

Distance threshold is an important parameter for landscape connectivity assessment, and determining an appropriate connectivity threshold is necessary for complete identification of ecological sources. Previous studies only considered that MSPA is sensitive to pixel size and edge widths [74,75]. However, it is worth noting that the choice of distance threshold also plays a crucial role in the accuracy of the final results [62,76]. Several studies have selected connectivity thresholds for species-specific dispersal distances. In a large urban agglomeration where landscape fragmentation was quite severe, 1400 m was identified as the optimal distance threshold according to the contribution of various factors to the spatial heterogeneity of bird survival [5]. In contrast, the optimal distance threshold for the rare white-headed crane was only 500 m [77]. It can be seen that the dispersal distance varies greatly among different species, and thus the choice of distance threshold spanned a wide range. However, there was no clear conclusion for the selection of distance thresholds.
In order to accurately identify high quality ecological sources, this study did not take direct reference to the results of previous studies to set the distance threshold subjectively but utilized the distance gradient method to explore the pattern of change of landscape connectivity index under different connectivity thresholds [63,64], so as to select the most suitable distance threshold for our study area and make the results more objective. As shown from the result, the landscape stability reached the highest when the threshold value was 2500 m. Therefore, 2500 m was identified as a suitable connectivity threshold, which was different from the results of previous studies. The reason was attributed to the fact that the study area is located in the center of the city, which was heavily influenced by human activities and has weak connectivity between sources. If the distance threshold was too small, it would not be able to meet the needs of biological dispersal in the city. Future studies should prioritize discussing the appropriateness of connectivity thresholds to select the optimal parameters for different study scales and species needs thereby improving the science of sources identification. According to the landscape connectivity index values, high-quality woodlands and water bodies could become important ecological patches, which is consistent with the findings of related studies, and also verifies the feasibility of our study in practice [31,78].

4.2. The Rationality of Constructing a Comprehensive Ecological Resistance Surface

The construction of ecological resistance surfaces is a key step in the extraction of ecological corridors [14]. In resistance surface construction, many previous studies opted for evaluating a single resistance factor, such as land type, or conducting resistance evaluation based on ecological sensitivity [30]. However, this study discussed the ecological network connectivity in urban centers, which would inevitably be disturbed by human construction activities. Therefore, we added anthropogenic factors to the natural factors to co-construct a complete resistance surface. Theoretically, this approach can more comprehensively and effectively assess the resistance effects on species migration [79]. As shown in Table 1 and Figure 5, land type, vegetation cover, and distance from towns had the largest weight, forming a high resistance area in the central built-up area, which showed a significant impediment to biological migration. Related studies pointed out that land type and vegetation cover were key factors affecting the quality of biological habitats [77], which was consistent with our results. Furthermore, the results showed a strong correlation between land use type and distance from roads and towns, further confirming that high-intensity development and construction and densely populated areas largely exacerbated the fragmentation of ecological patches and weakened landscape connectivity [80,81].

4.3. Optimization and Suggestions on Ecological Network Protection

This study established the ecological security model of “one belt, two cores and four zones” and proposed corresponding restoration strategies. Some scholars believed that regional connectivity could be improved by increasing ecological resources and restoring corridor barriers. Among them, forest reserves, as regional ecological barriers, should be prioritized for restoration, so as to guarantee the overall ecological security of the region [47]. Through returning farmland to forests, increasing vegetation cover and building ecological corridors along roads could promote material energy exchange. Scholars also suggested that areas with high connectivity were richer in biodiversity and have more frequent human activities [82]. Therefore, it should be prioritized to establish highly compact ecological networks in these areas to enhance the radiation effect of the region, thereby better facilitating species migration and energy flow.
In this study, we chose Changchun City as the study area. The region had a relatively large proportion of cultivated land and a relative lack of forest resources. Some habitat patches in the city center were unable to become biological habitats because of their small size, resulting in a broken ecological chain in the city center area. Therefore, the experience of the predecessors could not provide favorable recommendations for this type of city.
Moreover, it was not desirable to blindly expand the size of green space patches in the city. This study suggested that cultivated land has high potential ecological value as a new type of composite ecological space. The protection and comprehensive utilization of arable land can be strengthened, and ecological resilience can be improved by optimizing the land use structure, using idle farmland to develop modern agriculture, and constructing rice paddy parks [73]. This strategy can effectively improve the connectivity of the urban ecological network and provide a new idea for the same type of cities to balance economic development and ecological protection.

4.4. Limitations and Directions for Future Research

Although the ecological network identification scheme proposed in this study could reflect urban ecological connectivity more effectively, there still has some limitations. First, we chose open-source data that are easily accessible during the research process. However, the data collected by different organizations or departments may differ in scale and granularity, leading to some variability in the experiment results. In addition, setting the width of ecological corridors is an important measure to protect and restore biodiversity. Since the setting of corridor width needs consideration of a variety of factors, such as migration patterns of organisms, species specificity, and land-use conflicts, there is great uncertainty associated with the process [82,83,84,85]. Therefore, the calculation of ecological corridor width remains an important aspect of future research. Quantitative and qualitative analyses of ecological networks at different scales and granularities through field research, remote sensing techniques, and model simulations can help set appropriate widths and ranges in a targeted manner.

5. Conclusions

Constructing ecological networks can effectively improve the landscape connectivity of urban ecosystems. In this study, we identified regional ecological sources based on the MSPA method and landscape connectivity indices, constructed ecological networks, and optimized the results through the MCR model and the gravity model. The following conclusions are drawn from the study findings:
(1)
The identification of ecological sources using the MSPA combined with landscape connectivity indices fully considered the integrity of ecosystems and the connectivity of ecological processes. The choice of connectivity threshold also affects important impact on landscape connectivity and ecological source identification. When the connectivity threshold was set to 2500 m, the landscape connectivity of the study area was at its best, which realized the accurate identification of ecological sources.
(2)
The integrated ecological resistance surface emphasized the influence of natural factors and human activities on the ecosystem. This approach allowed for systematic analysis and comprehensive assessment of the actual resistance encountered during biological flows and provided effective support for the construction of ecological corridors in highly urbanized areas.
(3)
The network structure analysis method can quantitatively assess the structure and function of regional ecological networks. Optimization of the ecological network by setting ecological strategic points and improving ecological nodes could effectively enhance landscape connectivity, which promotes ecosystem health and sustainable development.
With the acceleration of urbanization, urban ecological network connectivity and sustainable development have become the focus of attention. Compared with previous studies, we gave more consideration to the impacts on ecology caused by landscape indicators and socio-economic factors. The establishment of ecological networks can effectively protect and manage ecological resources and achieve win-win ecological and economic sustainability, thereby improving the well-being of residents. Future research should delve into the construction of ecological networks at larger scales and overlay the optimization results with urban ecological control lines and protected areas for comparative analysis, so as to improve ecological protection and planning initiatives in urban areas.

Author Contributions

Conceptualization, C.H. and X.Z.; methodology, C.H. and X.Z.; software, C.H. and Q.W.; validation, Q.Z., X.Z. and Q.W.; formal analysis, C.H. and X.Z.; investigation, W.W. and X.Z.; resources, X.Z., Q.W. and Q.Z.; data curation, H.G.; writing—original draft preparation, C.H.; writing—review and editing, C.H. and X.Z.; visualization, C.H. and Y.B.; supervision, H.G. and W.W. All authors have read and agreed to the published version of the manuscript.

Funding

This study was supported by the Key Research and Development Project of Jilin Science and Technology Development Program (No. 20210203013SF) and the Innovation Project of Jilin Science and Technology Development Program (No. 20230508033RC).

Institutional Review Board Statement

Not applicable.

Informed Consent Statement

Not applicable.

Data Availability Statement

Not applicable.

Acknowledgments

Thanks to all the foundation project support and all the authors for their hard work.

Conflicts of Interest

The authors declare no conflict of interest.

References

  1. Li, J.L.; Xu, J.G.; Chu, J.L. The construction of a regional ecological security pattern based on circuit theory. Sustainability 2019, 11, 6343. [Google Scholar] [CrossRef]
  2. Zhang, L.; Luo, Z.; Mallon, D.; Li, C.; Jiang, Z. Biodiversity conservation status in China’s growing protected areas. Biol. Conserv. 2017, 210, 89–100. [Google Scholar] [CrossRef]
  3. Ahmad, M.; Jiang, P.; Majeed, A.; Umar, M.; Khan, Z.; Muhammad, S. The dynamic impact of natural resources, technological innovations and economic growth on ecological footprint: An advanced panel data estimation. Resour. Policy 2020, 69, 101817. [Google Scholar] [CrossRef]
  4. Wang, C.; Liu, Y.; Yu, C.; Liu, X. Research progress on the arrangement of territorial ecological restoration. Prog. Geogr. 2021, 40, 1925–1941. [Google Scholar] [CrossRef]
  5. Jiao, S.; Liu, Y.; Han, Z.; Zhou, K.; Hu, L.; Liu, T. Determining priority areas for land ecological restoration based on ecological network-human disturbance: A case study of Changsha-Zhuzhou-Xiangtan Urban Agglomeration. J. Nat. Resour. 2021, 36, 2294–2307. [Google Scholar] [CrossRef]
  6. Li, Y.; Sun, X.; Zhu, X.; Cao, H. An early warning method of landscape ecological security in rapid urbanizing coastal areas and its application in Xiamen, China. Ecol. Model. 2010, 221, 2251–2260. [Google Scholar] [CrossRef]
  7. Van Niekerk, L.; Adams, J.B.; Allan, D.G.; Taljaard, S.; Weerts, S.P.; Louw, D.; Van Rooyen, P. Assessing and planning future estuarine resource use: A scenario-based regional-scale freshwater allocation approach. Sci. Total Environ. 2019, 657, 1000–1013. [Google Scholar] [CrossRef]
  8. Tian, L.; Li, Y.; Yan, Y.; Wang, B. Measuring urban sprawl and exploring the role planning plays: A shanghai case study. Land Use Policy 2017, 67, 426–435. [Google Scholar] [CrossRef]
  9. Polidoro, M.; De Lollo, J.A.; Barros, M.V.F. Urban sprawl and the challenges for urban planning. J. Environ. Prot. 2012, 3, 1010–1019. [Google Scholar] [CrossRef]
  10. Ewing, R.; Hamidi, S. Compactness versus sprawl: A review of recent evidence from the United States. J. Plann. Lit. 2015, 30, 413–432. [Google Scholar] [CrossRef]
  11. Bai, H.; Weng, L. Ecological security pattern construction and zoning along the China-Laos Railway based on the potential-connectedness-resilience framework. Ecol. Indic. 2023, 146, 109773. [Google Scholar] [CrossRef]
  12. Modica, G.; Praticò, S.; Laudari, L.; Ledda, A.; Di Fazio, S.; De Montis, A. Implementation of multispecies ecological networks at the regional scale: Analysis and multi-temporal assessment. J. Environ. Manag. 2021, 289, 112494. [Google Scholar] [CrossRef] [PubMed]
  13. Shi, F.; Liu, S.; Sun, Y.; An, Y.; Zhao, S.; Liu, Y.; Li, M. Ecological network construction of the heterogeneous agro-pastoral areas in the upper Yellow River basin. Agric. Ecosyst. Environ. 2020, 302, 107069. [Google Scholar] [CrossRef]
  14. Wang, S.; Wu, M.; Hu, M.; Fan, C.; Wang, T.; Xia, B. Promoting landscape connectivity of highly urbanized area: An ecological network approach. Ecol. Indic. 2021, 125, 107487. [Google Scholar] [CrossRef]
  15. Barbosa, V.; Pradilla, M.M.S. Identifying the social urban spatial structure of vulnerability: Towards climate change equity in Bogotá. Urban Plann. 2021, 6, 365–379. [Google Scholar] [CrossRef]
  16. Chanchitpricha, C.; Fischer, T.B. The role of impact assessment in the development of urban green infrastructure: A review of EIA and SEA practices in Thailand. Impact Assess. Proj. Apprais. 2022, 40, 191–201. [Google Scholar] [CrossRef]
  17. Barbosa, V.; Pradilla, M.M.S.; Chica-Mejía, J.E.; Bonilla, J.E.G. Functionality and Value of Green Infrastructure in Metropolitan Sprawl: What Is the City’s Future? A Case Study of the Bogotá-Sabana Northern Region Urban Green Spaces; IntechOpen: London, UK, 2022. [Google Scholar]
  18. Marando, F.; Heris, M.P.; Zulian, G.; Udías, A.; Mentaschi, L.; Chrysoulakis, N.; Maes, J. Urban heat island mitigation by green infrastructure in European Functional Urban Areas. Sustain. Cities Soc. 2022, 77, 103564. [Google Scholar] [CrossRef]
  19. Donati, G.F.; Bolliger, J.; Psomas, A.; Maurer, M.; Bach, P.M. Reconciling cities with nature: Identifying local Blue-Green Infrastructure interventions for regional biodiversity enhancement. J. Environ. Manag. 2022, 316, 115254. [Google Scholar] [CrossRef]
  20. Huang, S.L.; Wang, S.H.; Budd, W.W. Sprawl in Taipei’s peri-urban zone: Responses to spatial planning and implications for adapting global environmental change. Landsc. Urban Plan. 2009, 90, 20–32. [Google Scholar] [CrossRef]
  21. Guan, H.; Bai, Y.; Zhang, C.; Zou, J. Spatial identification and optimization of ecological network in desert-oasis area of Yellow River Basin, China. Ecol. Indic. 2023, 147, 109999. [Google Scholar] [CrossRef]
  22. Wei, Q.; Halike, A.; Yao, K.; Chen, L.; Balati, M. Construction and optimization of ecological security pattern in Ebinur Lake Basin based on MSPA-MCR models. Ecol. Indic. 2022, 138, 108857. [Google Scholar] [CrossRef]
  23. Jiang, B.; Chen, W.; Dai, X.; Xu, M.; Liu, L.; Sakai, T.; Li, S. Change of the spatial and temporal pattern of ecological vulnerability: A case study on Cheng-Yu urban agglomeration, Southwest China. Ecol. Indic. 2023, 149, 110161. [Google Scholar] [CrossRef]
  24. Dai, L.; Liu, Y.; Luo, X. Integrating the MCR and DOI models to construct an ecological security network for the urban agglomeration around Poyang Lake, China. Sci. Total Environ. 2021, 754, 141868. [Google Scholar] [CrossRef]
  25. Liu, Y.; Wang, L.; Lu, Y.; Zou, Q.; Yang, L.; He, Y.; Li, Q. Identification and optimization methods for delineating ecological red lines in Sichuan Province of southwest China. Ecol. Indic. 2023, 146, 109786. [Google Scholar] [CrossRef]
  26. Jiang, H.; Peng, J.; Zhao, Y.; Xu, D.; Dong, J. Zoning for ecosystem restoration based on ecological network in mountainous region. Ecol. Indic. 2022, 142, 109138. [Google Scholar] [CrossRef]
  27. Hepcan, Ş.; Hepcan, Ç.C.; Bouwma, I.M.; Jongman, R.H.; Özkan, M.B. Ecological networks as a new approach for nature conservation in Turkey: A case study of İzmir Province. Landsc. Urban Plan. 2009, 90, 143–154. [Google Scholar] [CrossRef]
  28. Nie, W.; Shi, Y.; Siaw, M.J. Constructing and optimizing ecological network at county and town Scale: The case of Anji County, China. Ecol. Indic. 2021, 132, 108294. [Google Scholar] [CrossRef]
  29. Zhao, S.M.; Ma, Y.F.; Wang, J.L.; You, X.Y. Landscape pattern analysis and ecological network planning of Tianjin City. Urban For. Urban Green. 2019, 46, 126479. [Google Scholar] [CrossRef]
  30. Zhou, Y.; Zheng, Z.; Wu, Z.; Guo, C.; Chen, Y. Construction and evaluation of ecological networks in highly urbanised regions: A case study of the Guangdong-Hong Kong-Macao greater Bay Area, China. Ecol. Indic. 2023, 152, 110336. [Google Scholar] [CrossRef]
  31. Newton, A.C.; Hodder, K.; Cantarello, E.; Perrella, L.; Birch, J.C.; Robins, J.; Cordingley, J. Cost–benefit analysis of ecological networks assessed through spatial analysis of ecosystem services. J. Appl. Ecol. 2012, 49, 571–580. [Google Scholar] [CrossRef]
  32. Xie, J.; Xie, B.; Zhou, K.; Li, J.; Xiao, J.; Liu, C.; Zhang, X. Evolution of bird habitat quality driving mechanisms and ecological network weights. Global Ecol. Conserv. 2023, 46, e02618. [Google Scholar] [CrossRef]
  33. Zhang, L.; Peng, J.; Liu, Y.; Wu, J. Coupling ecosystem services supply and human ecological demand to identify landscape ecological security pattern: A case study in Beijing–Tianjin–Hebei region, China. Urban Ecosyst. 2017, 20, 701–714. [Google Scholar] [CrossRef]
  34. Wickham, J.D.; Riitters, K.H.; Wade, T.G.; Vogt, P. A national assessment of green infrastructure and change for the conterminous United States using morphological image processing. Landsc. Urban Plan. 2010, 94, 186–195. [Google Scholar] [CrossRef]
  35. Vogt, P.; Riitters, K.H.; Estreguil, C.; Kozak, J.; Wade, T.G.; Wickham, J.D. Mapping spatial patterns with morphological image processing. Landsc. Ecol. 2007, 22, 171–177. [Google Scholar] [CrossRef]
  36. Xu, X.; Wang, S.; Rong, W. Construction of ecological network in Suzhou based on the PLUS and MSPA models. Ecol. Indic. 2023, 154, 110740. [Google Scholar] [CrossRef]
  37. Luo, J.; Fu, H. Constructing an urban cooling network based on PLUS model: Implications for future urban planning. Ecol. Indic. 2023, 154, 110887. [Google Scholar] [CrossRef]
  38. Lu, J.; Jiao, S.; Han, Z.; Yin, J. Promoting ecological restoration of deeply urbanized hilly areas: A multi-scale ecological networks approach. Ecol. Indic. 2023, 154, 110655. [Google Scholar] [CrossRef]
  39. Zhang, X.; Wang, X.; Zhang, C.; Zhai, J. Development of a cross-scale landscape infrastructure network guided by the new Jiangnan watertown urbanism: A case study of the ecological green integration demonstration zone in the Yangtze River Delta, China. Ecol. Indic. 2022, 143, 109317. [Google Scholar] [CrossRef]
  40. Soille, P.; Vogt, P. Morphological segmentation of binary patterns. Pattern Recogn. Lett. 2009, 30, 456–459. [Google Scholar] [CrossRef]
  41. Cui, L.; Wang, J.; Sun, L.; Lv, C. Construction and optimization of green space ecological networks in urban fringe areas: A case study with the urban fringe area of Tongzhou district in Beijing. J. Clean. Prod. 2020, 276, 124266. [Google Scholar] [CrossRef]
  42. Spear, S.F.; Balkenhol, N.; Fortin, M.; McRae, B.H.; Scribner, K. Use of resistance surfaces for landscape genetic studies: Considerations for parameterization and analysis. Mol. Ecol. 2010, 19, 3576–3591. [Google Scholar] [CrossRef] [PubMed]
  43. Dickson, B.G.; Albano, C.M.; Anantharaman, R.; Beier, P.; Fargione, J.; Graves, T.A.; Gray, M.E.; Hall, K.R.; Lawler, J.J.; Leonard, P.B.; et al. Circuit-theory applications to connectivity science and conservation. Conserv. Biol. 2018, 33, 239–249. [Google Scholar] [CrossRef] [PubMed]
  44. Keeley, A.T.; Beier, P.; Gagnon, J.W. Estimating landscape resistance from habitat suitability: Effects of data source and nonlinearities. Landsc. Ecol. 2016, 31, 2151–2162. [Google Scholar] [CrossRef]
  45. Jin, X.X.; Wei, L.Y.; Wang, Y.; Lu, Y.Q. Construction of ecological security pattern based on the importance of ecosystem service functions and ecological sensitivity assessment: A case study in Fengxian County of Jiangsu Province, China. Environ. Dev. Sustain. 2021, 23, 563–590. [Google Scholar] [CrossRef]
  46. Li, S.; Zhao, Y.; Xiao, W.; Yue, W.; Wu, T. Optimizing ecological security pattern in the coal resource-based city: A case study in Shuozhou City, China. Ecol. Indic. 2021, 130, 108026. [Google Scholar] [CrossRef]
  47. Gu, Z.; Gong, J.; Wang, Y. Construction and evaluation of ecological networks among natural protected areas based on “quality-structure–function”: A case study of the Qinghai-Tibet area. Ecol. Indic. 2023, 151, 110228. [Google Scholar] [CrossRef]
  48. Peng, J.; Zhao, S.; Dong, J.; Liu, Y.; Meersmans, J.; Li, H.; Wu, J. Applying ant colony algorithm to identify ecological security patterns in megacities. Environ. Modell. Softw. 2019, 117, 214–222. [Google Scholar] [CrossRef]
  49. Yu, K. Landscape ecological security patterns in biological conservation. Acta Ecol. Sin. 1999, 1, 10–17. [Google Scholar]
  50. Adriaensen, F.; Chardon, J.P.; De Blust, G.; Swinnen, E.; Villalba, S.; Gulinck, H.; Matthysen, E. The application of ‘least-cost’ modelling as a functional landscape model. Landsc. Urban Plan. 2003, 64, 233–247. [Google Scholar] [CrossRef]
  51. Li, Y.Y.; Zhang, Y.Z.; Jiang, Z.Y.; Guo, C.X.; Zhao, M.Y.; Yang, Z.G.; Guo, M.Y.; Wu, B.Y.; Chen, Q.L. Integrating morphological spatial pattern analysis and the minimal cumulative resistance model to optimize urban ecological networks: A case study in Shenzhen City, China. Ecol. Process. 2021, 10, 15. [Google Scholar] [CrossRef]
  52. Vogt, P.; Riitters, K.H. GuidosToolbox: Universal digital image object analysis. Eur. J. Remote Sens. 2017, 50, 352–361. [Google Scholar] [CrossRef]
  53. Cheng, W.; Tao, Y.; Wu, W.; Ou, W. Priority evaluation of ecological protect areas based on MSPA, landscape connectivity, and spatial syntax methods in the Su-Xi-Chang Region. Acta Ecol. Sin. 2020, 40, 1789–1798. [Google Scholar]
  54. Shuai, N.; Hu, Y.; Gao, M.; Guo, Z.; Bai, Y. Construction and optimization of ecological networks in karst regions based on multi-scale nesting: A case study in Guangxi Hechi, China. Ecol. Inf. 2023, 74, 101963. [Google Scholar] [CrossRef]
  55. Chen, X.; Kang, B.; Li, M.; Du, Z.; Zhang, L.; Li, H. Identification of priority areas for territorial ecological conservation and restoration based on ecological networks: A case study of Tianjin City, China. Ecol. Indic. 2023, 146, 109809. [Google Scholar] [CrossRef]
  56. Cui, X.; Deng, W.; Yang, J.; Huang, W.; de Vries, W.T. Construction and optimization of ecological security patterns based on social equity perspective: A case study in Wuhan, China. Ecol. Indic. 2022, 136, 108714. [Google Scholar] [CrossRef]
  57. Jiang, W.; Yuan, L.; Wang, W.; Cao, R.; Zhang, Y.; Shen, W. Spatio-temporal analysis of vegetation variation in the Yellow River Basin. Ecol. Indic. 2015, 51, 117–126. [Google Scholar] [CrossRef]
  58. Fu, Y.; Shi, X.; He, J.; Yuan, Y.; Qu, L. Identification and optimization strategy of county ecological security pattern: A case study in the Loess Plateau, China. Ecol. Indic. 2020, 112, 106030. [Google Scholar] [CrossRef]
  59. Knaapen, J.; Scheffer, M.; Harms, B. Estimating habitat isolation in landscape planning. Lands. Urban Plan. 1992, 23, 1–16. [Google Scholar] [CrossRef]
  60. Huang, X.; Wang, H.; Shan, L.; Xiao, F. Constructing and optimizing urban ecological network in the context of rapid urbanization for improving landscape connectivity. Ecol. Indic. 2021, 132, 108319. [Google Scholar] [CrossRef]
  61. Zhou, S.; Song, Y.; Li, Y.; Wang, J.; Zhang, L. Construction of Ecological Security Pattern for Plateau Lake Based on MSPA–MCR Model: A Case Study of Dianchi Lake Area. Sustainability 2022, 14, 14532. [Google Scholar] [CrossRef]
  62. Xie, J.; Xie, B.; Zhou, K.; Li, J.; Xiao, J.; Liu, C. Impacts of landscape pattern on ecological network evolution in Changsha-Zhuzhou-Xiangtan Urban Agglomeration, China. Ecol. Indic. 2022, 145, 109716. [Google Scholar] [CrossRef]
  63. Laita, A.; Mönkkönen, M.; Kotiaho, J. Woodland key habitats evaluated as part of a functional reserve network. Biol. Conserv. 2010, 143, 1212–1227. [Google Scholar] [CrossRef]
  64. Xun, B.; Yu, D.; Liu, Y. Habitat connectivity analysis for conservation implications in an urban area. Acta Ecol. Sin. 2014, 34, 44–52. [Google Scholar] [CrossRef]
  65. Pascual-Hortal, L.; Saura, S. Comparison and development of new graph-based landscape connectivity indices: Towards the priorization of habitat patches and corridors for conservation. Landsc. Ecol. 2006, 21, 959–967. [Google Scholar] [CrossRef]
  66. Saura, S.; Pascual-Hortal, L. A new habitat availability index to integrate connectivity in landscape conservation planning: Comparison with existing indices and application to a case study. Landsc. Urban Plan. 2007, 83, 91–103. [Google Scholar] [CrossRef]
  67. Beninde, J.; Veith, M.; Hochkirch, A. Biodiversity in cities needs space: A meta-analysis of factors determining intra-urban biodiversity variation. Ecol. Lett. 2015, 18, 581–592. [Google Scholar] [CrossRef]
  68. Wang, T.; Li, H.; Huang, Y. The complex ecological network’s resilience of the Wuhan metropolitan area. Ecol. Indic. 2021, 130, 108101. [Google Scholar] [CrossRef]
  69. Gurrutxaga, M.; Rubio, L.; Saura, S. Key connectors in protected forest area networks and the impact of highways: A transnational case study from the Cantabrian Range to the Western Alps (SW Europe). Landsc. Urban Plan. 2011, 101, 310–320. [Google Scholar] [CrossRef]
  70. McRae, B.H.; Dickson, B.G.; Keitt, T.H.; Shah, V.B. Using circuit theory to model connectivity in ecology and conservation. Ecology 2008, 89, 2712–2724. [Google Scholar] [CrossRef]
  71. McRae, B.H.; Hall, S.A.; Beier, P.; Theobald, D.M. Where to restore ecological connectivity? Detecting barriers and quantifying restoration benefits. PLoS ONE 2012, 7, e52604. [Google Scholar] [CrossRef]
  72. Li, Y.; Liu, W.; Feng, Q.; Zhu, M.; Yang, L.; Zhang, J.; Yin, X. The role of land use change in affecting ecosystem services and the ecological security pattern of the Hexi Regions, Northwest China. Sci. Total Environ. 2023, 855, 158940. [Google Scholar] [CrossRef] [PubMed]
  73. Fan, J.; Wang, Q.; Ji, M.; Sun, Y.; Feng, Y.; Yang, F.; Zhang, Z. Ecological network construction and gradient zoning optimization strategy in urban-rural fringe: A case study of Licheng District, Jinan City, China. Ecol. Indic. 2023, 150, 110251. [Google Scholar] [CrossRef]
  74. Ostapowicz, K.; Vogt, P.; Riitters, K.H.; Kozak, J.; Estreguil, C. Impact of scale on morphological spatial pattern of forest. Landsc. Ecol. 2008, 23, 1107–1117. [Google Scholar] [CrossRef]
  75. de Oliveira, S.N.; de Carvalho Júnior, O.A.; Gomes, R.A.T.; Guimarães, R.F.; McManus, C.M. Landscape-fragmentation change due to recent agricultural expansion in the Brazilian Savanna, Western Bahia. Brazil. Reg. Environ. Chang. 2017, 17, 411–423. [Google Scholar] [CrossRef]
  76. Neel, M.C. Patch connectivity and genetic diversity conservation in the federally endangered and narrowly endemic plant species Astragalus albens (Fabaceae). Biol. Conserv. 2008, 141, 938–955. [Google Scholar] [CrossRef]
  77. Xu, Z.; Dong, B.; Wang, C.; Gao, X.; Xu, H.; Wei, Z.; Liu, X. Construction of international important wetland White-headed crane ecological corridor in Chongming Dongtan, China. Ecol. Indic. 2023, 149, 110156. [Google Scholar] [CrossRef]
  78. Wang, X.R.; Wan, R.R.; Pan, P.P. Construction and regulation of ecological security pattern in Taihu Lake Basin—Minimum cumulative resistance model based on spatial morphology. J. Ecol. 2022, 42, 1968–1980. [Google Scholar]
  79. Li, S.; Xiao, W.; Zhao, Y.; Lv, X. Incorporating ecological risk index in the multiprocess MCRE model to optimize the ecological security pattern in a semi-arid area with intensive coal mining: A case study in northern China. J. Clean. Prod. 2020, 247, 119143. [Google Scholar] [CrossRef]
  80. Chen, N.; Kang, S.Z.; Zhao, Y.H.; Zhou, Y.J.; Yan, J.; Lu, Y.R. Construction of ecological network in Qinling Mountains of Shanxi, China based on MSPA and MCR model. Chin. J. Appl. Ecol. 2021, 32, 1545–1553. [Google Scholar]
  81. Liu, S.; Xia, Y.; Ji, Y.; Lai, W.; Li, J.; Yin, Y.; Qi, J.; Chang, Y.; Sun, H. Balancing Urban Expansion and Ecological Connectivity through Ecological Network Optimization—A Case Study of ChangSha County. Land 2023, 12, 1379. [Google Scholar] [CrossRef]
  82. Betts, M.G.; Wolf, C.; Ripple, W.J.; Phalan, B.; Millers, K.A.; Duarte, A.; Levi, T. Global forest loss disproportionately erodes biodiversity in intact landscapes. Nature 2017, 547, 441–444. [Google Scholar] [CrossRef] [PubMed]
  83. Zou, T.; Yoshino, K. Environmental vulnerability evaluation using a spatial principal components approach in the Daxing’anling region, China. Ecol. Indic. 2017, 78, 405–415. [Google Scholar] [CrossRef]
  84. Wang, Y.; Qu, Z.; Zhong, Q.; Zhang, Q.; Zhang, L.; Zhang, R.; Liu, J. Delimitation of ecological corridors in a highly urbanizing region based on circuit theory and MSPA. Ecol. Indic. 2022, 142, 109258. [Google Scholar] [CrossRef]
  85. Shen, J.K.; Wang, Y.C. An improved method for the identification and setting of ecological corridors in urbanized areas. Urban Ecosyst. 2022, 26, 141–160. [Google Scholar] [CrossRef]
Figure 1. Geographic location and elevation map of Changchun, China.
Sustainability 15 14756 g001
Figure 2. Analysis of the MSPA landscape pattern in the study area.
Sustainability 15 14756 g002
Figure 3. Variation of habitat patch IIC and PC values with distance threshold.
Sustainability 15 14756 g003
Figure 4. Distribution of ecological sources.
Sustainability 15 14756 g004
Figure 5. Single-factor ecological resistance surface: (a) land type factor, (b) elevation factor, (c) vegetation cover factor, (d) distance from river factor, (e) distance from road factor, (f) distance from town factor, (g) distance from settlement factor, and (h) impervious density factor resistance surface.
Sustainability 15 14756 g005
Figure 6. Comprehensive ecological resistance surface.
Sustainability 15 14756 g006
Figure 7. Ecological network construction.
Sustainability 15 14756 g007
Figure 8. Results of ecological network optimization: (a) ecological network optimization map; (b) ecological safety pattern.
Sustainability 15 14756 g008
Table 1. Classification, assignment, and weight of landscape resistance factors.
Resistance FactorsResistance CoefficientWeights
1030507090
Natural causesDEM/m<200200–225225–250250–285>3000.104
Land useWoodlandWaters, wetlandGrasslandCultivated landConstruction land0.289
Vegetation cover>0.80.8–0.60.6–0.40.4–0.2<0.20.168
Distance to River/m<100100–500500–10001000–1500>15000.031
Human factorDistance to the road/m>20002000–15001500–1000500–1000<5000.083
Distance to the settlements/m>40002000–40001000–2000500–1000<5000.052
Distance to the town/m>20001000–2000500–1000200–500<2000.198
Impervious density<33–66–1010–15>150.075
Table 2. Statistical tables of landscape types for the MSPA.
Landscape TypeArea/km²Prospect Area Proportion/%Proportion of Study Area
Core173.9786.26%21.30%
Islet0.200.10%0.02%
Perforation3.911.94%0.48%
Edge20.8710.35%2.56%
Bridge0.630.31%0.08%
Loop0.250.13%0.03%
Branch1.840.91%0.23%
total201.67100%24.7%
Table 3. Landscape connectivity index changes at different distance thresholds.
Distance Gradient500 m1000 m1500 m2000 m2500 m3500 m5000 m
dPC65.27870.21472.18272.40872.78573.37873.381
IIC63.73763.66563.99167.21167.21167.07166.799
Table 4. Statistics of the area and landscape connectivity index of important sources.
SortSource NumberdIICdPCPlaque Area/km2Proportion of the Core Area Landscape/%
12167.21272.785871.2640.96%
22865.207969.630169.3739.87%
3190.322912.00950.350.20%
4230.04661.81692.721.56%
5250.98421.2631.280.74%
6180.68621.11960.890.51%
730.91441.04471.170.67%
870.53790.98090.690.40%
990.43200.78880.550.32%
1020.52740.70750.960.55%
11260.64080.69480.830.48%
12200.31020.48930.400.23%
13270.38880.45860.510.29%
14240.00570.31580.950.55%
15220.27870.29630.300.17%
1660.18260.26483.201.84%
1750.15230.17092.791.60%
Total 165.7495.27%
Table 5. Interaction judgment matrix between ecological sources based on the gravity model.
2356791819202122232425262728
2 43.860.470.589.1617.711.210.650.523.470.480.500.260.290.220.130.38
3 0.660.8329.8921.381.590.840.654.690.600.630.320.350.270.150.47
5 6.470.690.540.450.340.360.680.280.240.140.230.190.140.38
6 0.890.670.500.380.400.790.350.260.150.240.200.140.42
7 22.711.790.880.655.340.590.610.300.330.250.140.45
9 2.201.040.768.810.710.730.360.380.280.150.50
18 16.505.0112.714.003.091.180.990.680.331.72
19 17.074.309.972.611.151.140.750.382.68
20 2.5344.882.621.962.141.280.545.20
21 2.472.310.990.930.660.311.24
22 3.752.902.331.340.413.09
23 4.152.011.230.351.20
24 6.812.840.432.07
25 42.461.267.08
26 1.565.29
27 1.79
28
Notes: red marks indicate interaction forces greater than 10, and these data will be used as important corridor determination indicators.
Disclaimer/Publisher’s Note: The statements, opinions and data contained in all publications are solely those of the individual author(s) and contributor(s) and not of MDPI and/or the editor(s). MDPI and/or the editor(s) disclaim responsibility for any injury to people or property resulting from any ideas, methods, instructions or products referred to in the content.

