Article

Effects of Object-Oriented Advance Guidance Signage on Lane-Changing Behaviors at the Mainline Toll Stations of Expressways

1
Key Laboratory of Special Environment Road Engineering of Hunan Province, Changsha University of Science and Technology, Changsha 410114, China
2
Guangdong Architectural Design & Research Institute Company Limited, Guangzhou 510010, China
3
Centre for Accident Research and Road Safety (CARRS-Q), Queensland University of Technology (QUT), Queensland, Kelvin Grove, QLD 4059, Australia
*
Author to whom correspondence should be addressed.
Sustainability 2023, 15(2), 982; https://doi.org/10.3390/su15020982
Submission received: 18 November 2022 / Revised: 1 January 2023 / Accepted: 2 January 2023 / Published: 5 January 2023

Abstract

:
China has actively promoted electronic toll collection (ETC), increasing the proportion of ETC vehicles, and the number of ETC lanes at mainline toll stations has exceeded that of manual toll collection (MTC) lanes. To investigate the effects of ETC and MTC vehicles as guidance objects on the lane-changing behaviors of drivers, we designed three guidance signal plans, including the original sign plan (OR), a complete MTC sign plan (CMS), and a complete MTC sign plan with voice warnings (VW&CMS), for expressway mainline toll lanes. A driving simulator experiment with 40 participants was conducted to evaluate the efficacy of the plans. Generalized estimating equations were used to analyze the characteristics of lane-changing behaviors in different guidance plans, and an entropy weight model using the technique of ranking the order of preference by its similarity to the ideal solution (TOPSIS) was constructed to evaluate the guidance effects of different plans. The results showed that the CMS and VW&CMS plans significantly improved lane-changing behaviors. This improvement is demonstrated by a higher lane-changing ratio, shorter response time, earlier initiation of lane-changing location, higher speed, lower deceleration rate, and longer lane-changing duration distance. These findings can help expressway designers to optimize the guidance-sign system for mainline toll stations.

Graphical Abstract

1. Introduction

In China, electronic toll collection (ETC) is currently widely implemented. As of October 2020, the ETC utilization rate of expressways exceeded 66% [1]. At the mainline toll stations of expressways, the large number of ETC vehicles has caused an increase in the number of ETC lanes and a decrease in the number of manual toll collection (MTC) lanes. However, the guidance signage systems in front of toll stations have not been updated with the change in the layout of channels. In the past, guidance signage was used to instruct ETC vehicles to change lanes, and only a few ETC channels were needed to accommodate a modest number of ETC vehicles. However, due to an increase in the number of ETC vehicles, each toll station typically has more than three ETC lanes. Thus, MTC vehicles need to change lanes to the right to enter the MTC lanes, and ETC vehicles can enter the toll station in a straight line without lane-changing. In this situation, the objects to be guided become MTC vehicles. The guidance information in front of the toll station cannot effectively guide MTC and ETC vehicles, resulting in conflicts between ETC and MTC vehicles when changing lanes at the toll plaza. Without guidance directions, drivers (particularly those of MTC vehicles) upstream of the toll station cannot make choices improving traffic flow and safety at the toll station.

2. Previous Research

This section focuses on a brief overview of guidance design studies, drivers’ models of information processing for static signs, the influence of driver characteristics on driving behavior, and some guidance as to the efficacy of static signage systems-related evaluation methods.
Much research has been conducted on the location and layout content of guidance signage in front of expressway toll stations. In terms of selecting the locations, according to the Road Traffic Signs and Markings (GB5768.2-2022) standards of China [2], the signs at 0 km, 500 m, 1 km, and 2 km upstream should provide information on the toll station, while the guidance information is only available at 0 m and 300 m upstream. In their research on the reaction operations of drivers to expressway exit signs, Zhao et al. [3] and Huang et al. [4] both pointed out that the area 500 m upstream of the expressway exit was a critical area for driving operations. The guidance information given at 300 m, based on the present standard, may not be sufficient to allow enough time for the reaction procedures of drivers. Shu [5] performed a further questionnaire-based survey on expressway guide signs, and the results of the subjective evaluation showed that guide information was recommended for placement at signs positioned 1 km and 0.5 km in front of the expressway exits. Advanced guidance information can improve safety and effectiveness in front of the toll station by lowering the possibility of emergency lane-changing as vehicles approach the toll station. In terms of text and the graphic design of signs, Latin American countries, such as Colombia and Mexico, advised using pictograms and required information to be simple [6,7]. Wang, Hesar, and Collyer [8] examined a set of statistical data about dynamic signs and discovered that most participants preferred graphic-assisted information signs to information signs carrying only simple text. To study the perceptions of drivers regarding pictograms, Cristea and Delhomme [9] developed an analysis of variance technique; they found that drivers had positive attitudes toward pictograms accompanying text and believed that such pictograms contributed to the understanding of information. Similarly, Shinar and Vogelzang [10] found that adding text to signs reduced the time spent on comprehending signs, especially unfamiliar ones.
Drivers have two modes of information processing for static signs. One is the “pre-attentive mode” [11], also called the automatic response [12]. Drivers in this mode respond more instinctively, choosing to change lanes as soon as they observe the guidance signs. The other is the “controlled mode” [13], in which drivers think more after recognizing sign information and do not respond immediately. Multiple signage reminders are essential for drivers since some even operate after approaching the toll stations. In a study on the complexity of optimal choices and lane-changing on the highway, it was noted that early lane-changing can have a positive effect on drivers [14]. As a result, different guidance methods should be provided to the various types of drivers to help them complete the lane change earlier. For drivers in the pre-attentive mode, providing guidance information over a reasonable distance is adequate; for drivers in the controlled mode, clear directional guidance information should be repeatedly provided over a sizable distance.
Numerous studies have been conducted on the effects of the characteristics of drivers, such as gender and age, on driving performance. Yang [15] conducted static simulation experiments on 39 groups of combined expressway guidance signs, reporting that the cognitive time of drivers was related to certain characteristics, such as age and driving experience. Yao et al. [16] used simulation experiments to evaluate the effectiveness of traffic guide signs; the results showed that elderly drivers preferred signs with directional information, and also that a positive correlation existed between age and directional information preference. Zahabi et al. [17] investigated the effect of driver age on driver performance and attention allocation in the context of expressway exit ramps and found that elderly drivers performed poorly (greater lane deviations) and adopted more conservative control strategies (more speed reductions and greater maximum deceleration levels) than middle-aged and young drivers. Lyu, Cao, Wu, Xu, and Xie [18] analyzed the effect of the gender of drivers on driving behaviors and found that male drivers were more aware of the risks and had more aggressive driving tendencies than female drivers.
In terms of a comprehensive evaluation of the guidance efficacy of static signage systems, Upchurch et al. [19] obtained 11 evaluation indexes, using simulation experiments, and evaluated four guidance sign schemes at the exit of a two-lane expressway using the weighted average method. Fitzpatrick et al. [20] adopted the expert evaluation method to assess the performance of six expressway guidance signs using data from desktop simulation tests. Liu et al. [21] introduced the information demands, comprehension levels, and information content, and established an ergonomic evaluation model of guidance sign layout. Based on the driving simulation experimental data, Zhao et al. [3] used the factor analysis method to reduce the dimension and performed a multivariate quantitative evaluation of two exit guidance signs. Xie and Jia [22] built a thorough evaluation model of traffic signs using a technique to set the order of preference by its similarity to the ideal solution (TOPSIS), based on the survey results. The computation of the weighted average method is very straightforward, but the equivalent exchange between the sub-objectives affects the process of simultaneous convergence to a level that is optimal or better, prolonging the optimization time and, occasionally, making things worse [23]. Using the expert evaluation method, the amount of data is minimized by dimensionality reduction when it is too huge, which is convenient for calculation but is prone to influence by the human subjective aspects. Using the factor analysis method, the issues affecting the common factors can be identified, the data can be streamlined, and the factor variables can be made more comprehensible by rotation; however, the least-squares method is employed to calculate the factor scores, which is problematic for some datasets [24]. TOPSIS theories rely on distance (relative separation) from ideal and anti-ideal solutions. The relative distance value can range from 0 to 1; alternatives with a distance of 0 represent an anti-ideal solution, while those with a distance of 1 are genuinely an ideal solution. Due to its sound mathematical foundation, simplicity, and ease of applicability, TOPSIS has been used extensively as a practical method for multi-criteria decision analysis [25].
In general, with rapid increases in the numbers of high-speed ETC users and ETC lanes, the architecture of the current static guidance signage systems cannot accommodate the demands of drivers regarding lane-changing, and drivers in the automatic response and controlled modes cannot safely change lanes within a short distance. Based on previous research, few studies have focused on optimizing guidance signage systems from the perspective of driver response modes. In reality, this issue restricts the efficient operation of toll stations. Therefore, pertinent research is essential to solving this issue. In this study, we developed plans for different main-line guide signs, focusing on the layout design of guide signs and the placement of guide information. In addition, the study determined the influence of driver characteristics (e.g., gender and age) on their lane-changing progress. Three specific points were considered in this study:
(1)
With the increasing proportion of ETC vehicles, are the existing guiding systems still applicable?
(2)
To investigate whether drivers’ lane-changing behavior significantly improves after obtaining instructions in advance.
(3)
Can voice warnings help drivers to complete lane-changing more effectively?
This study was expected to obtain optimal design alternatives for guidance signage systems for expressway stations that would support the revision of related standards.

3. Methodology

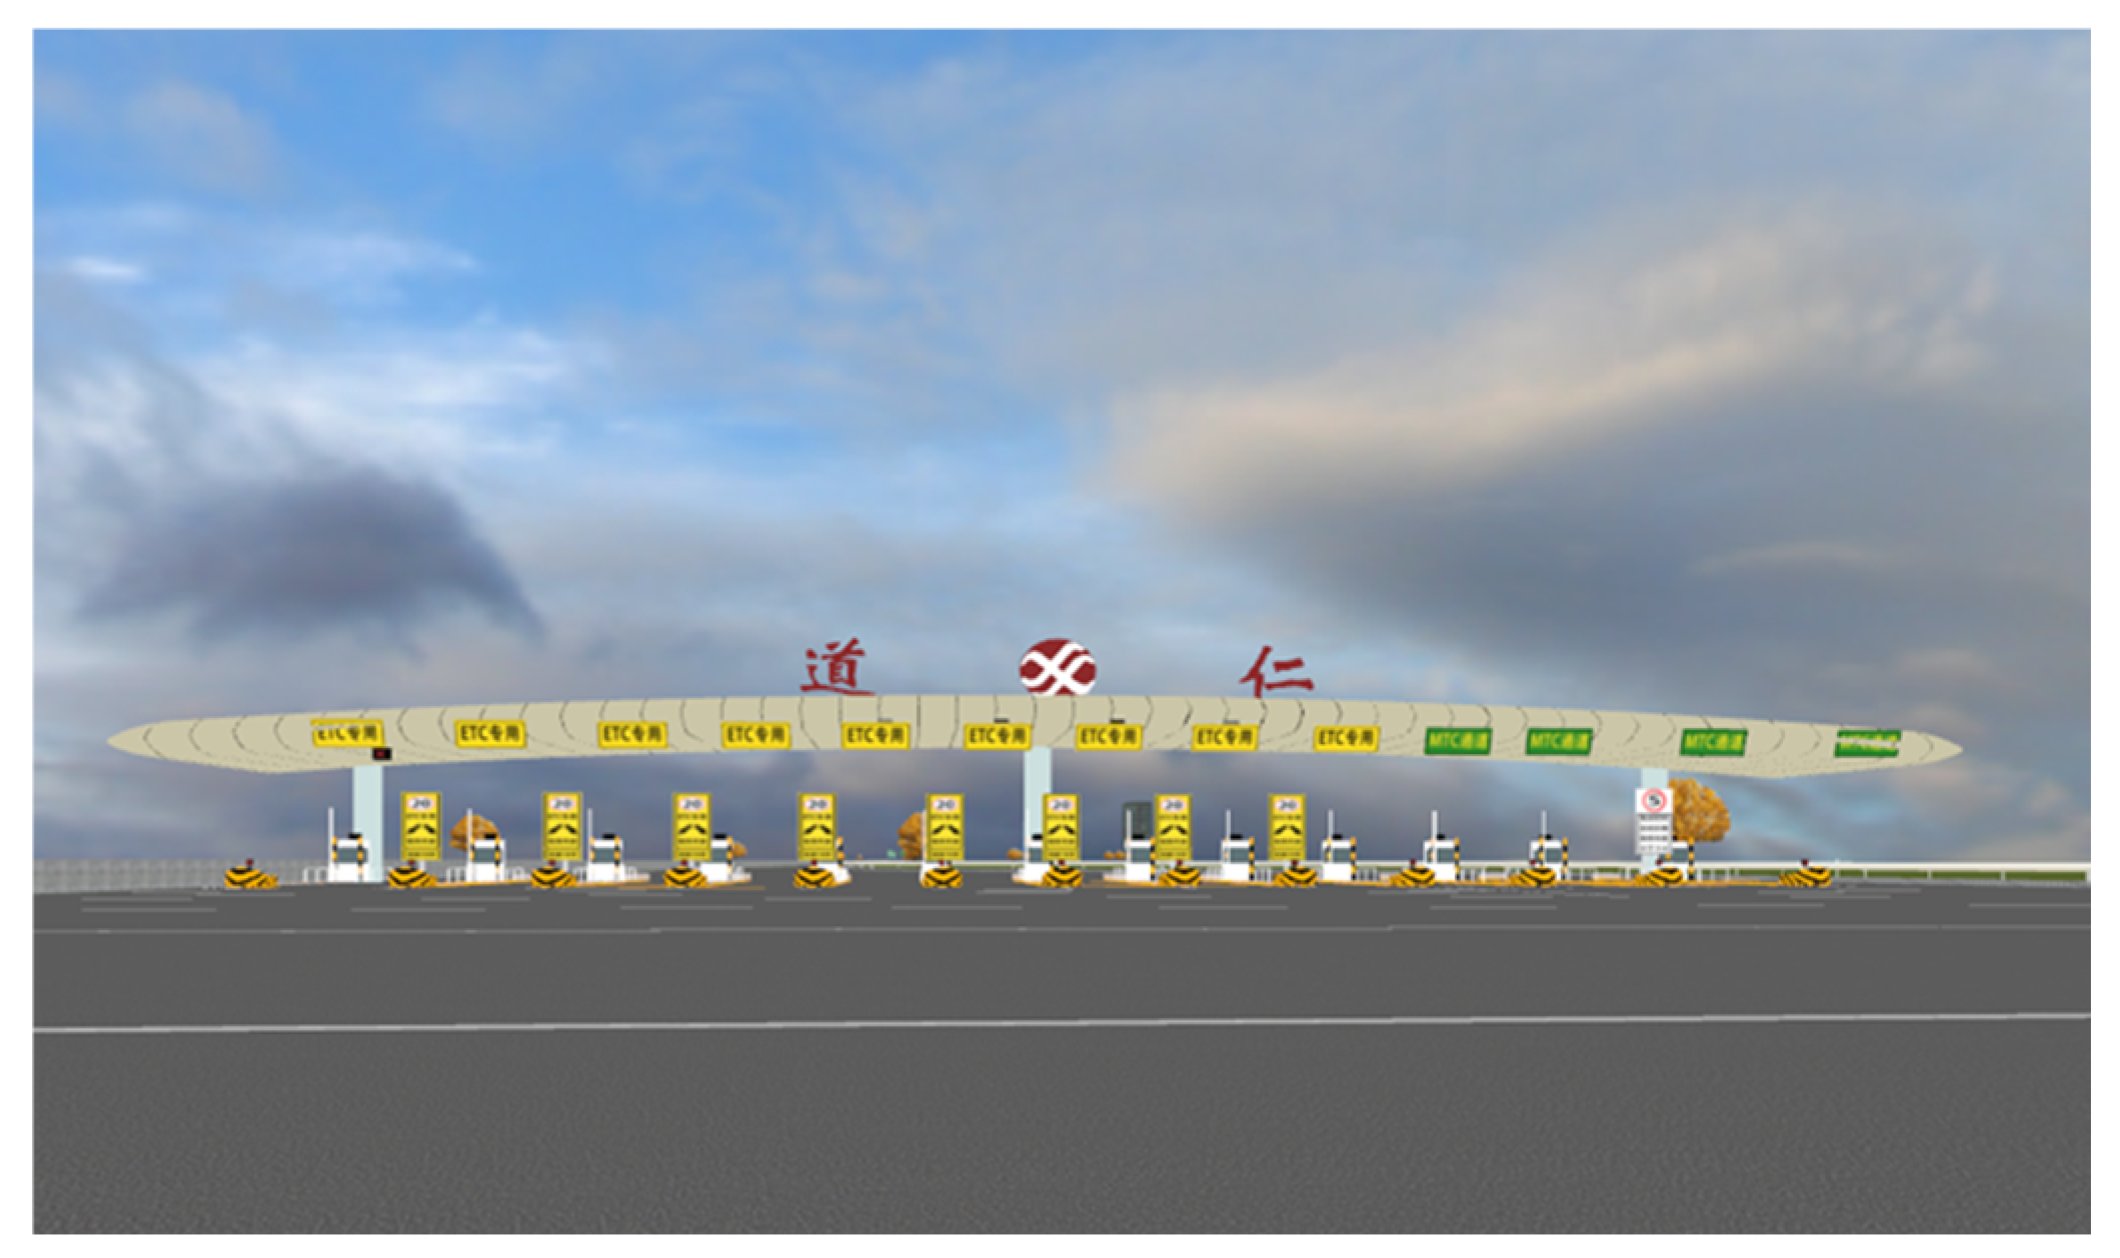
3.1. Scenario Design

As the toll station is located in a road section with high traffic density, in order to prevent the toll station section from affecting the main road vehicle traffic due to high traffic density, more lanes were set up in the toll station section so as to improve the traffic capacity [26]; therefore, as shown in Figure 1,the toll station consists of 13 channels (9 ETC channels and 4 MTC channels) [27]. The speed limit of the expressway was 120 km/h. The expressway was a straight two-way road; it had six lanes and was divided by a median barrier. The entire expressway was around 10 km long, including two toll stations. The expressway was designed based on the standard for China (Road Traffic Signs and Markings-Part 2: Road Traffic Signs) [2]. No surrounding vehicle was simulated, to eliminate interference between vehicles.
There are two optimization principles in the guidance sign program. One is intended to face the targets, providing guidance to a small number of MTC vehicles before the toll plaza, to avoid conflicts with ETC vehicles. The other is to set the distance of the guiding information in advance, according to the two different reaction modes of human beings in processing information; i.e., for drivers in the controlled mode, the guiding information is set in advance, to enable drivers to decide to change lanes earlier. Based on the auxiliary voice-warning information, content, and location, the guide signage system (on the main road) was optimally designed (see Figure 2). Additionally, three design plans for guidance signage of the expressway toll were considered. The current guidance signage plan used on expressways was designated as the original sign plan (OR). The second plan is the complete MTC sign (CMS) plan, in which “ETC vehicles: keep left” was replaced with “MTC vehicles: keep right”, based on the OR plan, and information regarding toll channel guidance was provided upstream of 500 m and 1 km. Two voice-warning messages, based on mobile navigation applications, are the most common in China. One is “2 km ahead, you are approaching XX toll station”, and the other is “2 km ahead to the right from the exit, please choose your lane in advance”. Therefore, we designed the voice warning words based on the above content (“You are approaching Daoren toll station” and “Please choose your lane in advance”) and added them to the CMS plan to form a complete MTC sign plan with voice warnings (VW&CMS plan) at a point upstream of 2.2 km. The layouts, colors, and sizes of the signs were the same for each of the four signage plans. To prevent potential learning effects, additional traffic facilities (such as emergency parking spaces and exit ramps) were introduced to the scenario’s non-test portion.

3.2. Participants

The G POWER program was used to estimate the required sample size, a priori analysis power, considering an effect size of 0.50, a statistical power of 80%, and a significance level of 95% (α < 0.05), totaling a sample size of 34. As a result, we recruited 40 participants with valid full driving licenses, including 30 male drivers and 10 female drivers. All participants were required to have at least one year of driving experience. Most participants (89%) had experienced the toll stations of expressways before. The age of the participants ranged from 18 to 53 years, with an average of 34.07 years and a standard deviation of 8.7 years.

3.3. Apparatus

This experiment was conducted using a fixed-based driving simulator from the Changsha University of Science and Technology, as shown in Figure 3. The driving simulator has three degrees of freedom and performs a linear pitch operation. The simulator is constituted of a real Ford Focus vehicle cabin with a real operation interface, a surround-sound system for engine and environmental noise, and a vehicle dynamic simulation system. The image is projected via a 360-degree front-view display system, with a resolution of 1400 × 1050 pixels. The SimVista and SimCreator software are used for scenario design and vehicle road modeling.

3.4. Experimental Procedure

The experiment was carried out in the key laboratory of special environment road engineering of Hunan province, from 9 a.m. to 11.30 a.m. and 2 p.m. to 5 p.m. Upon arrival, all participants were informed regarding the driving tasks and cautions. Before the formal experiment, participants were required to complete a practice drive for at least 5 min. Each participant needed to drive in 3 scenarios and was allowed to have at least 30 min between two drives; the order of the 3 scenarios for each participant was created by a random function, to shield drivers from potential learning effects. Participants were asked to drive exactly as they would drive daily. Additionally, participants were advised that if they felt any discomfort, they could leave the experiment at any time. The entire experiment lasted about 120 min. Each participant was asked to complete the questionnaire regarding the evaluation of guide signs in this experiment. After finishing the whole experiment, each participant would receive RMB (about USD 30) as a reward.

3.5. Variable Definitions

We obtained data from the 40 participants, including 120 samples, from the experiment. Table 1 shows the preliminary information on driver characteristics and guidance signage plans.
Two stages, including the lane-changing decision-making stage and lane-changing operation stage, were defined to better describe the lane-changing behaviors of the drivers when they approached the toll station of the expressway (see Figure 4). The lane-changing decision-making stage started when a driver passed the “2 km” sign and ended when the lane-changing action began. The same starting location (e.g., the “2 km” sign) was employed to measure the lane-changing decision-making stage. The lane-changing operation stage began when the vehicle’s center moved from the current lane centerline and crossed the lane boundary line while remaining in the target lane. Based on this, the dependent variables for describing lane-changing behavior were explained as follows:
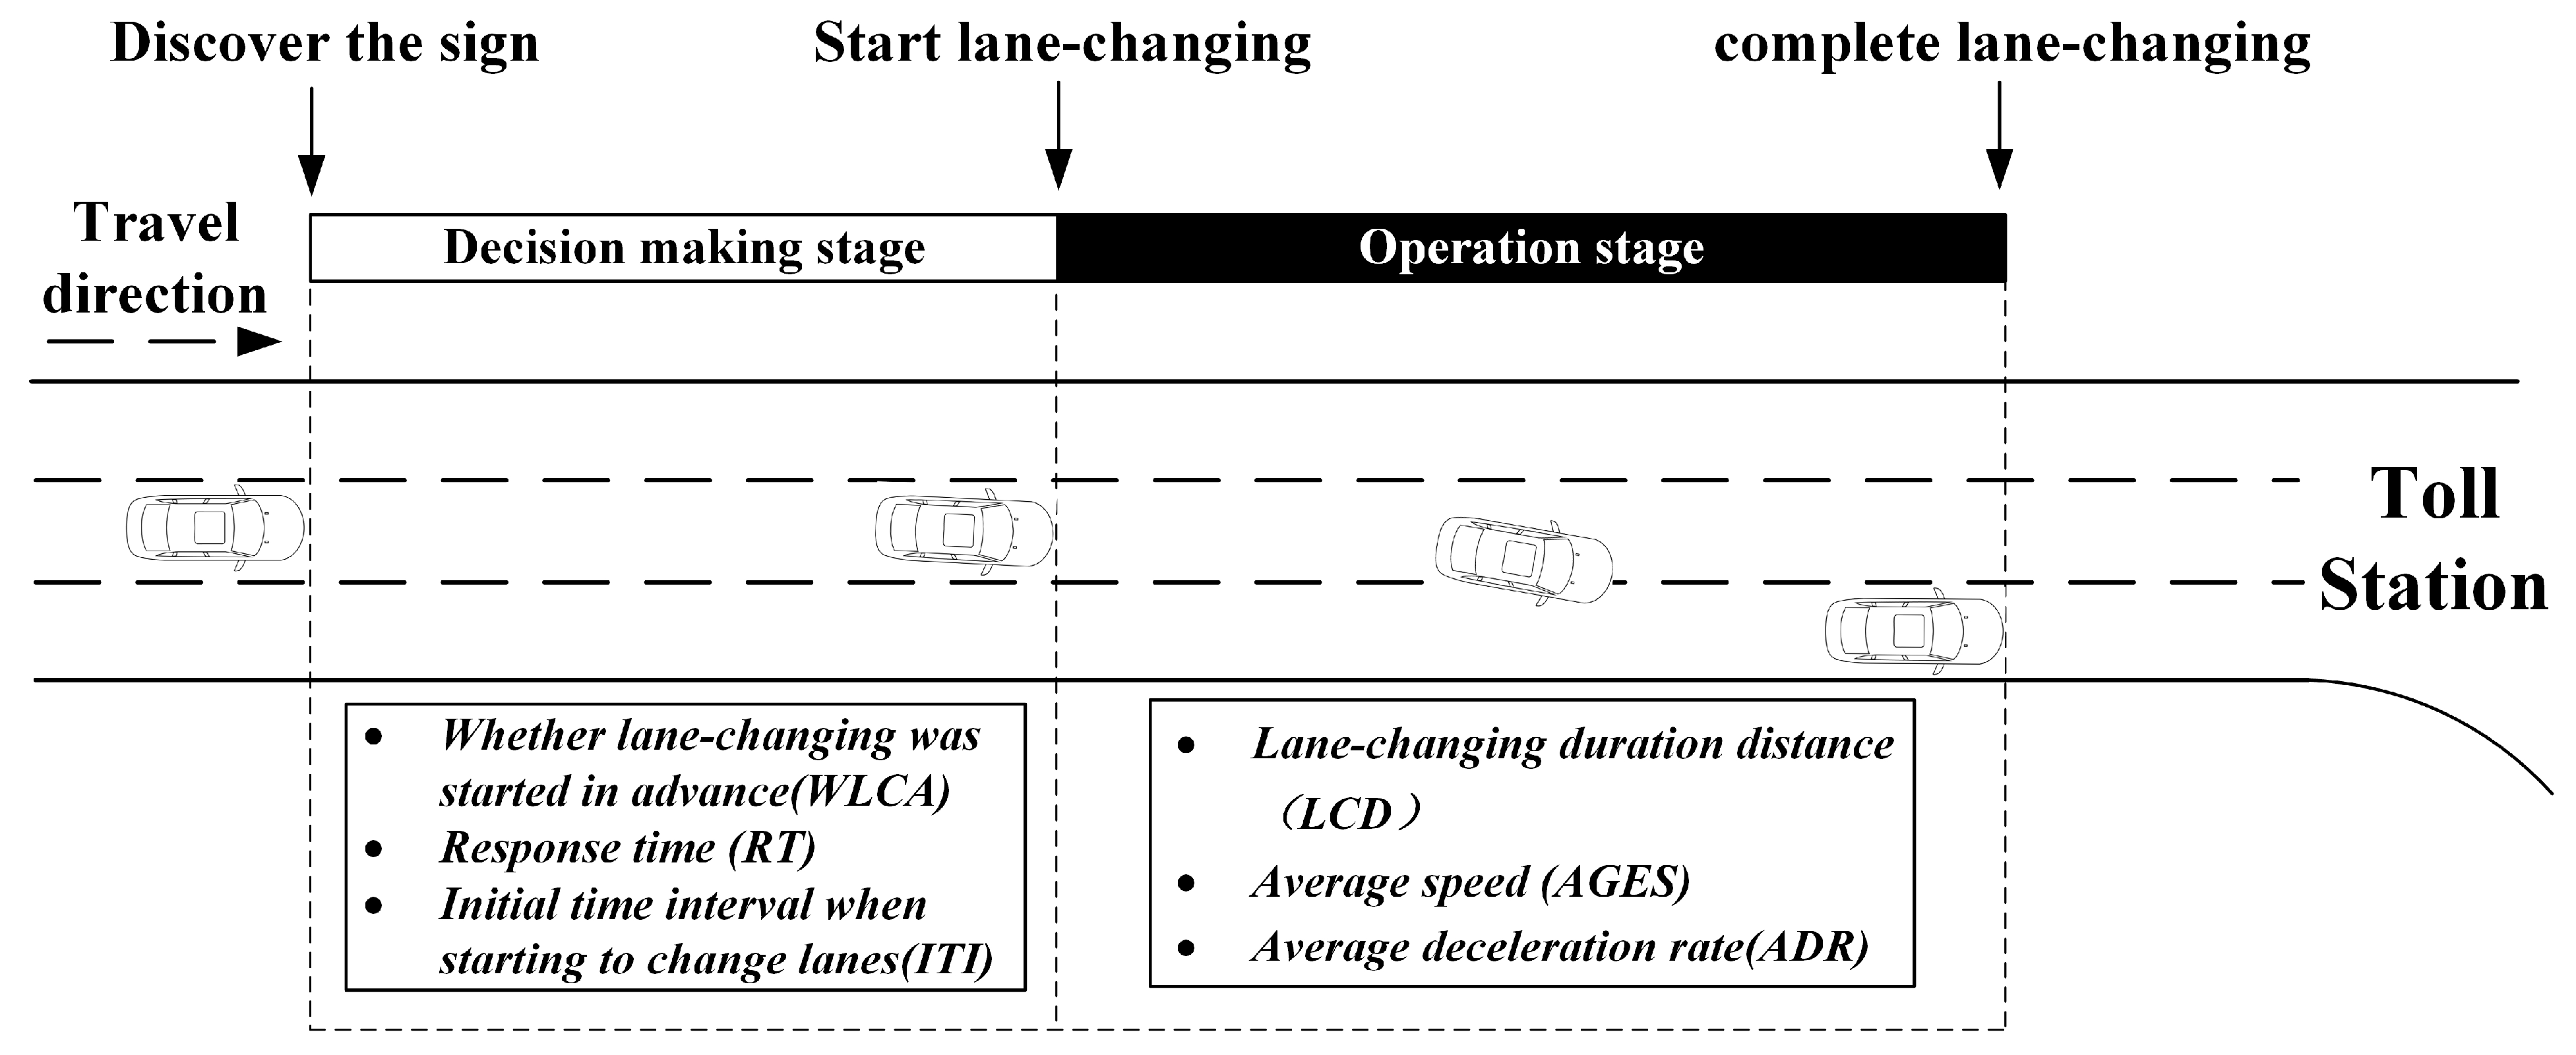
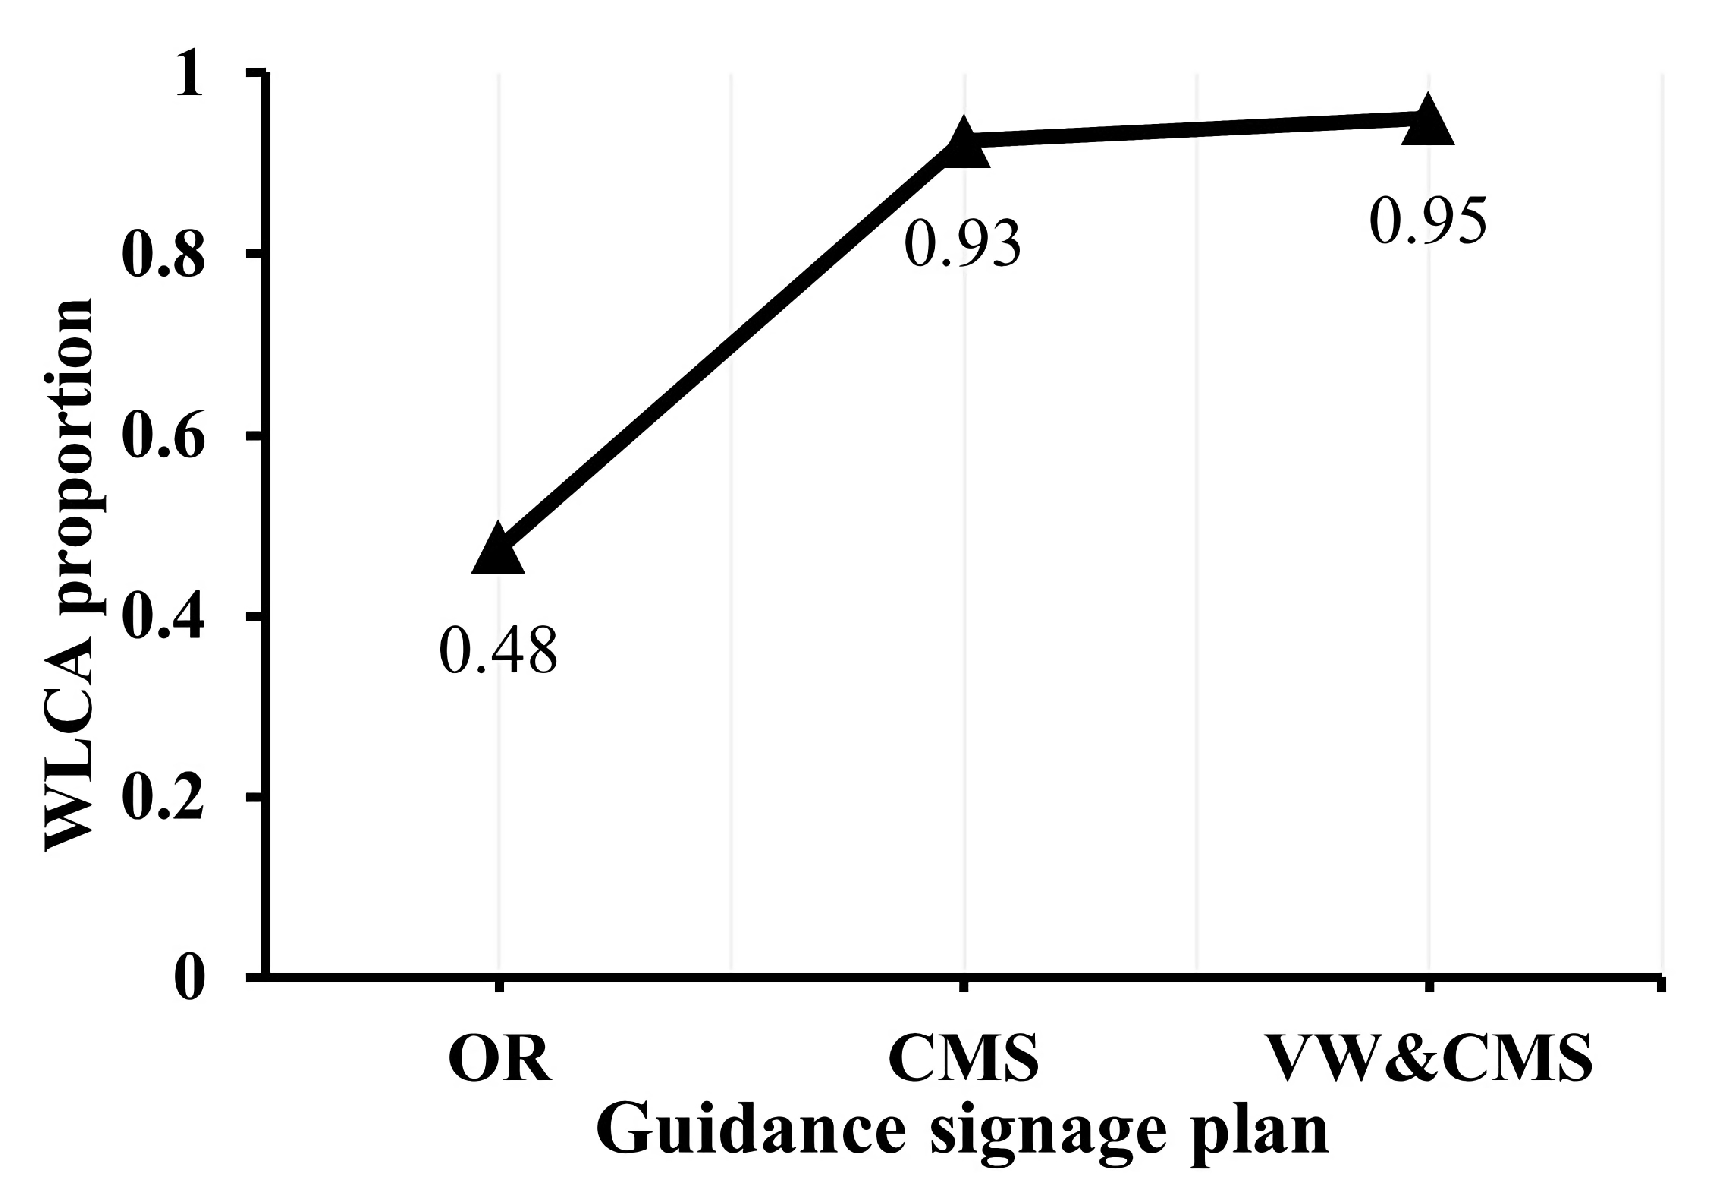
  • Whether lane-changing was started in advance (WLCA) (Non-changing = 0; Changing = 1): Changing (1) means that the driver started changing lanes prior to the “toll station entrance” sign, and non-changing (0) means that they did not. Lane-changing depends on whether the driving conditions in the adjacent lane are better than the current lane [28]. Drivers that change lanes at an earlier point are less likely to collide with other vehicles when approaching the toll plaza.
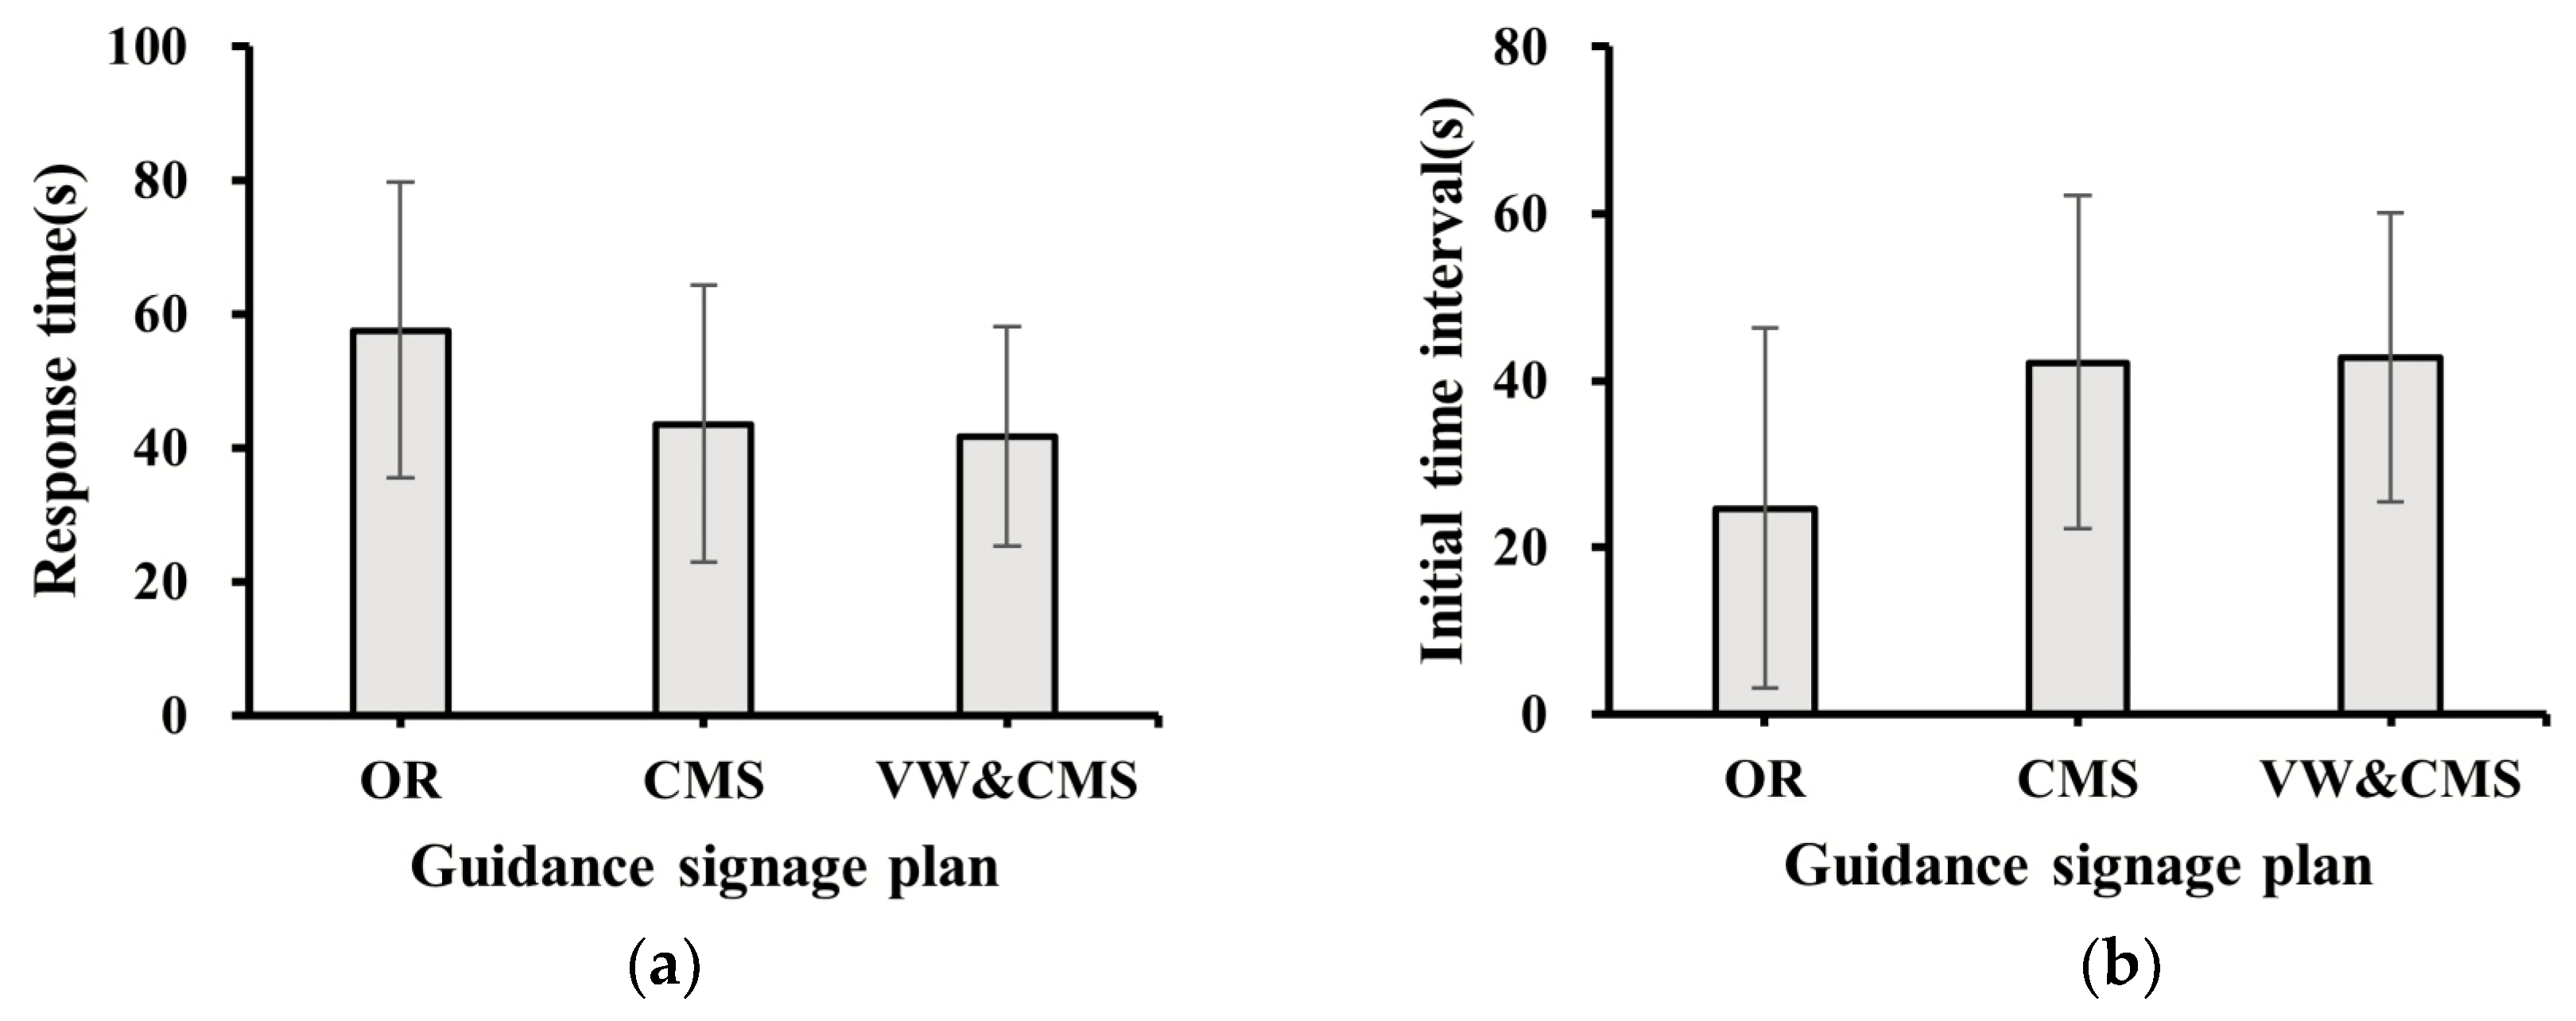
  • Response time (RT): Being limited by the lack of an eye-tracker, the study used the same starting point (e.g., the 2 km sign) to measure the participants’ response time, i.e., the time interval from the moment when the driver passed the “2 km” sign to the moment when the lane-changing started (in s).
  • Initial time interval when starting to change lanes (ITI): This is the quotient of the distance from the “0 km” sign at the initial time of the lane-changing, divided by the speed at the initial time of lane-changing (in s).
  • Lane-changing duration distance (LCD): the longitudinal distance between the start and end of the lane-changing (in m).
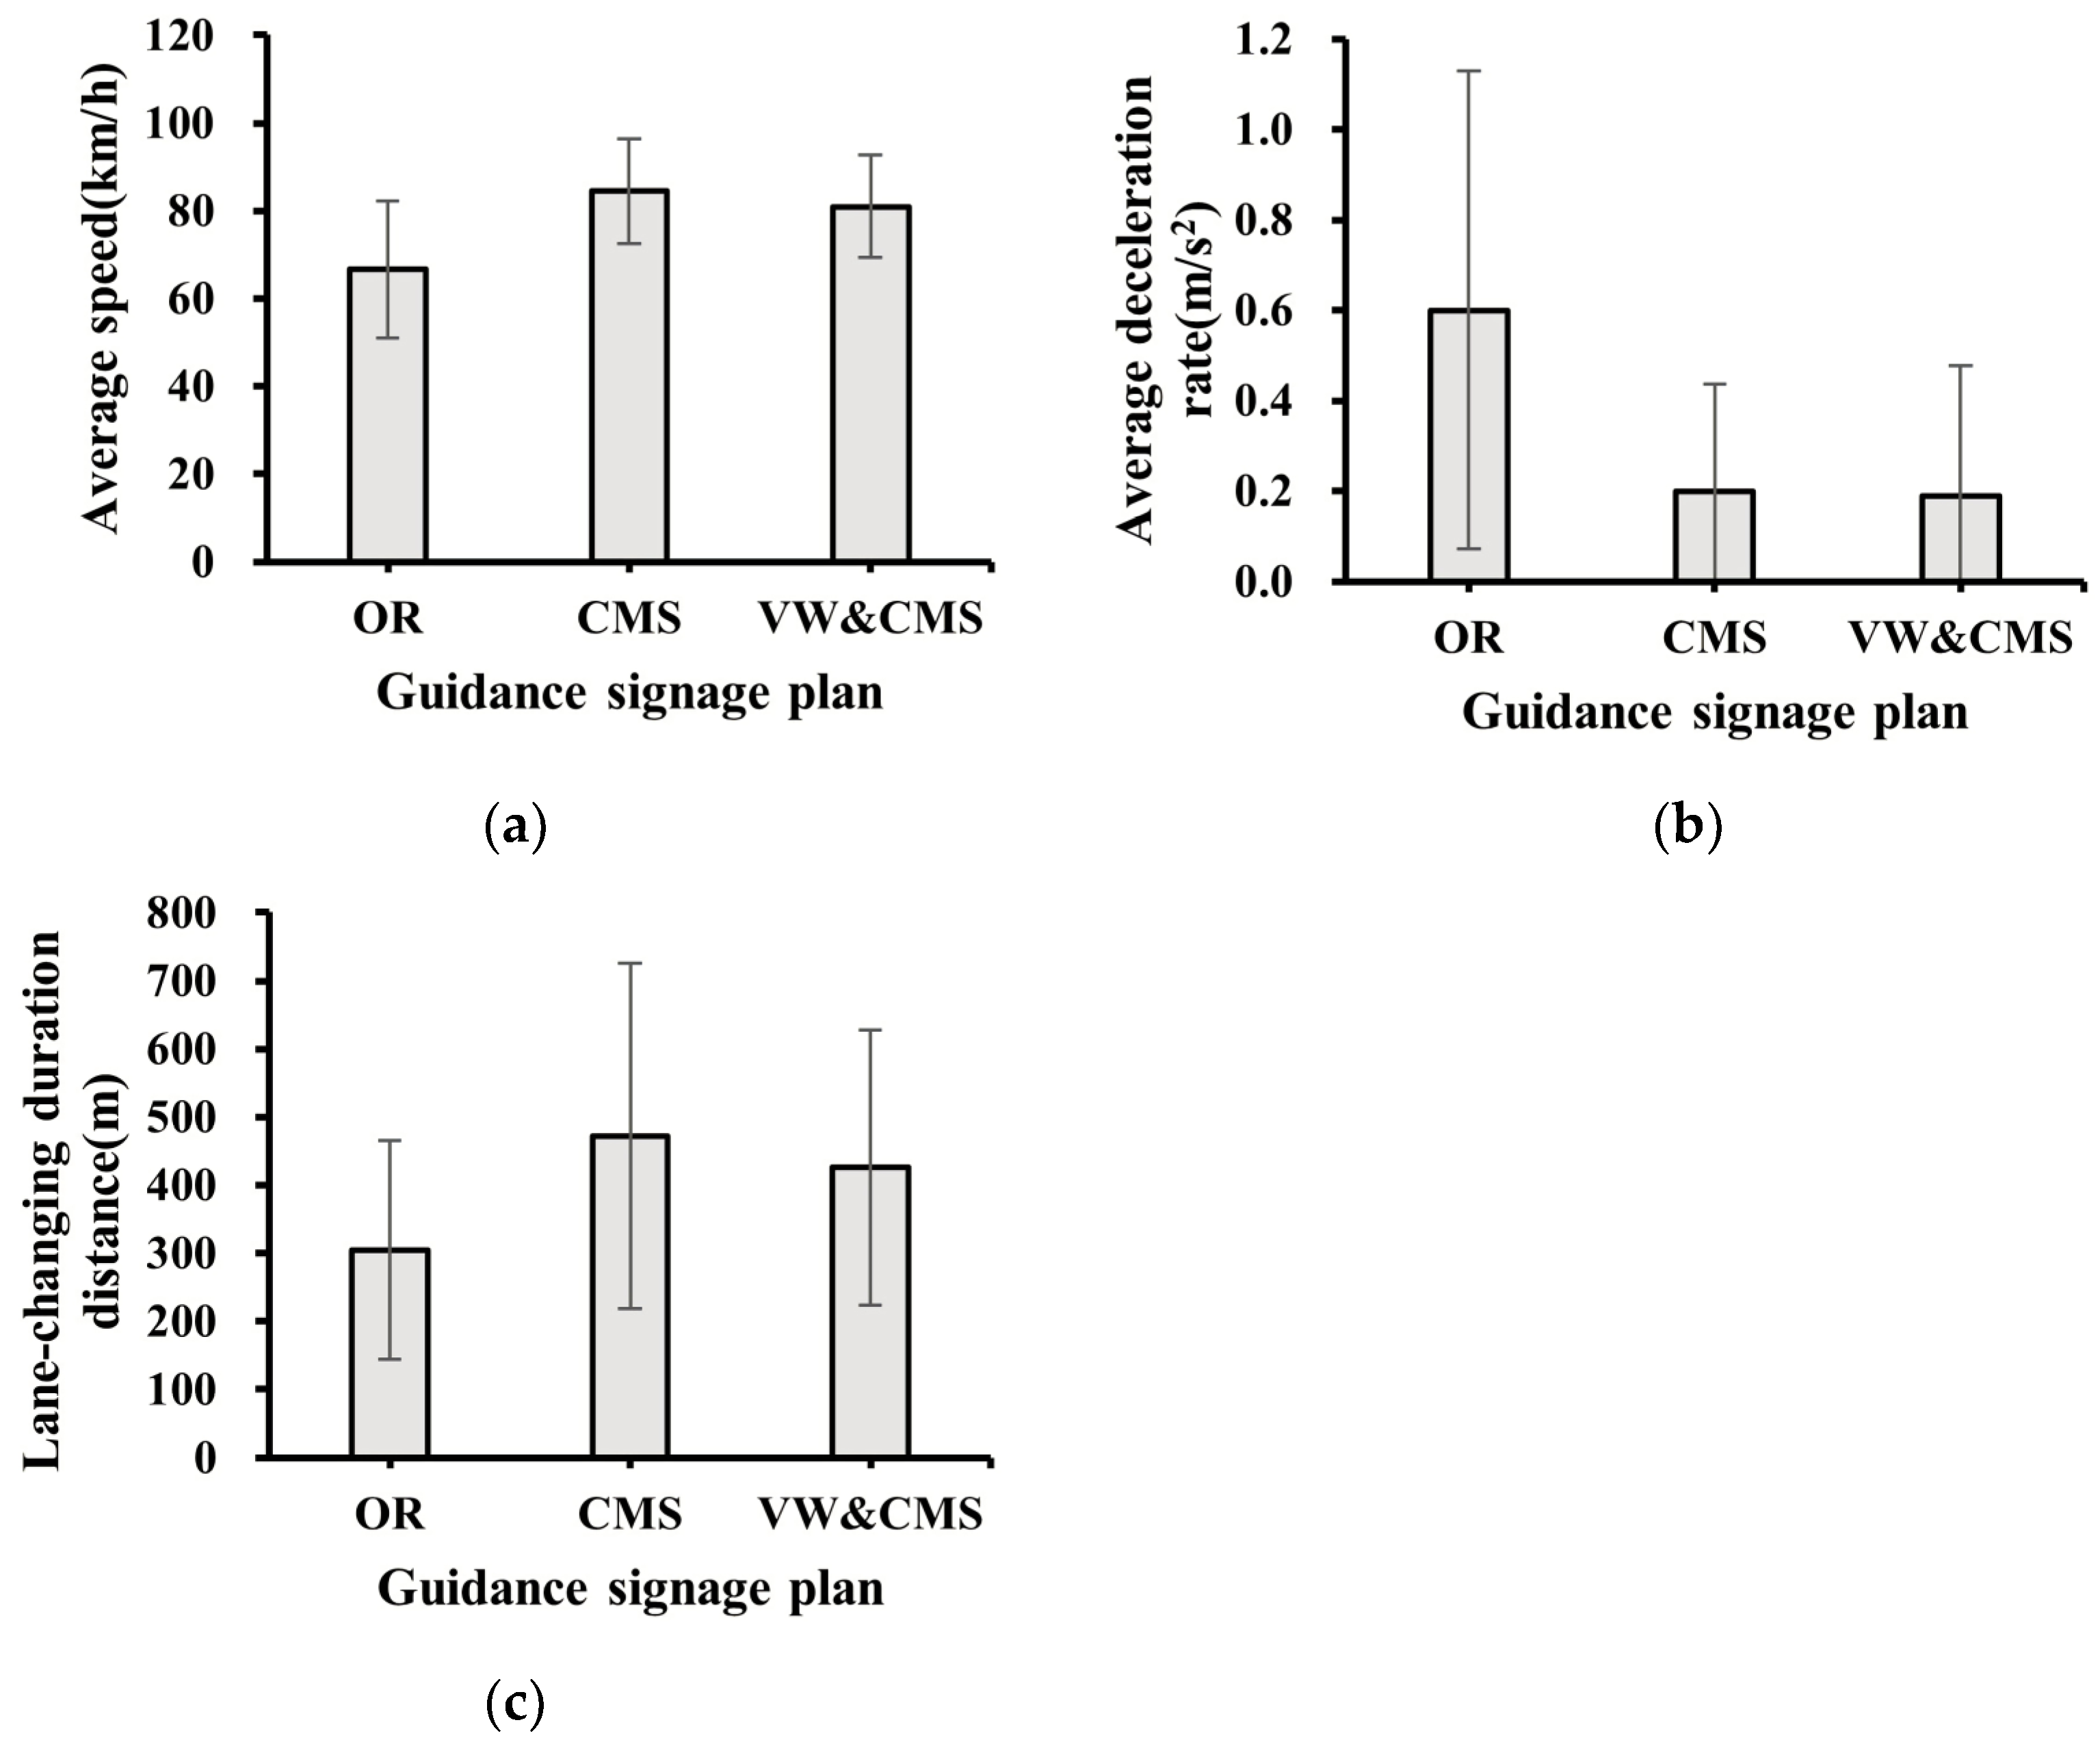
  • Average speed (AGES): the average speed during the lane-changing operation stage (in km/h).
  • Average deceleration rate (ADR): the average deceleration rate during the lane-changing operation stage (in m/s2).

3.6. Statistical Analysis

For this study, we established generalized estimation equation (GEE) models to describe the links between various independent and dependent variables. The GEE models are regression models, in which the quasi-likelihood estimation method is adopted to estimate the parameters; in contrast to standard linear equations, the generalized estimation equation model (GEE) does not need to specify the whole distribution of the dependent variables, and it has no special requirements for the data type of independent variables. Moreover, this method is specially used to deal with repeated-measure data, including unbalanced panel data [29]. The quasi-likelihood information criterion (QIC) can be used to select the best correlation structure and model in the GEE analysis. Based on the smallest QIC value, we used an independent correlation structure. For multiple comparisons of marginal means, least significant difference (LSD) pairwise comparisons were selected to analyze the effects of each factor. It should be noted that the OR plan and males were used as a reference for counterparts in each independent variable.

4. Results

The data regarding the 40 participants were obtained, which included 120 samples from the driving simulator experiment. For the MTC vehicle, there were 94 lane changes before the “toll station entrance” sign and 26 after the “toll station entrance” sign was passed. Thus, 120 samples were employed to analyze WLCA, and 94 were used to analyze the other variables. Each table contained coefficient estimates, standard errors, Wald chi-square value, and the p-value, and each figure provided the mean and standard deviation of significant variables.

4.1. Influences on Driving Behaviors

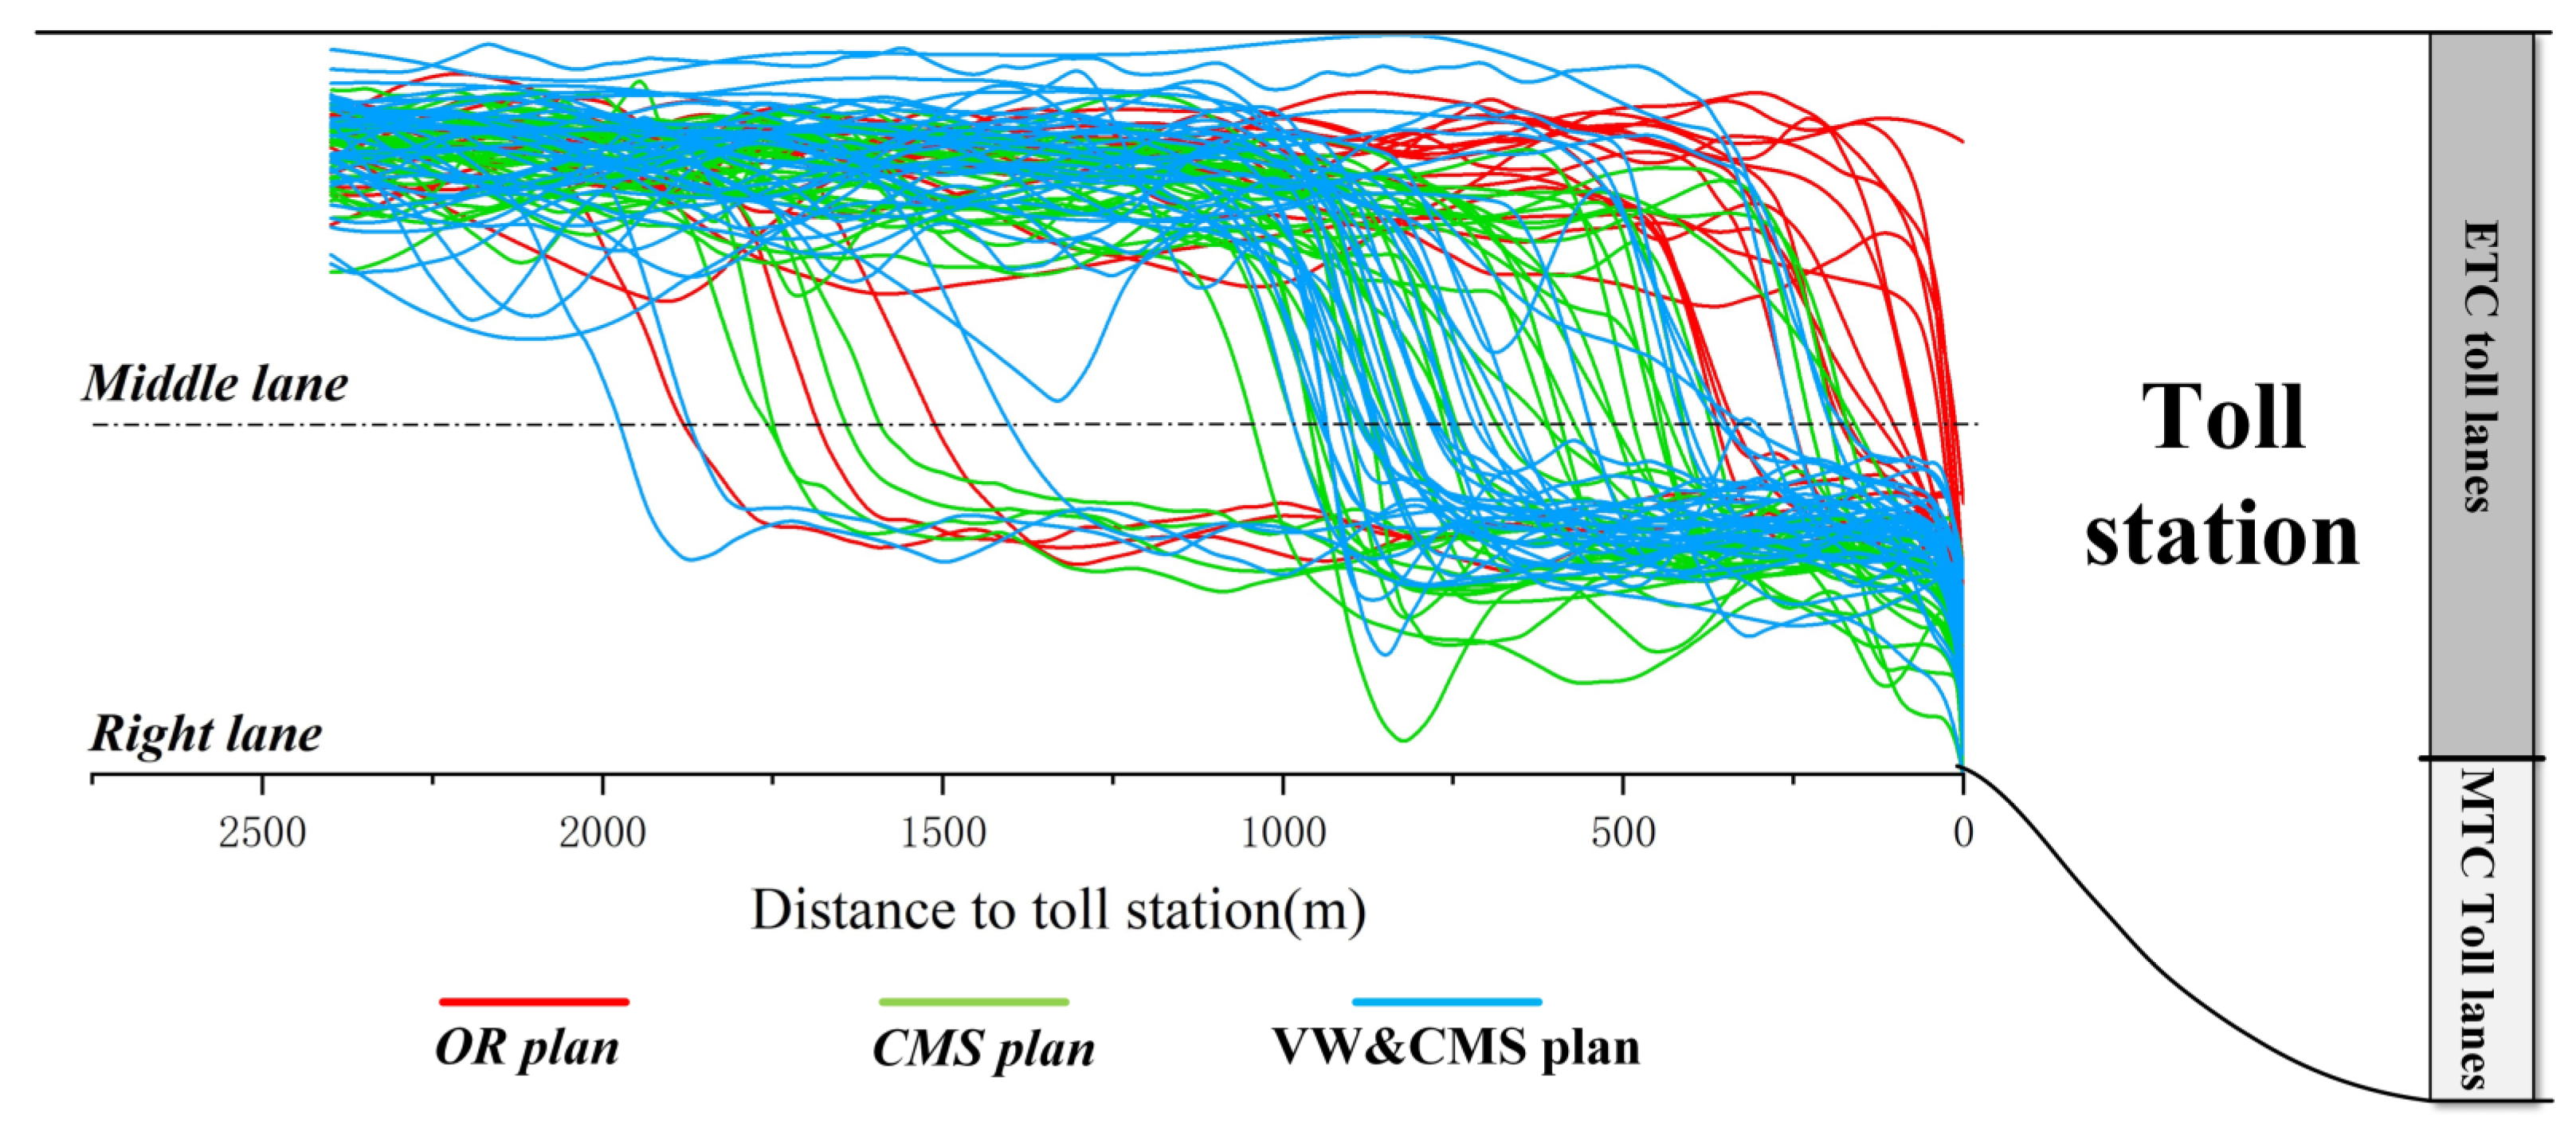
4.1.1. Lane-Changing Decision-Making Stage

Since WLCA is a category variable, we considered a model with a log link function and extrapolated the estimates obtained from the model. The guidance signage plans and annual driving mileage significantly affect WLCA. Unlike the OR plan (baseline), the CMS plan (Wald = 15.420, p < 0.001) and VW&CMS plan (Wald = 17.086, p < 0.001) positively impacted whether the drivers started lane-changing (see Table 2). The paired comparisons according to least significant difference (LSD) showed no significant difference between the CMS and VW&CMS plans (p = 0.562). The OR plan had the lowest proportion of WLCA (48%), while that in the CMS and VW&CMS plans was 93% and 95%, respectively (see Figure 5). No significant effects from the other driver characteristics were observed.
As shown in Table 3, guidance plans significantly affect response time and initial time interval. Unlike the OR plan (baseline), the CMS plan (Wald = 6.533, p = 0.011) and the VW&CMS plan (Wald = 9.757, p = 0.002) had negative correlations with the response time. However, no significant difference existed between the CMS and VW&CMS plans in the paired comparisons (p = 0.688). Furthermore, the model results show an increased tendency in the response time under CMS (mean = 43.51 s, SD = 20.70 s) and VW&CMS plans (mean = 41.68 s, SD = 16.38 s) compared with the OR plan (mean = 57.58 s, SD = 22.07 s) (see Figure 6a). Additionally, unlike the OR plan (baseline), the CMS plan (Wald = 9.901, p = 0.002) and the VW&CMS plan (Wald = 11.818, p = 0.001) were positively correlated with the initial time interval. The paired comparisons showed no significant difference between the CMS and VW&CMS plans (p = 0.819). As shown in Figure 6b, the CMS plan (mean = 42.17 s, SD = 20.02 s) and VW&CMS plan (mean = 42.74 s, SD = 17.30 s) had longer initial time intervals than the OR plan (Mean = 24.69 s, SD = 21.54 s). Only age had a negative impact on the initial time interval (Wald = −0.548, p = 0.014). The results showed a decreasing trend in the initial time interval, with age. No significant effects of the other driver characteristics were observed.

4.1.2. Lane-Changing Operation Stage

The results of the GEE model showed that guidance plans significantly influenced the average speed, average deceleration rate, and duration distance of the lane-changing behaviors (see Table 4). Unlike the OR plan (baseline), the CMS plan (Wald = 22.502, p < 0.001) and VW&CMS plan (Wald = 14.859, p < 0.001) demonstrated positive correlations with the average speed. No significant differences in the average speed were observed between the CMS and VW&CMS plans in the paired comparisons according to the least significant difference (LSD) (p = 0.089). As shown in Figure 7a, the vehicle had a higher average speed and lower deceleration rate in the CMS plan (Mean = 84.45 km/h, SD = 11.86 km/h) and VW&CMS plan (Mean = 80.97 km/h, SD = 11.59 km/h) than in the OR plan (Mean = 66.56 km/h, SD = 15.71 km/h). Similarly, the CMS plan (Wald = 14.343, p < 0.001) and VW&CMS plan (Wald = 11.249, p = 0.001) had a positive influence on the average deceleration rate. The comparisons showed no significant difference in the average deceleration rate between the CMS and VW&CMS plans (p = 0.793). As shown in Figure 7b, the average deceleration rates under the CMS plan (mean = 0.20 m/s2, SD = 0.24 m/s2) and VW&CMS plan (mean = 0.19 m/s2, SD = 0.29 m/s2) were lower than under the OR plan (mean = 0.60 m/s2, SD = 0.53 m/s2). Moreover, unlike the OR plan (baseline), the CMS plan (Wald = 12.739, p < 0.001) and VW&CMS plan (Wald = 8.223, p = 0.004) positively impacted the lane-changing duration distance. The comparisons showed no significant difference in the lane-changing duration distances between the CMS and VW&CMS plans (p = 0.232). The results show an increased tendency in the lane-changing duration distance under the CMS (mean = 471.47 m, SD = 253.89 m) and VW&CMS plans (mean = 425.71 m, SD = 201.96 m), compared with the OR plan (mean = 319.94 m, SD = 211.57 m) (Figure 7c).
Table 4 shows the results of the GEE model for estimating the effects of the characteristics of the drivers. The average deceleration rate was negatively affected by age (Wald = 6.237, p = 0.013). The results showed a decreasing trend in the average deceleration rate with age. Gender significantly influenced the lane-changing duration distance; the GEE result illustrated that the male participants (mean = 442.62 m, SD = 239.82 m) showed a longer lane-changing duration distance than the female participants (mean = 342.16 m, SD = 137.44 m) (see Figure 8).

4.2. Evaluation of the Effectiveness of Different Guidance Signage Plans

The influences of the three plans on the six indicators were different. However, due to the unclear weights of the six indicators, we were unable to evaluate the efficacy of the three plans or determine the most effective plan. To determine the weights of the six indicators, we adopted the entropy weight method, which is the most objective method for assigning weights. The TOPSIS algorithm can be used for multi-criteria decision analysis, in which a few schemes with many indicators can be evaluated by calculating the premium degree of each scheme [30]. Therefore, the TOPSIS method was employed in conjunction with a coefficient of entropy weight combination to obtain the premium degrees of the three plans.

4.2.1. TOPSIS Algorithm

Six indicators were used as the evaluation indicators for the three guidance plans. The performance ratings for each alternative against each attribute can be displayed in the form of a decision matrix [31]. Thus, the multiple objective decision matrix of the TOPSIS algorithm was formed as X = ( X ) m n ( m = 3 , n = 6 ) for the three guidance plans.
Using the TOPSIS method, all indicators should work in the same direction to explain the final result. Therefore, transformation consistency was performed on the indicators. First, a new multi-objective decision matrix ( X I J # ) was found. Then, the normalized matrix ( X i j # ) was formed. The normalized matrix ( X i j # ) was obtained, according to Equation (1):
X i j * = X I J # i = 1 n ( X i j * ) 2
Compared with various subjective weighting models, the biggest advantage of the entropy weight method is the avoidance of interference from human factors on the weight of indicators, thus enhancing the objectivity of the comprehensive evaluation results. The definition of entropy is the expected value of the self-information of a variable [32]. The information entropy variable, H j , was obtained according to Equation (2):
H j = k i = 1 m p i j ln p i j where   p i j = x i j i = 1 m x i j ,   k = 1 ln m
The entropy weight was calculated according to Equation (3):
W j = 1 H j j = 1 n ( 1 H j )
We determined the weights of the indicators, W j . The values of these weights demonstrated that the six indicators had different effects on the comprehensive efficiency of the three guidance signage plans. Then, we calculated the weighted normalized matrix, U i j * . The weighted-normalized decision matrix was composed of weighted ratings [31]. The weighted normalized matrix was obtained using Equation (4):
U i j = W j * X i j *
The Euclidean distance and the premium degree of each plan were calculated. The maximum and minimum indicators from matrix U i j were used to form two ideal solution vectors, U + and U . For the evaluation units of the three guidance plans, their distance to U + formed the best distance vector, D i + , and their distance to U formed the worst distance vector, D i . The premium degrees ( C i * ) of the three plans were calculated, following Equation (5). Premium degrees, C i * , were utilized to rank the competing alternatives, the values of which ranged from 0 to 1. A higher score value closer to 1 indicated the better efficiency of the plan [33].
C i * = D i + D i + + D i

4.2.2. Results of the TOPSIS algorithm in different guidance plans

We obtained the weights of the six indicators, ranked from high to low, as follows:
Lane-changing duration distance > average speed > response time > initial time interval > WLCA > average declaration rate.
The results of the corresponding weight, W i , are shown below:
W i = ( 0.17054 , 0.16776 , 0.16615 , 0.16544 , 0.16514 , 0.16497 ) .
The premium degrees of the three guidance plans were also calculated (see Table 5).
The OR plan had the lowest value. The highest value was in the CMS plan. Despite the addition of voice warnings, the VW&CMS plan had a lower value than the CMS plan.

5. Discussion

The promotion of the ETC policy by the Chinese government has led to rapid growth in the number of ETC vehicles and an increase in the number of vehicle channels at the toll stations of expressways in 2019–2020. Since ETC channels are typically arranged to the left of the toll station, most ETC vehicles are able to approach them without changing lanes. However, the current direction signage systems at toll stations have not been updated to accommodate the increase in ETC vehicles and are still directing ETC vehicles to change lanes. Based on the principle of directing minority MTC vehicles to change lanes earlier, we redesigned the content of the guidance signage in front of the toll station of the expressway in this study. The designed content provided advance guidance to the drivers who were in the “pre-attentive mode” and guided the drivers who were in the “controlled mode” several times to enhance the guidance effectiveness, encouraging MTC-vehicle drivers to decide to change lanes earlier, thereby reducing the possibility of conflicts between ETC vehicles and MTC vehicles at the toll plaza and improving the overall safety and efficiency of the toll station.
As shown in Figure 9, the lines shown in various colors represent the trajectories of the different plans. In the CMS plan, the layout of all signs within 1 km was optimized based on the OR plan, dramatically improving the lane-changing behaviors of the drivers. At the lane-changing decision-making stage, the response time of the drivers was reduced by 24%, the proportion of drivers who started to change lanes in advance increased by 45%, and the initial time interval was an extension of 71%. At the operation stage, the average speed increased by 78%, the average deceleration rate dropped by 67%, and the duration distance increased by 55%. As shown in Figure 9, the lane-changing start locations are distributed further away from the toll plaza, and the lane-changing processes are smoother (i.e., they are more dispersed in the longitudinal direction) in the CMS plan, compared with those in the OR plan. Additionally, 95% of MTC drivers thought that the guidance signs in the CMS and VWCMS plans assisted drivers in selecting the correct lane, according to the results of the questionnaire. The overall higher speed, lower deceleration rate, longer lane-changing distance, and positive attitudes toward signage as drivers approached the toll station suggested that the CMS plan can potentially contribute to traffic efficiency and safety.
Prior studies have found that voice warnings can improve driver attention and reduce the response time of drivers [34,35]. The addition of voice warnings to the CMS plan has transformed the guidance signage from a single visual form to both visual and auditory forms. However, according to the experimental results, the process of lane-changing behaviors was not significantly improved after the voice warnings were added. Among all the variables, only the proportion regarding whether lane-changing began in advance increased by 2%, with no significant differences in the other variables. The possible reason for this is that the location of voice warnings was placed too far forward and too close to the “2 km” sign. Several previous studies reported that the “2 km” sign did not influence the behaviors of drivers [36]. If the voice warnings were placed nearer to the toll station, they might function more effectively (e.g., 500 m to 1 km).
The whole lane-changing process of the drivers was influenced by driver characteristics, in addition to the guidance signage plans. The results showed that female drivers had a shorter lane-changing duration distance than males, indicating that female drivers may have more difficulty staying safe during lane-changing activities. This finding is consistent with a previous study [36]. Although there was no significant difference between males and females at the decision-making stage in this study, females were found in some research to be more cautious and secure than males at the decision-making stage (particularly in the reaction progress stage), better at comprehending the provided information, and reacting accordingly [37], whereas, in this study, no significant difference was observed due to the limited amount of sign information. Compared with younger drivers, older drivers may apply a lower deceleration rate, which agrees with a previous study [38]. Furthermore, the cognitive impairment that comes with age makes it hard for drivers to make quick decisions [39], thus bringing the initial time interval of lane-changing closer to the toll plaza. Many studies have shown that with an increase in age, drivers’ reaction ability decreases; thus, they have higher risk perception [40] so they may exhibit more cautious driving behavior [41,42].
The current study has some limitations. No surrounding vehicles were simulated, to eliminate interference between vehicles. In future studies, the surrounding traffic flow should be taken into account as a factor, to explore the influence of the guidance plan on driving behaviors. Additionally, the experiment sample size is small. In the future, a larger sample size should be adopted to improve the generalizability of the experimental results.

6. Conclusions

In this study, using a driving simulator, we investigated the effectiveness of three guidance plans for approaching toll stations in terms of improving the lane-changing behaviors of drivers. In addition, we used the entropy-weight TOPSIS method to comprehensively evaluate the different guidance plans. Among the three guidance plans, the CMS and VW&CMS plans significantly improved the lane-changing behaviors compared with the OR plan. The following conclusions can be drawn:
  • With the increasing proportion of ETC vehicles and the number of ETC lanes increasing, the existing guiding systems are not sufficient to guide the MTC vehicles, resulting in a more unsafe lane-changing process.
  • The complete guidance design plan (CMS) guidance signage (provided guidance information at 500 m and 1 km upstream of the toll station) can allow drivers to have a shorter response time and earlier initial time interval and higher speed as the lane-changing progresses. In addition, the proportion of drivers who successfully complete lane-changing in advance may increase.
  • Adding voice warnings to the complete guidance design plan guidance signage may not be necessary, as the process of lane-changing behaviors was not significantly improved.
  • Male drivers are safer than female drivers during the lane-changing operation stage.
  • With an increase in age, drivers may have greater risk perception; they are more cautious during the lane-changing operation stage, such as a lower deceleration rate.
The study can provide support for revising the relevant standards to optimize the design of guidance signage systems for the toll stations of expressways. Furthermore, the study offers a general method to evaluate and optimize similar problems, based on driving simulator experiments.

Author Contributions

C.W.: Conceptualization, methodology, software, formal analysis, writing—original draft. W.X.: Conceptualization, methodology, investigation, writing–original draft. G.X.: Resources, writing—review and editing. X.L.: Resources, writing—review and editing. All authors have read and agreed to the published version of the manuscript.

Funding

The research was supported by the National Natural Science Foundation of China (71931003, 52102405, 52102406), the Natural Science Foundation of Hunan Province (2021JJ40603, 2021JJ40577), the Open Fund of Key Laboratory of Special Environment Road Engineering of Hunan Province (Changsha University of Science and Technology) (KFJ160503) and the Scientific Research Program of the Education Department of Hunan Province (21B0335, 20B009).

Institutional Review Board Statement

Not applicable.

Informed Consent Statement

Informed consent was obtained from all subjects involved in the study.

Data Availability Statement

Not applicable.

Conflicts of Interest

The authors declare no conflict of interest.

References

  1. National Highway ETC Utilization Rate Exceeds 65.98% Slow Traffic Congestion Relief at Toll Stations. Available online: http://news.china.com.cn/txt/2020-10/28/content_76852695.htm (accessed on 30 October 2022).
  2. GB5768.2-2022; National Standards of the People’s Republic of China: Road Traffic Signs and Markings-Part 2: Road Traffic Signs. General Administration of Quality Supervision, Inspection and Quarantine of the People’s Republic of China, China National Standardization Management Committee: Beijing, China, 2022.
  3. Zhao, N.; Zhao, X.; Lin, Z.; Zhu, X. Exit Gore Sign Forms for Freeway Based on Driving Behavior. China J. Highw. Transp. 2020, 04, 137–145. [Google Scholar]
  4. Huang, L.; Zhao, X.; Li, Y.; Ma, J.; Yang, L.; Rong, J.; Wang, Y. Optimal design alternatives of advance guide signs of closely spaced exit ramps on urban expressways. Accid. Anal. Prev. 2020, 138, 105465. [Google Scholar] [CrossRef] [PubMed]
  5. Shu, W. Design of road signs on urban expressways. China Foreign Highw. 2004, 24, 184–186. [Google Scholar]
  6. Hung, C. Manual de Señalización Vial y Dispositivos de Seguridad; Secretaría de Comunicaciones y Transportes: Mexico City, Mexico, 2014; p. 770. [Google Scholar]
  7. La Secretaría de Comunicaciones y Transportes México. Manual de Señalización Vial de Dispositivos Uniformes Para la Regulación de Tránsito en las vías de Colombia, 1st ed.; Gerardo Ávila Rodriguez: Bogotá, Colombia, 2015. [Google Scholar]
  8. Wang, J.; Hesar, S.; Collyer, C.E. Adding graphics to dynamic message sign messages. Transp. Res. Rec. 2018, 1, 63–71. [Google Scholar] [CrossRef]
  9. Cristea, M.; Delhomme, P. Comprehension and acceptability of on-board traffic information: Beliefs and driving behaviour. Accid. Anal. Prev. 2014, 65, 123–130. [Google Scholar] [CrossRef]
  10. Shinar, D.; Vogelzang, M. Comprehension of traffic signs with symbolic versus text displays. Transp. Res. Part F Traffic Psychol. Behav. 2013, 18, 72–82. [Google Scholar] [CrossRef]
  11. Marc, G. Visual search: Detection, identification, and localization. Perception 1992, 21, 765–777. [Google Scholar]
  12. Shiffrim, R.M.; Schneider, W.E. Controlled and automatic human information processing I. Detection, search, and attention. Psychol. Rev. 1997, 84, 1–66. [Google Scholar]
  13. Marc, G. “How Long Does It Take to Stop?” methodological analysis of driver perception-brake times. Transp. Hum. Factors 2000, 2, 195–216. [Google Scholar]
  14. Vanderbilt, T.; Brenner, B. Traffic: Why We Drive the Way We Do (and What it Says About Us); Knopf, A.A., Ed.; Vintage: New York, NY, USA, 2009; pp. 40–49. [Google Scholar]
  15. Yang, M.; Zhou, Z.; Wang, C.; Li, Y. Research on relationship between information load of freeway combined guide signs and reaction time. China Saf. Sci. J. 2014, 05, 15–20. [Google Scholar]
  16. Yao, X.; Zhao, X.; Liu, H.; Huang, L.; Ma, J.; Yin, J. An approach for evaluating the effectiveness of traffic guide signs at intersections. Accid. Anal. Prev. 2019, 129, 7–20. [Google Scholar] [CrossRef] [PubMed]
  17. Zahabi, M.; Machado, P.; Lau, M.Y.; Deng, Y.; Pankok, C.; Hummer, J.; Kaber, D.B. Driver performance and attention allocation in use of logo signs on freeway exit ramps. Appl. Ergon. 2017, 65, 70–80. [Google Scholar] [CrossRef] [PubMed]
  18. Lyu, N.; Cao, Y.; Wu, C.; Xu, J.; Xie, L. The effect of gender, occupation and experience on behavior while driving on a freeway deceleration lane based on field operational test data. Accid. Anal. Prev. 2018, 121, 82–93. [Google Scholar] [CrossRef] [PubMed]
  19. Upchurch, J.; Fisher, D.L.; Waraich, B. Guide Signing for Two-lane Exits with an Option Lane: Evaluation of Human Factors; Transportation Research Board: Washington, DC, USA, 2005. [Google Scholar]
  20. Fitzpatrick, K.; Chrysler, S.T.; Brewer, M.A.; Nelson, A.; Iragavarapu, V. Simulator Study of Signs for A Complex Interchange and Complex Interchange Spreadsheet Tool; Federal Highway Administration: Washington, DC, USA, 2013. [Google Scholar]
  21. Liu, X.; Zhang, W.; Wei, Z.; Zhang, Z.; Jiang, Y.; Zhu, Y. Evaluation and Optimization of Traffic Guide Sign Layout. J. Beijing Univ. Technol. 2015, 41, 95–102. [Google Scholar]
  22. Xie, X.; Jia, Z. Evaluation of the Expression of Intersection Direction Signs Based on Weight-TOPSIS. J. Taiyuan Univ. Sci. Technol. 2022, 43, 242–246. [Google Scholar]
  23. Tao, Y.; Feng, Z.; Liu, Y. The Effect of Construction of Multi-objective Function on the Process of Optimization. J. Taiyuan Univ. Sci. Technol. 2016, 37, 201–206. [Google Scholar]
  24. Niu, X. Comparative study of modern statistical computing method and intelligent statistical computing method. Stat. Consult. 2014, 05, 37–38. [Google Scholar]
  25. Yeh, C.H. The selection of multiattribute decision making methods for scholarship student selection. Int. J. Sel. Ass. 2003, 11, 289–296. [Google Scholar] [CrossRef]
  26. Zeng, J.; Qian, Y.; Yin, F.; Zhu, L.; Xu, D. A multi-value cellular automata model for multi-lane traffic flow under lagrange coordinate. Comput. Math. Organ. Theory 2022, 28, 178–192. [Google Scholar] [CrossRef]
  27. Luo, Z. Study on the Capacity and ETC Lane Configuration of Expressway Toll Station. Master’s Thesis, East China Jiaotong University, Nanchang, China, 2019. [Google Scholar]
  28. Zeng, J.; Qian, Y.; Li, J.; Zhang, Y.; Xu, D. Congestion and energy consumption of heterogeneous traffic flow mixed with intelligent connected vehicles and platoons. Phys. A Stat. Mech. Its Appl. 2023, 609, 128331. [Google Scholar] [CrossRef]
  29. Dahmen, G.; Ziegler, A. Generalized estimating equations in controlled clinical trials: Hypotheses testing. Biom. J. J. Math. Methods Biosci. 2004, 46, 214–232. [Google Scholar] [CrossRef]
  30. Qin, G.; Chen, T.; Li, W.; Sun, B. Fu CW-TOPSIS mine internal caused fire evaluation model of “AHP + entropy weight method”. J. Xian Univ. Sci. Technol. 2018, 02, 193–201. [Google Scholar]
  31. Chakraborty, S. TOPSIS and Modified TOPSIS: A comparative analysis. Decis. Anal. J. 2022, 02, 100021. [Google Scholar] [CrossRef]
  32. Pathria, R.K.; Beale, P. Statistical Mechanics, 3rd ed.; Academic Press: Cambridge, MA, USA, 2011; p. 51. [Google Scholar]
  33. Deng, H.; Yeh, C.-H.; Willis, R. Inter-company comparison using modified TOPSIS with objective weights. Comput. Op. Res. 2000, 27, 963–973. [Google Scholar] [CrossRef]
  34. Roswarski, T.E.; Proctor, R.W. Auditory stimulus-response compatibility: Is there a contribution of stimulus-hand correspondence? Psychol. Res. Psychol. Forsch. 2000, 63, 148–158. [Google Scholar] [CrossRef]
  35. Xiang, W.; Yan, X.; Weng, J.; Li, X. Effect of auditory in-vehicle warning information on drivers’ brake response time to red-light running vehicles during collision avoidance. Transp. Res. Part F Traffic Psychol. Behav. 2016, 40, 56–67. [Google Scholar] [CrossRef]
  36. Wang, J.; Wang, Y.; Bi, C.; Weng, J.; Yan, X. Modeling the probability of freeway lane-changing collision occurrence considering intervehicle interaction. Traffic Inj. Prev. 2016, 17, 181–187. [Google Scholar] [CrossRef]
  37. Ali, Y.; Bliemer, M.C.J.; Zheng, Z.; Haque, M.M. Cooperate or not? Exploring drivers’ interactions and response times to a lane-changing request in a connected environment. Transp. Res. Part C Emerg. Technol. 2020, 120, 102816. [Google Scholar] [CrossRef]
  38. Xiang, W.; Wang, C.; Li, X.; Xue, Q.; Liu, X. Optimizing guidance signage system to improve drivers’ lane-changing behavior at the expressway toll plaza. Transp. Res. Part F Traffic Psychol. Behav. 2022, 90, 382–396. [Google Scholar] [CrossRef]
  39. Eby, D.; Trombley, D.; Molnar, L.; Shope, J. The Assessment of Older Drivers’ Capabilities: A Review of the Literature (Report UMTR-98-24); University of Michigan Transportation Research Report Institute: Ann Arbor, MI, USA, 1998. [Google Scholar]
  40. Chen, T.; Sze, N.N.; Newnam, S.; Bai, L. Effectiveness of the compensatory strategy adopted by older drivers: Difference between professional and non-professional drivers. Transp. Res. Part F Traffic Psychol. Behav. 2021, 77, 168–180. [Google Scholar] [CrossRef]
  41. Molnar, L.J.; David, W.E. The relationship between self-regulation and driving-related abilities in older drivers: An exploratory study. Traffic Inj. Prevention. 2008, 9, 314–319. [Google Scholar] [CrossRef] [PubMed]
  42. Newnam, S.; Koppel, S.; Molnar, L.J.; Zakrajsek, J.S.; Eby, D.W.; Blower, D. Older truck drivers: How can we keep them in the workforce for as long as safely possible? Saf. Sci. 2020, 121, 589–593. [Google Scholar] [CrossRef]
Figure 1. A toll station of the expressway.
Sustainability 15 00982 g001
Figure 2. Optimized guidance signage system.
Sustainability 15 00982 g002
Figure 3. The Changsha University of Science and Technology’s driving simulator.
Sustainability 15 00982 g003
Figure 4. Lane-changing behavior stages and the key dependent variables.
Sustainability 15 00982 g004
Figure 5. WLCA proportion in different signage plans.
Sustainability 15 00982 g005
Figure 6. Mean response time and initial time interval in different plans. (a) the mean response time during the lane-changing decision-making stage for the different guidance plans; (b) the mean initial time interval during the lane-changing decision-making stage for the different guidance plans.
Sustainability 15 00982 g006
Figure 7. Mean speed, deceleration, and lane-changing duration distance for the different plans. (a) the average speed during the lane-changing operation stage for the different guidance plans; (b) the average deceleration rate during the lane-changing operation stage for the different guidance plans; (c) the longitudinal distance between the start and end of the lane-changing for the different guidance plans.
Sustainability 15 00982 g007
Figure 8. Lane-changing duration distance between the two genders.
Sustainability 15 00982 g008
Figure 9. The trajectory of the lane-changing behaviors used by the drivers in the different plans.
Sustainability 15 00982 g009
Table 1. Preliminary information on driver characteristics and guidance signage plans.
VariableDescription
Guidance signage planOR (baseline) = 0; CMS = 1; VW&CMS = 2
Driver characteristics
GenderMale (baseline) = 0; Female = 1
AgeContinuous variable
Table 2. Results of the GEE model for WLCA.
VariableWhether Lane-Changing Was Started in Advance (WLCA)
Estimate (SE)Exp (Estimate)Waldp-Value
Constant−0.145 (1.144)0.865 0.016 0.899
Guidance plan (CMS)2.621 (0.667)13.744 15.420 0.000
Guidance plan (VW&CMS)3.053 (0.739)21.183 17.086 0.000
Gender (Female)−0.283 (0.556)0.754 0.259 0.611
Age0.004 (0.029)1.004 0.015 0.901
Table 3. Variables estimated by the GEE model at the lane-changing decision-making stage.
VariableResponse time (RT)Initial Time Interval (ITI)
Estimate (SE)Waldp-ValueEstimate (SE)Waldp-Value
Constant55.374 (9.144)36.672 0.000 42.523 (9.507)20.004 0.000
Guidance plan (CMS)−14.488 (5.668)6.533 0.011 17.333 (5.509)9.901 0.002
Guidance plan (VW&CMS)−16.314 (5.223)9.757 0.002 18.029 (5.244)11.818 0.001
Gender (Female)2.218 (3.856)0.331 0.565 3.93 (5.122)0.589 0.443
Age0.059 (0.186)0.102 0.749 −0.548 (0.224)5.978 0.014
Table 4. Variables estimated by the GEE model at the lane-changing operation stage.
VariableAverage Speed (AGES)Average Deceleration Rate (ADR)Lane-Changing Duration Distance (LCD)
Estimate (SE)Waldp-ValueEstimate (SE)Waldp-ValueEstimate
(SE)
Waldp-Value
Constant57.725 (5.367)115.6770.000−0.255 (0.136)3.5280.060381.449 (113.301)11.3350.001
Guidance plan (CMS)18.26 (3.849)22.5020.0000.386 (0.102)14.3430.000190.126 (53.269)12.7390.000
Guidance plan (VW&CMS)14.706 (3.815)14.8590.0000.401 (0.119)11.2490.001143.795 (50.144)8.2230.004
Gender
(Female)
−3.816 (3.037)1.5780.2090.09 (0.083)1.2000.273−127.641 (45.929)7.7240.005
Age0.277 (0.147)3.5690.059−0.01 (0.004)6.2370.013−1.916 (3.358)0.3260.568
Table 5. Euclidean distance and the premium degrees of the three plans.
D i + D i C i * Rank
OR plan0.753003
CMS plan0.0400.7260.9471
VW&CMS plan0.1230.6860.8482
Disclaimer/Publisher’s Note: The statements, opinions and data contained in all publications are solely those of the individual author(s) and contributor(s) and not of MDPI and/or the editor(s). MDPI and/or the editor(s) disclaim responsibility for any injury to people or property resulting from any ideas, methods, instructions or products referred to in the content.

