Article

The Effect of Pristine Graphene on the Mechanical Properties of Geopolymer Mortar

1
Department of Civil Engineering, Pan African University Institute for Basic Sciences, Technology and Innovation (PAUSTI), Jomo Kenyatta University of Agriculture and Technology, Nairobi P.O. Box 62000-00200, Kenya
2
Department of Mechanical, Aerospace and Civil Engineering, University of Manchester, Manchester M13 9PL, UK
3
Department of Civil, Construction and Environmental Engineering, Jomo Kenyatta University of Agriculture and Technology, Nairobi P.O. Box 62000-00200, Kenya
4
Building and Civil Engineering Department, Technical University of Mombasa, Mombasa P.O. Box 90420-80100, Kenya
*
Author to whom correspondence should be addressed.
Sustainability 2023, 15(2), 1706; https://doi.org/10.3390/su15021706
Submission received: 14 December 2022 / Revised: 9 January 2023 / Accepted: 13 January 2023 / Published: 16 January 2023

Abstract

:
The dire need for sustainable construction materials has resulted in emerging research to improve the properties and, subsequently, the structural performance of the geopolymer composite. One of these progressive moves is this study’s focus on enhancing the mechanical properties of geopolymer composite. This experiment employed a unique methodology in preparing pristine graphene-reinforced geopolymer mortar. Moreover, the study’s successful dispersion of a large-size (50 µm) industrially manufactured pristine graphene (PG) and its effect when incorporated in the geopolymer matrix was the first of its kind in research on geopolymer. The dosages of PG by weight of the precursor added to the geopolymer mix were 0.05%, 0.07%, 0.1%, and 0.3%. The results revealed that PG less than 5% by weight of the dispersing medium produced a good dispersion when sonicated in an aqueous solution and polycarboxylate ether superplasticiser as a surfactant. An ultraviolet-visible spectrophotometer was used to affirm that the PG aqueous solution subjected to ultrasonication was stable, well dispersed, and fit for incorporation in the geopolymer mortar. When the 0.07% dosage of the PG was incorporated in the geopolymer mortar, the compressive strength was highest, reaching 61.2 MPa and 63.5 MPa at 7 and 28 days, respectively. At 28 days after adding the 0.07% dosage of PG to the geopolymer mortar, the direct tensile strength was maximum at 2.5 MPa, while the flexural strength had a maximum of 10.4 MPa. An optimum PG dosage of 0.07% significantly improved the compressive, tensile, and flexural strengths by 14.4%, 25.96% and 17.35% at 28 days, respectively. Furthermore, the hypothesis tested acknowledged that the 0.05% and 0.07% PG dosages were responsible for significant improvement of the mechanical properties of the geopolymer mortar. This study affirms that large-size industrially produced PG could revolutionise the entrant of sustainable construction materials.

1. Introduction

Cement, among the constituents of concrete, mortar, and other cementitious composites, is the second most widely used material in the world after water [1]. In the last decade, a rough estimate of about 3 billion tonnes of Portland cement was recorded to have been manufactured. Due to global industrialisation, there is a prospect for continuous and increased usage of this material [2]. The current use of cement is estimated at four tonnes per capita, and the embodied energy responsible for concrete production ranks among the highest across energy-consuming industries in the world [2,3]. One tonne of Portland cement production is responsible for one tonne of CO2 emission, resulting in 5–8% of CO2 emissions globally [1,4,5].
With the continuous reliance on Ordinary Portland Cement (OPC), there will be an increment in the amount of CO2 and other harmful gases such as nitrogen oxides (NOx) and sulphur trioxide (SO3) released into the atmosphere. In the next 40 years, the emission will be twice the current record, contributing largely to global warming and acid rain [6,7]. Furthermore, besides the increased greenhouse gas emissions, non-renewable resources such as limestone are consumed exhaustively in cement production [8]. These resources deplete by the day due to uncontrolled and non-regulated mining in several countries [9].
The undesirable impacts of cement production and usage have prompted the need to investigate and develop construction materials that will serve as alternatives to cement. These materials are expected to be produced with less energy and reduce global carbon footprint and cost while ensuring the performance is comparable to or higher than that of OPC [10,11]. The advancement in this respect has resulted in the development of some alternative materials. These materials range from supplementary cementitious materials such as fly ash, palm oil fuel ash, and ground granulated blast furnace slag used to partially replace cement or improve laterite soil [12,13] to entirely cementless binders known as geopolymers [14]. The dire need for durable, mechanically efficient, and environmentally friendly construction materials and the potential of geopolymer composite to satisfy these needs have brought increased attention to geopolymer composite [15].
Geopolymers are alternative cementitious materials proposed by Davidovits in 1978. This name resulted from the binder’s formation through alumina-silicate (source) materials’ polymerisation with alkaline solutions [16]. The geopolymer composite poses the overall environmental benefit of an 80% decrease in CO2 emission and a 60% decrease in embodied energy in its production when compared to cement concrete [7]. The abundance of industrial by-products have also contributed to the advantages of geopolymers over cement. Overall, geopolymer composite has demonstrated lower shrinkage and creep, improved freeze–thaw resistance, improved resistance to chlorides, acid, and sulphate attacks, improved fire resistance, greater thermal insulation qualities, and excellent bonding properties [7,16,17,18,19].
Fly ash-based geopolymer composite (GC) is the most common and oldest among geopolymer’s broadly researched source materials. Its qualities have been investigated more than any other type of geopolymer composite [20]. It is affirmed that the fly ash-based GC, compared to the OPC composite, is less susceptible to the Alkali-Silica Reaction (ASR) between the OH- within the pores of the composite matrix. This reaction is responsible for the strength loss, cracks, and expansion of concrete structures [8]. Furthermore, fly ash-based GC, compared to OPC composite, has been seen to possess a denser microstructure, lower chloride diffusion, and lower porosity [8]. Despite these outstanding qualities, GC possesses a quasi-brittle behaviour resulting from its ceramic-like properties. It is low in flexural and tensile strength and characterised by catastrophic failure under loading. These drawbacks have limited its application in safety-based structural designs [3,21].
Defects in pure geopolymer may arise from cracks existing inside the geopolymer matrix and its inherent porosity due to the inorganic bond formation during geopolymerization [15]. These defects have made it inherent to improve the fracture properties of the geopolymer mix, thereby necessitating the improvement using secondary reinforcing particles [15,22]. Among the several additives used to enhance the performance of concrete, the majority, according to their morphology, are either zero dimension (nano-SiO2, nano-Al2O3, and nano-TiO2) or one dimension (carbon nanotubes and nanofibers). The zero-dimensional additives with low aspect ratio and the one-dimensional additives’ lack of interfacial areas between the nanomaterial and the GC matrix limit their performance in bonding and arresting cracks, resulting from the nanoscale at the macroscale [23,24,25]. They are unable to efficiently enhance the reinforcement.

1.1. Nanoparticles in Geopolymer Composite

According to a recent study on the various types of nanomaterials, the effects of the zero- and one-dimensional nanoparticles on geopolymer composite have been extensively researched [26]. For example, nanosilica, the most researched nanoparticle in geopolymer application [26], has been seen to reduce workability in geopolymer composites. According to [27], the reduction in slump flow was about 16% when a 3% dosage of nanosilica was added to the geopolymer. A similar result was noticed by [28] at the same dosage, where the reduction in slump flow was 8.5%. The influence of nanosilica on the composite was linked to the high surface area of the nanosilica, which has many unsaturated Si-O bonds. These bonds absorb water from the alkali solution to form a silanol group (Si-OH). The formation of the silanol group Si-OH will result in a stiffer geopolymer [29].
In another study that incorporated nano-TiO2, the fluidity was affected as the increase in the nanoparticle led to a decrease in the flow of the geopolymer up to about 31% reduction when 5% of nano-TiO2 was added to the composite [30]. In a study where one-dimensional carbon nanotubes were used, adding the nanoparticle up to 0.2% only slightly reduced the mini-slump diameter. This result contrasts the reduced fluidity recorded in cement composite because of the carbon nanotubes’ high specific surface area. In geopolymer, the reduction in the flow observed by adding carbon nanotubes was statistically insignificant in reducing the flow of the composite. The result of this effect was assumed to have been the small quantity of carbon nanotubes in the composite [31].
Considering the compressive strength at 28 days, the use of nanosilica had increased compressive strength up to 11% compared to the control when the nanosilica dosage was capped at 1.5% in the composite [26,32]. Another study reported an optimum dosage of 0.5% nanosilica dosage to improve the metakaolin-loaded geopolymer concrete’s dry and wet compressive strengths by 12% and 17%, respectively [33]. The effect of nanosilica on the increased strength values was attributed to the nanosilica’s ability to fill pores, creating a denser and more compact matrix. Moreover, the geopolymerization reaction is accelerated, resulting in a stronger binder. Excess nanosilica leads to the agglomeration of the particle, causing the strength reduction of the geopolymer composite [32].
In a study involving carbon nanotubes in geopolymer composites, the compressive strength at 28 days increased by 1.5%, 13.6%, and 1.3% when the carbon nanotube dosage was 2, 5, and 10%, respectively [34]. In another study, a lower carbon nanotube content, 0.02%, resulted in a dramatic 81% increase in compressive strength at 28 days [26]. The tremendous increase in compressive strength can be linked to the influence of sodium hydroxide on the dispersion of carbon nanotubes. The sodium hydroxide helps to ensure that the carbon nanotubes are adequately dispersed in the mix [35]. Furthermore, several studies involving the use of nanoparticles have shown improved splitting tensile [28,36] and flexural strength [37,38] values for both zero- [28,38] and one-dimensional nanoparticles [34,39].
Irrespective of the advantages that the zero- and one-dimensional nanomaterials offer, as previously discussed, the low aspect ratios of the zero-dimensional nanoparticles hinder their ability to arrest cracks propagated from the nanoscale. Therefore, its enhancement of reinforcement efficiency is hindered [25]. Furthermore, one-dimensional materials such as carbon nanotubes have been limited by the inability to generate full bonding with cementitious materials as a result of an absence of interfacial area between them [23,40]. Moreover, much has been done covering the properties of various zero- and one-dimensional nanomaterials in the literature. Among the various nanoparticles, nanosilica is the most researched, having a frequency percentage of 63.4%, while nanomaterial, such as graphene, falls within the other group (2.4%), which comprises the least used nanoparticles in geopolymer composites [26].
Graphene is different from zero- and one-dimensional nanomaterials. It is a two-dimensional nanomaterial consisting of carbon atoms with a honeycomb lattice arrangement [3,41]. It is an allotrope of carbon with a large specific surface area [22,42]. Graphene has a planar shape that allows both sides of its atomic lattice to be in close contact with the matrix generating a stronger bond between graphene and the composite [21,43]. It requires a small amount to boost the performance of the composite because of its large surface area [3], and it is added as a percentage of the source material. The potential of graphene in improving composites has made it imminent to seek various variants, particularly those with fewer defects, to enhance the composite’s mechanical properties. Hence, studies are expected to cover the grey areas in graphene application and seek the best means to improve the properties of cementitious composites such as geopolymer.

1.2. Graphene in Geopolymer Composite

The different derivatives of graphene, pristine graphene (PG), graphene oxide (GO), reduced graphene oxide (rGO), and graphene Nanoplatelets (GNPs), have been explored in the literature. These derivatives have proven to hold the potential capable of opening doors in interdisciplinary research and enhancing strength properties, particularly in concrete [15]. However, the van der Waals force between graphene sheets may make dispersion difficult. The graphene, if not adequately dispersed, may agglomerate, affecting the reinforcing action of graphene in the composite material [44]. Thankfully, the techniques for dispersing graphene have been widely explored [8,45,46,47,48,49]; nonetheless, it is essential to consider them to ensure the best technique is employed for the application. Furthermore, as [15] acknowledged, the state of the dispersion needs to be reported in studies as there is a limited report in literature covering this.
Graphene is produced either through a bottom-up or top-down approach. Various means of synthesising graphene have proven to either be defective, non-economical, or non-scalable [50]. Moreover, the graphene derivatives prepared before now on a laboratory scale have varying quality and properties that may not be reproducible [40]. For instance, GO has been the most sought-after form of graphene in the research on graphene-reinforced geopolymer composites because it possesses oxygen-embodied functional groups, such as epoxy, hydroxyl, and carboxyl, that foster easy dispersibility. However, Hummer’s method, one of the several modified chemical exfoliation methods commonly used to synthesise GO, is not environmentally conducive [51]. The method releases obnoxious gases and causes explosion risk, limiting its large-scale production [15]. The GO formed is also impure due to the deposition of the cations on the GO sheet [52].
GO-reinforced geopolymer composites confirmed optimal dosages ranging from 0.03 to 3% [45,46,47,49] to improve the mechanical properties of geopolymer composites up to 61.9% [46]. However, GO is limited by chemical, thermal, or mechanical instability [15]. The rGO formed by reducing GO has also proven to be effective in producing a crystal structure similar to that of pristine graphene [53]. However, reducing the GO to rGO results in structural defects [15].
The GNPs have been found to improve the mechanical properties of geopolymer composites, with some studies affirming 1% [21,54] addition as the optimum, while other studies confirmed 0.5% [3,55] to improve the mechanical properties. Nonetheless, the appearance of the structural defects also reflects in the graphene Nanoplatelets. The GNPs have a small specific surface area [56] and layers greater than 10. According to [57], the difference in the percentage of the fracture stresses of graphene with layers less than 10 is not sensitive. Numerous layers and small specific surface areas of GNPs will result in a considerable reduction in fracture properties and reinforcing efficiency of the graphene [56,57]. Hence, the confidence in using graphene with layers less than 10, considered to be pristine graphene [58], is ascertained, provided its proper dispersion in the geopolymer composite, which has not been considered yet in literature.
Considering the planar sizes of graphene used in geopolymer composite, graphene of 25 µm or less has been used over time [45,54,59,60]. There is a paucity of studies on incorporating larger sizes in geopolymer composite. GO, widely employed in geopolymer research, has improved mechanical properties using smaller sizes because smaller sizes have more oxygen-containing function groups [61]. These functional groups exhibit a stronger interfacial adhesion with the cement composites [56]. Therefore, the more oxygen-containing functional groups, the better the adhesion.
On the other hand, the oxygen groups located at the edges of pristine graphene are extremely few, and various mechanisms ensuring the adhesion of PG with the composite are coordinated at these points. The fewer oxygen-functional groups at the edges of PG indicate the possibility of a different mechanism of PG enhancement of cementitious composite. As a result, the mechanisms at play are linked to friction–adhesion forces between the PG sheets and the composite matrix [40,62]. Therefore, [40,62] proposed and confirmed that the larger sizes of PG have a better enhancement of the mechanical properties of the cement matrix. However, there is no study on using large-size PG in the mechanical property enhancement of geopolymer composite.
From the thorough review of literature, as reported in the previous sections, on the use of nanomaterials in geopolymer composites, it is evident that the studies on the use of graphene are limited compared to other nanomaterials. Moreover, the use of pristine graphene and its effect on the properties of geopolymer composite has not been encountered in previous studies. In addition, it was revealed from a study that future studies are expected to cover flexural strength tests [3]. Furthermore, [15] confirmed that the use of PG in geopolymer composite was not encountered in the literature because of the problem of dispersion that it faces. A call for this study was thereby reinforced by the recommendation made by [24] that, in future studies, the effect of various PG dosages needs to be investigated to provide a relevant understanding of the enhancement mechanism of PG to improve the mechanical properties of Alkaline Activated Binders (geopolymer), after the researchers’ successful attempt in improving the cement mortar with PG.
To address the observed gaps, this study investigated the effect of using an electrochemically exfoliated, industrially produced large-size (50 µm) pristine graphene on the mechanical properties of geopolymer composite. To achieve this aim, a unique procedure for preparing the geopolymer composite was determined. The dispersion techniques were explored, and the state of PG dispersion was ascertained prior to incorporation into the geopolymer. The effect of the PG’s various dosages (0% to 0.3%) on the mechanical properties of the geopolymer mortar was determined. This study further tested the hypothesis that a large-size PG, greater than 25 µm, will significantly improve the mechanical properties of the geopolymer composite. The results of this study chart a new curve for the practical applications of pristine graphene in construction materials, specifically the industrially manufactured PG variant.

2. Materials and Methods

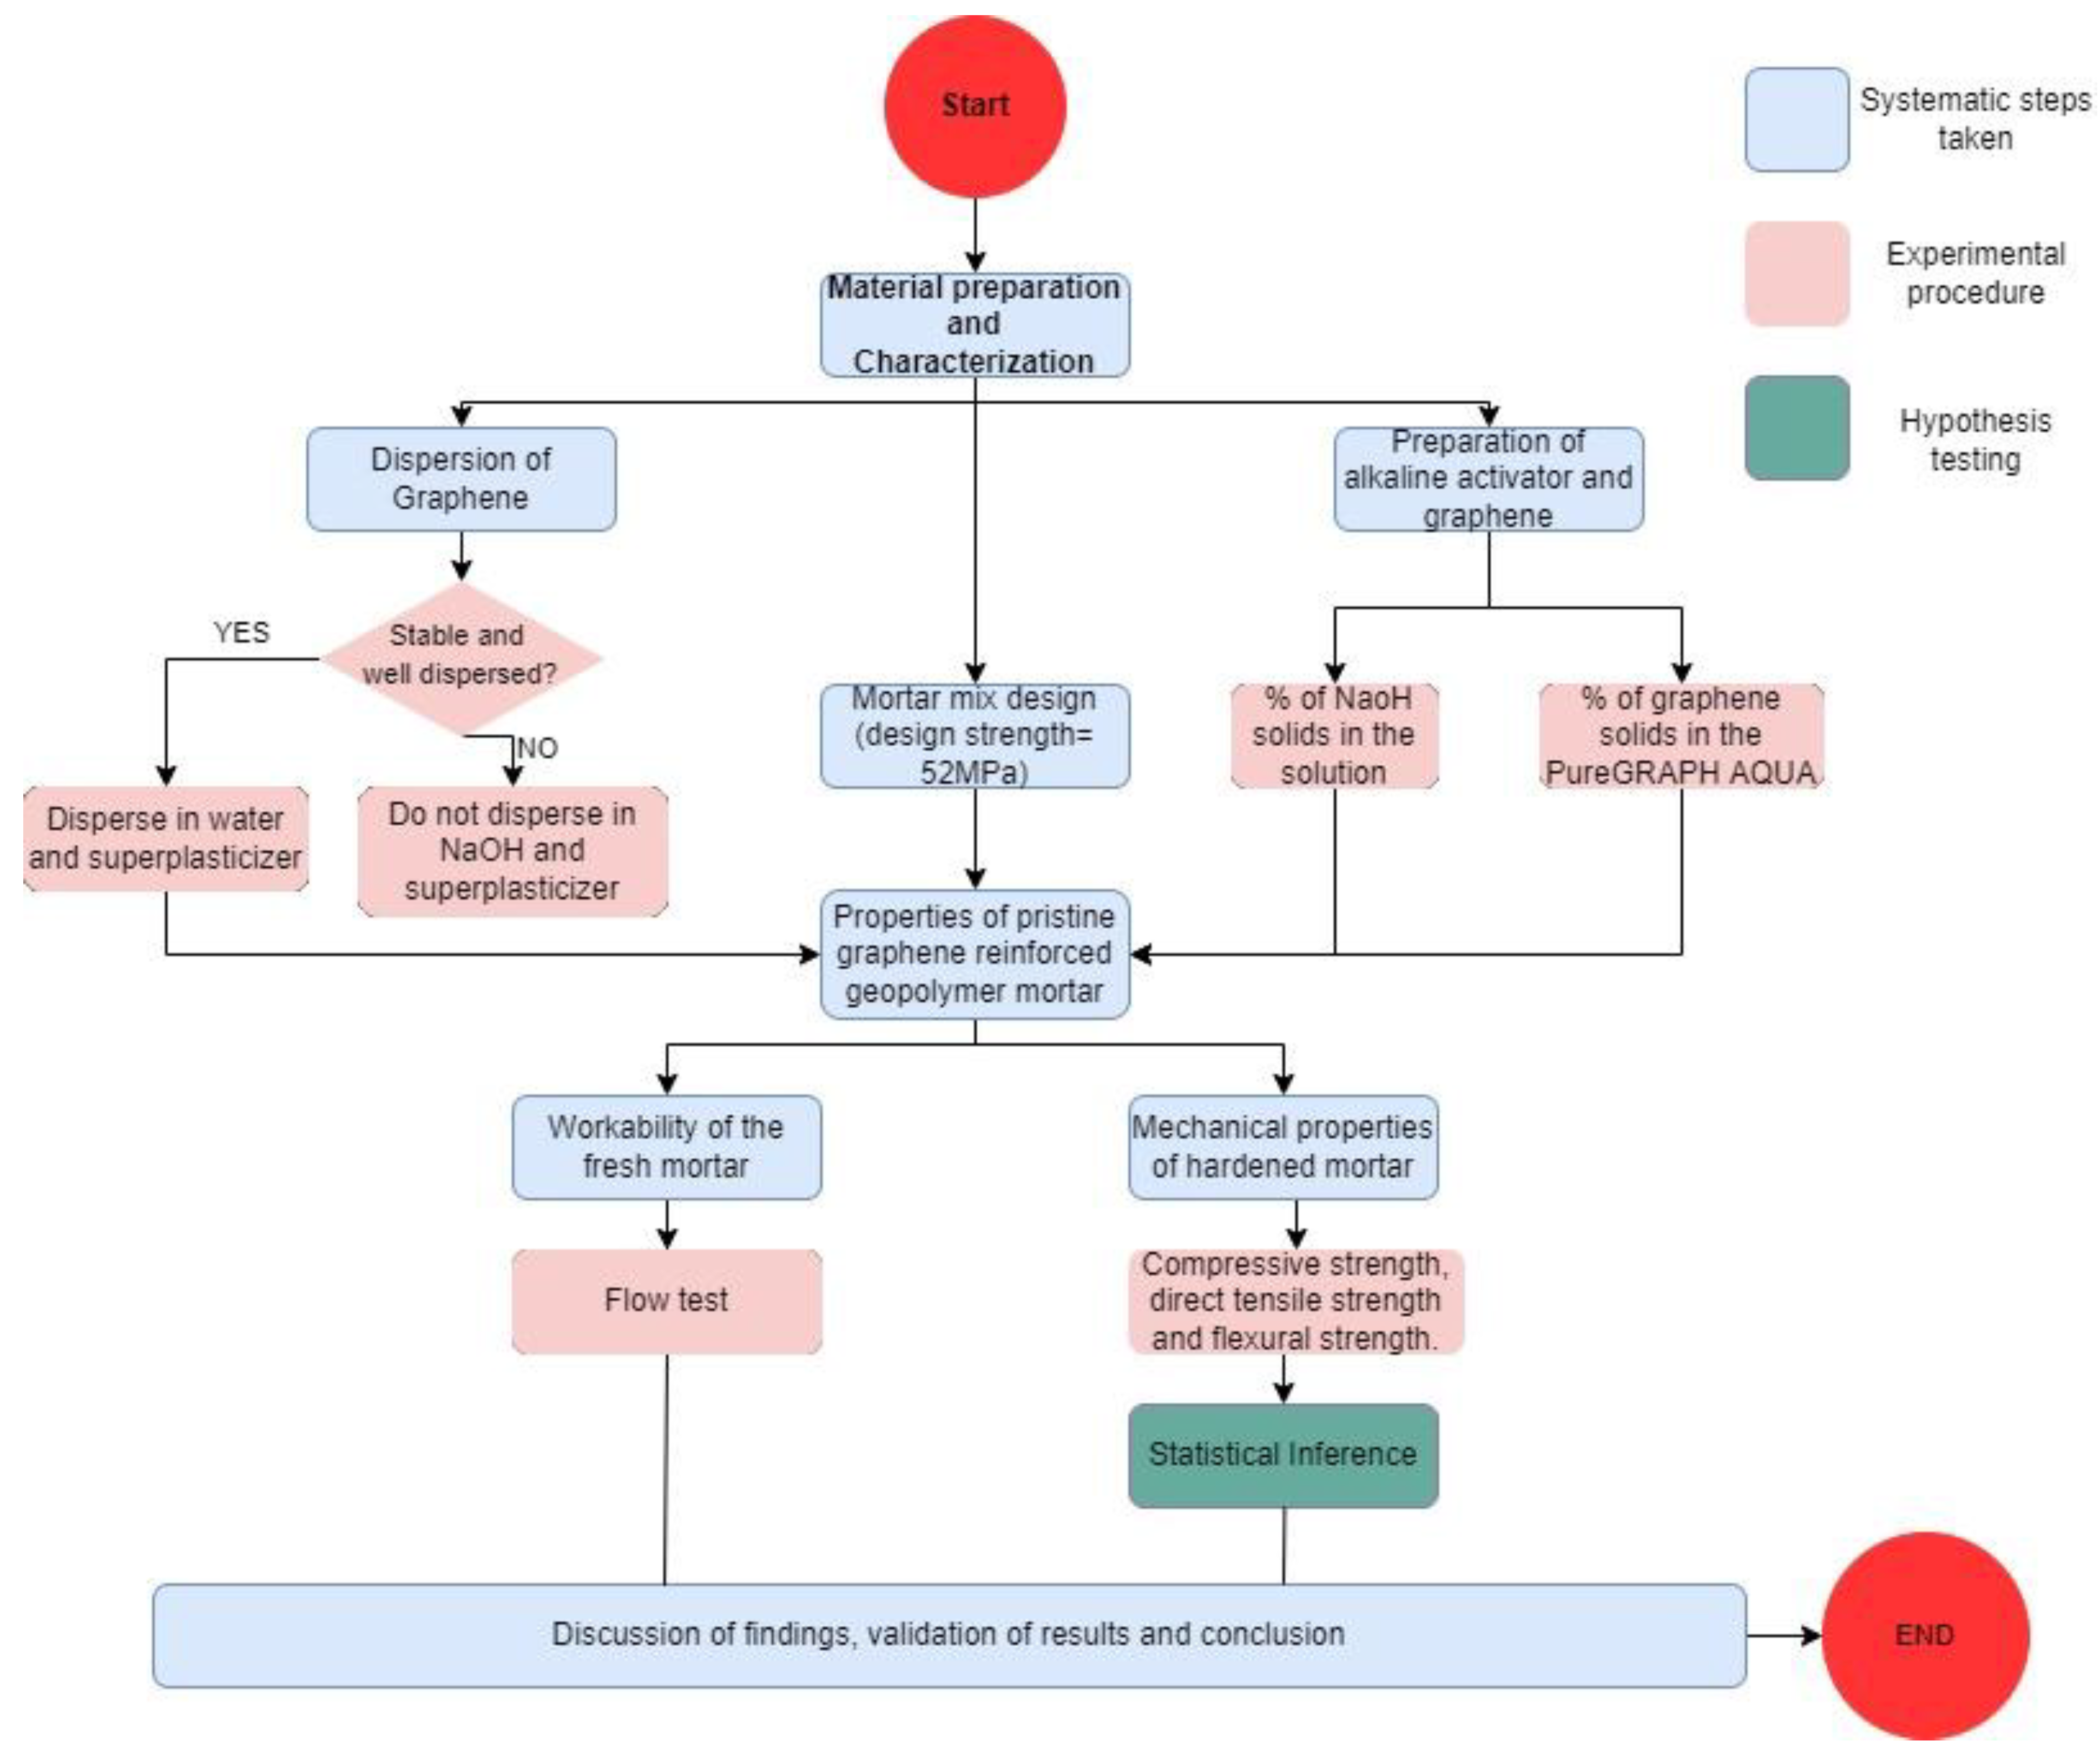
2.1. Methodology Flow Chart

The experimental study commenced with material acquisition, preparation, and characterisation, followed by several steps to achieve the study’s objectives and conclusion. The systematic procedure followed in this study is displayed in Figure 1 below.

2.2. Materials

The materials used are limited to fly ash, river sand, alkaline activators, superplasticiser, pristine graphene, and water. The fly ash with its properties shown in Table 1 used in this study, in line with the ASTM C-618 [63], is a Class F fly ash because the calcium oxide content is less than 10%. The alkaline activator is a mixture of sodium hydroxide and sodium metasilicate, following the recommendation acknowledged in the study of [64] that a mixture of an activator with sodium silicate outperforms a single activator in the geopolymerization process. River sand of maximum size 4.75 mm was employed as fine aggregate, and the particle size distribution (PSD) was done following the procedure outlined in ASTM C 33 [65]. The result of the PSD is shown in Figure 2. Master Glenium 3889, a polycarboxylate ether superplasticiser, acted as a surfactant in the aqueous solution used to disperse the pristine graphene supplied by First Graphene Ltd (United Kingdom). The superplasticiser’s properties are shown in Table 2, while that of PG is displayed in Table 3.

2.3. Alkali Activator Preparation

The sodium hydroxide (NaOH) flakes used in the study are an analytical reagent grade with a purity of not less than 98%. An amount of 14 mole per litre (M) of NaOH solution was used due to the performance of this concentration in previous studies [7,66]. The concentration was prepared by dissolving 560 g of NaOH flakes in a one-litre sodium hydroxide solution. The amount 560 g was the product of the required concentration (14 M) and the molecular mass of the NaOH. The 560 g of NaOH pellets were then dissolved in 500 mL water. The solution was gently mixed and allowed to cool. After cooling, water was added to the solution up to 1000 mL. The weight of the solution was determined, and the weight (560 g) of the NaOH pellets (solids) was calculated as a percentage of the weight of the solution. The Na2SiO3 was purchased from Euro Industrial Chemicals. Na2SiO3 is in solution form with Na2O: SiO2 ratio of 1:2.10. The properties of the alkali activators are displayed in Table 4.

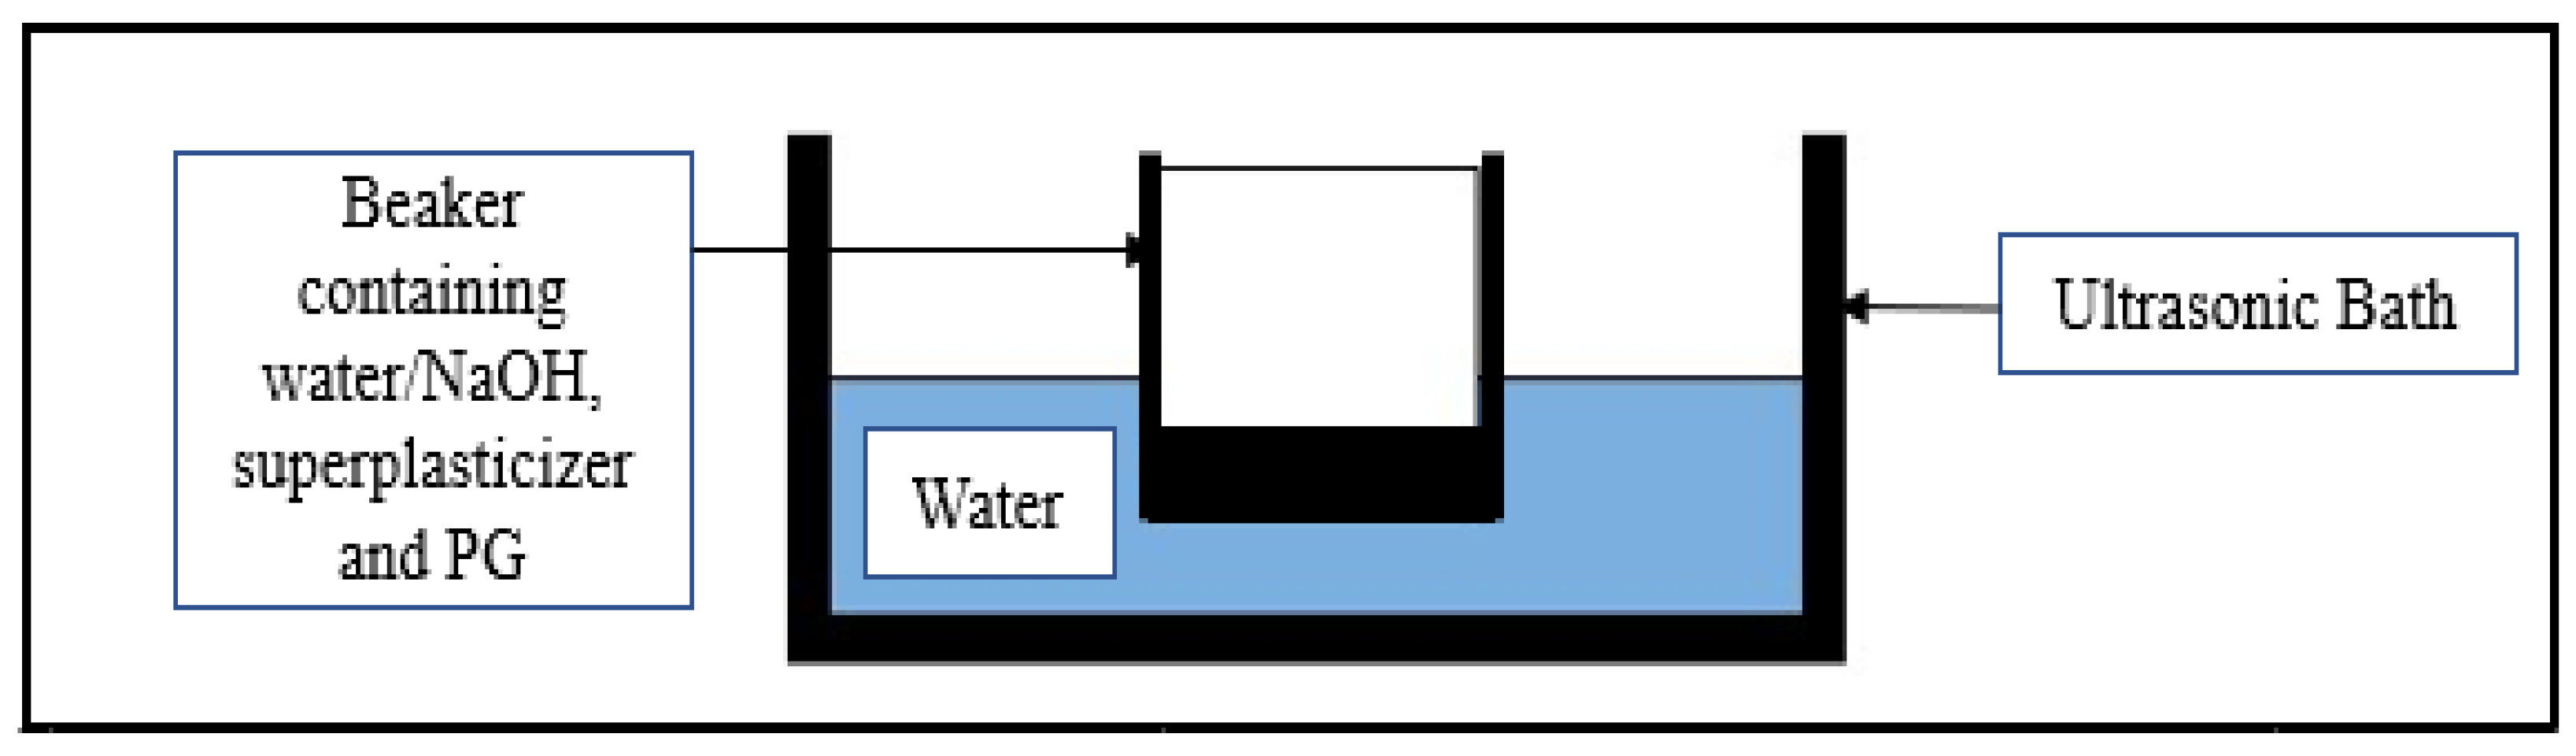
2.4. Preparation of PG Suspension in Aqueous and NaOH Solution

Two techniques were tried for the dispersion of PG. The PG was first dispersed in a mixture of NaOH and superplasticiser (MasterGlenium 3889), followed by dispersion in water and superplasticiser. The PG was dissolved in the solutions and stirred for 15 min before being subjected to ultrasonication using a calibrated bath sonicator (EMAG Emmi-H30) at a power of 90.93 J/S. The dispersion was done by sonicating for 3 hrs 20 min for a 0.78% of PG to aqueous or NaOH solution in a beaker submerged in 1-litre water held in the ultrasonic bath, as displayed in Figure 3.

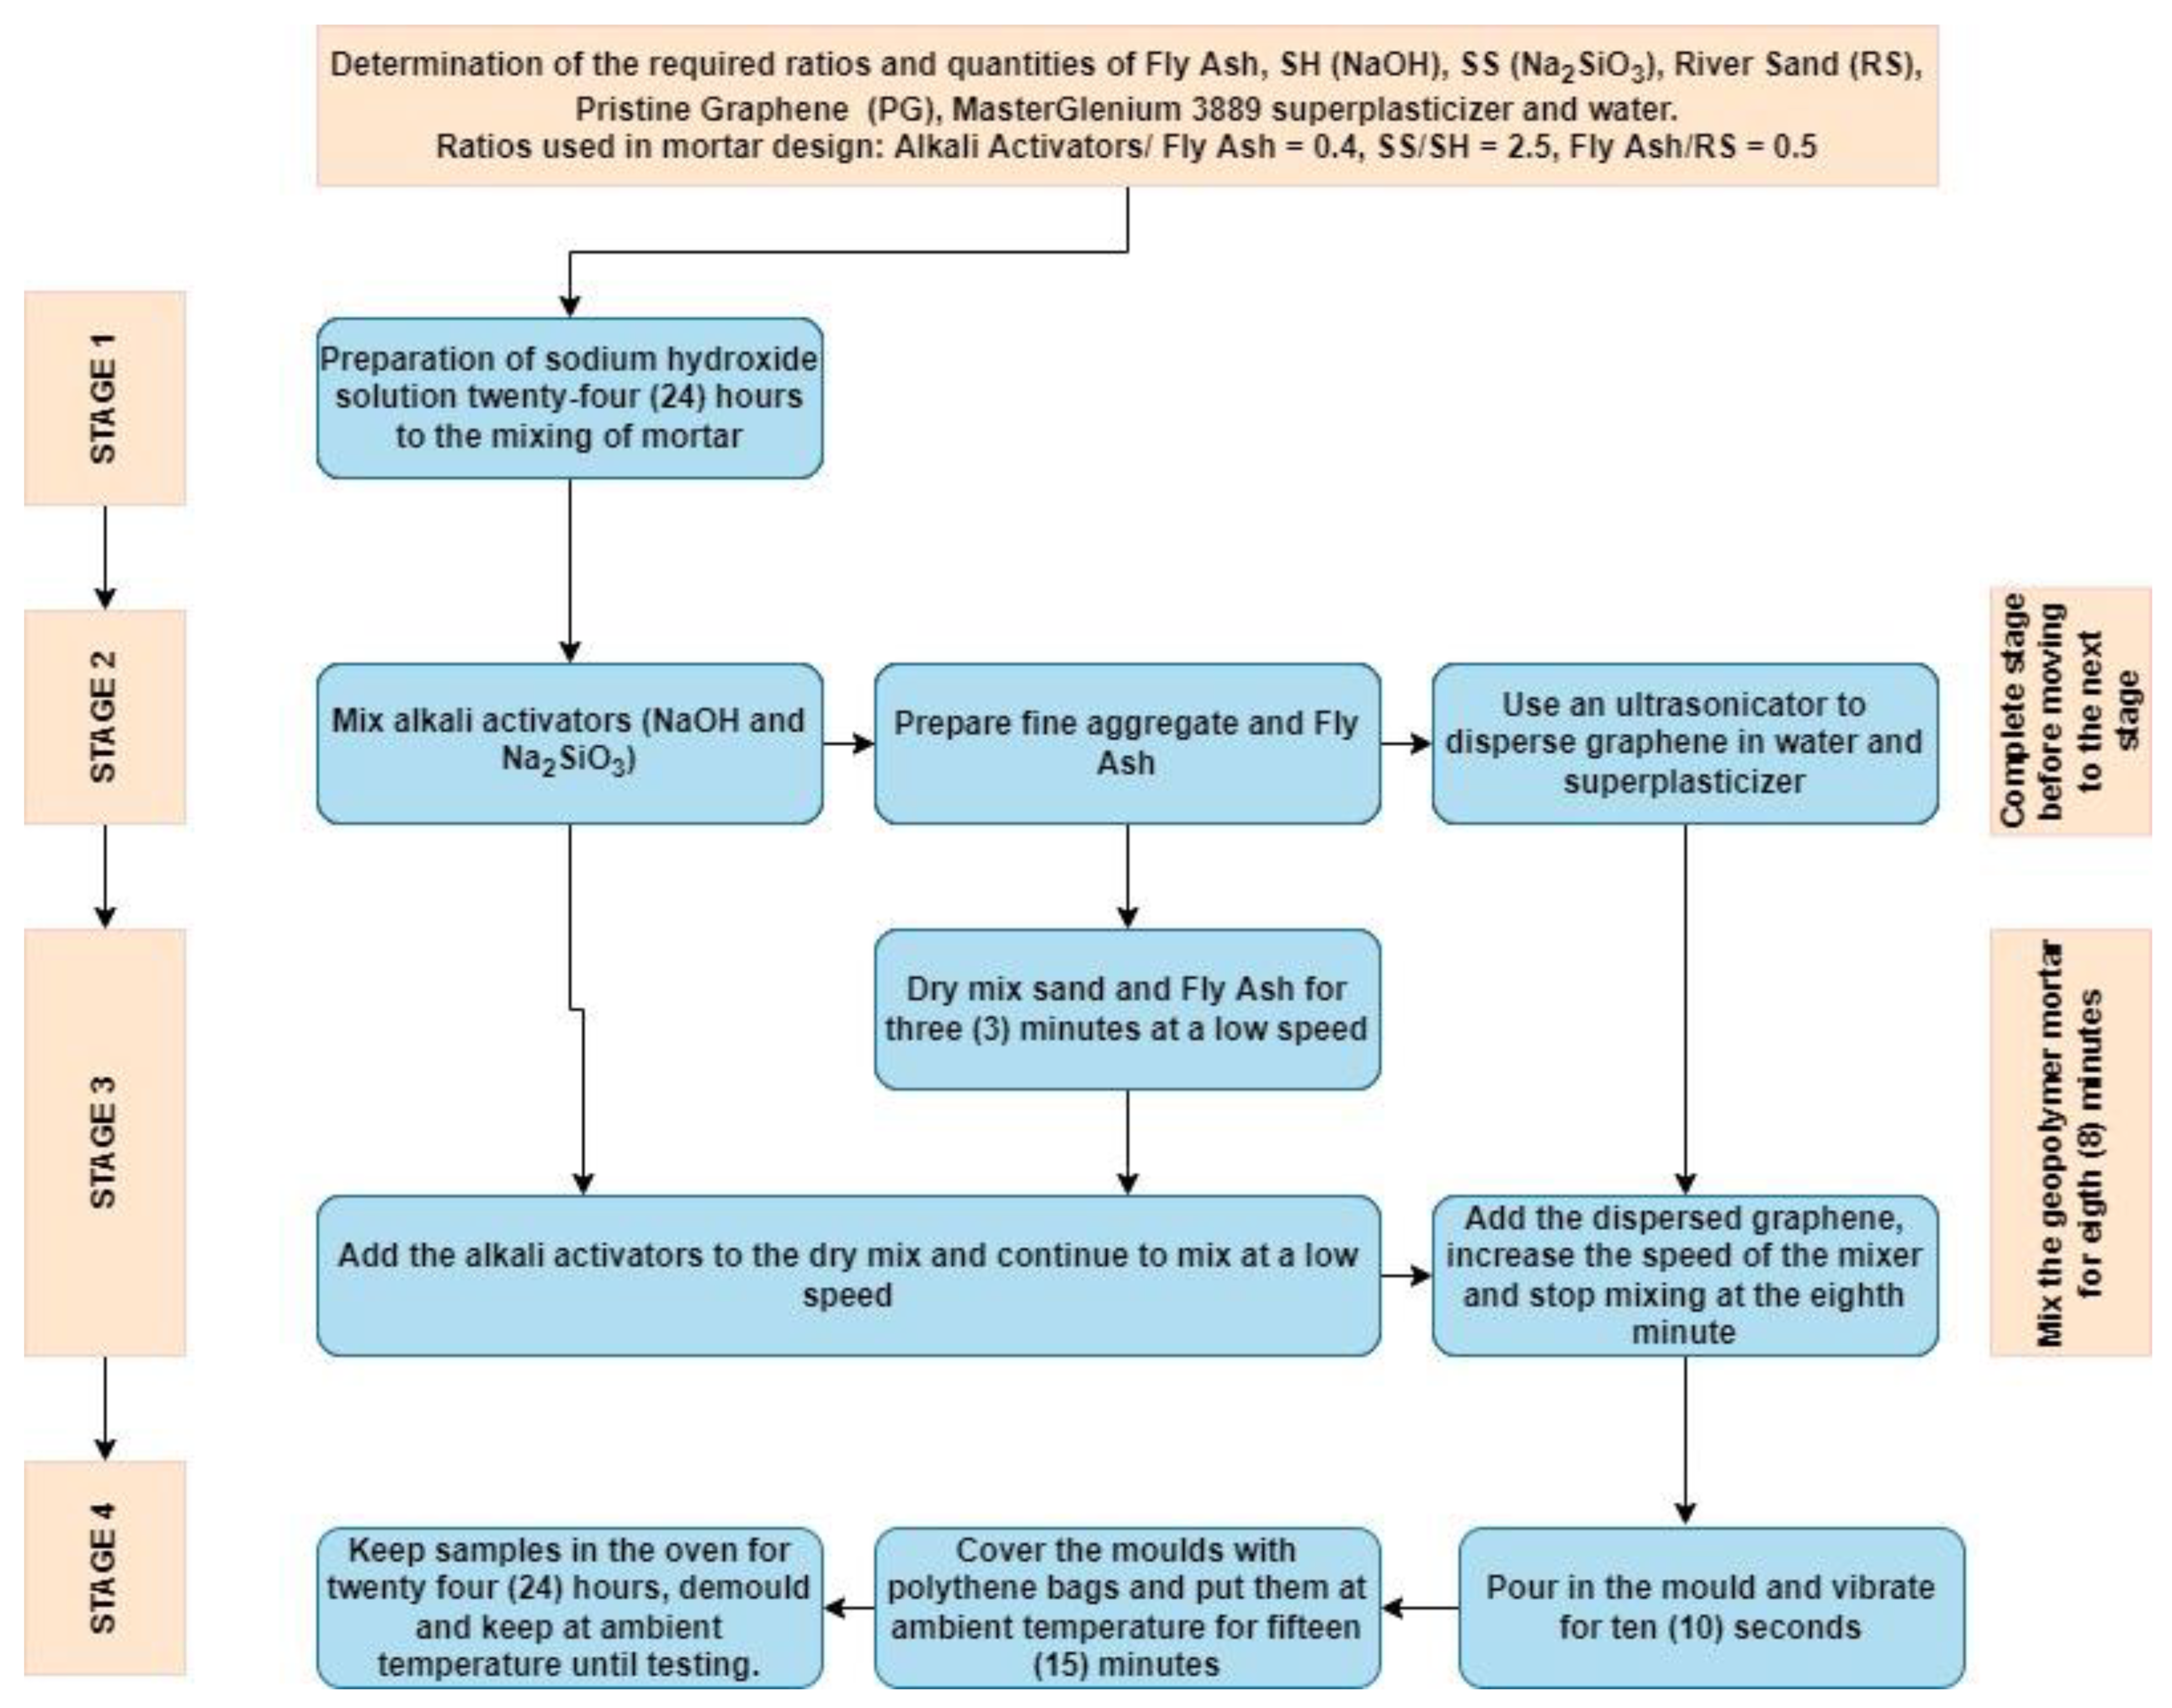
2.5. Preparation of PG-Reinforced Geopolymer Mortar

There is no known standard method for the mix design of the geopolymer composite [20,67]; therefore, the procedure outlined and values indicated in [7,9,67] was followed to arrive at the mix proportions and design strength of the mix. The concentration of the NaOH, quantity of the fine aggregate, the ratio of NaOH to Na2SiO3, liquid-activator-to fly-ash ratio, and additional water content were determined from the literature that already considered optimising the geopolymer constituent by using the Taguchi method for mix design [9]. The calculated ratios and values of the various constituents calculated and determined from previous studies were subjected to trial mixes of which the final ratios and values for the mix determined were:
  • The ratio of liquid activator to fly ash by mass: 0.4;
  • Na2SiO3 to NaOH ratio: 2.5;
  • NaOH concentration: 14 M;
  • Fly-ash-to-sand ratio: 0.5;
  • Superplasticiser dosage: 1% by mass of the fly ash;
  • Additional water content: 7.24% by mass of the fly ash;
  • Curing time: 24 h;
  • Curing temperature: 75 °C;
  • Rest period: 15 min.
The mix proportions, ratios, and values determined for this study, as deduced from the final design, are displayed in Table 5. The water content increased and differed from those used by [9] because more water was required for PG dispersion. Therefore, oven-dried sand was used. The water required to get the sand to saturated surface dry (SSD) was added to the initial additional water determined for the mix, leading to more water, greater than 5% of the precursor. The additional water was, however, optimised by various trial mixes to arrive at the final value, which was 7.24% by mass of the fly ash. This percentage was carefully determined to ensure the water was not in excess to prevent the negative effect of excess water on the properties of the geopolymer mortar.
Seven unique mixes shown in Table 5 were proposed to be prepared for the PG-reinforced geopolymer mortar. The mixes are PG0 (the geopolymer mortar without PG), PG0.05, PG0.07, PG0.1, PG0.3, PG0.5, and PG1.0. PG signified pristine graphene, while the numbers (0.05 to 1.00) were the percentages (0.05%, 0.07%, 0.10%, 0.30%, 0.50%, and 1.00%) of the pristine graphene by weight of the precursor (fly ash). These unique mixes were influenced by a detailed literature review on pristine graphene and GNPs in cement mortar and geopolymer composite, respectively [21,40,54,55,62,68]. However, the mixes were not cast beyond PG0.3 because when the content of pristine graphene to the dispersion medium (water and superplasticiser) exceeded 5%, the aggregation of PG was clearly observed. For example, PG0.50 was 3.24 kg/m3, and the sum of water and superplasticiser required for dispersion was 53.39 kg/m3. The percentage of the PG to the water required for dispersion was 6.07%. Therefore, the mixes maintained for the study were PG0, PG0.05, PG0.07, PG0.10, and PG0.30 because the PG0.50 and PG1.00 had percentages more than 5% of the dispersing medium. The final mass of the constituents was determined, and the values for making 1 m3 of the mortar are presented in Table 5.

2.6. Sequence of Mixing

The 14 M NaOH solution was prepared 24 h before mixing the mortar. At the end of the 24 h, the NaOH was mixed with Na2SiO3 and dispersion of the PG commenced in the quantity of water determined in the design. The polycarboxylate-based MasterGlenium 3889 superplasticiser was added to the water as a surfactant. After dispersion, the fly ash was mixed with the fine aggregate for 3 min at a low speed. The liquid activator (NaOH and Na2SiO3) was afterwards added, and the mixing continued at a low speed. The dispersed graphene was added, after which the speed of the mixer was increased, and the mixing stopped at the eight-minute mark. The flow was determined on the flow table. The mortar was then poured into the moulds, vibrated for ten (10) seconds on the vibrating table, covered in polythene (plastic) bags, and kept at room temperature for fifteen (15) minutes. After 15 min of rest, the samples were kept in the oven for 24 h at 75 °C. At the end of the 24 h of curing in the oven, the samples were removed and kept at room temperature until testing at 7 and 28 days. The details of the ratios and mix procedure are outlined in Figure 4.

2.7. Characterisation of the Materials

The pristine graphene used in the study was received in paste form, and the solid content was determined by oven drying a 5 g sample of the PG at 110 °C. The volumetric average of the PG was determined from the particle size distribution using a laser diffraction technique. The Scanning Electronic Microscopy (SEM) of the PG was obtained using the Hitachi SU5000 to produce high-resolution images of the dried PG sample. The same was done for the fly ash sample. The specific gravity, particle size distribution, moisture content, fineness, and loss on ignition were carried out in line with the specifications of ASTM standards [63,69].

2.8. The Dispersion State of the Suspended PG

The dispersion state of the PG was confirmed using an ultraviolet-visible spectrophotometer (Shimadzu UV-1800) to determine the transmittance immediately and 24 h after sonication and mechanical stirring. The dispersion state was obtained for the PG dispersed using a bath sonicator and the other set using a mechanical stirrer. The transmittance was used to affirm the suspension of the PG in the solution at different wavelengths prior to inclusion in the geopolymer mix.

2.9. Fresh and Hardened Properties of Geopolymer Mortar

The flow test was done to determine the workability of the PG-reinforced geopolymer mortar in accordance with the ASTM-C1437 [70]. The method described in the standard was duly followed. The conical mould had a bottom diameter of 100 mm, top diameter of 70 mm, and height of 50 mm. The cone was filled with mortar in two layers and tampered with layer-by-layer to ensure the uniformity of the mortar. The cone was removed vertically, and the average spread with reference to the cone was recorded. The flow values were obtained as the percentage of the diameter increase in the mortar spread from the base of the conical mould in line with the ASTM-C1437 standard. For the compressive strength, direct tensile strength, and flexural test, the 50 mm × 50 mm × 50 mm cubes, dog bone shape briquette, and 40 mm × 40 mm × 160 mm prism moulds were used, respectively. The compressive and tensile strength tests were done per the ASTM-C109/C109M-07 [71] and ASTM C307-03 [72], respectively. Furthermore, the flexural strength test was done to conform with the ASTM C348-18 [73]. The compressive strengths were carried out 7 and 28 days after casting, while the direct tensile and flexural strengths were tested at 28 days. The Analysis of Variance (ANOVA) and Kruskal–Wallis test were conducted to test the significance of the PG dosages in the geopolymer matrix. Before determining the significance of the dosages, the data were subjected to normality tests to determine if a parametric (ANOVA) or a non-parametric pairwise post-hoc test was befitting for the acquired data.

3. Results and Discussion

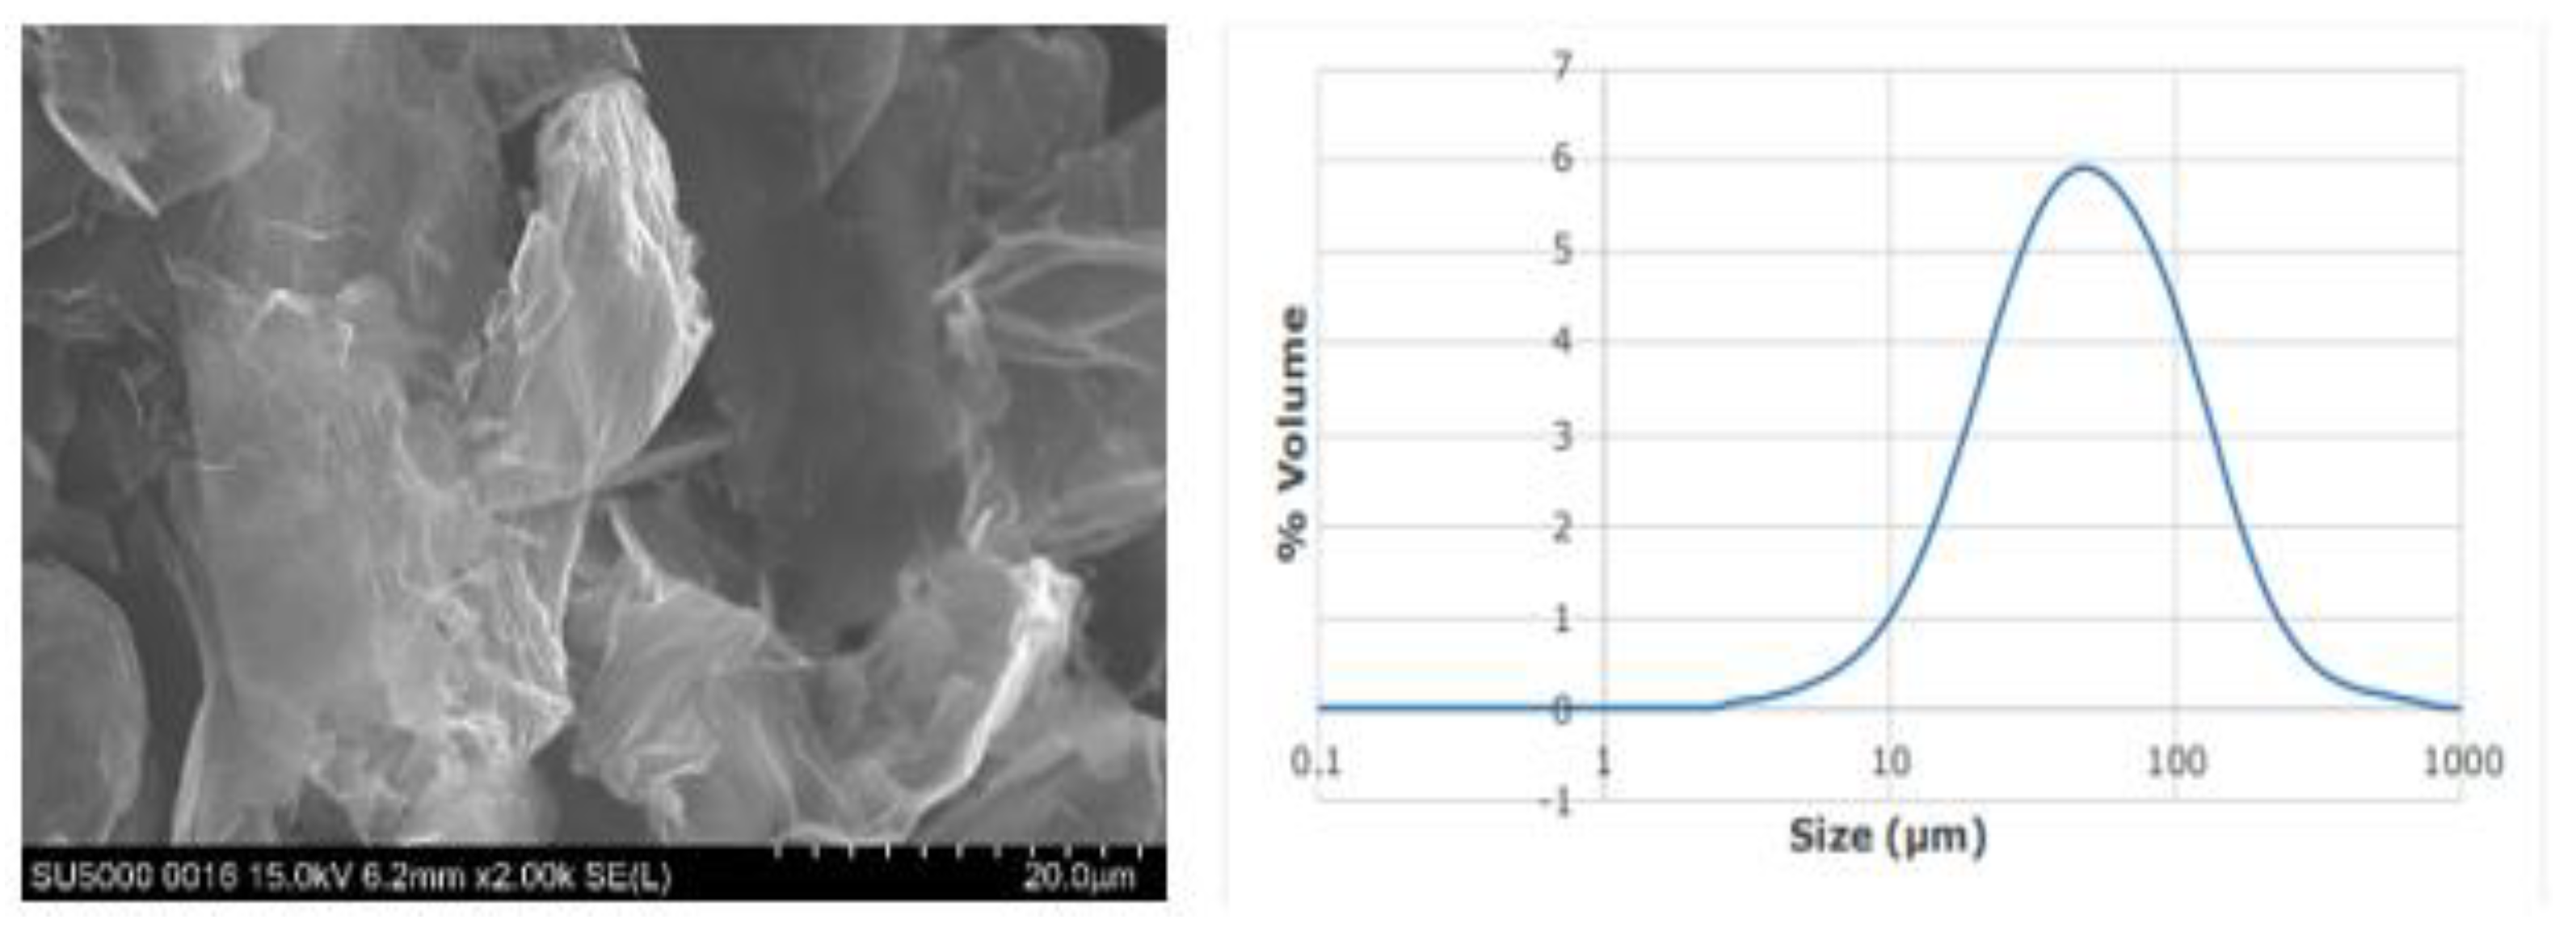
3.1. Characterisation and Dispersion of the Industrially Produced Pristine Graphene

The pristine graphene’s morphology and physical properties depict it as an irregularly shaped material. It is two-dimensional with an average particle size of 50 µm and a carbon content of 99%. The morphology is evidence of its potential to arrest cracks in geopolymer composites compared to other nanomaterials that have less than two dimensions, see Figure 5. The planar shape of the PG confirms the description acknowledged by [21] on the shape and the potential of both sides of graphene to be in contact with the geopolymer composite. The pristine graphene used in this study is in paste form, and the solid content was 23.27% of the paste.
The PG, as displayed in Figure 6, showed that it has fewer layers than GNPs which have several layers. Compared to previous studies, the PG differs from zero-dimensional nanomaterials such as nanosilica which are spherical [74]. Furthermore, the difference from one-dimensional nanoparticles such as carbon nanotubes is evident because only one side of the carbon nanotube can contact the composite matrix [21]. Meanwhile, for pristine graphene, as shown in Figure 6, both sides of the nanoparticles can contact the composite matrix due to its planar surface and being a two-dimensional nanoparticle. The description of pristine graphene in this study is in tandem with the description given in previous studies where it was used in a cement mortar [40,62].
Several trials showed that the higher the sonication time of PG, the better the dispersion in the aqueous solution. Therefore, for this study, an optimum of 3 h and 20 min was reached using a 90.93 W bath sonicator. The PG was initially dispersed in NaOH solution. This decision was informed by the successful result of dispersion carried out by [76]. The solution was stirred for 15 min and sonicated for 3 h and 20 min. After sonication, the aggregation of the PG was clearly noticed; therefore, the PG suspension was restricted to dispersion in an aqueous solution. To confirm the effect of ultrasonication on the solution, the UV-vis analysis was conducted on a stirred sample and a sample subjected to ultrasonication after stirring for 15 minutes. The results are displayed in Figure 7. Figure 7A,C,D gives detailed information about the PG solution that was stirred for 15 minutes using a mechanical stirrer and, afterwards, subjected to ultrasonication for 3 h 20 min. On the other hand, Figure 7B,E,F are associated with the samples that were only stirred with the mechanical stirrer before determining the transmittance using the spectrophotometer. UV-vis was obtained for the two groups, and Figure 7 gives detailed information on their dispersion state.
The stirred sample subjected to ultrasonication for 3 h and 20 min was a dark homogenous mix with no signs of sedimentation immediately after ultrasonication. The absence of sedimentation reflected by the physical observation and the UV-vis analysis resulted from the proper dispersion of the PG particles by ultrasonication. The PG was well dispersed and stable in the aqueous solution. Therefore, sediments could not be noticed as the PG particles were also not in excess in the solution. The UV-vis analysis is shown in Figure 7A, and the physical observation is in Figure 7C. After 24 h, the percentage of transmittance was less than 0.12%, and the sedimentation was almost not noticed in the solution shown in Figure 7D.
The solution subjected to stirring alone, as displayed in Figure 7E, had some shiny crystals after stirring and the percentage of transmittance shown in Figure 7B was less than 5%. The shining crystals result from the mechanical stirrer’s disturbance of the PG particles to get the PG particles appropriately dispersed within the aqueous solution. However, at that stage, the PG was not perfectly dispersed. After 24 h, the shining crystals disappeared, and sedimentation of PG was noticed in the solution shown in Figure 7F. The transmittance percentage after 24 h was greater than 15% but less than 35%.
Compared to the previous studies, the sedimentation in [40] after 24 h was more pronounced than those observed in this study. This study’s graphene subjected to ultrasonication was more stable with less sedimentation even after 24 h. The UV-vis analysis reflected the importance of ultrasonication to prepare a well-dispersed PG prior to application in the geopolymer mix. The sonicated sample was the best fit to produce a quality geopolymer mortar due to the absence of sedimentation or aggregation after sonication.

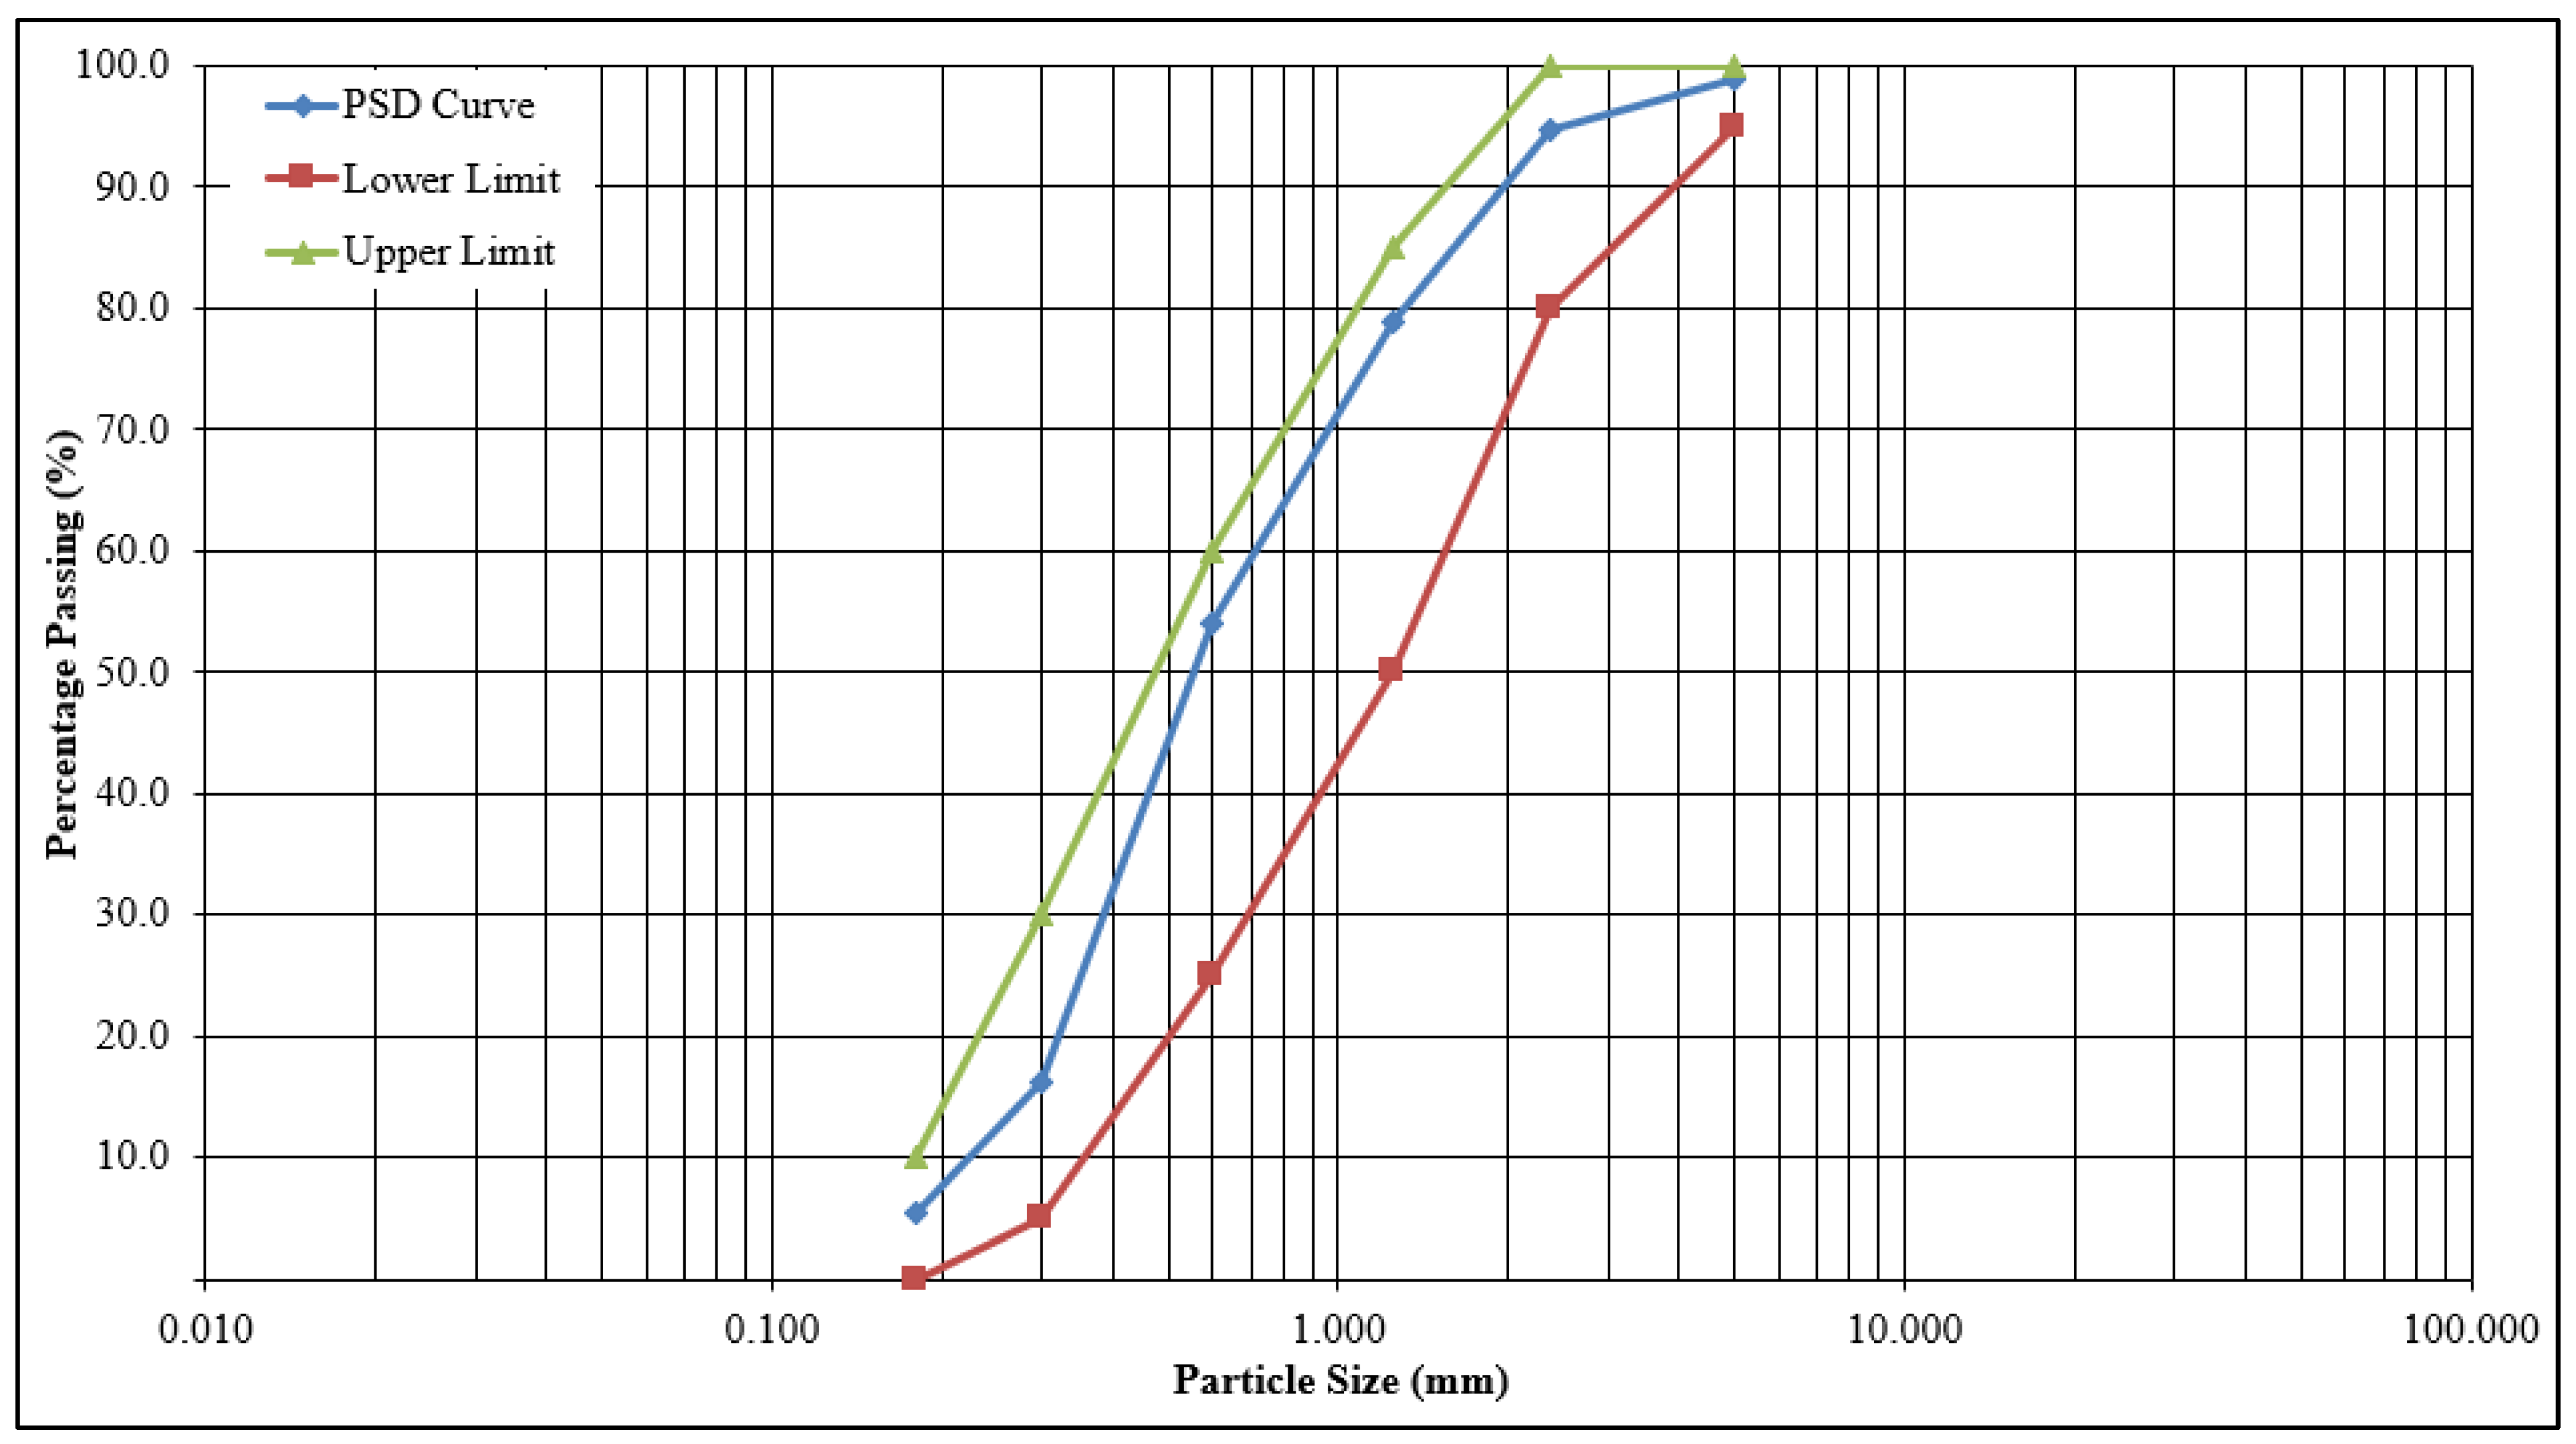
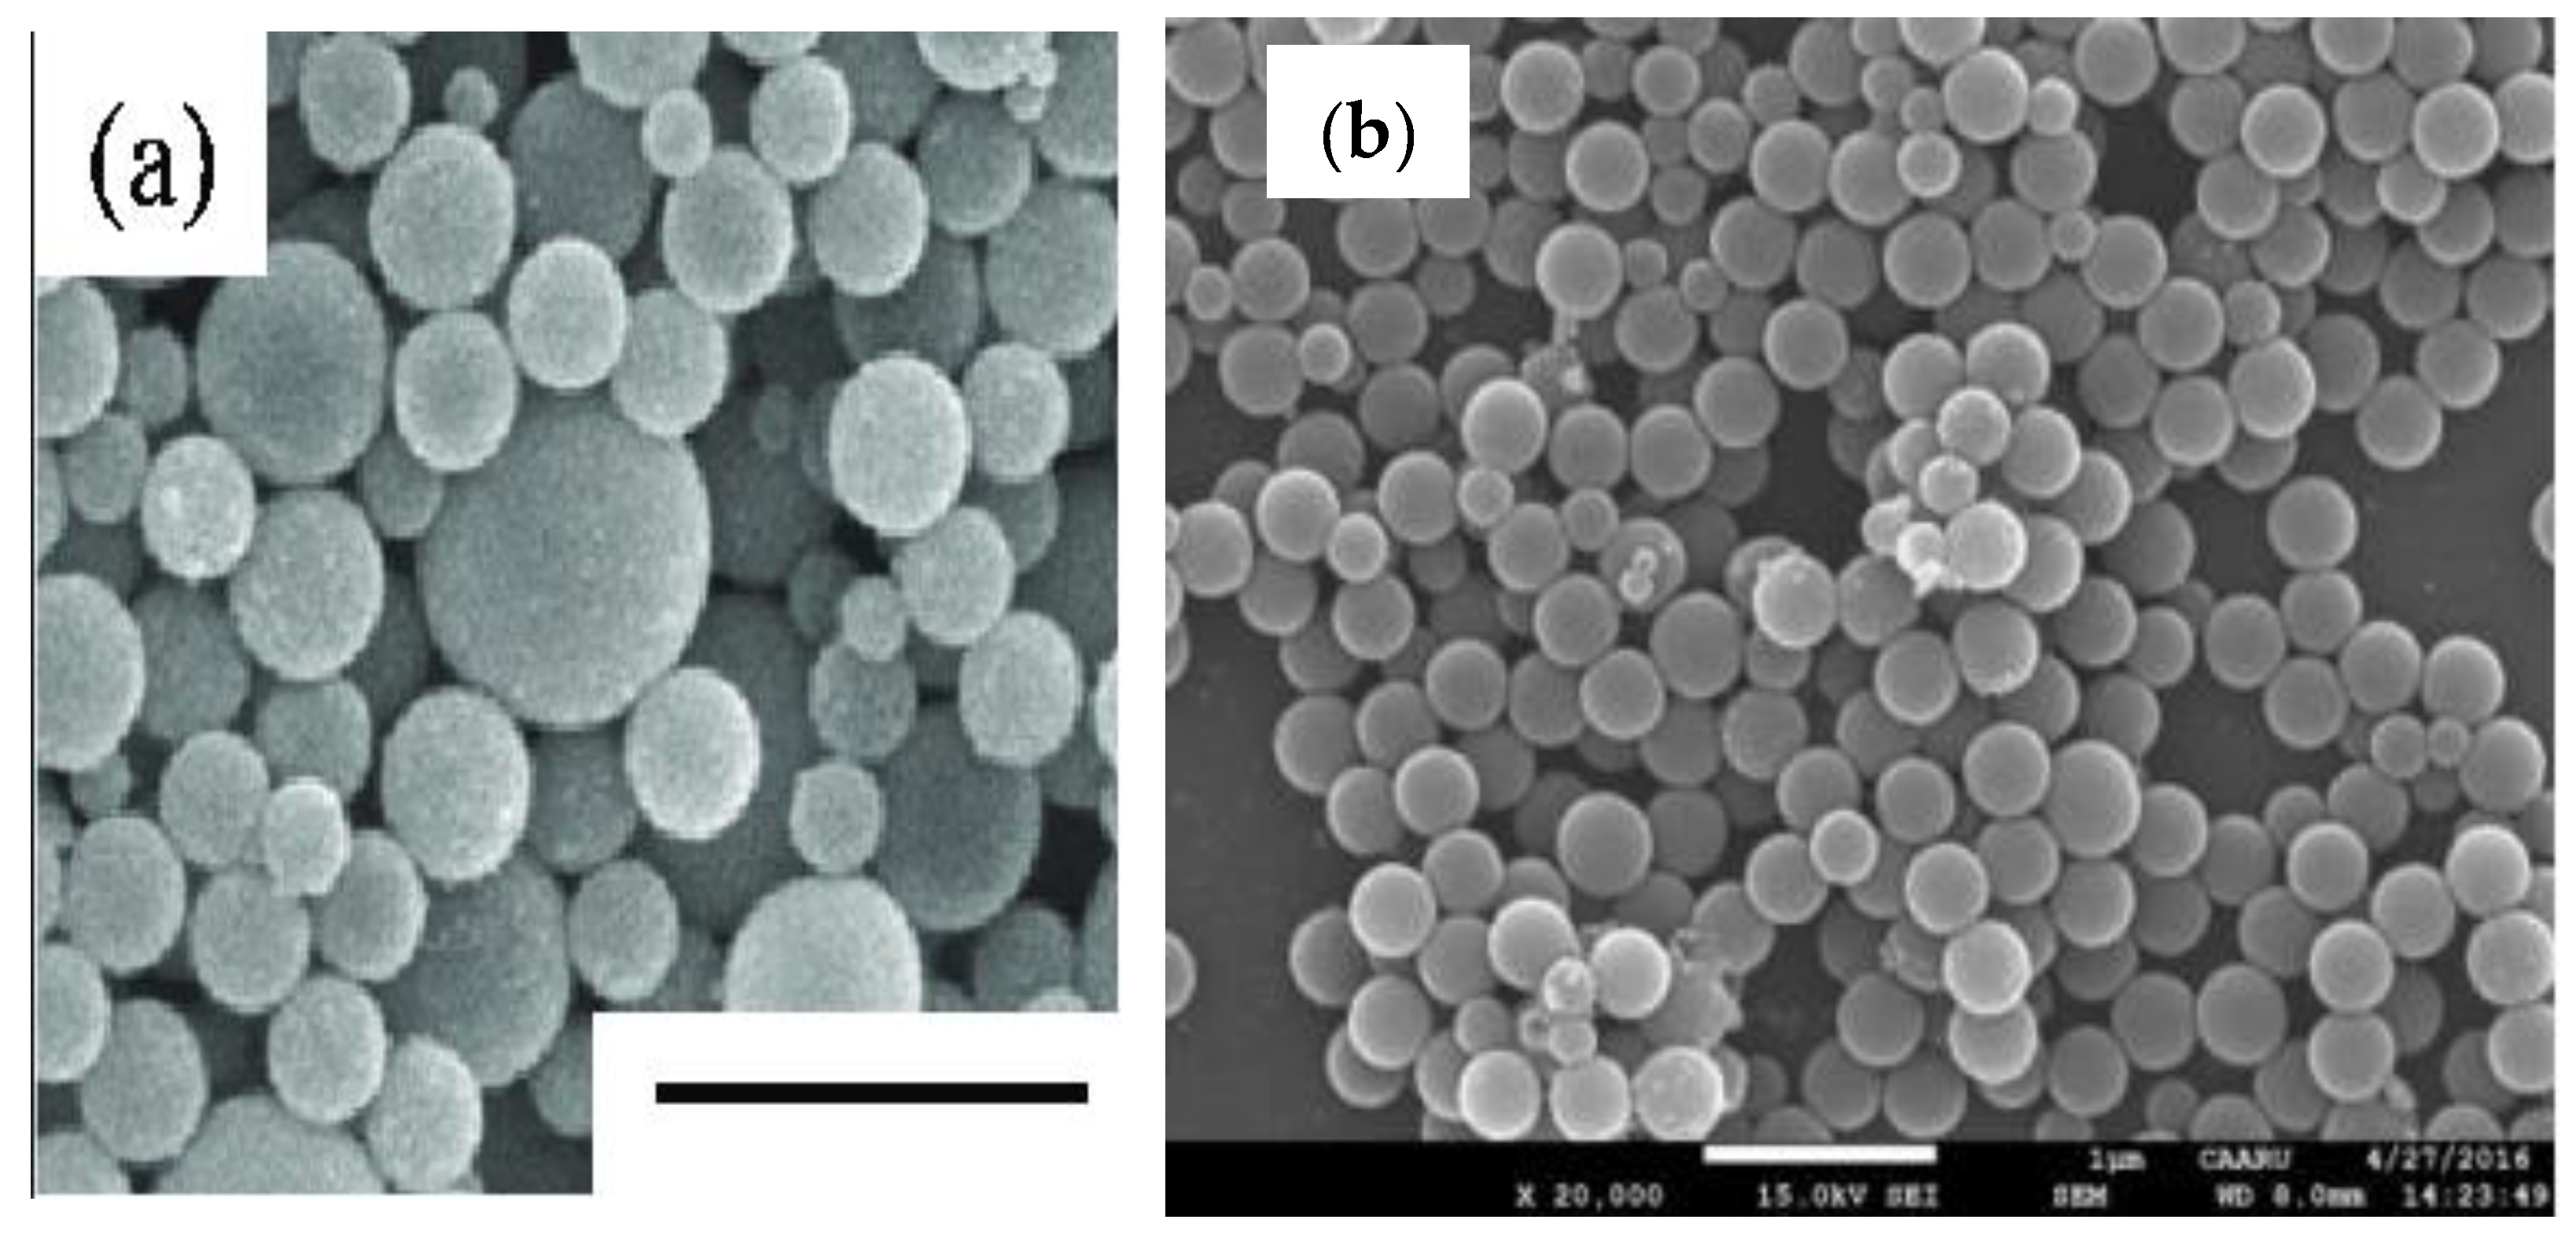
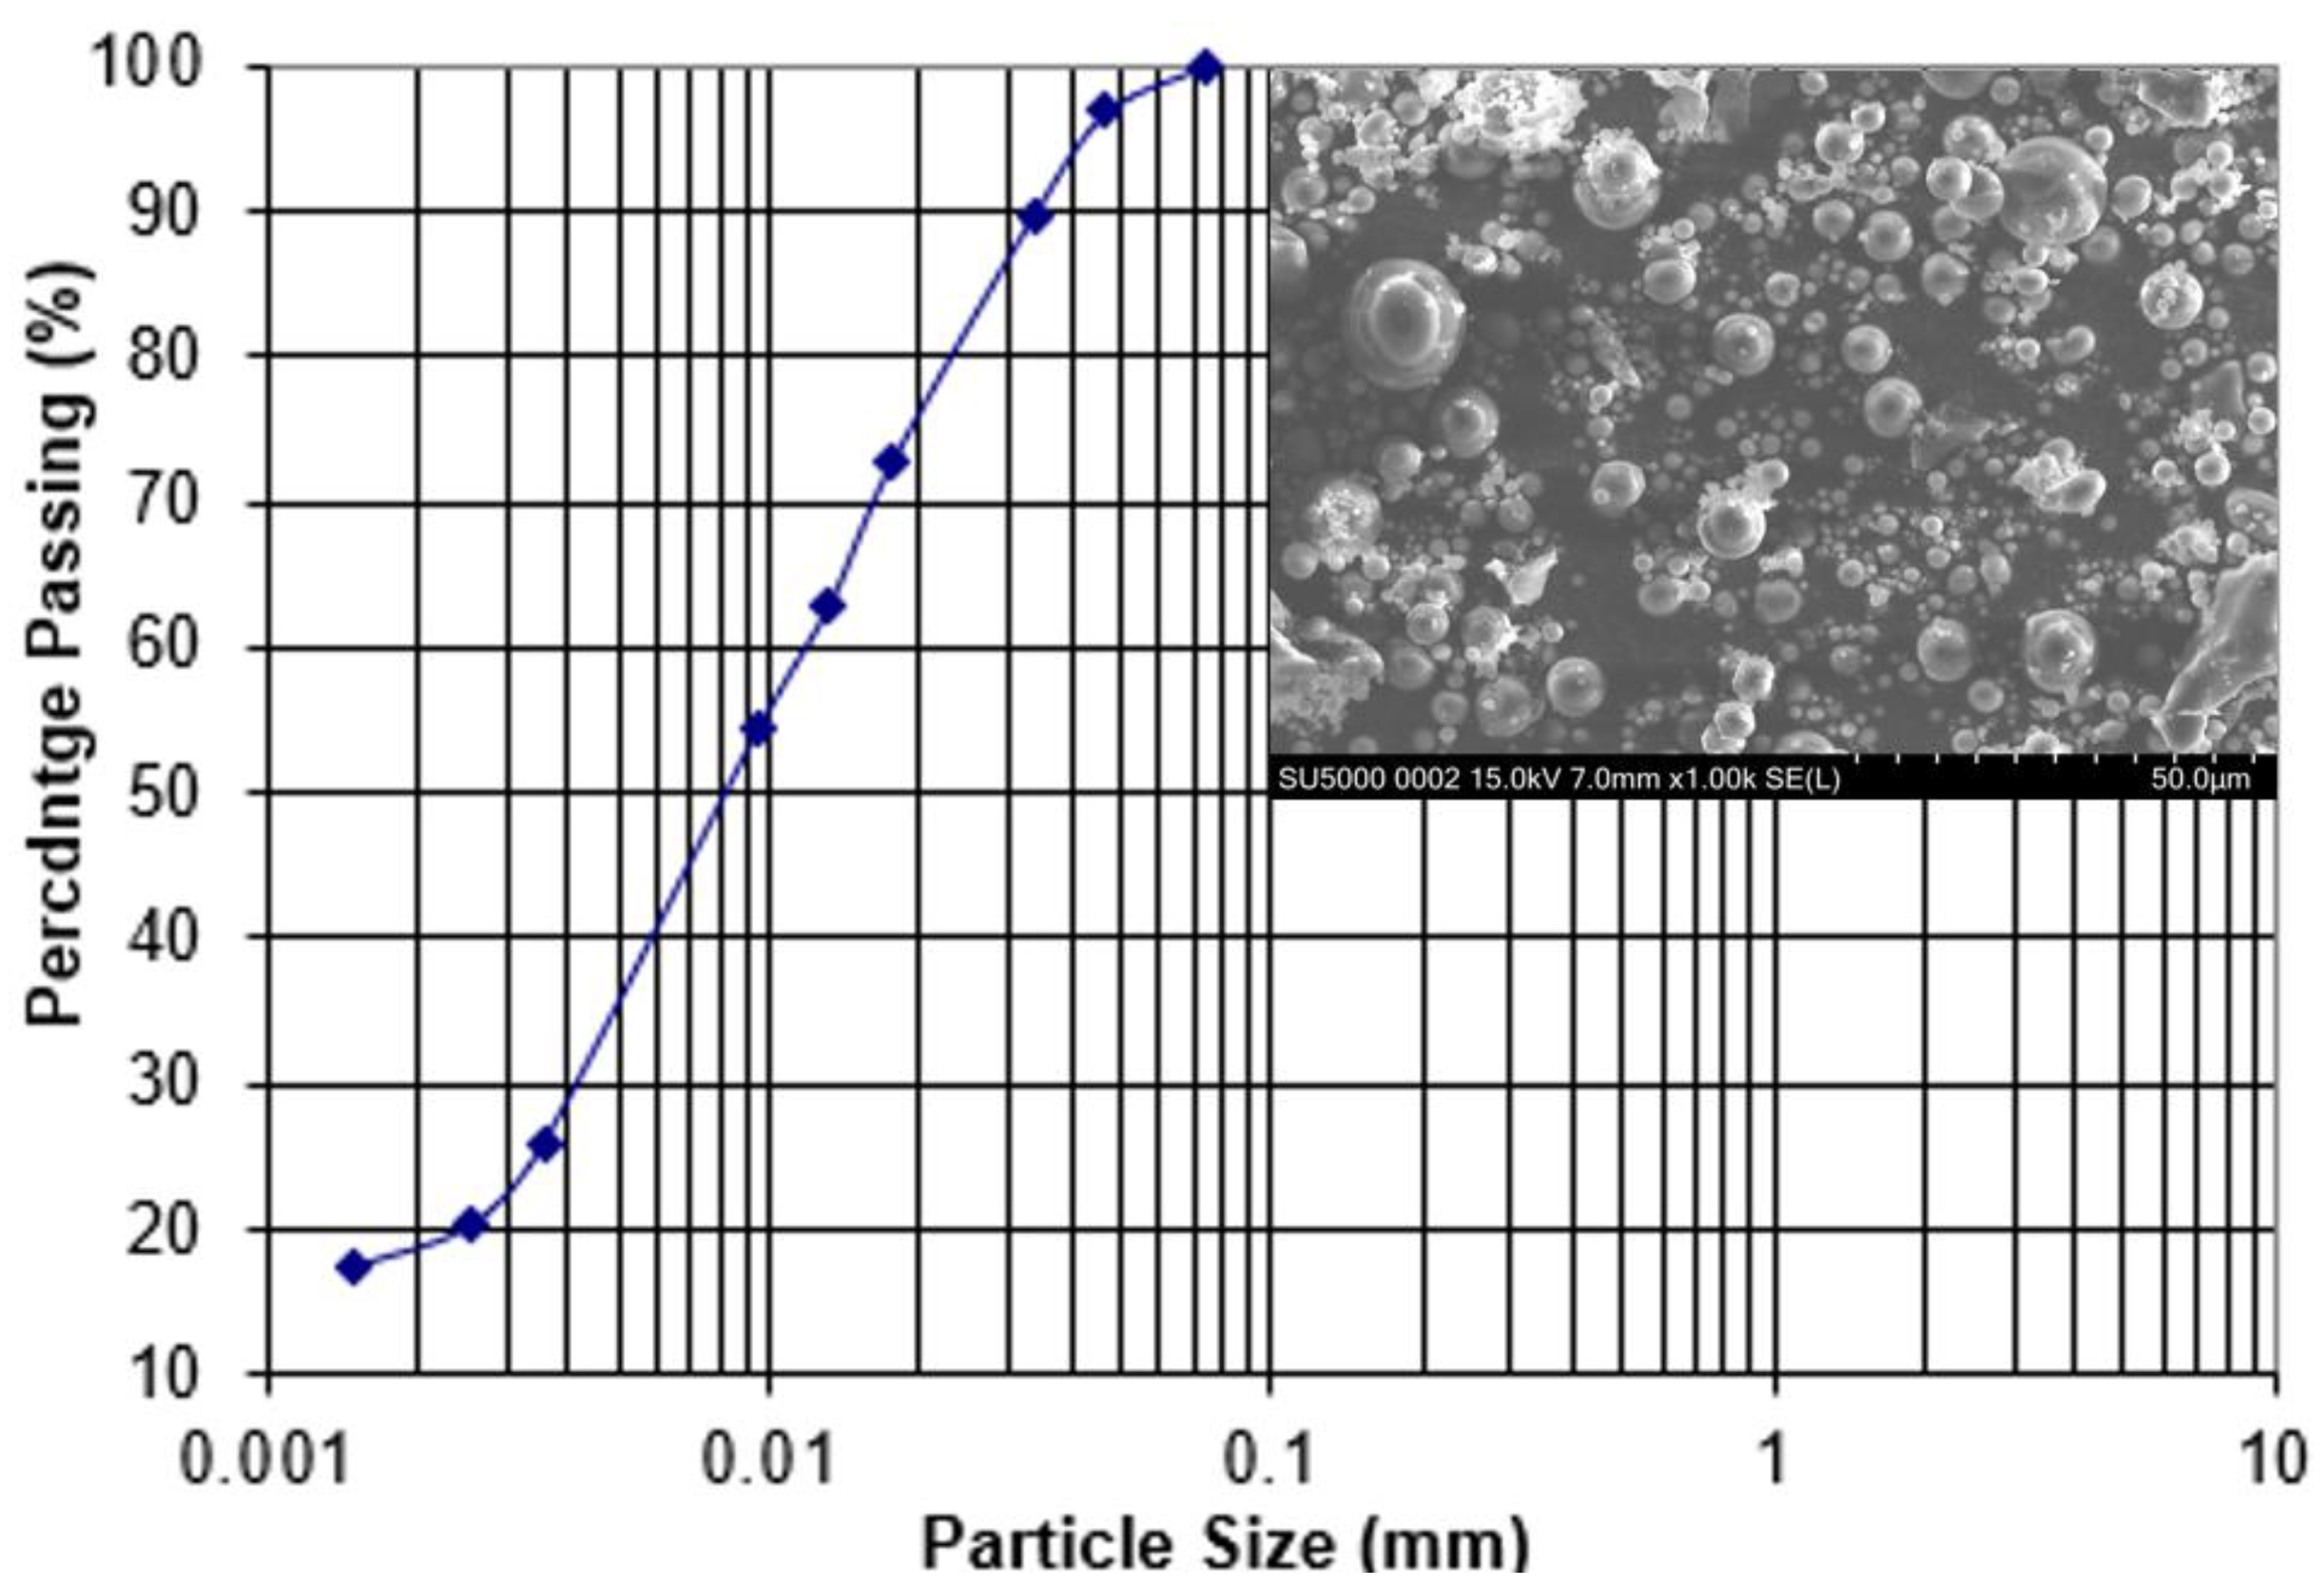
3.2. Characterisation of the Precursor

The fly ash used in this study has a Calcium Oxide content of less than 10%; hence, it is a Class F fly ash. 100% of the fly ash passed through the 75 µm sieve, and less than 4% was retained on the 45 µm sieve, as confirmed in Table 1. The result of the gradation was essential to ensure voids were reduced. Fine fly ash reduces voids, which helps to improve the density and, subsequently, the mechanical properties of the composite formed. Similar outcomes of the influence of the fly ash particle size on geopolymer composite are reported in previous studies [77,78]. The SEM high-resolution image and the particle size distribution are displayed in Figure 8.

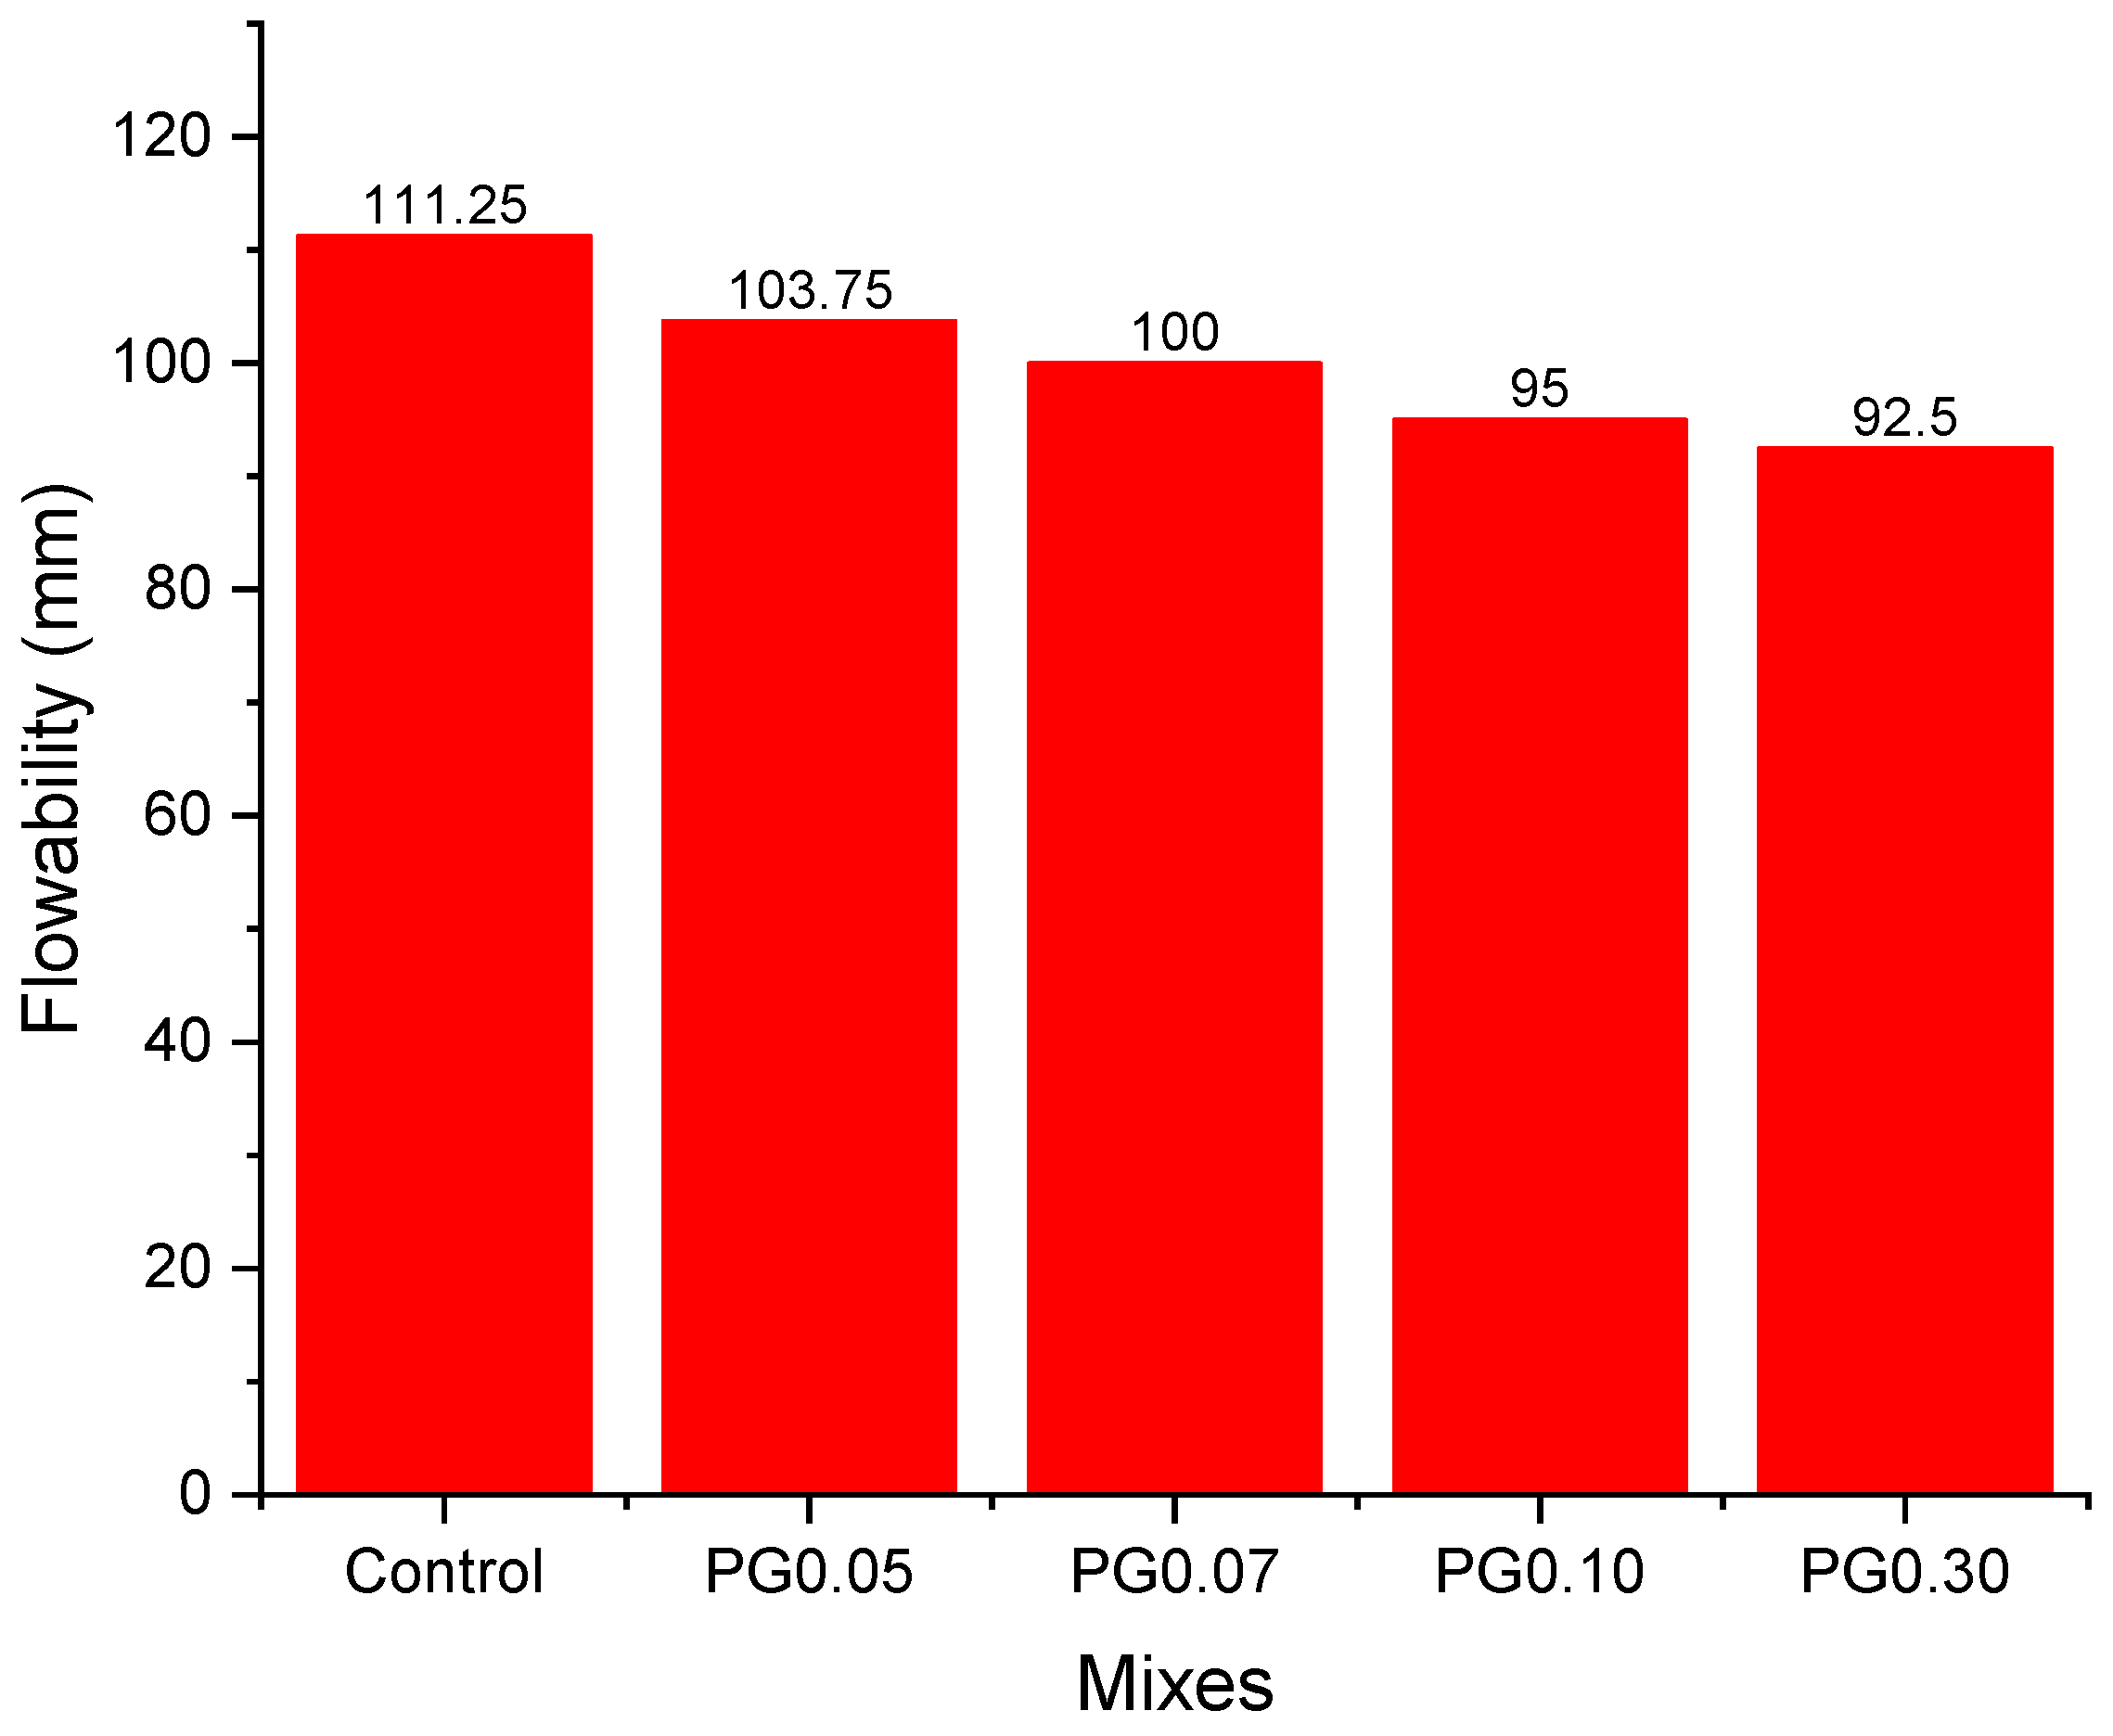
3.3. Effect of Pristine Graphene on the Flow of Pristine Graphene-Reinforced Geopolymer Mortar

The influence of the pristine graphene was felt on the flowability test conducted, shown in Figure 9. As the percentage of the PG increased, the flow of the composite reduced. The control mix had a flow of 111.25 mm. With the addition of 0.3% of PG, the flowability was reduced to 92.5 mm. The reduction in the flow compared to the control mix was 7%, 10%, 15%, and 17% at 0.05%, 0.07%, 0.1%, and 0.3% PG addition, respectively. The reduction in the flow was associated with the large surface area of the PG. The large area will require more water to wet the surface, reducing the water required in the mix for workability [25].
The result of this study is similar to that of [25] conducted with graphene oxide. However, the flow reduction of the GO-reinforced composite, compared to the control sample, was higher than that of the PG-reinforced geopolymer. The dispersion of graphene variants is an indicative factor in determining flow [42]. The better the dispersion, the lower the workability because more water will be attached to the graphene sheets for well-dispersed graphene. Since the GO variants are hydrophilic, the problems of dispersion are not prominent compared to the PG variants. Therefore, it is expected that even though the PG in the geopolymer mortar was well dispersed, its reduction of the mortar flow, less than 18%, may not be greater than that of the GO variant, which is evident when the result of this study was compared to that of [49] that had a flow reduction of 34.6% at the addition of 0.03% GO. Moreover, [25] also confirmed reductions in flow higher than that of this study when GO was used.
There are similarities between the results of this study and other nanomaterials that are not two-dimensional. The reduction in flow was acknowledged in previous studies of other nanoparticles [27,28,30,79]. However, some studies acknowledged an increase in the flow of geopolymer mortar upon the addition of nanosilica up to 2% [38] and 2.5% [32]. This increase was reported to be caused by the ball-bearing effect resulting from the spherical shape of the nanoparticle [32]. This is in contrast with the report of this study, as the nanoparticle (PG) used was irregular and led to a reduction in the flow of the mortar due to the reasons already discussed in the preceding paragraphs.
The reduction in flow experienced by the PG-reinforced geopolymer mortar ensured that the mix that gives the most improved mechanical properties remained workable and less stiff than those produced using other variants, such as graphene oxide [25,49,80].

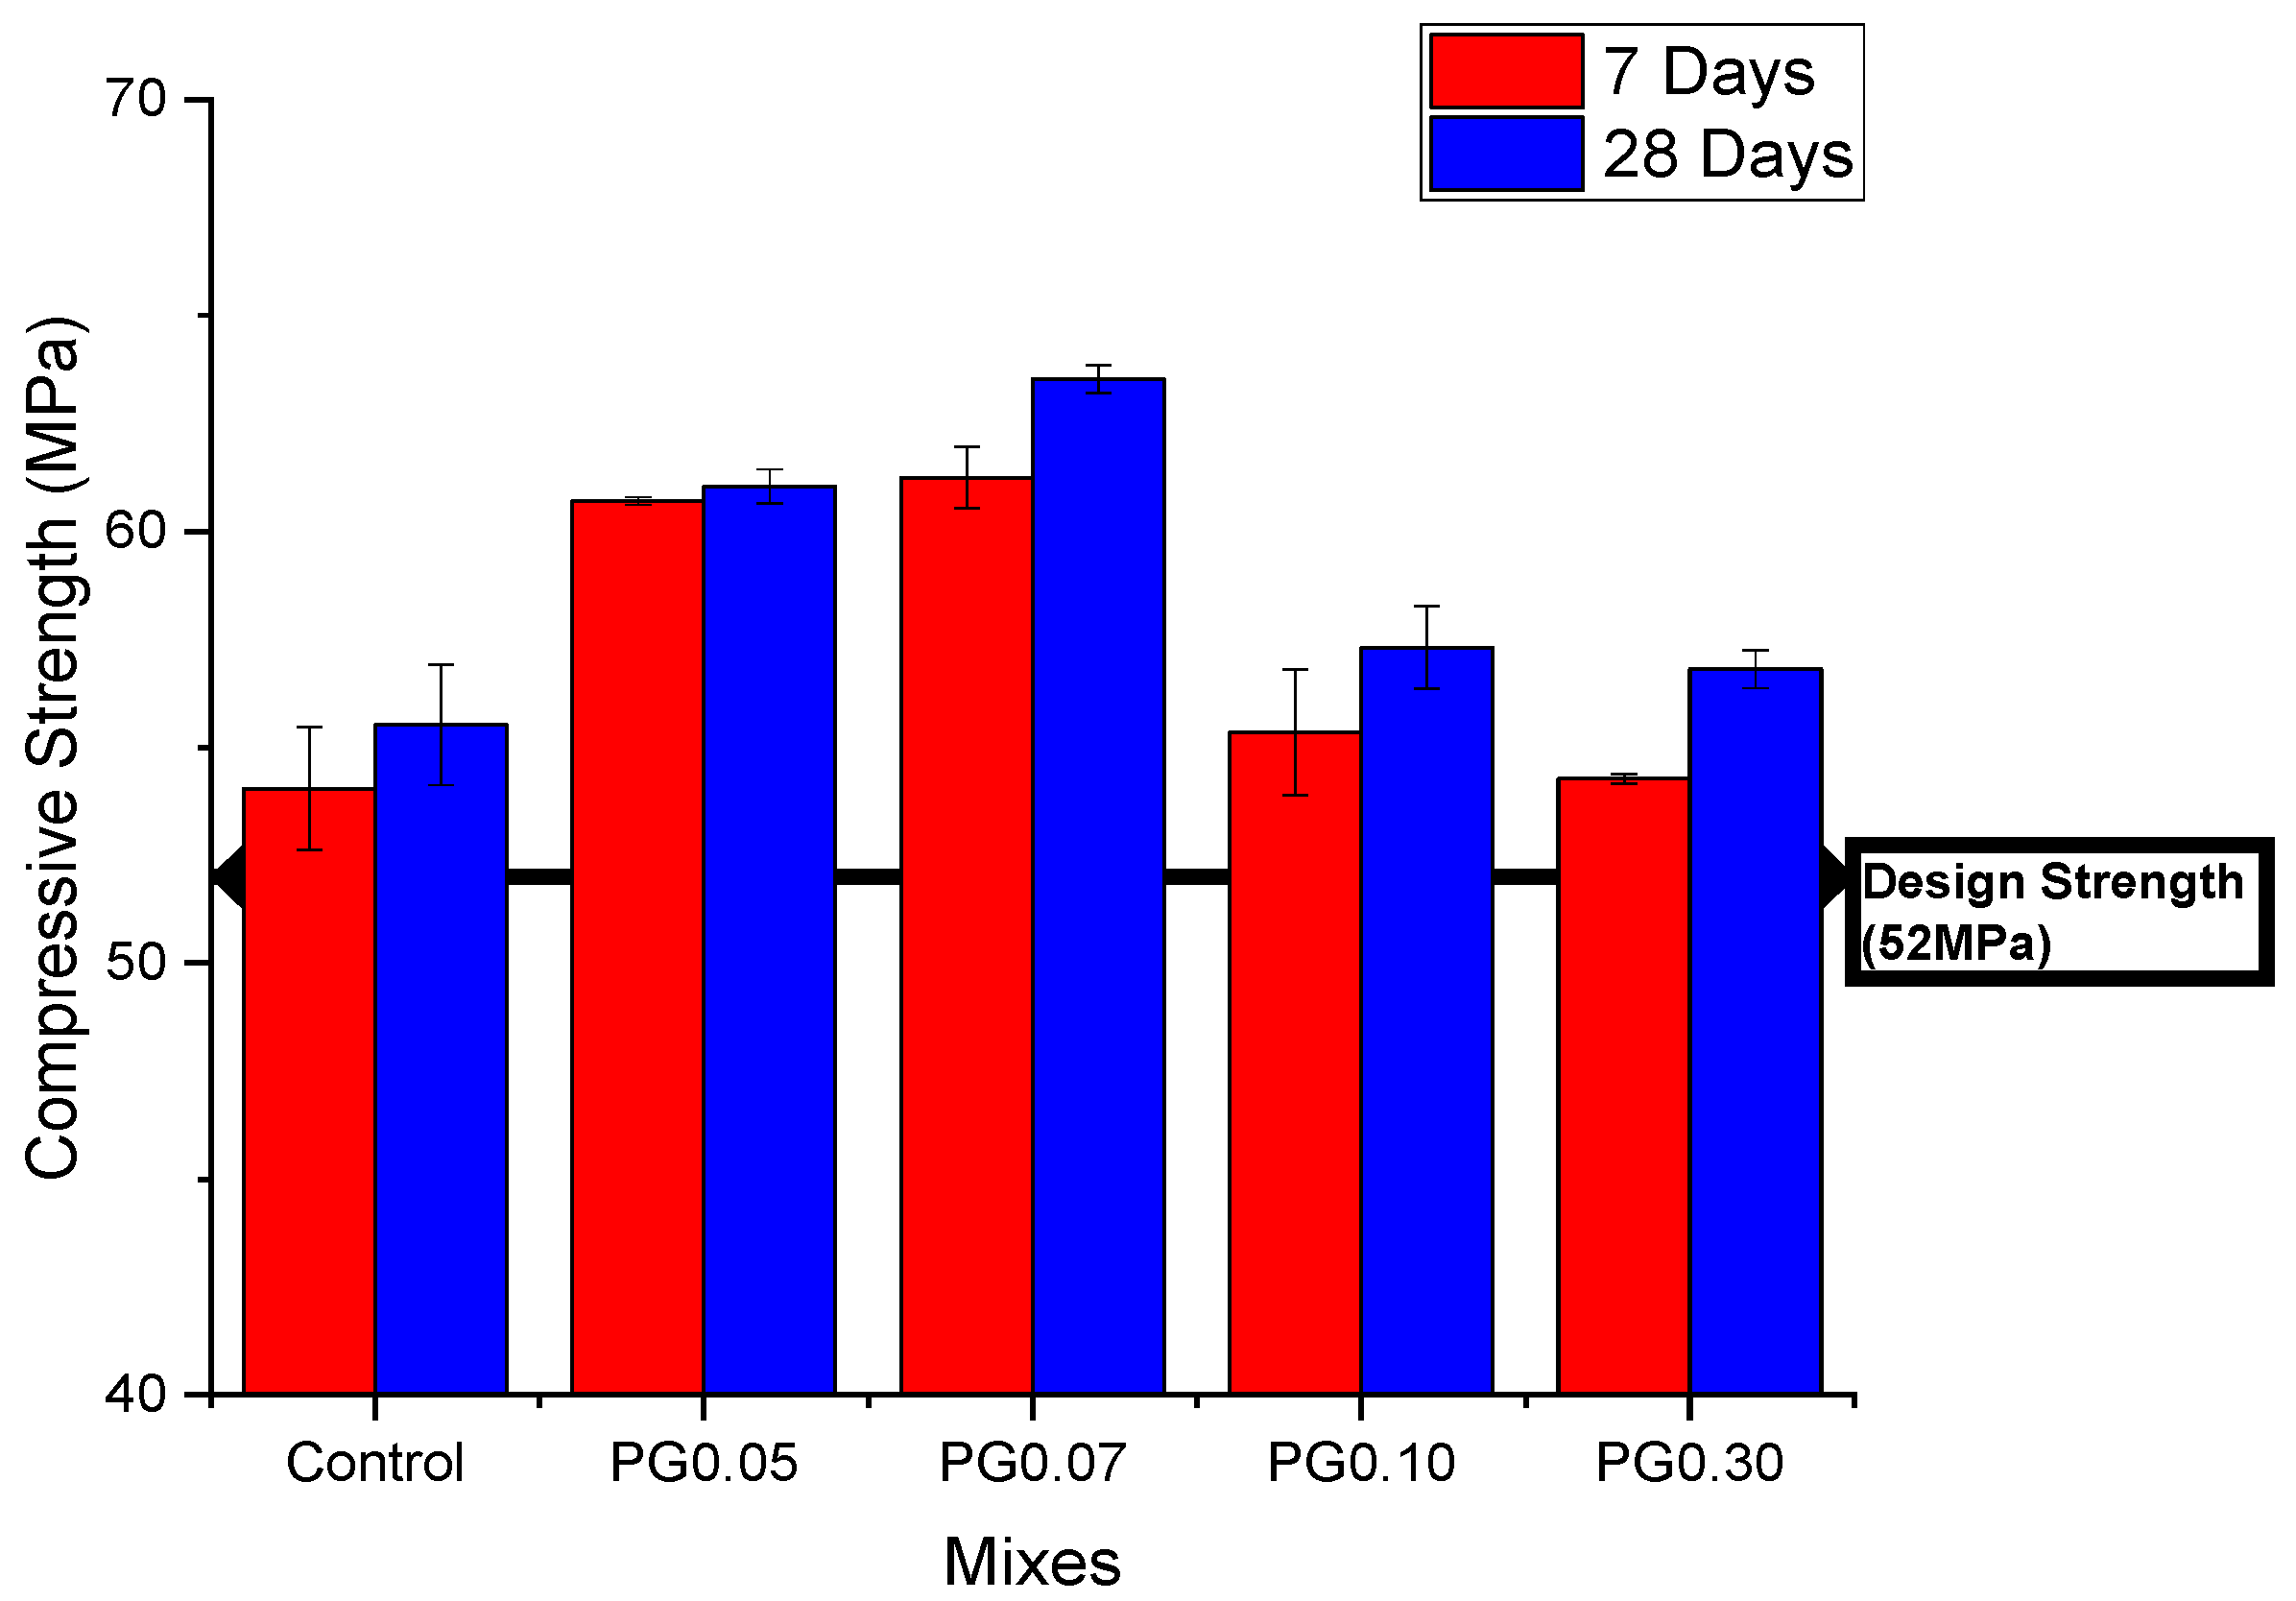
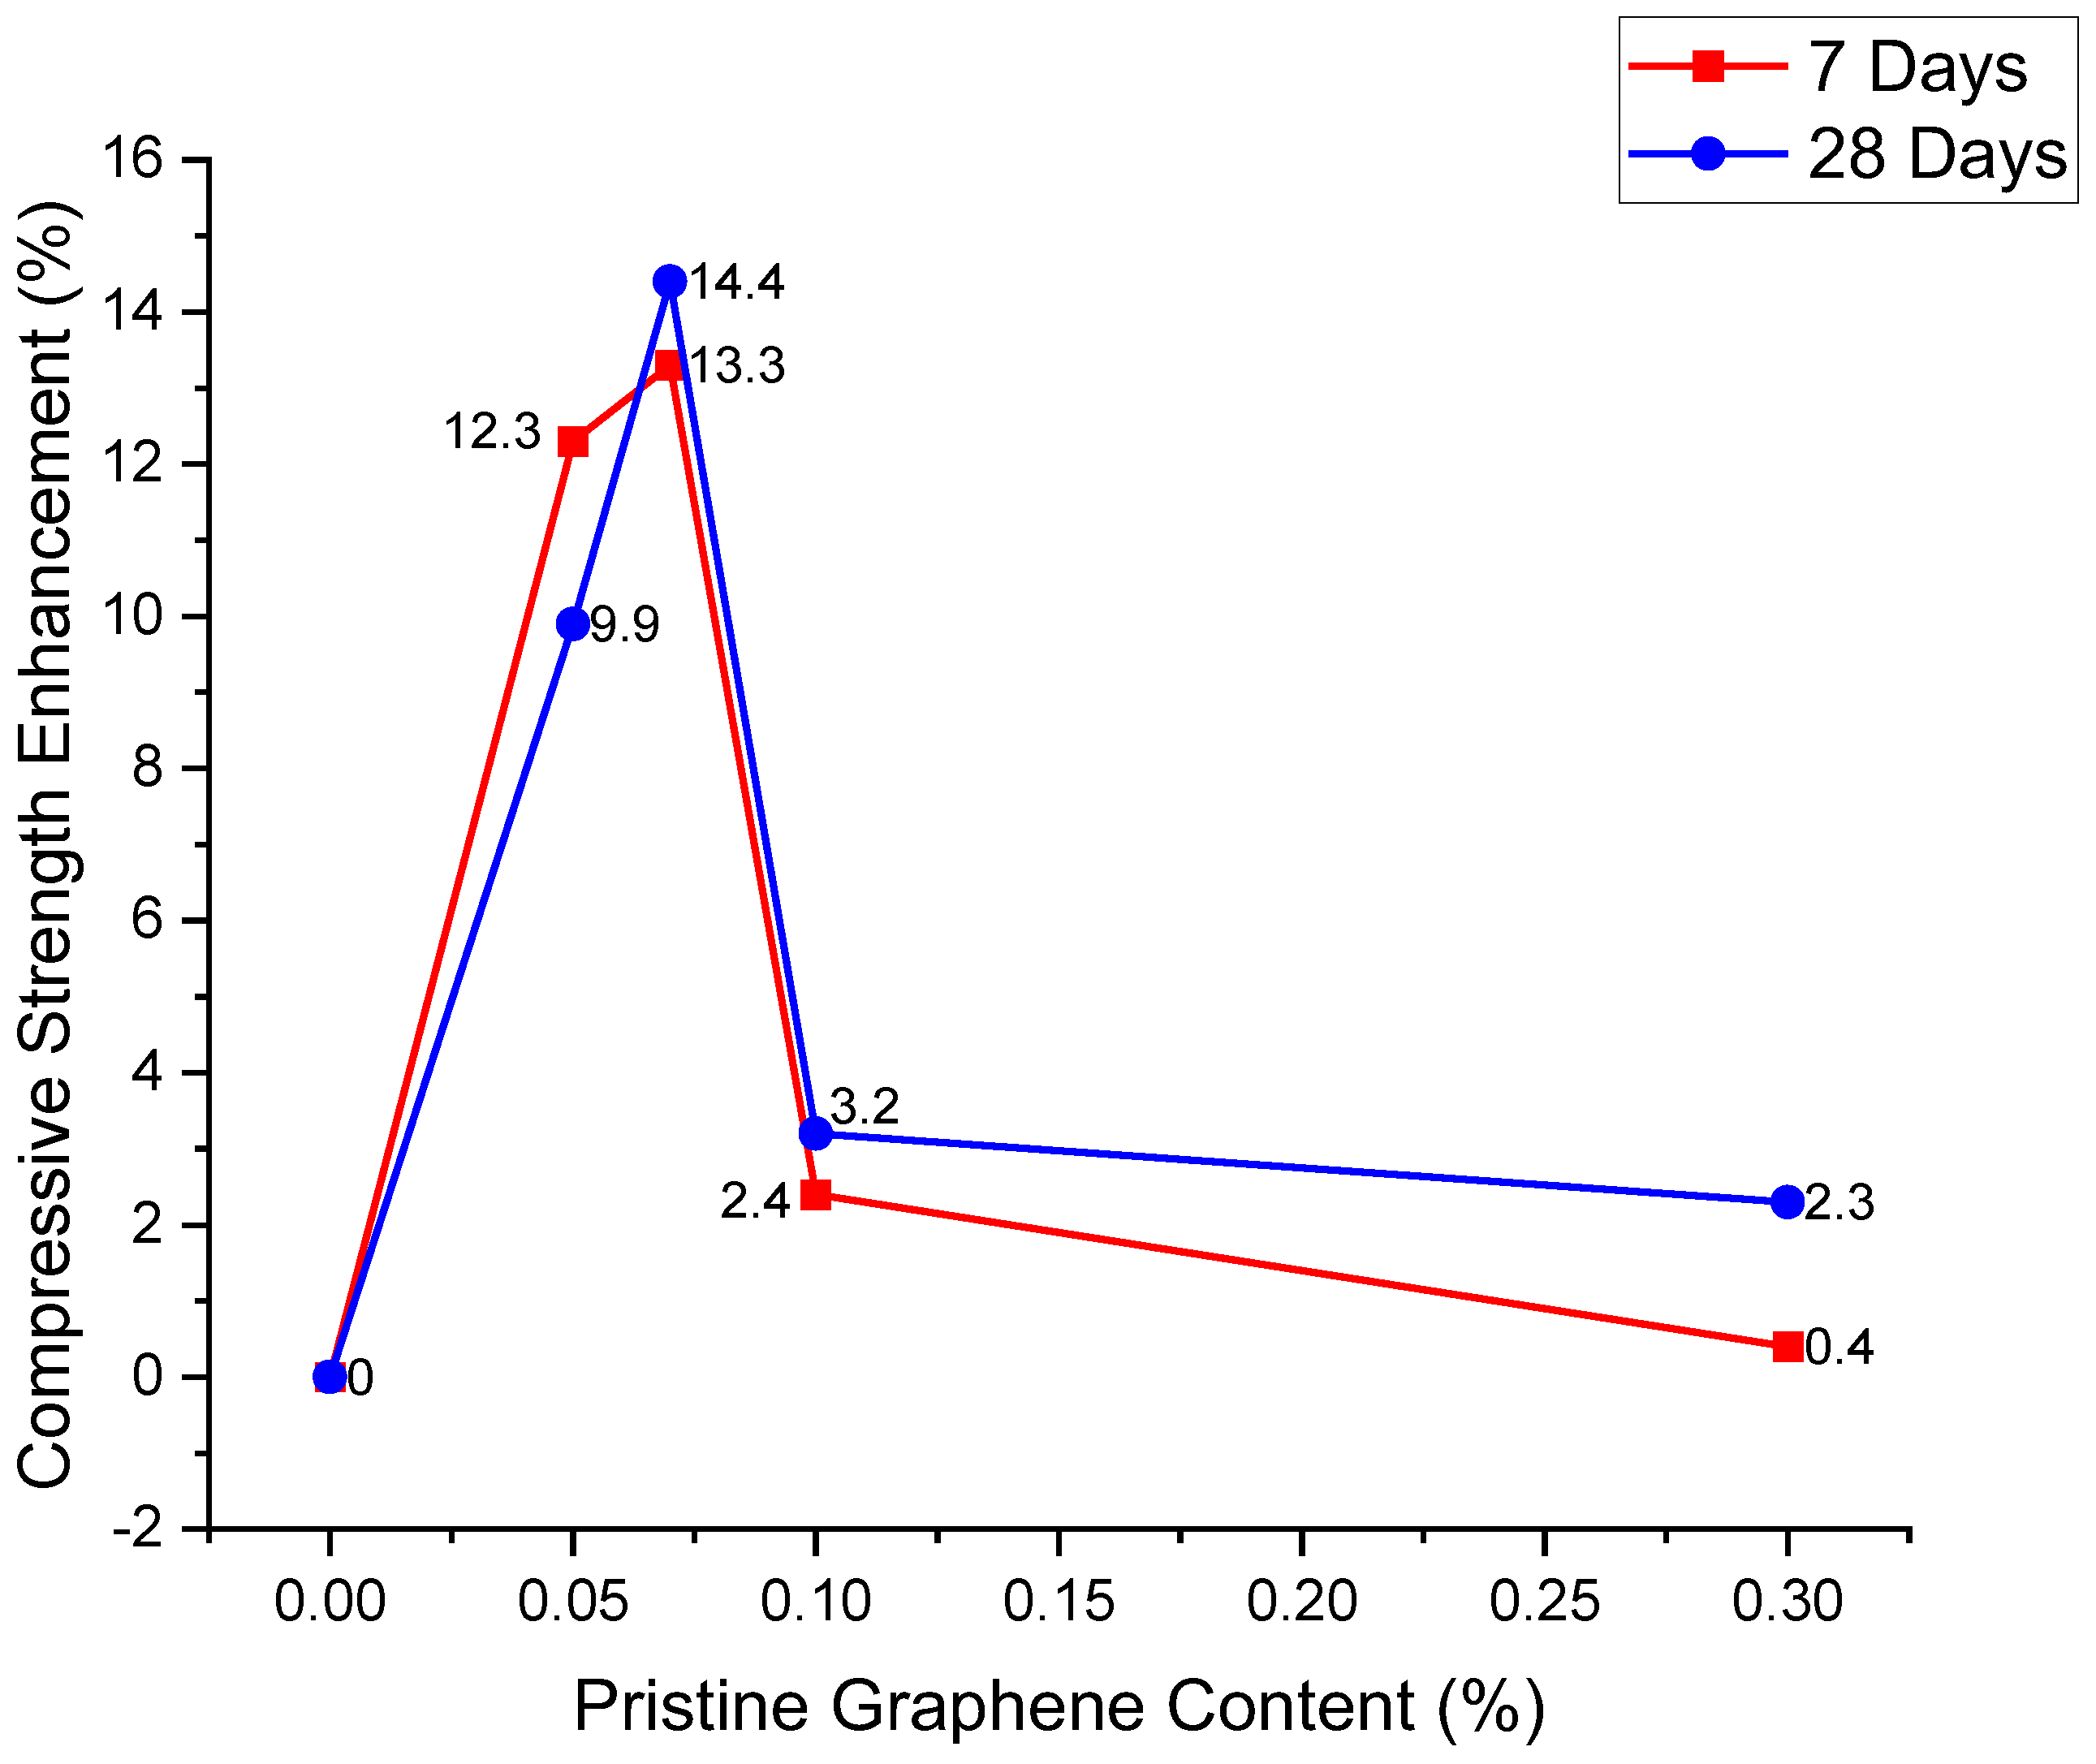
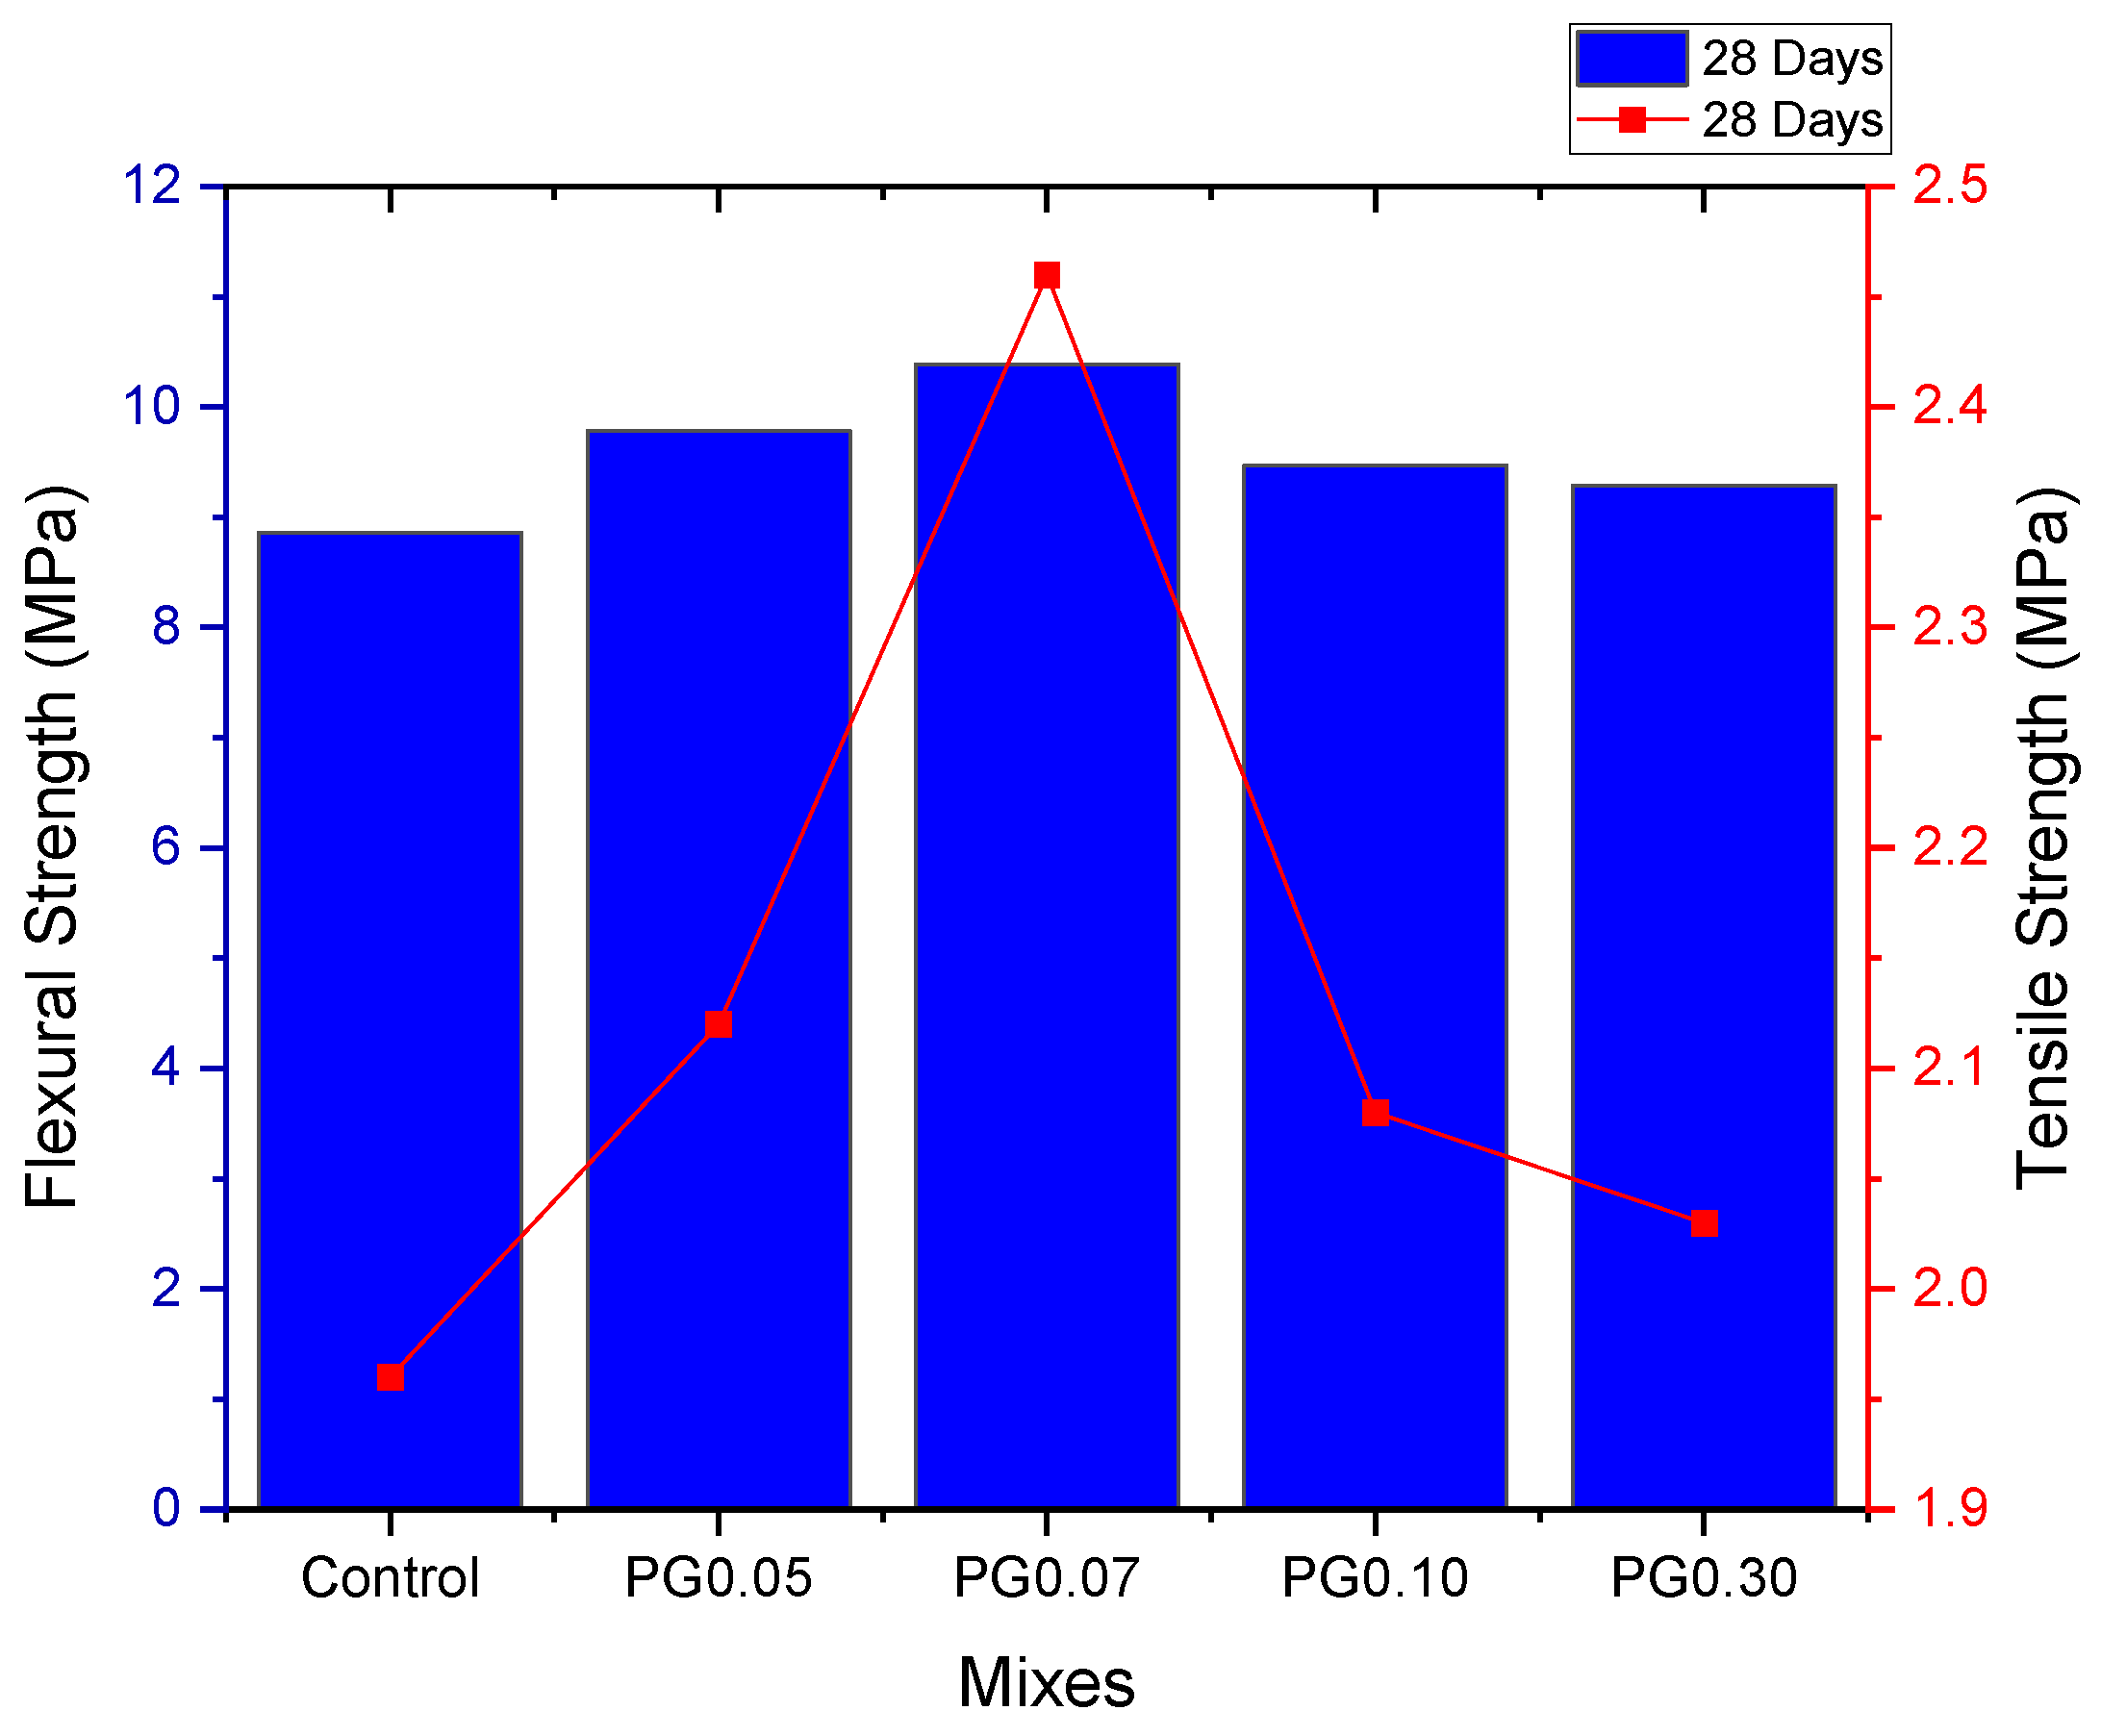
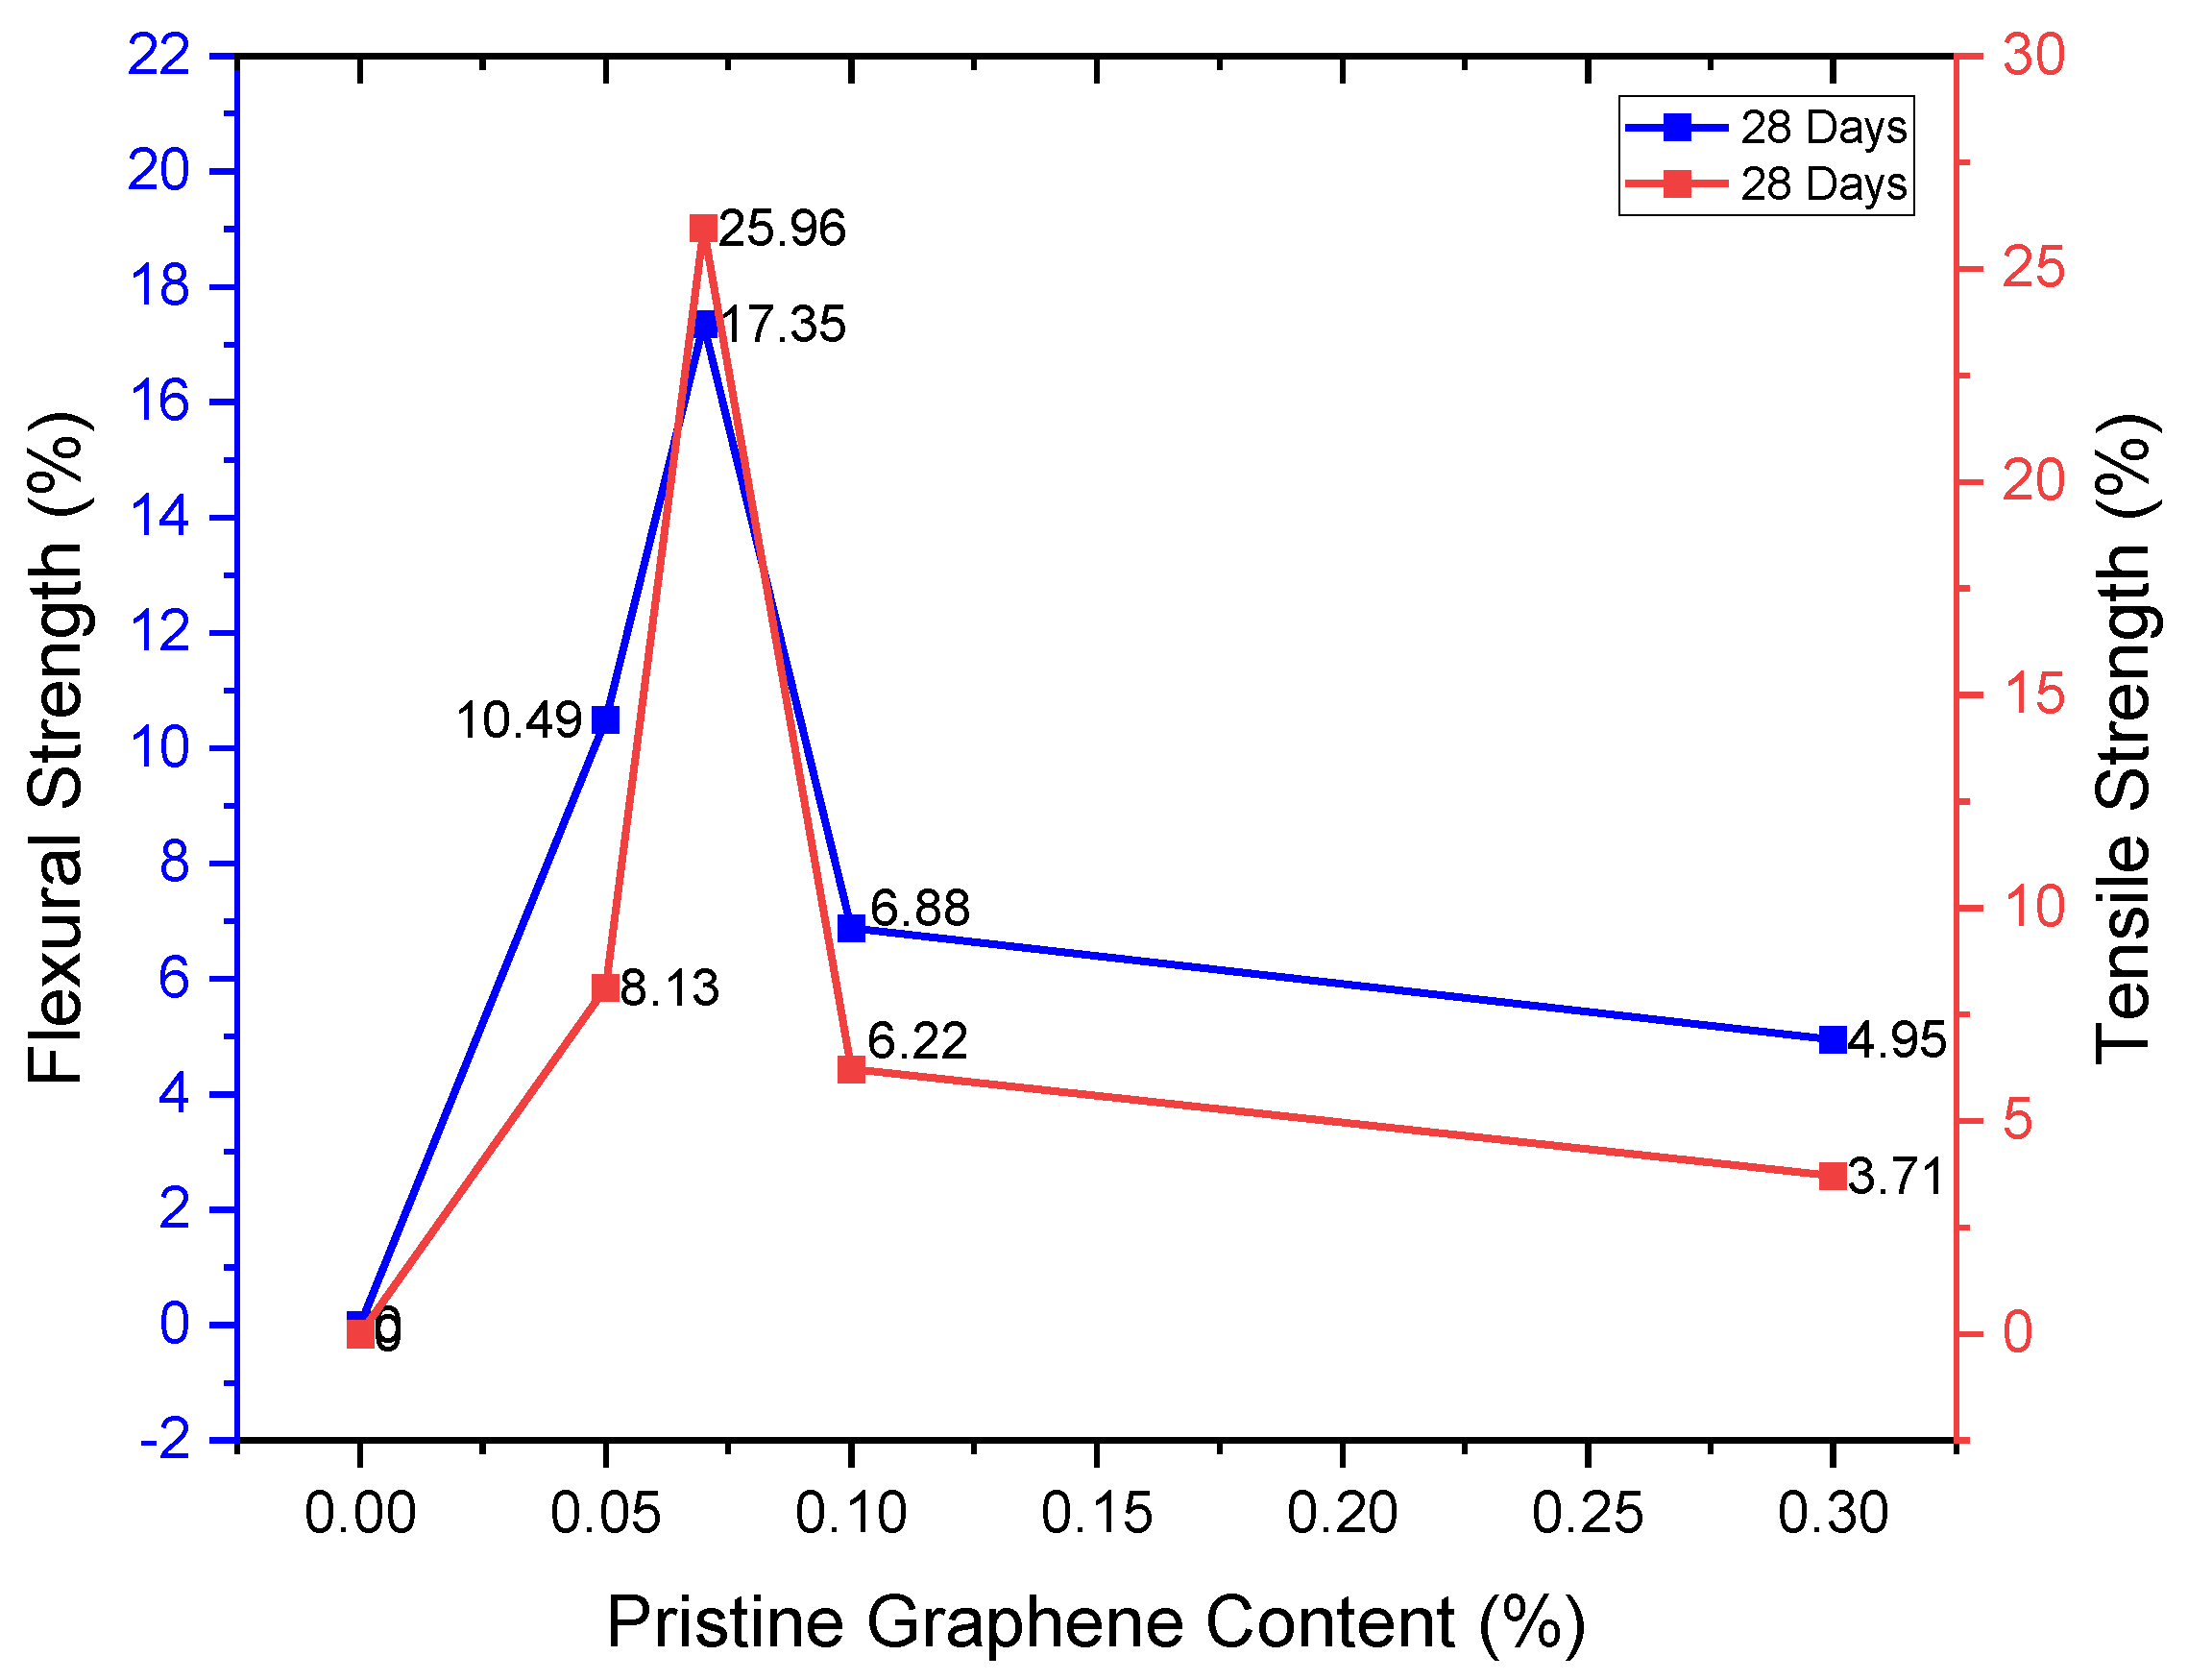
3.4. Effect of Pristine Graphene on the Mechanical Properties of Pristine Graphene-Reinforced Geopolymer Mortar

This study confirmed that PG influenced the mechanical properties of the geopolymer mortar up to a certain percentage of the precursor. The compressive strength result at the 7 and 28 days are displayed in Figure 10. The compressive strength of the geopolymer mortar increased progressively up to 0.07% PG addition which was the optimum for the compressive strength. At 0.07% PG addition, the compressive strength was 61.24 MPa and 63.53 MPa at the 7 and 28 days, respectively. After the 0.07% PG addition, there was a reduction in strength. However, the strengths did not get as low as the control. When the final dosage (0.30%) of PG was added, the compressive strength was 54.27 MPa and 56.81 MPa at 7 and 28 days, respectively. Meanwhile, the control’s compressive strength was 54.04 MPa at 7 days and 55.52 MPa at 28 days.
The compressive strength enhancement shows the percentage increase in strength with reference to the control (0% PG) geopolymer mortar. The strength enhancement is reported for the mortar with 0.05% PG addition to the mortar with the highest dosage (0.03%) of PG. At 7 days, the strength enhancement when 0.05% of PG was added was 12.3%. The highest strength enhancement was attained at 0.07% PG addition. At 0.07% PG addition, the strength enhancement was 13.3%. At 0.10% PG addition, the strength enhancement reduced to 2.4%; finally, the 0.03% PG addition had a strength enhancement of 0.4%. On the 28th day, the strength enhancement was 9.9%, 14.4%, 3.2%, and 2.3% for the PG dosages of 0.05%, 0.07%, 0.10%, and 0.30%, respectively. At the 7 and 28 days, 0.07% PG addition had the highest strength enhancement for compressive strength on the geopolymer mortar. The details of the strength enhancement for the compressive strength at 7 and 28 days are displayed in Figure 11.
Figure 12 and Figure 13 clearly depict the results of the direct tensile and flexural strengths of the mortar and their strength enhancement compared to the control at 28 days. In Figure 12, the bar graph indicates the flexural strength, while the line graph represents the tensile strength. Similar results of trends in compressive strength were observed in the tensile and flexural strengths. The tensile strength was highest at 0.07% PG addition. The tensile strength observed at 28 days for the control was 1.97 MPa, while that of the 0.07% PG addition was 2.46 MPa. The strength enhancement with reference to the control was 25.96% at 0.07% PG addition.
Moreover, after the 0.07% addition, the tensile strength declined. For the flexural strength, the strength increased from 8.86 MPa to 10.39 MPa and later declined to 9.29 MPa at the addition of 0.3% PG. The optimum flexural strength was also obtained at 0.07% PG addition for the flexural strength. The strength enhancement compared to the control was 17.35%.
The mechanical strength was observed to be optimum at adding 0.07% of PG for the compressive, flexural, and tensile strengths. Compared to previous studies, compressive strength enhancement of zero-dimensional nanoparticles at an addition of 1.5% nanosilica was 11% at 28 days [32], which is lower than the enhancement for this study. In another study where nanosilica was used, a maximum strength enhancement of 23.3% was reported at 28 days for the 5% addition of nanosilica [26,81]. At lower dosages, the strength enhancement of the nanosilica in the composite was lesser than those reported in this study. The highest strength enhancement reported by this study can be considered highly beneficial compared to previous studies that used nanosilica because the dosage (0.07%) is much lower than the nanosilica dosages ranging between 1.5 to 5% [28,32,81] that gave the maximum strength enhancement. The enhancement in geopolymer mortar with nanosilica can be linked to the acceleration of the geopolymerization reaction creating a stronger binder.
Considering one-dimensional nanomaterials, the carbon nanotubes had a maximum strength enhancement of 13.6% at 5% dosage in geopolymer at 28 days [34]. Another study confirmed a tremendous 81% compressive strength increase at 0.02% addition of carbon nanotubes [26,39]. The tremendous increase was linked to the alkaline liquid’s influence in dispersing the nanoparticle. The sodium hydroxide helps in producing a well-dispersed carbon nanotube within the composite [26,35,39]. There is the possibility that the sodium hydroxide content limited the strength enhancement of this study since the PG experiences agglomeration in the alkaline activator. A previous study reported this possibility [82]. Therefore, seeking ways to ensure proper interaction of the PG solution and the alkali activator will benefit the PG-reinforced geopolymer composite.
The mechanical property improvement of the mortar with PG compared to the control can be linked to the bridging and branching of cracks initiated by PG in the matrix. When geopolymer composite is under loading, the cracks are initiated at the nanoscale and continue to expand till it fails. With the addition of PG, as the cracks are initiated at the nanoscale, they widen and hit the graphene sheets. The strength of the PG bridges and blocks the cracks because of its properties. The effect of the PG adequately dispersed in the matrix resulted in the bridging and blocking effect responsible for the improved properties of the geopolymer mortar. The result is in line with [43] ‘s findings on the effect of graphene on the geopolymer composite. However, the decrease in strengths observed with PG addition greater than 0.07% can be linked to the PG agglomeration and the overlapping of the PG sheets. The stacking of PG sheets results from the van der Waal forces causing a thickness that will produce a weak interconnection and interfacial friction between the geopolymer and the PG [40].
Furthermore, physical observation of the cubes after curing, as shown in Figure 14 for the control and PG0.07 cubes, revealed visible cracks on the control sample, while cracks were limited for the PG0.07 cubes. This observation evidently reinforces the possibility of the PG to enhance stress distribution and impede the spread of cracks resulting from the nanoscale [40,83,84]. Moreover, there is the possibility of an underplay resulting in the increased geopolymerization reaction and, subsequently, the mechanical properties of the composite as a result of the PG addition. Therefore, a future direction is necessary to determine the chemical interaction between the PG and the geopolymer composite since it is evident in the cement mortar that an improved bonding gel is caused by the interfacial friction and the interconnection between the cement gels’ hydration product, formed from a portion of the covalent bonds between some COOH groups in PG and cement gels [40].
In contrast to this study, ref. [21] observed the agglomeration at graphene addition greater than 1% using GNPs, depicting a difference between the GNPs and PG. Moreover, the reduction in strength observed in PG addition greater than 0.07% in this study can be linked to the increase in PG content in a constant mass of water. Finding a way of carefully increasing the water in the mix used for dispersion may result in a tremendous outcome for the PG addition beyond 0.07%. Furthermore, using a probe sonicator could offer a greater advantage of reduced sonication time and a more stable PG suspension, resulting in a greater strength enhancement than those reported in this study.
Even though the reaction in geopolymer composite is different from that in cement mortar, the PG addition was seen to be optimum at 0.07% addition, as confirmed by [40]. However, the strength enhancement of the cement-based composite was seen to be more than that of the geopolymer composite. Nonetheless, the gain that geopolymer composite has to offer to achieve the goal of sustainability by significantly contributing to the achievement of carbon emission reduction makes it outstand the cementitious alternative.

3.5. Test of Hypothesis to Evaluate the Benefit of the Different Dosages of the PG on the Geopolymer Mortar

For the compressive strength at 7 and 28 days, the result of the ANOVA tests using the Dunnett method is shown in Table 6. To test for normality of the data, the Shapiro–Wilk test, 0.074 for 7 days and 0.640 for 28 days (p > 0.05), coupled with the observation of the histogram, Q-Q plots, and box plots showed that the data for the compressive strengths could be considered to be normally distributed. The data had a skewness of 0.088 (SE = 0.580) and kurtosis of −1.701 (SE = 1.121) for the 7th day’s tests, while the data for the 28 days had a skewness of 0.174 (SE = 0.580) and kurtosis of −1.145 (SE = 1.121). These results confirmed the normality of this data before they were subjected to ANOVA tests. ANOVA was performed with a significance of 0.05 to determine if a significant difference truly exists between the mixes with various PG addition and the control. Overall, at both the 7 and 28 days, the results were statistically significant. In comparing the various levels with the control, it was evident, as shown in Table 6, that only PG0.05 and PG0.07 significantly improved the compressive strength of the mortar. When compared to PG0.1 and PG0.3, only PG0.05 and PG0.07 had (p-values < 0.05).
For the flexural and tensile strengths at 28 days, the results of the tensile strength failed the test for normality; hence, the Kruskal–Wallis test was conducted while the ANOVA test was done for the flexural strength. Table 7 presents the Kruskal–Wallis test results for the tensile strength and the ANOVA test results for the flexural strength at 28 days. To test for normality of the flexural strength’s data, the Shapiro–Wilk test, 0.256 (p > 0.05), coupled with the observation of the histogram, Q-Q plots, and box plots showed that the data for the flexural strengths could be considered to be normally distributed. The data had a skewness of 0.651 (SE = 0.580) and kurtosis of −0.445 (SE = 1.121). For the tensile strength results, the Shapiro–Wilk test was 0.007 (p < 0.05); hence the data were considered not normally distributed. ANOVA was performed with a significance of 0.05 to determine if a significant difference truly exists between the mixes with various PG addition and the control.
Overall, the results were statistically significant. In multiple comparisons of the various levels with the control, it was evident that only the PG0.3 showed no significant improvement in the flexural strength of the mortar because it had a p-value greater than 0.05. For the Kruskal–Wallis test conducted on the tensile strength results, a significant improvement in the PG0.05 and PG0.07 was observed because they had p-values less than 0.05 when compared to the control after a pairwise comparison for a non-parametric test was conducted.
From the analysis conducted, it can be affirmed from the results obtained for the compressive strength at the 7 and 28 days and tensile and flexural strengths at the 28 days that the geopolymer mortar’s strength improvement depended strongly on the addition of PG. However, it was unclear for the PG0.1 and PG0.3 if the change resulted from the PG addition or not based on the ANOVA and Kruskal–Wallis tests conducted.

4. Conclusions

The influence of pristine graphene dispersion and dosages on the geopolymer mortar’s mechanical properties has been determined in this study. Based on the various analyses conducted to underpin the results that were discussed in this study, the following conclusions were made:
  • The dispersion of PG by ultrasonication in an aqueous solution with polycarboxylate ether superplasticiser as the surfactant was best fit for dispersion of PG, and the PG content of less than 5% of the aqueous solution resulted in good dispersion.
  • The use of a large-size PG (50 µm) that was industrially manufactured was proven, for the first time, to be effective in improving the mechanical properties of the geopolymer mortar.
  • Adding PG to the geopolymer mortar improved the compressive strength at 7 and 28 days and the tensile and flexural strengths at 28 days. This improvement was linked to the effect of the PG in reinforcing the mortar to prevent cracks.
  • The PG content was found to significantly improve the mechanical properties of the geopolymer mortar up to 0.07% PG addition. This addition was the optimum for this application as it improves the compressive, flexural, and tensile strengths by 14.4%, 17.35%, and 25.96% at 28 days, respectively.
  • The inference drawn by conducting ANOVA and Kruskal–Wallis tests revealed that the improvement of the mechanical properties could be linked to the addition of PG up to 0.07% of the precursor.
This study has successfully provided a direction for applying industrially manufactured large-size pristine graphene in geopolymer composite. The findings of this study will serve as a basis for future improvement in the use of PG in geopolymer composites to ensure other properties, such as the durability of the composite, are ascertained for various construction applications.

5. Recommendation for Further Research

The geopolymer composite is a sustainable construction material, and every effort should ensure its diverse application. Based on the findings of this study, the following areas are recommended for further study:
  • Future studies should consider the morphology and characterisation of the PG-reinforced GC to ascertain the interaction between the geopolymer matrix and the pristine graphene.
  • The effect of the various PG sizes on the strength improvement of the geopolymer composite should be presented to clarify and underpin other underplaying factors responsible for the property improvement of geopolymer composite.
  • The cost implication of using pristine graphene in the geopolymer composite should be considered to seek opportunities to commercialise the product.
  • There is a potential for improved strength development if ways can be devised to increase the water content in the PG-reinforced geopolymer composite for PG contents greater than 0.07%.

Author Contributions

Conceptualisation, O.A., C.K., R.M., and O.E.; methodology, O.A., C.K., R.M., and O.E.; formal analysis, O.A., and O.E.; writing—original draft preparation, O.A.; writing—review and editing, C.K., R.M., and O.E.; supervision, C.K., R.M., and O.E. All authors have read and agreed to the published version of the manuscript.

Funding

This research was funded by the African Union through the Pan African University Institute for Basic Sciences, Technology and Innovation (PAUSTI) and the University of Manchester GCRF-QR Funds.

Institutional Review Board Statement

Not applicable.

Informed Consent Statement

Not applicable.

Data Availability Statement

Not applicable.

Acknowledgments

The authors acknowledge First Graphene (UK) Ltd. for supporting the research with the pristine graphene used in this study. We also thank Master Builders Solutions (Kenya) Ltd. for providing the superplasticiser. During the research, the technical support given by Michael Watson of First Graphene and the Jomo Kenyatta University of Agriculture and Technology (JKUAT) is also duly acknowledged.

Conflicts of Interest

The authors declare no conflict of interest.

References

  1. Nanavati, S.C.; Lulla, S.J.; Singh, A.R.; Mehta, D.B.; Patel, A.M.; Lade, A.D. A Review on Fly Ash Based Geopolymer Concrete. IOSR J. Mech. Civ. Eng. 2017, 14, 12–16. [Google Scholar] [CrossRef]
  2. Annapurna, D.; Kishore, R.; Ushaee, M. Comparative Study of Experimental and Analytical Results of Geo Polymer Concrete. Int. J. Civ. Eng. Technol. 2016, 7, 211–219. [Google Scholar]
  3. Ismail, F.I.; Farhan, S.A.; Husna, N.; Shafiq, N.; Wahab, M.M.A.; Razak, S.N.A. Influence of Graphene Nanoplatelets on the Compressive and Split Tensile Strengths of Geopolymer Concrete. IOP Conf. Ser. Earth Environ. Sci. 2021, 945, 012060. [Google Scholar] [CrossRef]
  4. Luhar, S.; Luhar, I. Rubberized Geopolymer Concrete: Application of Taguchi Method for Various Factors. Int. J. Recent Technol. Eng. 2020, 8, 1167–1174. [Google Scholar] [CrossRef]
  5. Vellaichamy, P.; Selvarajan, H.; Ramalingam, A.; Uthirasamy, K. Performance Studies on Geo Polymer Concrete. IOP Conf. Ser. Mater. Sci. Eng. 2020, 955, 012036. [Google Scholar] [CrossRef]
  6. Gopalakrishnan, R.; Raju, K.C. Durability of Alkali Activated Concrete—A Review. Aust. J. Basic Appl. Sci. 2015, 9, 457–464. [Google Scholar]
  7. Elzeadani, M.; Bompa, D.V.; Elghazouli, A.Y. Preparation and Properties of Rubberised Geopolymer Concrete: A Review. Constr. Build. Mater. 2021, 313, 125504. [Google Scholar] [CrossRef]
  8. Zhuang, X.Y.; Chen, L.; Komarneni, S.; Zhou, C.H.; Tong, D.S.; Yang, H.M.; Yu, W.H.; Wang, H. Fly Ash-Based Geopolymer: Clean Production, Properties and Applications. J. Clean. Prod. 2016, 125, 253–267. [Google Scholar] [CrossRef]
  9. Luhar, S.; Chaudhary, S.; Luhar, I. Development of Rubberized Geopolymer Concrete: Strength and Durability Studies. Constr. Build. Mater. 2019, 204, 740–753. [Google Scholar] [CrossRef]
  10. Aly, A.M.; El-Feky, M.S.; Kohail, M.; Nasr, E.S.A.R. Performance of Geopolymer Concrete Containing Recycled Rubber. Constr. Build. Mater. 2019, 207, 136–144. [Google Scholar] [CrossRef]
  11. Luhar, S.; Luhar, I.; Nicolaides, D.; Gupta, R. Durability Performance Evaluation of Rubberized Geopolymer Concrete. Sustainability 2021, 13, 5969. [Google Scholar] [CrossRef]
  12. Kroehong, W.; Sinsiri, T.; Jaturapitakkul, C.; Chindaprasirt, P. Effect of Palm Oil Fuel Ash Fineness on the Microstructure of Blended Cement Paste. Constr. Build. Mater. 2011, 25, 4095–4104. [Google Scholar] [CrossRef]
  13. Akinwumi, I.I.; Adeyeri, J.B.; Ejohwomu, O.A. Effects of Steel Slag Addition on the Plasticity, Strength and Permeability of a Lateritic Soil. In Proceedings of the Second International Conference on Sustainable Design, Engineering and Construction, ASCE, Fort Worth, TX, USA, 7–9 November 2012; pp. 457–464. [Google Scholar]
  14. Part, W.K.; Ramli, M.; Cheah, C.B. An Overview on the Influence of Various Factors on the Properties of Geopolymer Concrete Derived from Industrial By-Products. Constr. Build. Mater. 2015, 77, 370–395. [Google Scholar] [CrossRef]
  15. Krishna, R.S.; Mishra, J.; Nanda, B.; Patro, S.K.; Adetayo, A.; Qureshi, T.S. The Role of Graphene and Its Derivatives in Modifying Different Phases of Geopolymer Composites: A Review. Constr. Build. Mater. 2021, 306, 124774. [Google Scholar] [CrossRef]
  16. Azmi, A.A.; Abdullah, M.M.A.B.; Ghazali, C.M.R.; Sandu, A.V.; Hussin, K.; Sumarto, D.A. A Review on Fly Ash Based Geopolymer Rubberized Concrete. Key Eng. Mater. 2016, 700, 183–196. [Google Scholar] [CrossRef]
  17. Dong, M.; Elchalakani, M.; Karrech, A. Development of High Strength One-Part Geopolymer Mortar Using Sodium Metasilicate. Constr. Build. Mater. 2020, 236, 117611. [Google Scholar] [CrossRef]
  18. Longo, F.; Cascardi, A.; Lassandro, P.; Aiello, M.A. Energy and Seismic Drawbacks of Masonry: A Unified Retrofitting Solution. J. Build. Pathol. Rehabil. 2021, 6, 1–24. [Google Scholar] [CrossRef]
  19. Longo, F.; Cascardi, A.; Lassandro, P.; Aiello, M.A. A New Fabric Reinforced Geopolymer Mortar (FRGM) with Mechanical and Energy Benefits. Fibers 2020, 8, 49. [Google Scholar] [CrossRef]
  20. Zakka, W.P.; Abdul Shukor Lim, N.H.; Chau Khun, M. A Scientometric Review of Geopolymer Concrete. J. Clean. Prod. 2021, 280, 124353. [Google Scholar] [CrossRef]
  21. Ranjbar, N.; Mehrali, M.; Mehrali, M.; Alengaram, U.J.; Jumaat, M.Z. Graphene Nanoplatelet-Fly Ash Based Geopolymer Composites. Concr. Res. 2015, 76, 222–231. [Google Scholar] [CrossRef]
  22. Liu, C.; Huang, X.; Wu, Y.-Y.; Deng, X.; Liu, J.; Zheng, Z.; Hui, D. Review on the Research Progress of Cement-Based and Geopolymer Materials Modified by Graphene and Graphene Oxide. Nanotechnol. Rev. 2020, 9, 155–169. [Google Scholar] [CrossRef] [Green Version]
  23. Rafiee, M.A.; Lu, W.; Thomas, A.V.; Zandiatashbar, A.; Rafiee, J.; Tour, J.M.; Koratkar, N.A. Graphene Nanoribbon Composites. ACS Nano 2010, 4, 7415–7420. [Google Scholar] [CrossRef]
  24. Ho, V.D. Development of Next-Generation Construction Materials with Graphene Additives. Ph.D. Thesis, University of Adelaide, Adelaide, Australia, 2020. [Google Scholar]
  25. Pan, Z.; He, L.; Qiu, L.; Korayem, A.H.; Li, G.; Zhu, J.W.; Collins, F.; Li, D.; Duan, W.H.; Wang, M.C. Mechanical Properties and Microstructure of a Graphene Oxide-Cement Composite. Cem. Concr. Compos. 2015, 58, 140–147. [Google Scholar] [CrossRef]
  26. Ahmed, H.U.; Mohammed, A.A.; Mohammed, A.S. The Role of Nanomaterials in Geopolymer Concrete Composites: A State-of-the-Art Review. J. Build. Eng. 2022, 49, 104062. [Google Scholar] [CrossRef]
  27. Nuaklong, P.; Jongvivatsakul, P.; Pothisiri, T.; Sata, V.; Chindaprasirt, P. Influence of Rice Husk Ash on Mechanical Properties and Fire Resistance of Recycled Aggregate High-Calcium Fly Ash Geopolymer Concrete. J. Clean. Prod. 2020, 252, 119797. [Google Scholar] [CrossRef]
  28. Nuaklong, P.; Sata, V.; Wongsa, A.; Srinavin, K.; Chindaprasirt, P. Recycled Aggregate High Calcium Fly Ash Geopolymer Concrete with Inclusion of OPC and Nano-SiO2. Constr. Build. Mater. 2018, 174, 244–252. [Google Scholar] [CrossRef]
  29. Gao, X.; Yu, Q.L.; Brouwers, H.J.H. Characterization of Alkali Activated Slag-Fly Ash Blends Containing Nano-Silica. Constr. Build. Mater. 2015, 98, 397–406. [Google Scholar] [CrossRef]
  30. Duan, P.; Yan, C.; Luo, W.; Zhou, W. Effects of Adding Nano-TiO2 on Compressive Strength, Drying Shrinkage, Carbonation and Microstructure of Fluidized Bed Fly Ash Based Geopolymer Paste. Constr. Build. Mater. 2016, 106, 115–125. [Google Scholar] [CrossRef]
  31. da Luz, G.; Gleize, P.J.P.; Batiston, E.R.; Pelisser, F. Effect of Pristine and Functionalized Carbon Nanotubes on Microstructural, Rheological, and Mechanical Behaviors of Metakaolin-Based Geopolymer. Cem. Concr. Compos. 2019, 104, 103332. [Google Scholar] [CrossRef]
  32. Mustakim, S.M.; Das, S.K.; Mishra, J.; Aftab, A.; Alomayri, T.S.; Assaedi, H.S.; Kaze, C.R. Improvement in Fresh, Mechanical and Microstructural Properties of Fly Ash- Blast Furnace Slag Based Geopolymer Concrete By Addition of Nano and Micro Silica. Silicon 2021, 13, 2415–2428. [Google Scholar] [CrossRef]
  33. Angelin Lincy, G.; Velkennedy, R. Experimental Optimization of Metakaolin and Nanosilica Composite for Geopolymer Concrete Paver Blocks. Struct. Concr. 2021, 22, E442–E451. [Google Scholar] [CrossRef]
  34. Janaki, A.M.; Shafabakhsh, G.; Hassani, A. Laboratory Evaluation of Alkali-Activated Slag Concrete Pavement Containing Silica Fume and Carbon Nanotubes. Eng. J. 2021, 25, 21–31. [Google Scholar] [CrossRef]
  35. Yang, Z.; Li, F.; Li, W.; Chen, D.; Li, S. Effect of Carbon Nanotubes on Porosity and Mechanical Properties of Slag-Based Geopolymer. Arab. J. Sci. Eng. 2021, 46, 10731–10738. [Google Scholar] [CrossRef]
  36. Application, M.; Mahboubi, B.; Guo, Z.; Wu, H. Evaluation of Durability Behavior of Geopolymer Concrete Containing Nano-Silica and Nano-Clay Additives in Acidic Media. J. Civ. Eng. Mater. 2019, 2019, 157–165. [Google Scholar]
  37. Rabiaa, E.; Mohamed, R.A.S.; Sofi, W.H.; Tawfik, T.A. Developing Geopolymer Concrete Properties by Using Nanomaterials and Steel Fibers. Adv. Mater. Sci. Eng. 2020, 2020, 5186091. [Google Scholar] [CrossRef]
  38. Saini, G.; Vattipalli, U. Assessing Properties of Alkali Activated GGBS Based Self-Compacting Geopolymer Concrete Using Nano-Silica. Case Stud. Constr. Mater. 2020, 12, e00352. [Google Scholar] [CrossRef]
  39. Kotop, M.A.; El-Feky, M.S.; Alharbi, Y.R.; Abadel, A.A.; Binyahya, A.S. Engineering Properties of Geopolymer Concrete Incorporating Hybrid Nano-Materials. Ain Shams Eng. J. 2021, 12, 3641–3647. [Google Scholar] [CrossRef]
  40. Ho, V.D.; Ng, C.T.; Coghlan, C.J.; Goodwin, A.; Mc Guckin, C.; Ozbakkaloglu, T.; Losic, D. Electrochemically Produced Graphene with Ultra Large Particles Enhances Mechanical Properties of Portland Cement Mortar. Constr. Build. Mater. 2020, 234, 117403. [Google Scholar] [CrossRef]
  41. Geim, A.K.; Novoselov, S.K. The Rise of Graphene Nanoscience and Technology: A Collection of Reviews from Nature Journals. World Sci. 2010, 11–19. [Google Scholar]
  42. Zheng, Q.; Han, B.; Cui, X.; Yu, X.; Ou, J. Graphene-Engineered Cementitious Composites: Small Makes a Big Impact. Nanomater. Nanotechnol. 2017, 7, 1–18. [Google Scholar] [CrossRef]
  43. Tay, C.H.; Norkhairunnisa, M. Mechanical Strength of Graphene Reinforced Geopolymer Nanocomposites: A Review. Front. Mater. 2021, 8, 1–20. [Google Scholar] [CrossRef]
  44. Guo, S.; Qiao, X.; Zhao, T.; Wang, Y.-S. Preparation of Highly Dispersed Graphene and Its Effect on the Mechanical Properties and Microstructures of Geopolymer. J. Mater. Civ. Eng. 2020, 32, 04020327. [Google Scholar] [CrossRef]
  45. Liu, X.; Wu, Y.; Li, M.; Jiang, J.; Guo, L.; Wang, W.; Zhang, W.; Zhang, Z.; Duan, P. Effects of Graphene Oxide on Microstructure and Mechanical Properties of Graphene Oxide-Geopolymer Composites. Constr. Build. Mater. 2020, 247, 118544. [Google Scholar] [CrossRef]
  46. Sai Sunil, S.; Kolli, R. Experimental Investigation on Mechanical Properties of Fly Ash-GGBFS Based GO-Geopolymer Concrete Using Mineral Sand (Quartz-Feldspar) as Fine Aggregate. Mater. Today Proc. 2022, 60, 40–45. [Google Scholar] [CrossRef]
  47. Bellum, R.R.; Muniraj, K.; Indukuri, C.S.R.; Madduru, S.R.C. Investigation on Performance Enhancement of Fly Ash-GGBFS Based Graphene Geopolymer Concrete. J. Build. Eng. 2020, 32, 101659. [Google Scholar] [CrossRef]
  48. Maglad, A.M.; Zaid, O.; Arbili, M.M.; Ascensão, G.; Șerbănoiu, A.A.; Grădinaru, C.M.; García, R.M.; Qaidi, S.M.A.; Althoey, F.; de Prado-Gil, J. A Study on the Properties of Geopolymer Concrete Modified with Nano Graphene Oxide. Buildings 2022, 12, 1066. [Google Scholar] [CrossRef]
  49. Gong, K.; Pan, Z.; Korayem, A.H.; Qiu, L.; Li, D.; Collins, F.; Wang, C.M.; Duan, W.H. Reinforcing Effects of Graphene Oxide on Portland Cement Paste. J. Mater. Civ. Eng. 2015, 27, 1–6. [Google Scholar] [CrossRef]
  50. Shams, S.S.; Zhang, R.; Zhu, J. Graphene Synthesis: A Review. Mater. Sci. Pol. 2015, 33, 566–578. [Google Scholar] [CrossRef] [Green Version]
  51. Liu, W.-W.; Aziz, A. Review on the Effect of Electromechanical Exfoliation Parameters on the Yield of Graphene Oxide. ACS Omega 2022, 7, 33719–33731. [Google Scholar] [CrossRef] [PubMed]
  52. Pei, S.; Wei, Q.; Huang, K.; Cheng, H.M.; Ren, W. Green Synthesis of Graphene Oxide by Seconds Timescale Water Electrolytic Oxidation. Nat. Commun. 2018, 9, 1–9. [Google Scholar] [CrossRef] [Green Version]
  53. Pei, S.; Cheng, H.M. The Reduction of Graphene Oxide. Carbon N. Y. 2012, 50, 3210–3228. [Google Scholar] [CrossRef]
  54. Sajjad, U.; Sheikh, M.N.; Hadi, M.N.S. Experimental Study of the Effect of Graphene on Properties of Ambient-Cured Slag and Fly Ash-Based Geopolymer Paste and Mortar. Constr. Build. Mater. 2021, 313, 125403. [Google Scholar] [CrossRef]
  55. Li, Z.; Sheikh, M.N.; Feng, H.; Hadi, M.N.S. Mechanical Properties of Engineered Geopolymer Composite with Graphene Nanoplatelet. Ceram. Int. 2022, 48, 34915–34930. [Google Scholar] [CrossRef]
  56. Shamsaei, E.; de Souza, F.B.; Yao, X.; Benhelal, E.; Akbari, A.; Duan, W. Graphene-Based Nanosheets for Stronger and More Durable Concrete: A Review. Constr. Build. Mater. 2018, 183, 642–660. [Google Scholar] [CrossRef]
  57. Zhang, Y.Y.; Gu, Y.T. Mechanical Properties of Graphene: Effects of Layer Number, Temperature and Isotope. Comput. Mater. Sci. 2013, 71, 197–200. [Google Scholar] [CrossRef] [Green Version]
  58. Parviz, D.; Irin, F.; Shah, S.A.; Das, S.; Sweeney, C.B.; Green, M.J. Challenges in Liquid-Phase Exfoliation, Processing, and Assembly of Pristine Graphene. Adv. Mater. 2016, 28, 8796–8818. [Google Scholar] [CrossRef]
  59. Liang, W.; Zhang, G. Effect of Reduced Graphene Oxide on the Early-Age Mechanical Properties of Geopolymer Cement. Mater. Lett. 2020, 276, 128223. [Google Scholar] [CrossRef]
  60. Liu, J.; Fu, J.; Yang, Y.; Gu, C. Study on Dispersion, Mechanical and Microstructure Properties of Cement Paste Incorporating Graphene Sheets. Constr. Build. Mater. 2019, 199, 1–11. [Google Scholar] [CrossRef]
  61. Sharma, S.; Kothiyal, N.C. Influence of Graphene Oxide as Dispersed Phase in Cement Mortar Matrix in Defining the Crystal Patterns of Cement Hydrates and Its Effect on Mechanical, Microstructural and Crystallization Properties. RSC Adv. 2015, 5, 52642–52657. [Google Scholar] [CrossRef]
  62. Ho, V.D.; Ng, C.T.; Ozbakkaloglu, T.; Goodwin, A.; McGuckin, C.; Karunagaran, R.U.; Losic, D. Influence of Pristine Graphene Particle Sizes on Physicochemical, Microstructural and Mechanical Properties of Portland Cement Mortars. Constr. Build. Mater. 2020, 264, 120188. [Google Scholar] [CrossRef]
  63. ASTM-C618; Standard Specification for Coal Fly Ash and Raw or Calcined Natural Pozzolan for Use as a Mineral Admixture in Concrete in Concrete. ASTM International: West Conshohocken, PA, USA, 1999.
  64. Ryu, G.S.; Lee, Y.B.; Koh, K.T.; Chung, Y.S. The Mechanical Properties of Fly Ash-Based Geopolymer Concrete with Alkaline Activators. Constr. Build. Mater. 2013, 47, 409–418. [Google Scholar] [CrossRef]
  65. ASTM-C33; Standard Specification for Concrete Aggregates. ASTM International: West Conshohocken, PA, USA, 2016.
  66. Somna, K.; Jaturapitakkul, C.; Kajitvichyanukul, P.; Chindaprasirt, P. NaOH Activated Ground Fly Ash Geopolymer Cured at Ambient Temperature. Fuel 2011, 90, 2118–2124. [Google Scholar] [CrossRef]
  67. Pavithra, P.; Srinivasula Reddy, M.; Dinakar, P.; Hanumantha Rao, B.; Satpathy, B.K.; Mohanty, A.N. A Mix Design Procedure for Geopolymer Concrete with Fly Ash. J. Clean. Prod. 2016, 133, 117–125. [Google Scholar] [CrossRef]
  68. Ho, V.D.; Ng, C.T.; Ozbakkaloglu, T.; Karunagaran, R.U.; Farivar, F.; Goodwin, A.; Guckin, C.M.; Ho, V.D.; Losic, D. Investigating the Reinforcing Mechanism and Optimised Dosage of Pristine Graphene for Enhancing Mechanical Strengths of Cementitious Composites. RSC Adv. 2020, 10, 42777–42789. [Google Scholar] [CrossRef] [PubMed]
  69. ASTM-D422-63; Standard Test Method for Particle-Size Analysis of Soils. ASTM International: West Conshohocken, PA, USA, 2007.
  70. ASTM-C1437; Standard, Test Method for Flow of Hydraulic Cement Mortar. ASTM International: West Conshohocken, PA, USA, 2015.
  71. ASTM-C109/C109M-08; Standard, Test Method for Compressive Strength of Hydraulic Cement Mortars. ASTM International: West Conshohocken, PA, USA, 2008.
  72. ASTM-C307-03; Standard, Test Method for Tensile Strength of Chemical- Resistant Mortar, Grouts, and Monolithic Surfacings Monolithic Surfacings. ASTM International: West Conshohocken, PA, USA, 2012.
  73. ASTM-C348-08; Standard Test Method for Flexural Strength of Hydraulic-Cement Mortars. ASTM International: West Conshohocken, PA, USA, 2009.
  74. Abdul Latif Rajab Al Balushi, D.; Devi, G.; Jabr Ahmed, S.; Said Almawali, N. Synthesis and Application of Nano and Micro-Silica Particles to Enhance the Mechanical Proprieties of Cement Concrete. Concr. Res. Lett. 2016, 7, 113–122. [Google Scholar]
  75. Arita, S.; Aoyagi, N.; Ohshita, K.; Tsubota, Y.; Ogihara, T. Synthesis and Characterization of Spherical Alumina Nanoparticles by Spray Pyrolysis Using Radiofrequency Plasma. J. Ceram. Soc. Jpn. 2017, 125, 539–542. [Google Scholar] [CrossRef] [Green Version]
  76. Zhao, L.; Zhu, S.; Wu, H.; Zhang, X.; Tao, Q.; Song, L.; Song, Y.; Guo, X. Deep Research about the Mechanisms of Graphene Oxide (GO) Aggregation in Alkaline Cement Pore Solution. Constr. Build. Mater. 2020, 247, 118446. [Google Scholar] [CrossRef]
  77. Monzo, J.; Paya, J.; Peris-Mora, E. A Preliminary Study of Fly Ash Granulometric Influence on Mortar Strength. Cem. Concr. Res. 1994, 24, 791–796. [Google Scholar] [CrossRef]
  78. Sevim, Ö.; Demir, İ. Optimisation of Fly Ash Particle Size Distribution for Cementitious Systems with High Compactness. Constr. Build. Mater. 2019, 195, 104–114. [Google Scholar] [CrossRef]
  79. Shahrajabian, F.; Behfarnia, K. The Effects of Nano Particles on Freeze and Thaw Resistance of Alkali-Activated Slag Concrete. Constr. Build. Mater. 2018, 176, 172–178. [Google Scholar] [CrossRef]
  80. Kjaernsmo, H.; Kakay, S.; Fossa, K.T.; Gronli, J. The Effect of Graphene Oxide on Cement Mortar. IOP Conf. Ser. Mater. Sci. Eng. 2018, 362, 012012. [Google Scholar] [CrossRef]
  81. Ibrahim, M.; Rahman, M.K.; Johari, M.A.M.; Maslehuddin, M. Effect of Incorporating Nano-Silica on the Strength of Natural Pozzolan-Based Alkali-Activated Concrete. In International Congress on Polymers in Concrete; Springer: Berlin/Heidelberg, Germany, 2018; pp. 703–709. [Google Scholar]
  82. Zhang, G.; Lu, J. Experimental Research on the Mechanical Properties of Graphene Geopolymer. AIP Adv. 2018, 8, 065209. [Google Scholar] [CrossRef]
  83. Gholampour, A.; Kiamahalleh, M.V.; Tran, D.N.H.; Ozbakkaloglu, T.; Losic, D. Revealing the Dependence of the Physiochemical and Mechanical Properties of Cement Composites on Graphene Oxide Concentration. RSC Adv. 2017, 7, 55148–55156. [Google Scholar] [CrossRef] [Green Version]
  84. Wang, B.; Pan, B. Subset-Based Local vs. Finite Element-Based Global Digital Image Correlation: A Comparison Study. Theor. Appl. Mech. Lett. 2016, 6, 200–208. [Google Scholar] [CrossRef]
Figure 1. Methodology.
Sustainability 15 01706 g001
Figure 2. Percentage passing of river sand.
Sustainability 15 01706 g002
Figure 3. Dispersion of PG in a bath sonicator (EMAG Emmi-H30).
Sustainability 15 01706 g003
Figure 4. Preparation of pristine graphene-reinforced geopolymer mortar.
Sustainability 15 01706 g004
Figure 5. SEM image of (a) alumina nanoparticle and (b) nanosilica [74,75].
Sustainability 15 01706 g005
Figure 6. SEM image and particle size distribution of pristine graphene.
Sustainability 15 01706 g006
Figure 7. Percentage of transmittance and photograph of PG suspension in aqueous solution. (A,C,D) are with sonication, and (B,E,F) are without sonication.
Sustainability 15 01706 g007
Figure 8. Particle size distribution and SEM image of fly ash.
Sustainability 15 01706 g008
Figure 9. Flowability of the mortar.
Sustainability 15 01706 g009
Figure 10. Compressive strength of the PG-reinforced geopolymer mortar at 7 and 28 days.
Sustainability 15 01706 g010
Figure 11. Compressive strength enhancement at 7 and 28 days.
Sustainability 15 01706 g011
Figure 12. Tensile and flexural strengths of the PG-reinforced geopolymer mortar at 28 days.
Sustainability 15 01706 g012
Figure 13. Tensile and flexural strengths enhancement at 28 days.
Sustainability 15 01706 g013
Figure 14. Physical inspection of the control (a) and the PG0.07% (b) cubes after curing.
Sustainability 15 01706 g014
Table 1. Physical and mechanical properties of fly ash.
Element NameCompositionSpecifications of ASTM C618 for Class F Fly Ash
Chemical Analysis
Silicon Dioxide (SiO2)55.865%
Aluminium Oxide (Al2O3)22.657%
Iron Oxide (Fe2O3)6.118%
Addition of SiO2, Al2O3, and Fe203 84.640%Min (70%)
Calcium Oxide6.501%Max (10%)
Magnesium Oxide (MgO)5.194%
Sulphur Trioxide (SO3)0.358%Max (5%)
Loss on Ignition1.750%Max (6%)
Physical Analysis
Specific Gravity2.500
Amount Retained on 45 Microns Sieve (Fineness)4.000%Max (34%)
Moisture Content0.952%Max (3%)
Table 2. Properties of superplasticiser (MasterGlenium 3889).
pHChlorine Content (%)Specific Gravity at 25 °C (Kg/dm3)Appearance
5–70%1.073Whitish to light brown clear to cloudy liquid
Table 3. Properties of pristine graphene (PureGRAPH 50 AQUA).
NameAverage Particle Size (µm)Thickness (Layers)Purity (%)Bulk Density (g cm−3)Percentage of Solid (%)
PG-50505–10 991.1323.27
Table 4. Properties of the alkali activator.
CompoundTotal Solids (%)Specific Gravity @20 °CNa2O (%)SiO2 (%)Na2O: SiO2Purity (%)
NaOH41.701.34--->98
Na2SiO343.621.5314.0729.550.4762-
Table 5. Mix proportion of the geopolymer mortar.
LabelPG Content (%)Fly Ash (Kg/M3)Sand (Kg/M3)LA (Kg/M3)NaOH (Kg/M3)Na2SiO3
(Kg/M3)
PG (Kg/M3)SP (Kg/M3)Water (Kg/M3)
PG00647.891295.78259.1674.04185.110.006.4846.91
PG0.050.05647.891295.78259.1674.04185.110.326.4846.91
PG0.070.07647.891295.78259.1674.04185.110.456.4846.91
PG0.100.10647.891295.78259.1674.04185.110.656.4846.91
PG0.300.30647.891295.78259.1674.04185.111.946.4846.91
PG0.500.50647.891295.78259.1674.04185.113.246.4846.91
PG1.001.00647.891295.78259.1674.04185.116.486.4846.91
LA = Liquid Activator, SP = Super Plasticizer and PG = Pristine Graphene.
Table 6. ANOVA test to determine the effect of PG dosages on the compressive strength of the geopolymer mortar at 7 and 28 days.
7 Days28 Days
Difference of LevelsMean DifferenceSignificance LevelMean DifferenceSignificant Level
PG0.05—Control6.65670.0015.52030.001
PG0.07—Control7.19700.0018.00770.000
PG0.1—Control1.29830.4091.79070.197
PG0.3—Control0.22600.7431.28670.340
Table 7. ANOVA and Kruskal–Wallis test to determine the effect of PG dosages on the geopolymer mortar’s flexural and tensile strengths.
28 Days Flexural Strength28 Days Tensile Strength
Difference of LevelsMean DifferenceSignificance LevelMean DifferenceSignificance Level
Control—PG0.05 0.9287 0.005−7.3330.044
Control—PG0.07 1.5360 0.000−10.3330.004
Control—PG0.1 0.6093 0.047−3.6670.313
Control—PG0.3 0.43600.140−0.3330.927
Disclaimer/Publisher’s Note: The statements, opinions and data contained in all publications are solely those of the individual author(s) and contributor(s) and not of MDPI and/or the editor(s). MDPI and/or the editor(s) disclaim responsibility for any injury to people or property resulting from any ideas, methods, instructions or products referred to in the content.

