Abstract
Due to the unavoidable operational risks and insufficient risk management capabilities of beginner pilots in flight training, the challenge of risk control in aviation schools has become increasingly prominent. To ensure the safety of flight training in aviation schools and to reduce costs and increase revenue, the essential prerequisite for improving efficiency is risk management. Therefore, it is necessary to explore risk identification and assessment methods. This paper adopts the holographic modeling (HHM) method and risk filtering, rating and management (RFRM) theory. First, the HHM idea is used to construct a risk identification framework (HHM-PAVE) for flight training. Second, based on the dual criteria, multiple criteria and cloud model (CM) in the RFRM approach, an improved risk assessment matrix-cloud model (IPC-CM) is proposed and combined with the N-K model and Bayes’ theorem to propose a coupled risk scenario hazard measurement model (CR-HM) based on the HHM-RFRM approach in risk assessment. In the assessment process, the impact of risk factors on system stability as well as the uncertainty problem and coupling–risk quantification problem in expert assessment are considered to obtain scientific and objective quantitative assessment results. Finally, the risk identification and assessment experiments were conducted using HHM-RFRM on the flight training. The results show that the method can more accurately identify critical risk factors in a flight training system and provide a new perspective for risk prevention and control.
1. Introduction
Safety is a top priority for the aviation industry. Aviation safety has significantly improved from the development of the global aviation industry in the past seventy years. From 2017 through 2021, the total number of accidents, the real accident rate and the number of fatalities continued to decrease. However, the overall risk of death increased to 0.23 in 2021 due to the rise in fatal accidents in turboprops, and various types of accidents still occur. Aviation Safety Network (ASN) data [] indicated that 453 accidents have occurred worldwide since 2020, causing widespread public concern as well as loss of life and damage to property. Since 2010, 57% of the total accidents have been caused by pilots. From the early training of pilots and throughout pilots’ lifecycles, pilot risk control capability is lacking, and the risk control and management of flight training in flight schools are becoming increasingly prominent. Therefore, it is crucial to perform comprehensive and effective risk identification and assessment of risks in flight training, which is the key to risk management for flight schools and pilots.
Risk management has always been an active area of research. It has penetrated all walks of life. Evaluation methods have been developed and evolved in cross-discipline integration. For example, Wenjun Zhang et al. [] used the HHM-RFRM model in ship navigation safety to analyze navigation risk management from the perspective of risk coupling. In addition, many studies [,] in various industries were conducted on risk occurrence mechanisms, risk probabilities, and baseline risk functions. In civil aviation flight safety, flight risk identification and assessment are critical to aviation risk management, which is a topic with significant theoretical and practical significance. Domestic and foreign scholars have conducted research on the theoretical model of risk management. The current flight safety risk management is mainly based on several existing theoretical models of accident causation [,,,,,], such as the Software, Hardware, Environment, Liveware model (SHEL), Reason’s “Swiss cheese” model, the functional resonance analysis method (FRAM), the holographic modeling method and risk filtering, rating and management theory (HHM-RFRM), and Event Tree Analysis (ETA). Based on those theoretical models, scholars have researched the critical aspects of flight safety risk management. In the risk identification part, Shi et al. [] used data mining methods to identify and classify risk factors in accident reports in the safety management system, which solved the cumbersome and subjective problems of manual identification. Still, there are limitations in the overall risk factor identification framework. Wu et al. [] adopted the ETA method to identify single risk factors affecting flight safety and established a risk factor identification system. Paltrinieri et al. [] proposed an atypical accident identification method, which showed promising results in identifying uncommon and complex coupled risk scenarios. In the risk assessment section, Gray et al. [] utilized the 1% rule to assess the risk of aircrews with established medical problems, classifying them into risk classes with red/amber/green (RAG) colors. Tamasi et al. [] proposed a methodology to determine risk qualitatively and quantitatively, using a risk assessment matrix combined with the ETA model. However, it still suffers from high uncertainty and lack of objectivity. Yong Gang et al. [] used the N-K model to analyze the coupling effect of flight operation risk factors and systematically analyze the flight operation coupling while on the ground and in the air based on the coupled risk values.
The above research indicates the presence of two challenges in current flight training risk management. On the one hand, in the area of risk source identification, from the perspective of risk identification objects, some studies [,] have focused on the impact of single risk factors on the overall system risk, which is helpful for general system risk assessment. Still, for complex system risks [,], it is easy to ignore the impact of multi-factor coupling on flight training safety. For example, when the environment is poor and there is a human factor of pilot error, coupling these two risk factors increases the likelihood of an accident. Still, the risk of this multi-factor coupling has not been studied heavily. Relevant researchers have proposed a scenario-based risk response framework [], but specific methods and measures for risk management are lacking. On the other hand, in the area of risk assessment, from the perspective of qualitative assessment, the risk assessment matrix [] is an assessment method based on expert experience and cognitive level with natural uncertainties and is greatly influenced by assessors. From the perspective of quantitative evaluation, some studies [,,] have only focused on the impact of coupling risk. Still, few have analyzed the specific coupling risk sub-scenarios under the coupling risk scenario.
When the flight instructor does not interfere as much as possible, and the flight student has a certain knowledge of risk management theory, this paper proposes a coupled risk scenario identification and assessment model based on HHM-RFRM theory. This model utilizes the advantages of the CM and N-K models to solve the above-mentioned issues in risk identification and assessment. First, in the risk identification section, the HHM method is used to find risk factors hierarchically and systematically, emphasizing the concept of coupled risk scenario and outputting flight training-related risk factors. Second, the risk assessment proposes the coupled risk scenario–hazard measurement model (CR-HM). The risk correction coefficient combines the multiple judgment criteria in RFRM with the risk assessment matrix–cloud model (PC-CM), which considers system resistance problems and human cognition’s ambiguity and randomness to screen out the critical risk factors. With the IPC-CM model, the numerical characteristics of the risk factor cloud model (Ex, En, He) are output. Then, a new set of evaluation ideas is formed using the N-K model and Bayesian theory to evaluate the coupled risk scenario quantitatively and output the final risk values. The flow of the research method is shown in Figure 1. Finally, taking the flight training of a domestic aviation school as an example, high-risk factors and key coupled risk scenarios are identified and evaluated.
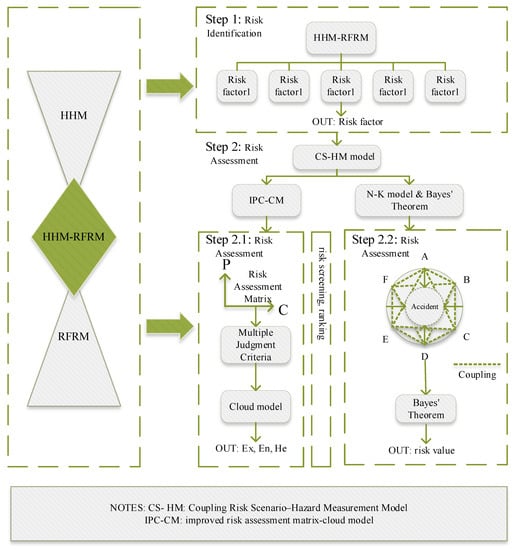
Figure 1.
Schematic diagram of the proposed method.
2. Research Method
2.1. HHM-RFRM Method
The HHM-RFRM methodology [] is a combination of hierarchical holographic modeling (HHM) [] and risk filtering, rating and management (RFRM) [,] and embodies a philosophy of distinguishing “primary and secondary conflicts”, filtering secondary risks through qualitative and quantitative assessment analysis and identifying primary risks. This paper focuses on the HHM approach and the five main stages of the RFRM approach, namely (1) scenario identification, (2) dual criteria filtering and rating, (3) multi-criteria assessment, (4) quantitative assessment, and (5) risk management. Although the classical HHM-RFRM method can help pilots better understand the possible risks in flight, it is difficult to achieve a scientific qualitative and quantitative risk assessment. Therefore, it is necessary to use the N-K model to filter out the key coupled risks by the probability of risk factors. Using the cloud model, a more accurate quantitative assessment is achieved by the numerical characteristics of the cloud model. In conclusion, the advantages of each model are utilized to improve the traditional HHM-RFRM to obtain better risk assessment results.
2.1.1. Risk Scenario Identification
Initially proposed by Kaplan and Garrick et al. [], risk scenario identification is a critical step in HHM-RFRM and consists of three components: risk scenario, probability of occurrence and damage level. A comprehensive risk factor analysis is the starting point for risk identification.
The analysis of flight risk factors is the basis of risk identification. This paper uses the HHM model and the risk identification framework [] (Pilot-in-Command, Aircraft, Environment, External Pressures—PAVE) to identify risk sources, which requires constructing a risk scenario framework for the risks encountered in flight. Based on the iterative idea of the hierarchical holographic modeling process and the Delphi method, this paper constructs the HHM-PAVE framework to identify the risk factors in flight training. The specific process is shown in Figure 2:
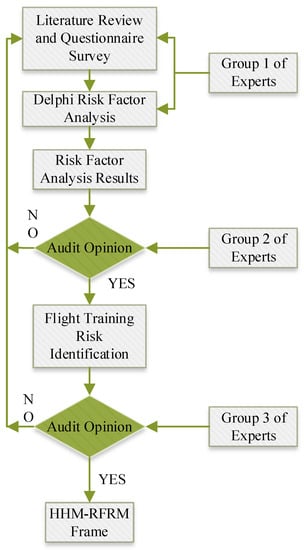
Figure 2.
HHM-PAVE framework flow chart.
Based on the construction of the HHM-PAVE framework in Figure 2, individual risk factors are identified. However, in in-flight safety system risk, there is not only single-factor risk but also multi-factor coupled risk. This paper emphasizes the multi-dimensional risk factor coupling in flight training safety, as detailed in Section 2.3, the N-K model. Assume that denotes an N-dimensional risk scenario consisting of M risk elements, which are defined as follows:
where ⊙ represents the coupling effect, and the algorithm satisfies the commutative law , represents a risk scenario where the risk factors within the two-dimensional risk subsystem a and b are coupled.
(1) Single-factor coupling risk
Single-factor coupling risk refers to the risk caused by the coupling effect and influence between the risk factors belonging to a single subsystem that affects flight training safety. For example:
(2) Two-factor coupling risk
Two-factor coupling risk refers to the risk caused by the coupling effect and influence between two subsystems that affect flight training safety. For example:
(3) Multi-factor coupling risk
Multi-factor coupling risk refers to the risk caused by the coupling effect and influence of three or more risk factors that affect flight training safety. For example:
2.1.2. Risk Scenario Assessment
Risk scenario assessment is the core part of the RFRM method. It systematically evaluates and screens risk scenarios to screen out high-risk factors and their coupled risk scenarios continuously. It mainly includes two assessment methods: double filtering criteria and multiple judgment criteria, and the assessment steps are as follows:
Step 1: Double Filtering Criteria—Risk Assessment Matrix (PC)
The dual filtering criteria make up the first filtering step in the RFRM method, which aims to initially screen and rank the risk factors according to the dual criteria. The double filtering criteria and the civil aviation risk assessment matrix assess the probability and severity of an accident. In this regard, this paper adopts a risk assessment matrix that is more applicable to civil aviation [] to obtain the distribution of likelihood (P), consequence (C) and the corresponding five risk levels (R), as shown in Table 1, Table 2 and Table 3 below.

Table 1.
Risk probability class distribution (P).
Table 2.
Risk consequence degree distribution (C).
Table 3.
Risk rating (R).
Step 2: Multiple Judgment Criteria
The above risk assessment matrix only assesses the possibility and severity of the consequences of risk factors from the perspective of the assessment object. However, it puts specific restrictions on the overall assessment. In this paper, the screened risk factors are further analyzed from the perspective of global systems thinking. From a systems theory perspective, the analysis focuses on the system’s resistance and resilience to risk characteristics: stability, robustness and redundancy. Risks are further avoided by comparing the risk resistance nature of the system. This paper introduces the 11 criteria proposed by Matalas and Fiering et al. [] revised on the defensive capability of risky scenario knockdown systems. Based on the content of the criteria, the judging rules [], and the expert empirical determination, a multiple judgment matrix was obtained as shown in Table 4, where is the risk factor (Rf); I, II, III..., and XI is the standard serial numbers (St) and is the score of the risk factor x under the criteria.
Table 4.
Multiple judgment matrix.
2.2. Cloud Model
In classical HHM-RFRM methods and risk assessment matrices, which often include qualitative risk assessment processes, there are inevitably two of the most critical uncertainties inherent to human cognition: randomness and ambiguity []. This paper applies a new cognitive model-cloud model (CM) proposed by Li et al. [], which can synthetically describe the randomness and fuzziness of concepts, instantiate the uncertainty transformation between qualitative ideas and their quantitative concepts, and realize the uncertainty transformation between qualitative concepts and their quantitative ones.
Three values represent the overall characteristics of qualitative concepts in the CM: Expectation (), Entropy (), and Hyper Entropy (He). represents a measure of the elemental certainty of a qualitative picture, which can best represent the characteristics of a qualitative concept. represents a measure of the uncertainty range of the qualitative concept, determined by the vagueness and randomness of the qualitative concept, and reflects the degree of deviation of the actual affiliation . is a measure of uncertainty, reflecting the degree of cohesion of cloud drops of tension in the discourse world, which is determined by the vagueness and randomness of [].
Improved P-C Cloud Model (IPC-CM)
Based on the above risk assessment matrix, multiple criteria, and the CM method, this paper proposes an improved risk assessment matrix-cloud model (IPC-CM), which aims to provide more accurate assessment results for quantitative risk assessment and obtain the cloud model of each risk factor after screening. The IPC-CM model is the core assessment model in the whole HHM-RFRM model. It mainly includes the above four steps, as shown in Figure 3. Steps 1 and 2, the P-C concept cloud and rule base, are described detailed in the literature [,]. This paper focuses on the uncertainty inference of the CM and the optimization of the CM, where the uncertainty inference steps are as follows:
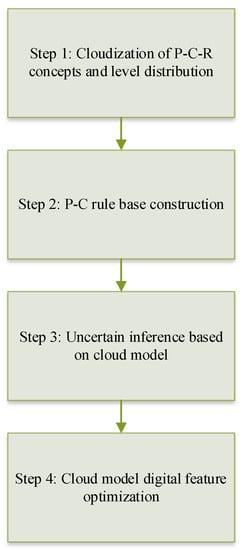
Figure 3.
Steps to improve the cloud model.
(1) Generate two-dimensional random numbers
Equation (2) is used to generate a two-dimensional random value with a two-dimensional normal distribution. At the same time, for each rule in the rule base, Equation (3) is used to generate a two-dimensional random value
(2) Calculate the activation strength μ matrix
Using by Equation (2), the corresponding rules caused by Equation (3) are substituted into Equation (4) to find the activation intensity when the conditional input of each direction in the rule base is . A total of 25 rules generated 25 μ values, which constitute the matrix μ.
(3) Calculate cloud droplets
First, take the largest and second largest in the matrix. Then, use Equation (5) to generate the hierarchical cloud model’s one-dimensional standard random value (). Use Equation (6) to calculate the four y values for the μ1 and μ2 conditions to obtain four groups
(4) Build virtual cloud
First, select the two closest cloud droplets and and construct a virtual concept with geometric methods. The three numerical characteristics of the virtual cloud are , where (,) are calculated by geometric forms using Equations (7) and (8). can be designated as a critical parameter reflecting the risk value.
where xU, x is the expectation of Ex, and Ex’ is a standard random variance number.
The CM obtained based on the risk assessment matrix is not quantitatively analyzed from the perspective of system stability. In this regard, In this paper, the new optimization method is proposed to use the correction coefficient [] combined with the multiple judgment matrix to correct the numerical characteristics of the cloud model under the risk assessment matrix to form the final IPC-CM, which can achieve the different scientific ranking of risk scenarios under the same risk level. The correction factor in Equations (9)–(12) is as follows:
where Pi represents the correction coefficient under scenario i; ai represents the safety and reliability of scenario i in the past period; represents the safety and reliability of scenario i in the current period; represents the risk coefficient ratio between factors i and j; Exi, Eni, and Hni represent the original parameter values under scenarios i; Exi’, and Eni’, and Hni’ represents the corrected value of the parameter.
2.3. N-K Model
Flight training is a complex system risk often involving multiple risk factors. Therefore, this paper introduces the concept of coupling. In physics, the phenomenon of two or more systems or two forms of motion interacting through various interactions to unite is called “coupling” []. Flight training risk coupling refers to the degree of mutual influence and dependence between or among various risk factors affecting aircraft flight during flight training. The coupling between or among risk factors changes the local or overall state of aircraft operation safety, resulting in flight accidents.
The N-K model consists of two parameters. N is the number of constituent factors in the system; and K is the number of inter-factor dependencies, reflecting the system’s adaptability. If the system consists of N factors, and there are n states of factors, then there are possible combinations of all the elements, the factors are combined in a certain way to form a network, and the range of K is [0, N−1]. Based on the evolutionary theory of biology, the interaction information between factors is calculated based on the N-K model to measure the coupling risk, and the coupling risk hazard is calculated according to Equations (13)–(15).
where represent the status values of A, B, C, and D risk factors, respectively; status value 0 means that the risk factor has not broken through the defense system, and status value 1 means that the risk factor has broken through the defense system; represents the changing risk of the mutual coupling of ABCD risk factors probability; represents the coupling of X risk factors; represents the risk of the mutual coupling of risk factors A, B, and C. A defense system is a complex system consisting of “human–machine–environment–management” subsystems that prevent unsafe events or accidents from occurring.
2.4. Quantitative Model Based on Bayes’ Theorem
Bayes’ theorem is a general form of the product rule for calculating the probability of two (or more) independent events [].
Assuming that there is a risk coupling between the two risk factors A B, without considering the risk of B, the probability that risk factor A causes an accident is prior probability . The likelihood of occurrence of risk B with a known intelligence A risk factor is conditional probability . At the same time, considering the risk factor B, is the posterior probability. The Bayesian Equations (16)–(18) are as follows:
From the perspective of quantitative risk assessment, this paper introduces Bayes’ theorem for quantitative calculation from the two dimensions of consequence and possibility, which are defined as follows:
Based on the modified consequence level of the IPC-CM, the posterior probability of each risk scenario is calculated by combining the coupling relationship between the risk factors in flight training. Associating Equation (19), the final coupled risk scenario’s hazard values are calculated.
3. Case Research
In the next section, this paper analyzes the accident investigation report of China’s civil aviation safety management system from 2018 through 2021 and the aviation safety briefing of an aviation school. Based on real data from actual scenarios, the flight school’s risk focus is continuously adjusted in the event of unsafe events and accident experiences. We take a flight school as an example and start from risk identification and assessment to verify the risks in flight training.
3.1. Risk Identification
3.1.1. HHM Frame
Based on the accident report of China’s civil aviation safety management system and the aviation safety briefing data, this paper completed the risk factor analysis through Figure 2. From the pilot’s perspective, the PAVE framework [] is adopted to cultivate the critical thinking of pilot trainees. All risk factors are divided into four subsystems of P, A, V, and E.
PAVE consists of four parts: P = Pilot-in-command (PIC); A = Aircraft; V = Environment; and E = External pressures.
(1) P = Pilot-in-Command (PIC)
The pilot in command is one of the risk factors in flight. A pilot must conduct a multi-faceted assessment of their risk profile as the controller of the aircraft. It mainly includes the pilot’s physiological and psychological condition and provides comprehensive quality.
(2) A = Aircraft
As the carrier of the flight, the aircraft is also one of the risk factors in the flight. The pilot must fully understand the aircraft’s performance, historical failures, and whether the corresponding airworthiness instructions have been completed, and it must check the maintenance of the aircraft.
(3) V = Environment
The flight environment is one of the flight risk factors, and the weather is a major environmental factor. Terrain assessment is another essential component in analyzing the flight environment, which is followed by airports, airspace, nighttime, and visual errors.
(4) E = External Pressures
External pressures are an effect outside of the flight, usually at the expense of safety, that creates a feeling of pressure to complete the flight.
Based on the analysis of the above risk factors, this paper establishes the flight training risk HHM-PAVE framework, as shown in Figure 4.
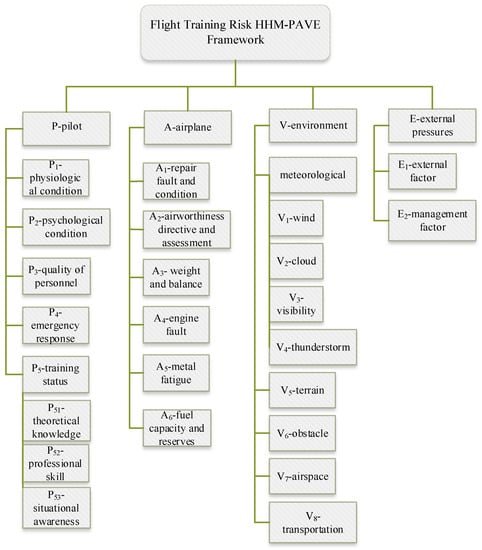
Figure 4.
HHM-PAVE model block diagram.
3.1.2. Coupling Risk Scenario
According to the accident data of China’s civil aviation safety management system from 2018 through 2021, the coupling theory is used to obtain the count and frequency of risk coupling in recent years, as shown in Table 5 below, where single-factor coupling risk means only one risk factor is involved, two-factor coupling risk means two risk factors are involved in risk coupling, and multi-factor coupling risk means three or more risks are involved in risk coupling; 1000 means P risk coupling effect; 0100 means A risk coupling effect; and 1110 represents PAV three-factor coupling effect.
Table 5.
Number and frequency of risk coupling.
3.2. Risk Assessment–Coupling Risk Scenario–Hazard Measurement Model (CR-HM)
3.2.1. Risk Assessment Matrix Filtering
Through the identification of risk scenarios mentioned above, this paper identifies 23 risk factors and 16 main risk coupling scenarios, theoretically including 1630 risk coupling scenarios, from which key risk factors are identified, and the priority analysis of key risks is performed. First, the 23 risk factors are analyzed qualitatively, and the two criteria of likelihood and severity of consequences are filtered using a risk assessment matrix. This filtering is accomplished by interviewing experts and administering questionnaires to relevant people. Senior flight instructors made subjective judgments about the likelihood and consequences of each factor based on their own flight experience and then asked the opinions of 20 flight instructors based on a questionnaire asking for their judgments. The results are shown in Table 6 below.
Table 6.
Risk assessment matrix.
Here, green represents risk level I, blue represents level II, yellow represents level III, orange represents level IV, and red represents level V.
The risk assessment matrix gives an initial rating and filtering of each risk factor. The risk factors for grades I, II, and III were filtered out. There are 16 risk factors, P1, P3, P51, P52, P53, A1, V1, V2, V3, V4, V5, V6, V7, V8, E1, and E2, which were retained for further analysis.
3.2.2. Multi-Criteria Assessment of Flight Risk
According to the detailed scoring criteria and scoring rules of multiple criteria, the 16 risk factors mentioned above are further evaluated, and the evaluation criteria are divided into three levels: high (H), medium (M), and, low (L), which were expressed by the values of 1, 0.5, and 0.2, respectively. The final multiple judgment matrix was obtained as shown in Table 7 below, where St represents standard, Rf represents risk factor; and H, M and L represent the evaluation level respectively.
Table 7.
Risk factor multiple judgment matrix.
3.2.3. IPC-CM Assessment
The conventional risk assessment matrix, which assesses risk only qualitatively, has the problem of boundary uncertainty, and the rating process has no scientifically sound uncertainty reasoning mechanism. This paper adopts the IPC-CM model for risk grading. The method further evaluates and sorts the screened risk factors.
This paper uses the IPC-CM model to cloud R, P, and C to generate the expectation , entropy , and super-entropy numerical features corresponding to each rank. The softened scores of the index levels were achieved. The clouding results are shown in Table 8, and the corresponding cloud model is shown in Figure 5.
Table 8.
P, C, and R grade cloud model.
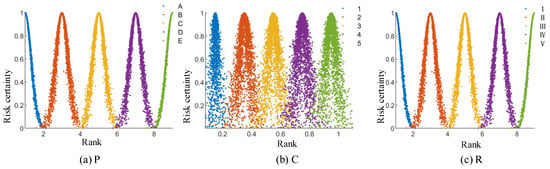
Figure 5.
P, C, and R cloud model diagrams.
Based on the multiple judgment data in Table 4 and the IPC-CM model, the new numerical features and rankings were obtained using Equations (2)–(13). The results are shown in Table 9:
Table 9.
Numerical characteristics of risk factors.
The cloud model of the above 16 risk factors is sorted and screened, and the standard cloud plots before and after filtering are shown in Figure 6.
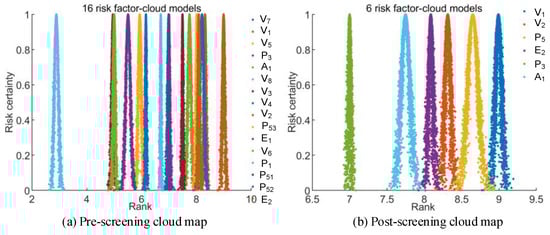
Figure 6.
Before and after screening cloud map.
According to the sorting provided in Table 9 and the filtered data provided in Figure 6b, the six most critical risk factors in flight training are selected, namely P3, P5, A1, V1, V2, and E2. The other risk factors with low-risk values are screened out, which does not mean that pilots are not concerned about them, but compared with risk factors with high-risk values, pilots should follow the principle of attention distribution.
Based on this filtering, the coupled scenarios of key risk factors are further analyzed and evaluated based on the HHM framework and holographic theory. The critical flight risk HHM-PAVE sub-framework is shown in Figure 7.
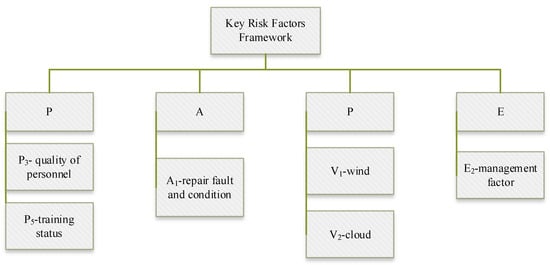
Figure 7.
HHM-PAVE sub-framework.
3.2.4. N-K Coupling Risk Scenario Assessment
Risk coupling is performed according to the six key risk factors under the above HHM sub-framework. This paper considers the coupling of four subsystems and obtains 16 coupling scenarios. The coupling probabilities of risk factors are calculated by Table 5. The results are shown in Table 10.
Table 10.
One-factor, two-factor, multi-factor coupling probability.
Here, O-C represents one-factor coupling, T-C represents two-factor coupling, M-C represents multi-factor coupling, Pr represents probability, and represents the probability of occurrence when the pilot and aircraft are not involved in the coupling.
According to the risk coupling probability data in Table 10 and Equations (14)–(16), the risk values of each coupling scenario are calculated, respectively, as follows: T(PA) = 0.3635; T(PV) = 0.4173; T(PE) = 0.0395; T(AV) = 0.1953; T(AE) = 0.0067; T(VE) = 0.0914; T(PAV) = 0.6939; T(PVE) = 0.4194; T(PAE) = 0.3572; T(AVE) = 0.2480. From the ranking result of risk coupling, T(PAVE) > T(PAV) > T(PVE) > T(PAE) > T(AVE) > T(PV) > T(PA) > T(AV) > T(VE) > T(AE) > T(VE), where the coupling risk value is the largest , followed by and finally .
3.2.5. Quantitative Evaluation of Bayesian Probabilities
Based on the above-identified risk coupling situation, an example analysis is carried out for a pilot of an aviation school to perform a specific flight mission. First, by collecting relevant historical data and consulting the flight safety accident statistical database, the frequency of various accidents and the influencing factors leading to them are analyzed to determine the prior probability of risk factors. For example, the priori probability of a flight accident occurring when a pilot is poorly trained is 0.80. Second, from the system theory perspective, combined with the PAVE hazard identification framework and decision makers, expert experience strengthens comprehensive judgment. When a pilot is well trained, the likelihood of a flight accident due to operational error or lack of knowledge is still higher, with a conditional probability of 0.25. According to Equations (17)–(19), the posterior probability is calculated as 0.5714, and the posterior probabilities of the other risk factors are obtained similarly, as shown in Table 11:
Table 11.
Flight training risk probability.
The coupling effect of the six risk factors under the HHH sub-frame is analyzed through Table 11. This paper mainly evaluates the two-dimensional risk coupling scenario. According to Equation (20), the risk degree of the two-dimensional risk scenario is obtained, as shown in Table 12. Generally, a risk degree higher than 0.05 is considered high for two-dimensional risk scenarios.
Table 12.
Risk of two-dimensional risk coupling scenarios.
From the above calculation, it can be seen that there are five risk scenarios with a risk degree exceeding 0.05, which, respectively, reflect the three main risk coupling scenarios of risk management in this flight mission, namely pilot human factors–environmental factors, human factors–aircraft factors, and aircraft factors–environmental factors. The main risk scenario includes a total of five risk coupling sub-scenarios, of which the top three key coupling sub-scenarios are P5⊙V1, P5⊙A1, and A1⊙V1, with risk degrees of 0.25324, 0.23644, and 0.18339, respectively. Pilot training, wind, and aircraft conditions are the critical risk factors for coupling, indicating that in flight training, the quality of pilot training will directly affect the risk value. In the case of poor flight training and other risks, the risk value in this scenario is high, and flight accidents are very likely to occur.
4. Results and Discussion
The proposed model firstly obtained all risk factors by risk identification, secondly ranked risk screening by the IPC-CM model, and finally output the final risk values by the N-K model and Bayesian formula. The following results were obtained and discussed.
(1) Regarding the research involving screening filtering and ranking in the RFRM method, the IPC-CM model is proposed, which abandons the traditional purely qualitative way of risk matrix assessment and takes advantage of the cloud model in terms of the uncertainty of subjective perception. Based on cloud theory, cloud vertices, ranges and thicknesses are used to show the risk value of risk factors visually. The cloud model obtained by this method is scientific, intuitive, and easy to understand. Figure 8 shows the results based on the IPC-CM, which achieves a further division of the same level in the traditional risk matrix assessment []. Figure 8a–f reflects the risk value of risk factors under different levels. As a result, a preliminary screening assessment algorithm for systemic risk is formed.
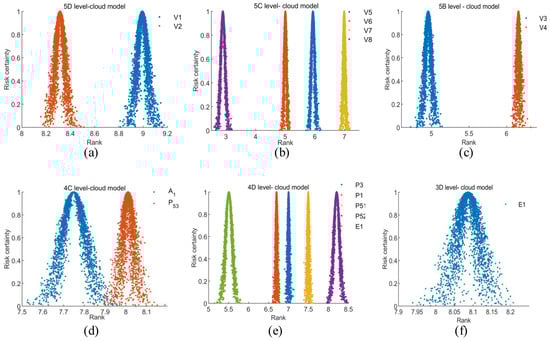
Figure 8.
Risk factor cloud model.
(2) Regarding the quantitative assessment of coupling scenarios in RFRM, Table 13 shows that the risk value increases with the increase in coupling factors, T4 > T3 > T2. Table 12 reveals the key coupled risk scenarios and their hazard levels in flight training risk management. The results show that when P5⊙V1, P5⊙A1, and A1⊙V1 factors are coupled, the risk values are large, 0.25324, 0.23644, and 0.18339, respectively—much higher than the high-risk level of 0.05. Among them, the pilot and environment coupling have the highest number and enormous risk value, which fully confirms that the pilot is still the primary cause of current flight training accidents []. At the same time, the findings show that the number of aircraft conditions involved is low, but the risk value is also high. Although the leading cause of flight accidents is no longer early mechanical failures, the degree of severe consequences caused by aviation equipment has not decayed in the slightest [], so the risk value is still high. In addition, when pilot-related risk values are high, the quality of trainee flight training should be subsequently enhanced, and when environmental involvement risk values are high, the meteorological safety of training flights should be strengthened. In conclusion, the assessment results guide the key direction of flight training risk management.
Table 13.
Risk coupling value at risk.
In terms of overall flight training risk management, according to the final assessment results in Table 12, it is evident that the pilot training situation participates in a high number of couplings and has an increased risk of the coupled with other threats, implying that the management of the pilot training situation at the flight school is becoming more and more critical. In the study results, wind and aircraft condition factors also have higher risks of coupling with other threats. However, in the actual training process of domestic flight schools, the focus is still only on the operational skills of the aircraft, and most of the risks are often managed by the instructors on behalf of the pilots, although the risk values are significant. The perspective is prone to cause pilot dependency psychology [] and to cause the Dunning–Kruger effect []. As China has entered the stage of high-quality development, reducing costs, increasing revenue, and improving efficiency will inevitably lead to the emergence of the adverse effects of risk overlap. In civil aviation flight safety, without a set of scientific risk identification and assessment methods, it is difficult to truly grasp the policy of moving forward the gate, controlling at source, and implementing prevention-oriented and comprehensive management to conduct scientific risk management. This paper fully demonstrates the existence of such critical risks from risk management identification and assessment. It also reflects the inadequacy of risk management in domestic flight schools. The aim is to systematically learn risk identification and assessment methods from the initial training theory stage, develop pilots’ risk management capabilities, and enable them to autonomously identify risks, assess them, and eventually control them. This paper provides a new risk identification and assessment methodology to facilitate pilots’ scientific risk management. More importantly, as risk management is one of a pilot’s core competencies for flight school, the method can provide a positive reference for the development of risk management core competency of pilots by continuous identification, screening and assessment.
5. Conclusions
In this paper, a new HHM-RFRM risk identification and assessment method has been proposed. Based on the assessment results, the conclusions are as follows:
(1) Research on risk identification in HHM proposes the HHM-PAVE framework construction method. HHM iterative ideas address the holistic, logical aspects of system risk. The Delphi method reduces individual cognitive errors (randomness), while the PAVE framework enables pilots to reduce their workload and identify risk factors more clearly. The HHM-PAVE framework solves the fuzzy logic problem between risk factors in the existing text classification, making the identified risk factors more comprehensive and objective.
(2) Research on risk assessment, based on the uncertainty of qualitative evaluation and system resistance, proposed the CR-HM model, which uses the IPC-CM model to complete a more scientific ranking of risk factors and screening. The method based on risk factors can more objectively integrate system resistance. This method takes into account not only the likelihood of accidents caused by risk factors and the severity of the consequences but also the resistance of the overall system to the risk factors. The CM model obtained by this method is significantly lower than the traditional CM algorithm in En and He, solving the uncertainty of human cognition in the qualitative risk assessment matrix and making the assessment results more scientifically segmented and intuitive. The introduction of the N-K model and Bayes’ theorem in the coupled risk scenario is utilized to realize the quantitative assessment of the coupled scenario hazard degree.
(3) A new HHM-RFRM methodology is proposed for the overall risk identification and assessment. A case study including a flight training mission is conducted to identify key risk factors and coupled risk scenarios, assess their hazard levels, and identify weaknesses in risk management. The method can help pilots identify key risk factors; evaluate the degree of risk; help pilots establish a scientific approach to risk management; effectively improve the efficiency of risk prevention and control management; improve the development of core competency of pilots; and enhance risk management in domestic flight schools.
Future research will start with the risk identification of specific scenarios and further analyze the intrinsic mechanism of coupled risk scenarios and the impact on critical aspects of pilots. Based on the digital risk management platform, a pilot-oriented risk assessment and decision support model will be constructed to ensure flight training safety further.
Author Contributions
Conceptualization, F.Y. and H.S.; methodology, F.Y. and P.Z.; software, F.Y. and P.Z.; validation, F.Y. and Y.Z.; formal analysis, F.Y. and H.S.; writing—original draft preparation, F.Y.; writing—review and editing, F.Y. and P.Z.; supervision, H.S.; project administration, H.S. All authors have read and agreed to the published version of the manuscript.
Funding
This research was funded by the Key Project of the Civil Aviation Joint Fund of the National Natural Science Foundation of China (U2033213), the Special Project on Flight Technology (FZ2022ZX50) of the Key Laboratory of Civil Aviation Flight Technology and Flight Safety, and the Independent Project of the Research Base of Civil Aviation Flight Technology and Flight Safety (FZ2021ZZ01).
Institutional Review Board Statement
Not applicable.
Informed Consent Statement
Informed consent was obtained from all subjects involved in the study.
Data Availability Statement
All the data contained in this study can be obtained upon request to the corresponding author. Readers can also request part of the original data and the results of data processing in this paper.
Acknowledgments
The authors thank everyone who contributed to the article.
Conflicts of Interest
The authors declare that they have no conflict of interest to report regarding the present study.
References
- ASN Safety Databases. Available online: https://aviation-safety.net/database/databases.php (accessed on 4 January 2022).
- Zhang, W.-J.; Zhang, Y.-J.; Zhang, C. Intelligent ship navigation risk identification and screening based on HHM-RFRM method. J. Saf. Environ. 2022, 1–10. [Google Scholar]
- Oster, C.V., Jr.; Strong, J.S.; Zorn, C.K. Analyzing aviation safety: Problems, challenges, opportunities. Res. Transp. Econ. 2013, 43, 148–164. [Google Scholar] [CrossRef]
- Shyur, H.-J. A quantitative model for aviation safety risk assessment. Comput. Ind. Eng. 2008, 54, 34–44. [Google Scholar] [CrossRef]
- Sun, R.; Shi, R. Analysis of Civil Aviation Communications Error Events Based on SHEL Model. In Proceedings of the ICTIS 2011: Multimodal Approach to Sustained Transportation System Development: Information, Technology, Implementation, Wuhan, China, 26 April 2011; pp. 2115–2121. [Google Scholar]
- Reason, J. Human error: Models and management. BMJ 2000, 320, 768–770. [Google Scholar] [CrossRef]
- Hirose, T.; Sawaragi, T.; Horiguchi, Y.; Nakanishi, H. Safety analysis for resilient complex socio-technical systems with an extended functional resonance analysis method. Int. J. Astronaut. Aeronaut. Eng. 2017, 2, 1–18. [Google Scholar]
- Walker, M.; Papadopoulos, Y. Qualitative temporal analysis: Towards a full implementation of the Fault Tree Handbook. Control. Eng. Pract. 2009, 17, 1115–1125. [Google Scholar] [CrossRef]
- Zhu, J.; Liu, B.; Dong, P.; Zeng, L. Quality-Risk Identification and Screening of Aircraft Major Overhaul Project Based on HHM-RFRM. In Proceedings of the Journal of Physics: Conference Series, Harbin, China, 8–10 January 2021; p. 012194. [Google Scholar]
- Liu, H.; Chen, G.; Lin, Z. Risk Assessment and Management of National Defense Engineering Construction Based on HHM-RFRM. IOP Conf. Ser. Mater. Sci. Eng. 2020, 780, 072026. [Google Scholar] [CrossRef]
- Shi, D.; Guan, J.; Zurada, J.; Manikas, A. A data-mining approach to identification of risk factors in safety management systems. J. Manag. Inform. Syst. 2017, 34, 1054–1081. [Google Scholar] [CrossRef]
- Wu, P.F.; Duanmu, J.S.; Du, J.Y.; Yang, J.; Zhang, C. Risk factor identification and classification of flight safety based on fault tree approach. In Proceedings of the International Conference on Mechatronics and Control Engineering (ICMCE 2012), Guangzhou, China, 29–30 November 2012; pp. 2232–2237. [Google Scholar]
- Paltrinieri, N.; Dechy, N.; Salzano, E.; Wardman, M.; Cozzani, V. Towards a new approach for the identification of atypical accident scenarios. J. Risk Res. 2013, 16, 337–354. [Google Scholar] [CrossRef]
- Gray, G.; Bron, D.; Davenport, E.D.; d’Arcy, J.; Guettler, N.; Manen, O.; Syburra, T.; Rienks, R.; Nicol, E.D. Assessing aeromedical risk: A three-dimensional risk matrix approach. Heart 2019, 105, s9–s16. [Google Scholar] [CrossRef]
- Tamasi, G.; Demichela, M. Risk assessment techniques for civil aviation security. Reliab. Eng. Syst. Saf. 2011, 96, 892–899. [Google Scholar] [CrossRef]
- Chen, Y.; Xiong, S.; He, Q.; Zhan, T. NK model based analysis of risk coupling in civil aviation maintenance unsafe events. China Saf. Sci. J. 2018, 28, 104. [Google Scholar]
- Wu, F.; Mu, H.; Feng, S. Analysis of the Risk of Air Traffic Controllers’ Fatigue Based on the SHEL Model. In Proceedings of the ICTE 2015, Dalian, China, 21 September 2015; pp. 2951–2958. [Google Scholar]
- Wang, L.; Sun, R.; Yang, Z. Analysis and evaluation of human factors in aviation maintenance based on fuzzy and AHP method. In Proceedings of the 2009 IEEE International Conference on Industrial Engineering and Engineering Management, Hong Kong, China, 8–11 December 2009; pp. 876–880. [Google Scholar]
- Guan, D.; Guo, P.; Hipel, K.W.; Fang, L. Risk reduction in a project portfolio. J. Syst. Sci. Syst. Eng. 2017, 26, 3–22. [Google Scholar] [CrossRef]
- Guan, D.-J.; Guo, P. Project portfolio risk components and analysis from a complex systems perspective. Modern. Manag. 2015, 35, 90–92. [Google Scholar]
- Ming-hong, Z.; Lian, S.; Bo, G. Research on the Similarity of the Structured Emergency Events Based on Scenario. Chin. J. Manag. Sci. 2017, 25, 151–159. [Google Scholar]
- Alwi, A.; Ariffin, K.A.Z. Information Security Risk Assessment for the Malaysian Aeronautical Information Management System. In Proceedings of the 2018 Cyber Resilience Conference (CRC), Putrajaya, Malaysia, 13–15 November 2018; pp. 1–4. [Google Scholar]
- Yantao, W.; Jianxun, T.; Yifei, Z. Coupling analysis of risk factors in flight operation. China Saf. Sci. J. 2017, 27, 77. [Google Scholar]
- Dan, P.; Yong-zhou, L.; Fan, L. Aircraft operational safety risk coupling based on N-K model. J. Saf. Environ. 2022, 22, 606–614. [Google Scholar]
- Luo, F.; Liu, T.-Q. Analysis of Coupled Risk of Air Traffic Safety Based on N-K Model. J. Wuhan Univ. Technol. (Inform. Manag. Eng.) 2011, 33, 267–270. [Google Scholar]
- Kaplan, S.; Haimes, Y.Y.; Garrick, B.J. Fitting hierarchical holographic modeling into the theory of scenario structuring and a resulting refinement to the quantitative definition of risk. Risk Anal. 2001, 21, 807. [Google Scholar] [CrossRef] [PubMed]
- Haimes, Y.Y.; Kaplan, S.; Lambert, J.H. Risk filtering, ranking, and management framework using hierarchical holographic modeling. Risk Anal. 2002, 22, 383–397. [Google Scholar] [CrossRef] [PubMed]
- Lambert, J.H.; Ling, C.W.; Haimes, Y.Y. Remediation site prioritization by the risk ranking and filtering method. In Proceedings of the Risk-Based Decision Making in Water Resources V, Santa Barbara, CA, USA, 3–8 November 1991; pp. 311–321. [Google Scholar]
- Kaplan, S.; Garrick, B.J. On the quantitative definition of risk. Risk Anal. 1981, 1, 11–27. [Google Scholar] [CrossRef]
- Ruiz, L.E. Risk Analysis, Pilot Motivation, and Decision-Making: Application of the PAVE Personal Minimums Checklist to Pilot Decision-Making in Three General Aviation Accidents. Colleg. Aviat. Rev. Int. 2001, 19, 121–139. [Google Scholar] [CrossRef]
- Matalas, N.C.; Fiering, M.B. Water-resource systems planning. In Climate, Climatic Change, and Water Supply. Studies in Geophysics; Bryson, R.A., Ed.; National Academy of Sciences: Washington, DC, USA, 1977; pp. 99–110. [Google Scholar]
- Li, D.; Liu, C.; Gan, W. A new cognitive model: Cloud model. Int. J. Intell. Syst. 2009, 24, 357–375. [Google Scholar] [CrossRef]
- Liu, Y.; Li, D. Statistics on atomized feature of normal cloud model. J. Beijing Univ. Aeronaut. Astronaut. 2010, 36, 1320. [Google Scholar]
- Xian-guo, W.; Hai-zhou, Z.; Li-mao, Z.; Ya-wei, Q.; Yan-hong, W. Improved R = P × C Risk Evaluation Method Based on Cloud Model. J. Civ. Eng. Manag. 2014, 31, 37–42. [Google Scholar]
- Zhang, L.; Wu, X.; Chen, Q.; Skibniewski, M.J.; Zhong, J. Developing a cloud model based risk assessment methodology for tunnel-induced damage to existing pipelines. Stoch. Env. Res. Risk A 2015, 29, 513–526. [Google Scholar] [CrossRef]
- Yuan, Z. Study on Risk Quantitative Assessment Model for Civil Aviation Safety. China Saf. Sci. J. 2007, 17, 140–145. [Google Scholar]
- Kob, W.; Andersen, H.C. Testing mode-coupling theory for a supercooled binary Lennard-Jones mixture I: The van Hove correlation function. Phys. Rev. E 1995, 51, 4626. [Google Scholar] [CrossRef]
- Efron, B. Bayes’ theorem in the 21st century. Science 2013, 340, 1177–1178. [Google Scholar] [CrossRef]
- Kelly, D.; Efthymiou, M. An analysis of human factors in fifty controlled flight into terrain aviation accidents from 2007 to 2017. J. Saf. Res. 2019, 69, 155–165. [Google Scholar] [CrossRef]
- Eliaz, N.; Latanision, R.M. Preventative maintenance and failure analysis of aircraft components. Corros. Rev. 2007, 25, 107–144. [Google Scholar] [CrossRef]
- Wang, M. The Impact of Cultural Values on Chinese Students in American Higher Education. Qualit. Rep. 2016, 21, 611–628. [Google Scholar] [CrossRef]
- Kruger, J.; Dunning, D. Unskilled and unaware of it: How difficulties in recognizing one’s own incompetence lead to inflated self-assessments. J. Pers. Soc. Psychol. 1999, 77, 1121–1134. [Google Scholar] [CrossRef] [PubMed]
Disclaimer/Publisher’s Note: The statements, opinions and data contained in all publications are solely those of the individual author(s) and contributor(s) and not of MDPI and/or the editor(s). MDPI and/or the editor(s) disclaim responsibility for any injury to people or property resulting from any ideas, methods, instructions or products referred to in the content. |
© 2023 by the authors. Licensee MDPI, Basel, Switzerland. This article is an open access article distributed under the terms and conditions of the Creative Commons Attribution (CC BY) license (https://creativecommons.org/licenses/by/4.0/).