Article

Assessment of Urban Green Open Spaces of Micro- and Meso-Level Zones, Based on the Growth Pattern: Case of Patna City

Department of Architecture and Planning, National Institute of Technology Patna, Patna 800005, India
*
Author to whom correspondence should be addressed.
Sustainability 2023, 15(2), 1609; https://doi.org/10.3390/su15021609
Submission received: 26 November 2022 / Revised: 1 January 2023 / Accepted: 5 January 2023 / Published: 13 January 2023

Abstract

:
India’s urban population increase is creating pressure on the urban green open spaces. The overall city-level per capita open space is considered as a benchmark of the open space. The open space of Patna is 2.43 sq m per capita, but at the community level or ward level, there is a lacuna. So, there is a significant gap in open space distribution at the city level and the micro level, that is, ward or block level. An assessment was carried out on three parameters, i.e., quantity, accessibility, and quality. Open space, catchment area, and vegetation cover were used as independent variables, and population density and ward area as dependent variables, to understand the distribution at the ward level, that is, community level. Distribution was analyzed by Pearson correlation between the independent and dependent variables within three parameters. The open space distribution between three meso-level areas based on the growth pattern was analyzed with the help of linear regression and R-squared tests to compare the distribution between the areas. The result shows that Patna has poor distribution in the old and new areas. The developed areas in between have good distribution at the micro level and meso level. Patna has 2.3 sq m per capita as per the proposed open space plan and projected population of 2030, which is less than the standard 3.16 sq m/capita at the community level and 3.66 sq m/capita at the district level.

1. Introduction

Urban green open spaces play a significant role in any city development as they provides an opportunity for physical activity, social interaction, and enjoyment of nature, and offer a unique environmental setting within the urban area and, most notably, the urban ecology [1]. Different disciplines have used various definitions from their professional concept for urban green open spaces, such as horticultural green land system, urban green land system, ecological green land system, and urban green space, green open space, and urban green open space [2,3]. All open spaces which are publicly accessible are referred to as public open spaces, including green or civic. Moreover, in many definitions, urban green space is all types of public or private open spaces in urban areas that are entirely or mostly covered with vegetation [4,5]. Urban green open spaces, as per Wang [3], are considered vegetation-covered public areas used for social interaction and physical activity. As urban green spaces have multiple definitions, in this paper, the definition of urban green open space can be understood as urban open spaces having vegetation and accessible to the public. It refers to the human-built environment, such as an urban park, garden, or any green space, and serves for community needs, social interaction, and joint activities [6]. It is combination of the term urban green space, which comprises areas covered with vegetation, and public open space, which is a publicly accessible part of urban land and contributes to the urban landscape [3,5,6]. It constitutes the most crucial component of urban spaces as it comprises parks, forests, playgrounds, riparian areas such as riverbanks, lakes, green promenades, trails, and nature conservation areas [2,7,8]. It helps mitigate the heat island effect in urban areas with the help of evapotranspiration and shading effects [9,10]. It helps in improving air quality, flood control, and reducing noise pollution [11,12]. The urban green open space can also refer to an urban open space. It has a similar definition in terms of uses, but it is limited to the areas with green cover in the urban open space that is publicly accessible [5,6].
Urban green open spaces provide many functions in an urban context that benefit people’s quality of life [13]. Despite knowing the importance and benefits, such as physical, psychological, social, environmental, and economic benefits [14], urban green open spaces there will be a shortage due to rapid urbanization and an increase in the population [14]. Urban green open spaces are very vulnerable due to the sudden loss of vegetation cover and change in vegetation in the built-up areas in Indian cities [15,16]. This built-up area is increasing and will be continue to increase at a rapid pace. The problem can be seen with the help of demographic change projection for the future. This says that the urban population is projected to increase by 18.5% from 35% in 2020 to 53.5% in 2050 [17], which tells that more than half of the population will live in urban areas by 2050 in India (see Table 1). This change will affect the urban agglomeration and increase the population density from 464 people/km2 in 2010 to 550 people/km2 in 2050. The number of cities with a population of at least a million in India increased from 35 in 2001 to 53 in 2011, and there will be six cities with a population over 10 million and more than 100 cities with a population of at least a million by 2030 [18]. By 2050, India will be the most populous country in the world [17].
These demographic changes have resulted in a significant decrease in green spaces across many cities in India and they are further decreasing with growing urbanization and population increase [19]. The loss of green spaces and environmental degradation are likely to increase due to an increase in population and density. There is a lack of per capita availability of urban green open spaces in most Indian cities [20]. Indian megacities such as Bangalore, Hyderabad, and Kolkata have lost many open spaces, urban wetlands, and water bodies because of urban sprawl [16,20]. It has been observed that this pressure of urbanization and population increase is greater on the older cities and settlements. As per the study by Rao and Kumar, the old core area of a city has less open space because of population pressure compared to the new areas. Additionally, it is not adequately distributed [21,22]. The open space standard should be fulfilled on different levels, such as community, district, and city levels, as per Urban and Regional Development Plans Formulation and Implementation (URDPFI) guidelines in India [23]. However, the open space assessment is per capita, not focusing on the distribution in all levels in Indian cities [24]. A lot of qualitative and quantitative research has been carried out to assess urban green open spaces in cities such as Nagpur, Bhopal, Delhi, Kolkata, and Bangalore [8,16,22,25]. As per Senik [26], a qualitative evaluation has been carried out for the open green space planning approach. Ahirrao carried out an assessment, and the qualitative approach has been assessed based on perception and was limited only to the parks of Nagpur [8]. In India, quantification and distribution of UGS have not been fully incorporated in urban planning due to a lack of detailed assessment [27]. A limited study has been carried out on the quantitative change in urban green space with urbanization. In addition, the study shows the urban green change based on remote sensing with an assessment based on the green cover LULC change [16]. A very limited study was carried out to assess the urban green open space as per the definition given in the paper. Moreover, no assessment study has been carried out in Indian cities on urban green open space based on the growth pattern and the identified parameters. The assessment of only the green cover will not give the actual picture as some urban green open spaces can fall into private or restricted areas. Moreover, they might not be accessible to the public for social interaction and physical activities, as defined in this paper. A quantitative and qualitative assessment study of urban green open spaces has yet to be carried out based on the city’s growth pattern, especially for older and tier 2 metro cities. This study is required to understand the open space distribution of an Indian city at different levels (micro and meso level) and assess the distribution with respect to the city’s growth.
The main aim of this research is to assess the open space at the micro and meso level of a city based on the growth pattern.
To assess urban green open space, it is required to understand the standards related to urban green open space and assessment parameters in India and abroad. As per the Urban Green Guideline 2014 by the Government of India, classification is carried out based on hierarchy and uses, which are reserved forest, protected forest, national park, district park, playground, green belt buffer, and green strip. As per the URDPFI guideline, the city should have 31.6 hectares of open space per a population of one lakh for the community level, which will be 3.16 m2/capita, and 183 hectares of open space per a population of five lakh for the district level, which will be 3.66 m2/capita. In addition, the metropolitan city should have 20–25% green areas, including recreational space, organized green space, and other common open spaces, including vacant land, open spaces including flood plains, etc. [23].
India and many Asian countries follow the quantitative assessment standard, which is the per capita green space, unlike other European, Australian, and American countries that also follow accessibility and quality for their assessment [24]. In Britain, as per the National Playing Field Association (NPFA), it is 24 m2 per capita, and in the USA as per the National Recreation Park Association standard, 40 m2 per capita is required. As per LEED-ND, more than 20 m2/capita or 1.25 hectares/1000 residents within 250 m should be provided. The WHO standard recommends 9 m2/capita.
As per a study by Dhanpal in 2014, regarding the per capita green space in major cities in India, only a few have been able to provide more per capita green space than the international standard. Jaipur (20 m2/capita), Gandhinagar (147 m2/capita), Chandigarh (54.45 m2/capita), and Bangalore (17.79 m2/capita) are among the few cities which have higher than standard open space requirements [19].
In terms of the assessment parameters, as in India, open space assessment is carried out on a quantity basis that is derived from population and area concerning open space [7,23,28]. However, when we compare with other European, Australian, and American countries they also assess the open space based on quantity, that is, per capita open space [19,20,23,24], and also accessibility, that is, the catchment area of the open space [19,24], and the served population and the quality, that is, the healthy vegetation cover [24,25]. The problem of lack of availability of open space is not limited to the tier 1 megacities such as Bangalore, Hyderabad, Kolkata, and Delhi, as it is also seen in tier 2 metro cities, and Patna is not an exception [13,20,21,22].
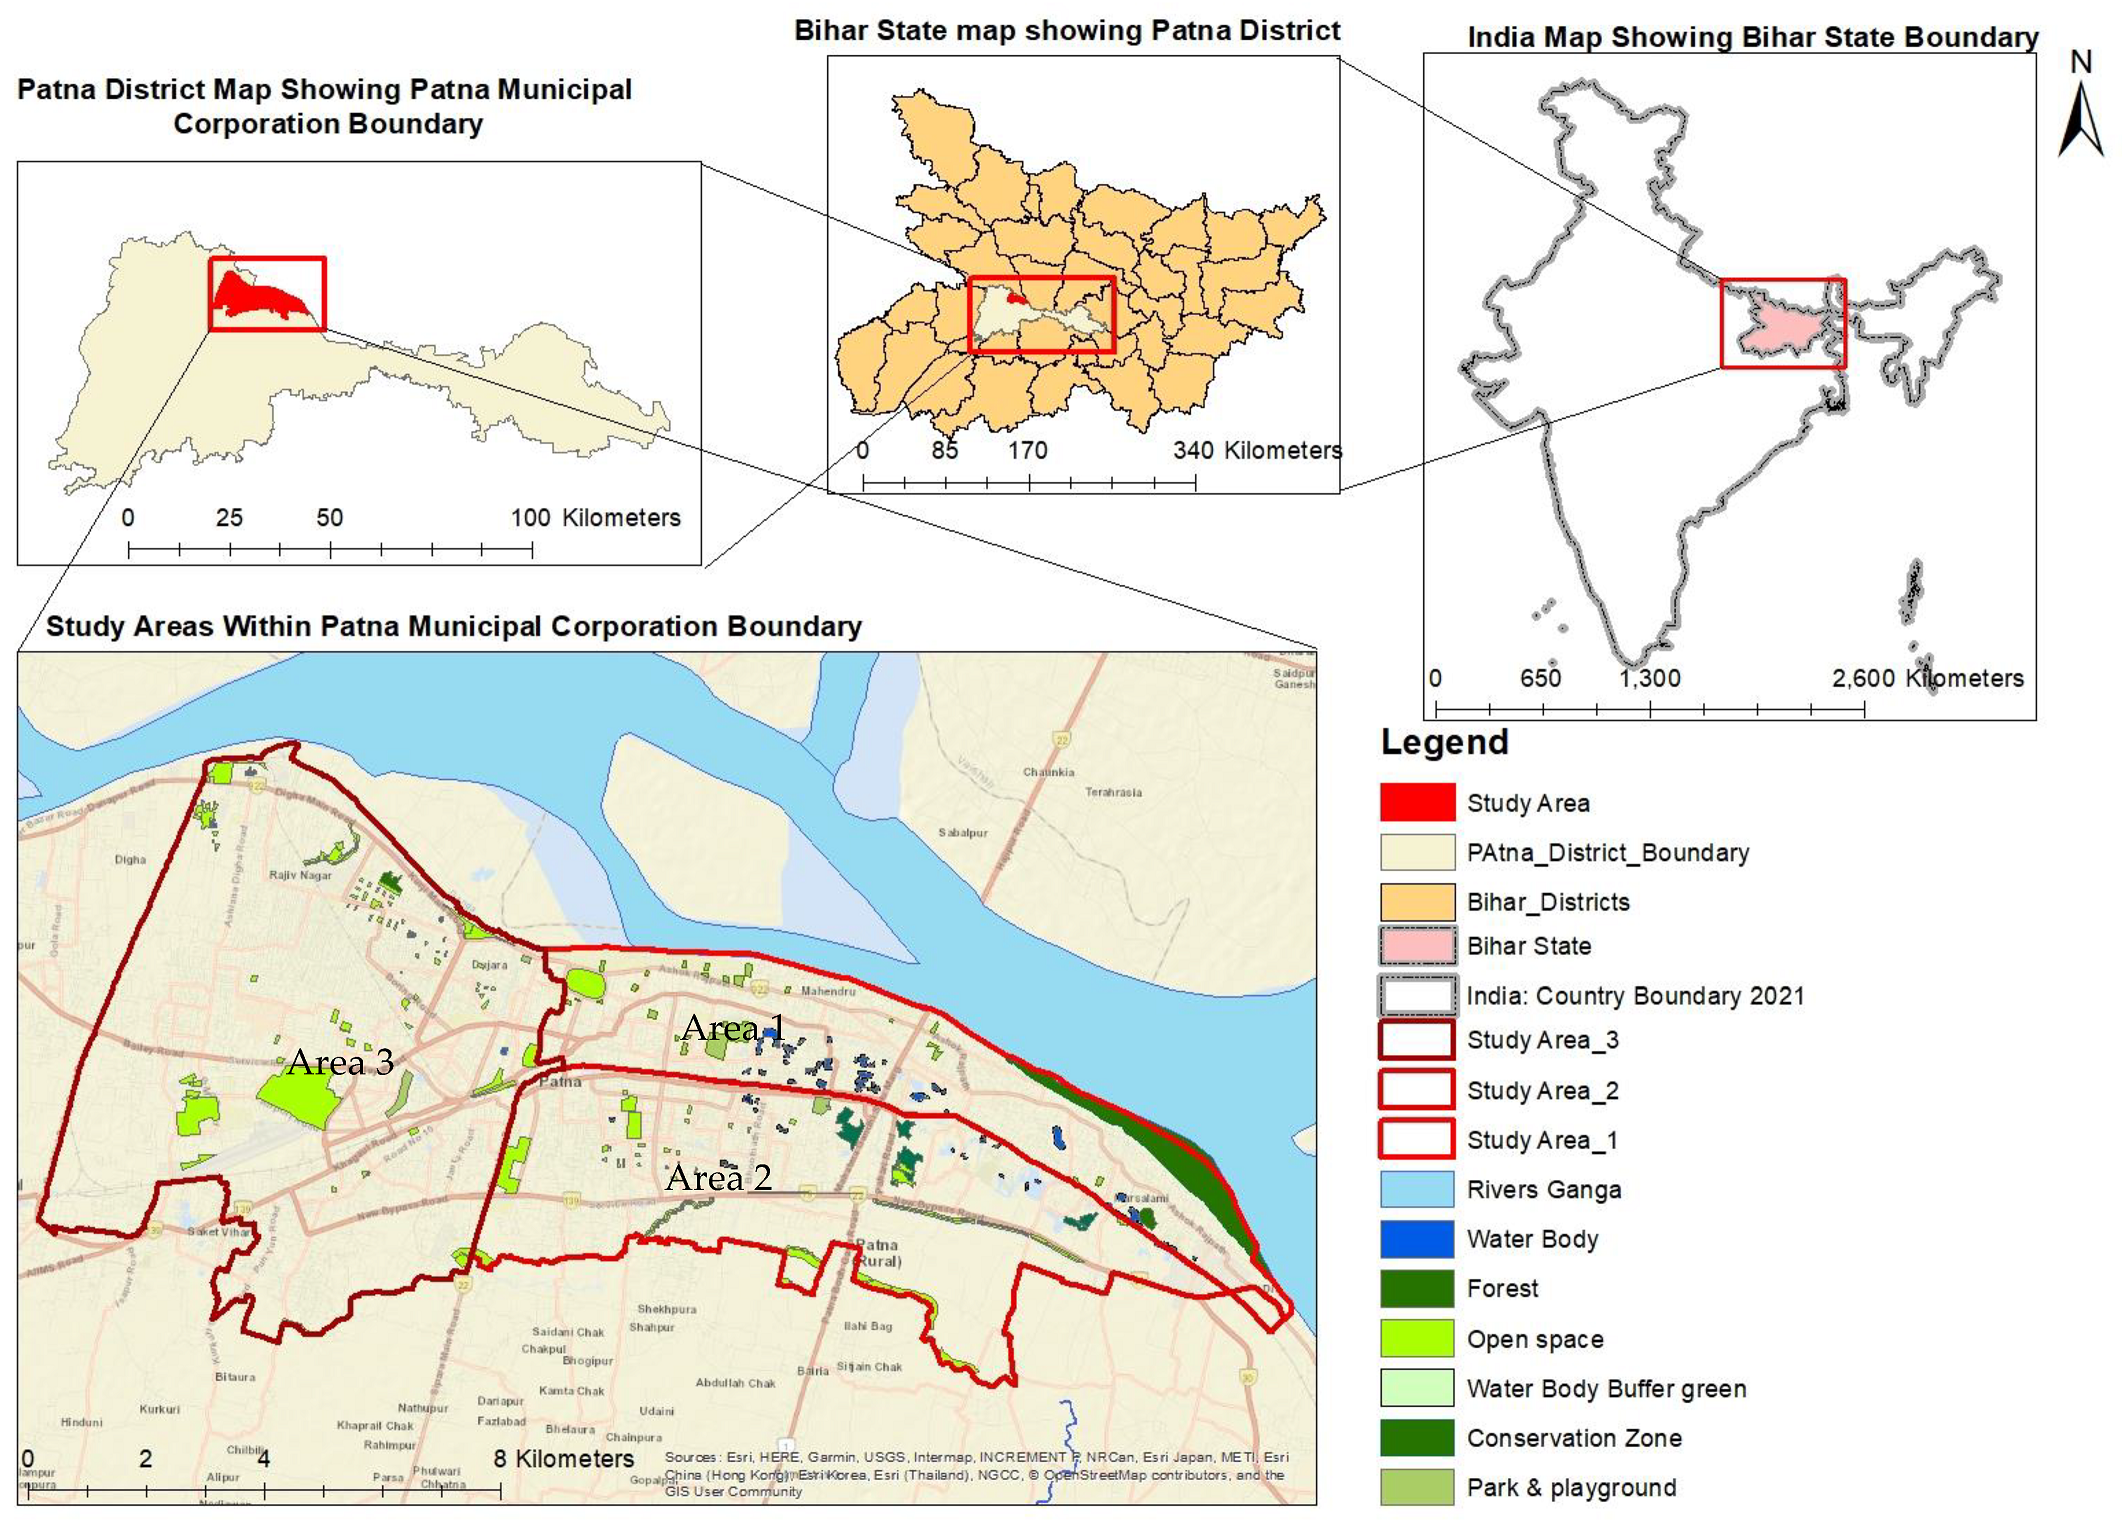
The Patna Municipal Corporation area has a population of 1,684,222, and an area of 108.164 km2 which has risen 48.97% from 1991 to 2001 and 32.53% from 2001 to 2011 [18]. In the study carried out by Asraf and Ghose in 2015, the urban green space was reduced to 16.28 km2 in 2014 from 50.4 km2 in 1993 [13]. This study showed the green cover, which also included private land. Patna has lost many green spaces and water bodies in the past few decades because of encroachment and urban sprawl [13,21]. As per the existing master plan, the per capita green space is 2.43 m2 per capita [28]. This 2.43 m2 per capita open space shows the overall open space of Patna; at the micro level, we can see fewer open spaces in the core city area compared to the new areas [21], which means some areas will have less than 2.43 m2 per capita of open space. Patna City in context with open space is shown in Figure 1.
As per a study by Kumar, the distribution of open space is missing for Patna City. Additionally, as per Rao and Kumar, their study shows that the core city area of older cities such as Patna and Bhopal has less open space because of population pressure than outgrowth or new areas [21,22].
This this research suggests that because of increasing population pressure and urbanization, the open space standard is lower in the core city area or the old city area compared to the new development [21,22]. However, this research does not explain whether the changes are proportional to the change in the city’s growth pattern, and there is a need to understand the lack on the micro level (ward-wise) and meso level (zone-wise). In addition, the assessment parameter for the urban green open spaces especially in Indian cities is very limited to a quantitative approach, as per the study by Maharina [24] and other European and Australian countries, in which the open space assessment has to be carried out based on quantity, quality, and accessibility.
Based on the need for study, previous literature study, and the aim of this research, in this paper, we are trying to answer two questions based on the identified parameters:
  • What is the urban green open space distribution in Patna City?
  • Is urban green open space distribution based on the city’s growth pattern?

2. Study Area

The study area selected is Patna City within Patna Municipal Corporation. Patna is the capital of the state of Bihar of India, and it is located at 25°37′ north latitude and 85°10′ east longitude on the south bank of the River Ganges. Rivers Sone and Punpun also surround it. It has a humid subtropical climate with extremely hot summer in May and June, followed by the monsoon in July and August. It is also a sacred place for Sikhs for being the birthplace of the last Guru Govind Singh. Patna City is one of the oldest cities in India, whose history goes back to 600 BC [29], and it is the 19th largest urban agglomeration in India, having a population of 1,684,222 [18] and an area of 108.75 square km with a population density of 15,488 people per square kilometer. The study was carried out in three areas based on the city’s growth pattern at the meso level and ward-wise at the micro level (see Figure 2). The growth pattern is based on the city’s growth from the 18th century after the extension from the fort city of Shershah Suri. Then, the extension of 1912 of the south of the city, and then the extension towards the west [29]. Overlapping the growth pattern as per the British map and master plan zoning map within the study area, the meso-level zone is considered. The three areas are given names as per the growth pattern; the older area is Area 1, then Area 2, and the new area is Area 3. These areas are also demarcated based on the zones given in the Patna Master Plan 2031. Area 1, which is the old area, is demarcated as a special area, Area 2 is the special zone excluding the special area, and Area 3 excludes the special zone and is demarcated as Zone 2 within the Patna Municipal Corporation boundary in the Patna Master Plan (for a detailed study area map, see Figure 2).
The Patna Municipal Corporation areas have 75 wards. At the time of the last census in 2011, the total ward number was 72. However, now it is 75 as ward number 22 is further divided into 22, 22A, 22B, and 22C, and the census data have not been updated since then. For this study population, data were divided as per the area proportionate to ward 22, to understand the distribution for these wards.

3. Material and Methods

The data used in the study are secondary data from various sources such as population data, ward boundary data, Patna Master Plan, and Landsat 8 image for NDVI from USGS EarthExplorer. The details of the data collected and the source are given in Table 2.
There is a lack of census data, as the last census was in 2011, so the ward-wise data used for the correlation are from 2011, and the open space data are as per the latest master plan.

3.1. Methods

We have selected Patna based on three zones within the Patna Municipal Corporation (PMC) boundary, which also show the evolution pattern of the city. As per a report by the Institute of Human Development, the growth of Patna shows a growth pattern starting from the Patna City area (currently Patna City in the special area) on the eastern side, then towards the south (currently in the special zone), and a little bit towards the west, and then towards the west (currently Zone 2) [28,29]. The old city area in the city master plan has been earmarked as a special area, and Zone 1 (special zone) includes the special area [28]. This demarcation has been taken based on the current zones as per the Patna Master Plan 2031 [28]. The study area is restricted to the Patna Municipal Corporation boundary for the availability of ward-wise (for micro-level analysis) data, e.g., ward area and population data.
All three areas were selected and analyzed based on the assessment parameter, e.g., quantity, accessibility, and quality [19,24], taken from the literature study, and to find the relationship between the variables of those parameters within the individual areas and then between the three meso-level areas. This is to find out, based on the growth pattern, how the urban green open space is distributed within the individual areas (ward-wise) and different meso-level areas and to know how urban green open spaces are changing, based on the growth pattern identified along with the current zones within Patna Municipal Corporation.

3.2. Parameters

Quantity is taken based on the area of open space and per capita open space, which is normally derived from the open space area, the population of the area, and the total area [24,28]. The Green Space Scotland research report shows that green space within 5 min of walking is a strong indicator for good quality of health and life [30], and shows how many people can access green space with the help of population data and area [19,25]. Quality depends on biodiversity, green cover, and vegetation [19,25]. In this case, the healthy vegetation is NDVI value 0.3 and above, representing the tree canopy cover [31]. The parameters, variables, and tools used are given in Table 3.
Based on the literature, the selected parameters for the assessment of the urban green space of the study area are:
  • Quantity.
  • Accessibility.
  • Quality.
For analysis, two methods were used:
  • The first is the Pearson correlation which determines the strength and significance of the variables and analyzes the open space distribution [32,33] in relation to the area and population.
  • The second method is geographically weighted regression; it is a statistical approach to explore spatial non-stationarity of the regression relationship in spatial data analysis. It is determined by the variance in the dependent variable, which can be explained by the independent variable in spatial data form, and this helps in determining the adequate fit of the model, which helps in analyzing the parameters of different meso-level areas and the best fit within the given variables through spatial data [34].

4. Results

From the georeferenced Patna municipal boundary and open space map of the Patna Master Plan on ArcGIS, the parameters and variables to calculate the per capita open space, ward density, total open space, and the NDVI mapping with the Landsat 8 image (July 2022) to know the vegetation cover are given in Table 4.
One of the limitations of the study is that the population data were from 2011, as the new census for 2021 was not yet available from the Government of India. Additionally, acquiring the micro-level population data (ward level) was also not feasible as the number of wards as per the census in 2001 was 42, which has changed to 75 wards as per the latest 2021 data, and the ward boundaries and area have been changed since then. So, the regression and quantitative analysis were carried out on the basis of 2011 population data. However, to obtain the result of the current and future years, the assumption of population data was taken on the basis of the population projection of 2030 by the City Development Plan, only for the overall three areas of the meso level. The micro-level regression analysis was not possible because of the limitation in projecting the ward-level population due to the difference in the number of wards and area boundaries within the decade (2001–2011). For the meso-level analysis based on the quantity and accessibility, the city-level population projection data could be used. As per the City Development Plan 2010 and Patna Master Plan, the population of Patna will reach thirty lakh according to the linear method, so the growth percentage from 2011 to 2030 is 78.2% [35]. For the different study areas, population projection is given in Table 5.
Based on the population projection as per Table 5, Table 6 and Table 7, the per capita open space and served population based on the proposed open space map as per the Patna Master Plan 2031 were calculated.
As per data extracted from the secondary sources, the variables used in the study are total urban green open space, total area, population density, healthy vegetation cover, and open space per capita. The following data reveal that the special area has more than double the population density than the other two. However, it has mostly similar per capita open space compared to Area 3. Zone 2 has comparatively more per capita open space than the other two (Table 5). As per the projected population in Table 6 and Table 7, Area 2 (4.01 m2/capita) had a good amount of open space compared to Area 1 (2.5 m2/capita) and Area 3 (2.8 m2/capita) in 2021, but it has close to the standard open space for recreational use, that is, 3.13 m2/capita, for the 2030 projected population. Areas 1 and 3 have less than the standard open space requirement for recreational use for the projected population (see Table 6 and Table 7).
In terms of accessibility, more populations have access in Area 1 than Areas 2 and 3. The served population in Area 1 is 485,182 (73.82%), that of Area 2 is 246,299 (68.8%), and that of Area 3 is 32,1920 (48.3%). For the projected population of 2030, Area 2 serves 72%, then Area 1 serves 69%, and, finally, Area 3 serves 45% of the population. The served population is calculated by the following formula:
(Served Population = Population Density × Catchment Area).
The healthy vegetation cover was derived from remote sensing data of Landsat 8 in July 2022 with the help of the normalized difference vegetation index (NDVI). For the Landsat 8 image, band 4 and band 5 were used in the NDVI. The formula for the NDVI is:
(NDVI = Band 5 − Band 4/Band 5 + Band 4).
The healthy vegetation range was taken as 0.3 and above in supervised classification. As per the data from supervised classification, Area 3 has more vegetation than Areas 1 and 2.
This is for an overall understanding of the different meso-level areas based on different parameters. Now, the micro-level analysis at the ward level of all three meso levels is given, and the correlation between the variables for the given parameters is given in Table 8, Table 9 and Table 10.

4.1. Quantitative Analysis

This part of the analysis shows the correlation with the variables. We have used Pearson correlation analysis to check the correlation between variables and also the strength of the correlation. As discussed previously for selecting parameters, the independent variable is open space and the dependent variables are ward area and population density.
Ward area has a positive relationship in Zones 1, 2, and 3, with the open space having r = 0.58, 0.89, 0.45, respectively, whereas population density has a negative relationship with open space with r = −0.497, −0.615, −0.45, respectively (see Table 8). This shows that the open space area increases as the ward area increases, but it decreases as the population density increases. Open space’s negative relationship with population density shows that, in wards where the population is larger, the open space is smaller, so this has to improve. By comparing with the strength in the variables, in Zone 2, the strength of “r” is higher in both cases, then Zone 1, and then Zone 3. On the map (Figure 3), it is visible that many areas have less than the city-level per capita amount of open space, i.e., 2.4 m2/capita, especially in Area 3.
Table 8. Quantitative and correlation analysis of different Zones.
Between Ward Area (km2) and Urban Green SpaceBetween Ward Population Density (Thousands/km2) and Urban Green Space
Area 1 (special Area)Sustainability 15 01609 i001Sustainability 15 01609 i002
Pearson Coefficient r = 0.586351Pearson Coefficient r = −0.4673
Area 2 (Special zone- Special Area)Sustainability 15 01609 i003Sustainability 15 01609 i004
Pearson Coefficient r = 0.898147Pearson Coefficient r = −0.61522
Area 3 (Zone 2)Sustainability 15 01609 i005Sustainability 15 01609 i006
Pearson Coefficient r = 0.459012211Pearson Coefficient r = −0.45053642
Figure 3. Map of Per Capita ward-wise distribution of Patna. (Source: Census Of India—Population data, Patna Municipal Corporation ward boundary and corporation boundary and area, Master Plan 2031—open space location, map generated in ArcMap 10.4.1).
Sustainability 15 01609 g003

4.2. Accessibility Analysis

In terms of accessibility, ward area has a positive correlation in Area 1, Area 2, and Area 3, having r = 0.62, 0.96, and 0.51, respectively. Area 2 shows the high strength of open space catchment in the relationship with the ward area, followed by Area 1 and then Area 3. However, it shows a negative relationship with population density, i.e., Area 1 = −0.55, Area 2 = −0.72, and Area 3 = −0.37 (see Table 9). This shows that the density is higher in these areas and, compared to the density, the catchment area is smaller. Out of all three, Area 2 shows a stronger negative correlation than that of Area 1 and then Area 3. In Figure 4, we can see that the majority of areas in Area 3 have less than 50% of the served population.
Table 9. Accessibility and correlation analysis of different Zones.
Between Ward Area (km2) and Total Catchment Area (km2)Between Population Density (Thousand/km2) and Total Catchment Area (km2)
Area 1 (special Area)Sustainability 15 01609 i007Sustainability 15 01609 i008
Pearson Coefficient r = 0.626062Pearson Coefficient r = −0.55338
Area 2 (Special zone- Special Area)Sustainability 15 01609 i009Sustainability 15 01609 i010
Pearson Coefficient r = 0.96672Pearson Coefficient r = −0.72694
Area 3 (Zone 2)Sustainability 15 01609 i011Sustainability 15 01609 i012
Pearson Coefficient r = 0.511082697Pearson Coefficient r = −0.37575257
Figure 4. Map of ward-wise Served population of Patna. (Source: Census Of India—Population data, Patna Municipal Corporation ward boundary and corporation boundary and area, Master Plan 2031—open space location, map generated in ArcMap 10.4.1).
Sustainability 15 01609 g004

4.3. Qualitative Analysis

Vegetation cover shows a positive relationship with ward area, with r = 0.3, 0.95, 0.76 for Area 1, Area 2, and Area 3, respectively (Table 10). However, with ward-wise population density, there is a negative correlation in all the areas. Open space shows a positive correlation. Comparing all three zones, the vegetation cover is better in Area 2 in terms of ward area and open space area as it shows a strong correlation with these two (Table 10 and Figure 5).
Table 10. Qualitative and correlation analysis of different Zones.
Relationship between Ward Area and Vegetation AreaRelationship between Population Density (People/km2) and Vegetation AreaRelationship between Open Spaces and Vegetation Area
Area 1Sustainability 15 01609 i013Sustainability 15 01609 i014Sustainability 15 01609 i015
r = 0.31125r = −0.38009r = 0.648153
Area 2Sustainability 15 01609 i016Sustainability 15 01609 i017Sustainability 15 01609 i018
r = 0.95334r = −0.67001r = 0.801145
Area 3Sustainability 15 01609 i019Sustainability 15 01609 i020Sustainability 15 01609 i021
r = 0.768879936r = −0.621144752r = 0.760933681
Figure 5. Map of ward-wise healthy vegetation distribution of Patna. (Source: USGS—Landsat Image, Patna Municipal Corporation ward Boundary and Corporation Boundary, Map Generated in ArcMap 10.4.1).
Sustainability 15 01609 g005

4.4. Geographically Weighted Regression Analysis

Geographically weighted regression was carried out to see the model best fitting the variables (Table 11, Figure 6, Figure 7 and Figure 8)). If we compare all the areas, Area 2 has the better fit with R-square = 0.77 in quantity, 0.93 in accessibility, and 0.90 in quality, and AICc is lower in Area 2 compared to the others. Then comes Area 1 having R-square = 0.34 in quantity and 0.67 in accessibility, but in quality, it is 0.7, which is less than Area 3 which has R-square = 0.97.
This shows that Area 2 has a better distribution of open space, based on the given variables, than Area 1 and then Area 3. Between Area 1 and Area 3, Area 1 scores more in quantity and accessibility than Area 3, but it has less vegetation cover, which pertains to quality.
Table 11. Geographically weighted Regression Analysis of different zones and parameters, input data for Area 1 (as per Table A1, Table A2 and Table A3), Area 2 (as per Table A4, Table A5 and Table A6), and Area 3 (as per Table A7, Table A8 and Table A9).
Geographically Weighted Regression—Quantity (Open Space): Map shown in Figure 6
Area 1Area 2Area 3
Sustainability 15 01609 i022Sustainability 15 01609 i023Sustainability 15 01609 i024
Results
Bandwidth10,100.65439Bandwidth123,110.6601Bandwidth75,571.71323
Residual Squares139,117,335,143.2Residual Squares128,119,257,522.7Residual Squares946,650,475,913.7
Effective Number3.872741Effective Number3.00729Effective Number3.01298
Sigma69,109.98734Sigma99,301.85037Sigma187,291.1977
AICc835.781489AICc421.915098AICc820.004354
R20.404624R20.804623R20.239661
R2 Adjusted0.345903R2 Adjusted0.774438R2 Adjusted0.182946
Geographically Weighted Regression—Accessibility (Catchment): Map shown in Figure 7
Area 1Area 2Area 3
Sustainability 15 01609 i025Sustainability 15 01609 i026Sustainability 15 01609 i027
Results
Bandwidth4689.309348Bandwidth123,110.6601Bandwidth3068.400882
Residual Squares1,002,111,364,037.7Residual Squares1,854,515,780,024.8Residual Squares7,105,404,734,163.7
Effective Number5.719825Effective Number3.00729Effective Number9.253491
Sigma191,661.2964Sigma377,802.9991Sigma585,223.6892
AICc905.090156AICc464.673776AICc894.366594
R20.726975R20.946812R20.703599
R2 Adjusted0.679738R2 Adjusted0.938594R2 Adjusted0.585684
Geographically Weighted Regression—Quality (Green Cover): Map shown in Figure 8
Area 1Area 2Area 3
Sustainability 15 01609 i028Sustainability 15 01609 i029Sustainability 15 01609 i030
Results
Bandwidth2799.333134Bandwidth123,110.6601Bandwidth2559.388547
Residual Squares10,877,730,087Residual Squares73,669,178,831Residual Squares69,658,099,629
Effective Number10.909455Effective Number4.00948Effective Number12.486928
Sigma22,190.44066Sigma78,383.36368Sigma63,067.35923
AICc771.841591AICc417.433007AICc768.628262
R20.792999R20.92553R20.987895
R2 Adjusted0.700142R2 Adjusted0.906839R2 Adjusted0.979955
Figure 6. Geographically Weighted Regression map of open space (Census Of India—Population data, Patna Municipal Corporation ward Boundary and Corporation Boundary and area, Master Plan 2031—Open space location, Map Generated in ArcMap 10.4.1).
Sustainability 15 01609 g006
Figure 7. Geographically Weighted Regression map of Catchment (Census Of India—Population data, Patna Municipal Corporation ward Boundary and Corporation Boundary and area, Master Plan 2031—Open space location, Map Generated in ArcMap 10.4.1).
Sustainability 15 01609 g007
Figure 8. Geographically Weighted Regression map of green cover (Census Of India—Population data, Patna Municipal Corporation ward Boundary and Corporation Boundary and area, Master Plan 2031—Open space location, Map Generated in ArcMap 10.4.1).
Sustainability 15 01609 g008

5. Discussion

With the help of the identified parameters quantity, accessibility, and quality and the independent variables, i.e., open space, catchment area, and vegetation cover, the dependent variables of the ward and population density for all the independent variables were analyzed using Pearson correlation and geographically weighted regression analysis. The result shows that within the three areas identified based on the growth pattern, Area 1 is the old area, and Area 2 and Area 3 are the new areas within the Patna Municipal Corporation boundary. Area 2 has a better distribution than the other two areas, with r = 0.89 for quantity and r = 0.96 for accessibility in relation to area. Area 1, as the oldest, has higher density but shows a positive relationship between the area and open space distribution with r = 0.58, and accessibility’s relationship with area is positive at r = 0.62, which is better than the new Area 3 with r = 0.45 and 0.51, respectively. In all the parameters, the relationship of area to population density shows a negative correlation, which shows a lacuna of open space with respect to the population density. Area 3 has a very poor distribution compared to the other two areas in quantity and accessibility, but in terms of vegetation cover it has a good distribution with r = 0.76 in terms of the relationship with ward area and r = 0.76 with open space, which shows that the vegetative cover increases with ward area and also increases with the open space, which means good vegetative cover in the open spaces.
It is observed that in Area 1 (see Table 4) there is 3.7% total vegetative cover, in which eight wards have less than 1 m2/capita, which serves a population of 0.98 lakh people out of 6.5 lakh, and 13 wards are below the URDPFI guideline of 3.16 m2/capita, serving a population of 1.69 lakh. In Area 2, there is 7.7% vegetation cover, in which eight wards are below the standard level of 3.16 m2/capita with a served population of 1.38 lakh out of 3.58 lakh. In Area 3, there is 13.9% vegetation cover, which is the highest among all the areas. It has five wards which have a population with less than 1 m2/capita with a served population of 0.61 lakh and 12 wards that have less than the standard open space with a served population of 1.61 lakh out of 6.66 lakh. As per the projected population (Table 5), the per capita open space for the served population will be less than the standard guideline of 3.16 m2/capita in terms of recreational open space, especially in Area 1, having 1.96 m2/capita, and Area 3, having 2.19 m2/capita (see Table 6 and Table 7).
As per the Pearson correlation, the open space distribution among the areas can be ranked. In quantity, Area 2 has a good distribution, then next is Area 1, then Area 3. In accessibility, Area 2 is also better than Area 1 and then Area 3. In quality, Area 2 is better than Area 3, then Area 1, having much less vegetative cover, is last. In population density, all the areas have a negative correlation.
As per geographically weighted regression and fitting, the independent variables: open space, open space catchment, and vegetation cover, and dependent variables: ward area and population density. The R-square value of Area 2 is R2 = 0.8, 0.94, 0.92 for quantity, accessibility, and quality, which is higher than the Area 1 with R2 = 0.40, 0.72, 0.79 and Area 3 with R2 = 0.23, 0.70, 0.98 for quantity, accessibility, and quality, respectively. In addition, AICc and sigma square show that Area 2, which has a smaller value for these two, suggests a better fit compared to the other two.
The result shows that as per geographically weighted regression analysis, Area 2 also has a better distribution than Area 1 and then Area 3. So, both the analyses show that the area identified as per the growth pattern and the master plan zoning of the proposed open space distribution does not support the relationship of the new area with more open space in terms of the availability of land. Instead, the intermediate growth zone has a better distribution than the old and new areas.
The geographically weighted regression map shows that in Area 1, 13 wards have a standard deviation of −0.5 to −1.5 compared to Area 2. In Area 3, six wards have a negative standard deviation from the mean open space area. Area 2 has four wards with a negative standard deviation. Area 2 is equally distributed (see Figure 6). In terms of accessibility, the model shows a good fit in terms of predicted vs. observed catchments, especially in Area 1 and Area 2 (see Table 11, Figure 7). In terms of quality, that is, the green cover, Area 3 has a good fit as per the predicted and observed green cover. Then comes Area 2 and, finally, Area 1 (see Figure 8). Although Area 3 has a good green cover, as per the geographically weighted regression map, it has more gray and blue colors in wards, representing negative green cover in many of the wards, which shows that it is not appropriately distributed based on the variables.
Related ward-wise (micro-level) and zone-wise (meso-level) data used for the analysis, such as per capita open space, catchment area, served population, and vegetation cover, are given in Appendix A, Appendix B, Appendix C. The open space map and catchment area map are in Appendix A for Area 1 (Figure A1), Appendix B for Area 2 (Figure A2), and Appendix C for Area 3 (Figure A3) for reference.
As per the study, the newer area also faces a shortage in urban green open space both in terms of quantity and accessibility compared to the older areas, which shows the issue at the policy level of the planning. The policy should be in terms of the quantity (per capita open space of the micro level), accessibility (urban green open space serving the population), and quality in terms of vegetation cover to maintain the overall quality of the urban landscape, especially in the newer area. As per the quantitative analysis, most of the area still needs to reach the required standard of per capita urban green open space as specified by URDPFI. For a historic city such as Patna, with space crunch, or the core city area such as Area 1 in this study, the alternative potential urban green open spaces have to be identified. The potential urban green open spaces, such as road verges, railway verges, spaces under flyovers, spaces along canals or open drains, other urban green space systems, etc., should be included as urban green open spaces in the development plan. A green open space conservation plan should be implemented where there is a shortage. Encroachment in these spaces should also be monitored as it will lead to a further reduction in the number of urban green open spaces.
Green spaces act as carbon sequesters [36,37]. Urban planning effort should be made to save these green areas which are also carbon reservoirs. The conservation of these urban green open spaces will also support the aim of missions such as the National Mission of Green India and National Mission on Sustainable Habitat to enhance carbon sink potential in urban areas [38]. As per the result, green cover is greater in the newer areas as compared to the older area, and an increase in the urban green open spaces will also increase the carbon sink potential of the city [39]. In newer areas, more open spaces are present, which should be conserved and managed. The conservation of open spaces and making them more accessible will fulfill Sustainable Development Goals 11 and 13 of the United Nations.

6. Conclusions

This study has tried to understand the open space distribution at the micro and meso levels with respect to its quantity, quality, and accessibility based on the growth pattern of the city. This is the first time the assessment of urban green open space with the identified parameters of quantity, quality, and accessibility has been carried out based on the growth pattern of the city. The study tried to answer the research question given in the Introduction section for the study area of Patna Municipal Corporation.
The distribution, as per Table 8, Table 9 and Table 10, of the Pearson correlation of all the zones has a positive relationship with the ward area and open space, which shows that the open space is distributed as per the ward area sizes. However, the strength of Area 1 (r = 0.58) and Area 3 (r = 0.45) is lower, which means that many open spaces are not well distributed in these zones as per the ward area. Compared to the other zones, Area 2 has r = 0.89, which is a comparatively high value showing that most of the areas are well distributed based on the ward area. However, not all the zones are well distributed as per the population density and they show a negative correlation. This means that the open spaces are not distributed according to population density. This answers the first research question.
The distribution pattern does not depend only on the growth pattern of the city, as we can see that the intermediate meso area with r = 0.89 and r2 = 0.8 (Area 2) has more distributed open space than the newer (r = 0.45, r2 =0.23) and older area (r = 0.58, r2 = 0.40). However, the vegetation cover is greater in the new areas than in the older areas because of the availability of vacant land. Additionally, the vegetation cover depends on the new area and the land use, as more vegetation cover is found in the public semi-public land use than the other land uses, and this answers the second question.
All three areas’ open space distribution has negative relation with the population density although it has positive relation with the area. In addition, the intermediate growth area, that is, Area 2, has good accessibility, distribution of open space, and vegetative cover distribution, compared to the other areas. The open space distribution and accessibility distribution are poorer in the new areas (Area 3) compared to the older area (Area 1). As per the population data of 2011, the open space per capita is 4.1 m2/capita. However, as per the projection by the City Development Plan 2030, the population will reach 30 lakh so there will be only 2.33 m2/capita of open space, which is again less than the open space standard by URDPFI.
There is a need to identify the potential green open space in Patna City, especially in the older area, other than the formal green open spaces such as parks and playgrounds for public use. As per Rupprecht, it is observed that parks no longer seem up to the task of meeting residents’ green space needs [40]. It is suggested that informal green spaces (IGSs) exist even when development pressure is high. So, the identification of the potential green space is needed in the city to meet the public space demand [41]. The open space has to be identified at micro and meso levels to have proper accessibility for proper distribution.
This study has been limited to the historic city of Patna as an example facing population explosion issues, and the urban green open spaces identified as per the city’s master plan. The future scope of this research can include the study of other tier 2 cities or cities having urban population expansion issues based on the given parameters. Research can also be carried out for the other types of informal urban green open spaces such as street verges, railway verges, and others, which have potential as urban green open spaces of Patna City or other cities. The growth patterns taken for this study are based on the historical evolution to obtain clear demarcation based on a previous map and article [29] as it is a historical city, and for the current study, the ward-level population and ward-level area were required which would not have been possible in the LULC change boundary using remote sensing. However, for newer cities, the evolution can be taken for decadal change based on remote sensing data with LULC change or nighttime light data [42,43].

Author Contributions

Methodology, S.K.; software, S.K.; writing, S.K.; editing, S.K.; supervision, F.R. All authors have read and agreed to the published version of the manuscript.

Funding

This research received no external funding.

Institutional Review Board Statement

Not applicable.

Informed Consent Statement

Not applicable.

Data Availability Statement

This study did not report any data.

Acknowledgments

The main author would like to give gratitude to their supervisor Fulena Rajak for his guidance and supervision in this research.

Conflicts of Interest

The authors declare no conflict of interest.

Appendix A

Table A1. Table showing ward-wise population data and open space as per Patna Master Plan used for quantitative analysis of urban green open spaces of Area 1.
Area 1 Ward Area and PopulationOpen Space (m2)
Ward NumberWard Area (sq km) (yi)Area 1 Ward PopulationPopulation Density (People/sq km) (yii)Park and PlaygroundOpen Space BufferForestWater Body BufferBioconservationTotal Open Space (x)
270.889442.510,730.1111,093245,000 00256,093
280.55800214,549.096615 006615
360.626,64044,4000 000
370.4214,31734,088.13445 003445
380.4914,87030,346.940 000
390.2410,94945,620.837058 007058
400.315,13350,443.334541 004541
410.9218,64520,266.355,086 0055,086
420.6421,08732,948.4418,785 0018,785
430.9721,75222,424.7423,011 0023,011
471.5328,96618,932.030 192,4170192,417
480.8221,59926,340.24250,168 00250,168
490.6221,43834,577.4226,347 072,81899,165
500.6124,86340,759.020 000
510.5528,14851,178.180 000
520.524,90649,8120 000
530.6723,17234,585.0724,482 0024,482
541.2525,98320,786.40 107,2400107,240
560.4036610502601.1990 3330333
570.5922,42938,015.250 47,173047,173
580.7134,16648,121.1317,275 0017,275
590.6826,30838,688.240 000
600.5223,84345,851.920 000
620.237646.7633,246.788474 008474
630.3318,04854,690.910 000
640.2316,54571,934.780 444204442
650.5221,58941,517.310 0125,294125,294
660.7818,63623,892.310 43,898205,935249,833
670.6527,13241,741.5412,575 082,28094,855
690.516,61833,2360 19,76448,04667,810
700.7825,56332,773.080 73,78066,341103,499243,620
711.0523,81822,683.810 18,208188,117206,325
721.6913,9088229.5860 2945147,562150,507
Total =22.22366657,212.3 468,955245,00073,780502,761973,5512,264,047
(yi) and (yii) are the dependent variable and (x) is independent variable.
Table A2. Table showing ward-wise open space catchment used for accessibility analysis of urban green open spaces of Area 1.
Catchment Area (km2)Vegetation Cover (m2)
Ward NumberPark and Playground CatchmentOpen Space Buffer CatchmentForest CatchmentWater Body Buffer CatchmentBioconservation CatchmentOverlapTotal Catchment Area (x)Vegetation Area
270.5815150.769467 0.540.810982150,974.8
280.2125470.102783 0.10.215337870.677
360.031331 0.03133110,149.51
370.3985180.285463 0.280.40398123,077.77
380.2466990.105255 0.10.251954
390.2384290.054541 0.050.242972980.985
400.297839 0.297839900
410.902682 0.90268294,967.74
420.516568 0.51656818,316.94
430.860044 0.018706 0.0187060.8600446432.311
470.31513 1.5111 0.3112561.51497425,183.17
480.820696 0.254632 0.2546320.820696166,015.8
490.610762 0.0017620.0728180.0017620.6835834,164.42
500.280128 0.403702 0.683831228.865
510.077841 0.108815 0.1866567945.054
520.288402 0.28840210,012.4
530.623077 0.044065 0.0317430.63539928,992.08
540.055071 1.17471 0.0420451.1877364171.736
560.087962 0.40366 0.0727370.4188853324.926
570.030061 0.548167 0.0300610.54816720,470.94
580.438195 0.194239 0.1179620.5144726366.479
59 02884.272
60 0.021382 0.02138222,857.77
620.219939 0.169934 0.1209570.268916616.2033
630.005754 0.107144 0.0053650.107533
64 0.178609 0.178609576.3495
65 0.1318570.1252940.054650.202501806.1628
660.005526 0.3557260.2059350.1496650.41752212,002.32
670.33767 0.1276230.082280.1276230.419951840.573
690.153426 0.0423810.2391140.0480460.180.30296728,353.28
70 0.4120540.3710650.1034990.340.54661880,635.9
71 0.3097920.4105740.1881170.220.68848326,776.33
72 0.2442940.1475620.0355790.35627736,861.86
Total=8.6358121.3175090.7642277.020880.9735513.18474315.52724837,757
Table A3. Table showing ward-wise data of served population and per capita open space based on the provided data of urban green open spaces of Area 1.
Ward NumberPark and Playground Served PopulationOpen Space Buffer Served PopulationForest Served PopulationWater Body Buffer Served PopulationBioconservation Served PopulationOpen Space Served PopulationPer Capita Open Space
276239.7228256.4680008701.92927.12131
283092.3661495.3990003132.8560.826668
361391.09600001391.0960
3713,584.729730.8900013,770.940.240623
387486.5593194.1670007646.0330
3910,877.332488.20600011,084.490.644625
4015,023.99000015,023.990.300073
4118,294.03000018,294.032.954465
4217,020.11000017,020.110.890833
4319,286.2700419.4772019,286.271.05788
475966.0490028,608.18028,681.536.642857
4821,617.33006707.069021,617.3311.58239
4921,118.570060.925412517.85923,636.434.625665
5011,417.740016,454.5027,872.240
513983.761005568.95409552.7150
5214,365.88000014,365.880
5321,549.16001523.991021,975.321.056534
541144.7280024,417.99024,688.764.127314
56228.806700105001089.6030.317143
571142.7770020,838.71020,838.712.103215
5821,086.44009347024,756.970.50562
590000000
60000980.40580980.40580
627312.264005649.75908940.5921.108182
63314.6915005859.80305881.0780
6400012848.2012,848.20.26848
650005474.3485201.878407.2965.803604
66132.0289008499.1154920.2629975.56413.40593
6714,094.87005327.183434.49417,529.363.496056
695099.26701408.5757947.1931596.85710,069.414.080515
700013,504.2812160.943391.98117,914.359.53018
71007027.2639313.3824267.2115,617.428.662566
720002010.4381214.3742932.01210.82161
Total =26,2870.625,165.1321,940.12191,067.626,544.91445,522.9
Figure A1. Map of Urban Green Open Space and Catchment Area of Area 1 (Special Area). (Source: Patna Municipal Corporation ward Boundary and Corporation Boundary, Patna Master Plan 2031—Open Space Map, Map Generated in ArcMap 10.4.1).
Sustainability 15 01609 g0a1

Appendix B

Table A4. Table showing ward-wise population data and open space as per Patna Master Plan used for quantitative analysis of urban green open spaces of Area 2.
Area 2 Ward Area and PopulationOpen Space (m2)
Ward NumberWard Area (sq km) (yi)Area 2 Ward PopulationPopulation Density (People/sq km) (yii)Park and PlaygroundOpen Space BufferForestWater Body BufferTotal Open Space (x)
291.4724,86316,913.61 285,690.3 285,690.3
302.0421,291.2110,436.87 52,732.3 52,732.3
311.3839,76828,817.39 0
321.0725,51623,846.73 0
330.6617,56426,612.12 21,022.9 21,022.9
340.9817,29417,646.94 162,245.5 6188.531168,434.1
350.7918,99624,045.57 5810.078 5810.078
441.8922,33311,816.4 110,753.6 110,753.6
451.2327,38122,260.98 7234.069 400.92387634.993
462.4631,87612,957.72 38,427.81 41,676.6180,104.42
552.4217,3947187.60366,34517,397.76153,972.210,834.92248,549.9
569.223,943.782602.585 643,801.6188,565.2 832,366.9
612.9131,20510,723.37 1547.79131,492.3333,040.12
620.6515,53523,900 18,205.05 18,205.05
682.5116,3966532.271 51,581.1379,464.35045.266136,090.7
720.4876679.6813,715.98 2741.123 2741.123
Total32.147358,035.7 66,3451,417,643423,549.595,638.572,003,176
(yi) and (yii) are the dependent variable and (x) is independent variable.
Table A5. Table showing ward-wise open space catchment used for accessibility analysis of urban green open spaces of Area 2.
Catchment Area (Km2)Vegetation Cover
Ward NumberPark and Playground CatchmentOpen Space Buffer CatchmentForest CatchmentWater Body Buffer CatchmentOverlapTotal Catchment Area (x)Vegetation Area (m2)
29 0.64 0.64107,748.9
30 0.95 0.95229,646.7
31 0.19 0.0060.0008750.19512526,830.01
32 0.44 00.4419,341.02
33 0.6 0.0090.0093630.5996376552.699
34 0.97 0.520.5126950.97730513,547.44
35 0.4 0.0900.4926,982.64
44 1.66 01.6622,935.5
45 1.01 0.420.2798341.1501666014.755
46 2 1.090.7849022.305098213,985.5
550.711.050.580.540.8961231.98387766,019
56 5.871.560.011.0755226.364478990,637.8
61 0.80.491.780.4061942.663806454,782.3
62 0.270.270.120.0938460.56615417,635.53
68 1.261.030.350.5584242.081576273,871.7
72 0.180.05 0.0219730.20802728,431.55
Total0.7118.293.984.935 23.275252,504,963
Table A6. Table showing ward-wise data of served population and per capita open space based on the provided data of urban green open spaces of Area 2.
Ward NumberPark and Playground Served PopulationOpen Space Buffer Served PopulationForest Served PopulationWater Body Buffer Served PopulationOpen Space Served PopulationPer Capita Open Space (m2/Capita)
29 10,824.710010,824.7111.49058
30 9915.027009915.0272.476716
31 5475.3040172.90435622.9930
32 10,492.560010,492.560
33 15,967.270239.509115,957.611.196931
34 17,117.5309176.40817,246.449.739452
35 9618.22802164.10111,782.330.305858
44 19,615.230019,615.234.959192
45 22,483.5909349.6125,603.820.278843
46 25,915.45014,123.9229,868.822.513001
555103.1987546.9834168.813881.30614,259.3214.2894
56 15,277.184060.03326.0258516,564.134.76338
61 8578.6945254.4519,087.5928,564.971.058808
62 64536453286813,531.081.171873
68 8230.6616728.2392286.29513,597.428.300238
72 2468.876685.798802853.2930.410367
Total5103.198195,980.327,350.3363,375.67246,299.7
Figure A2. Map of Urban Green Open Space and Catchment of Area 2. (Source: Patna Municipal Corporation ward Boundary and Corporation Boundary, Patna Master Plan 2031—Open Space Map, Map Generated in ArcMap 10.4.1).
Sustainability 15 01609 g0a2

Appendix C

Table A7. Table showing ward-wise population data and open space as per Patna Master Plan used for quantitative analysis of urban green open spaces of Area 3.
Area 3 Ward Area and PopulationOpen Space (Sqm)
Ward NumberWard Area(sq km) (yi)Area 3 Ward PopulationPopulation Density (yii)Park and PlaygroundOpen Space BufferForestWater Body BufferTotal Open Space (x)
22.91533,23011,399.66 0
35.620137,5246676.75 0
43.580822,5096286.025 422,446 422,446
52.197237,70417,160.02 29,934 29,934
61.213215,27712,592.32 0
71.531530,13119,674.18 0
82.130522,63410,623.8 42,425 42425
93.743511,6533112.862110,951943,058 1,054,009
101.552423,38715,065.06 0
114.54127,2656004.184 34,034.7 34,034.7
120.690119,09827,674.25 5774 5774
130.479516,97835,407.72 1391.63 1391.63
140.767619,43425,317.87 0
301.726117,99910,427.55 69,355.3 69,355.3
150.749118,14724,225.07 20,430.1 20,430.1
200.612916,75227,332.35 20,145.8 20,145.8
180.40813,87734,012.25 0
190.603619,84832,882.7 922.112 922.112
240.639716,29925,479.13 65,108 65,108
250.610611,52218,869.96 0
260.53520,51538,345.79 21,115.9 21,115.9
270.9246992810,737.6213,730 13,730
221.323728,04521,186.82 62,603.9 16623.679,227.5
230.3883876922,583.05 5211.09 5211.09
212.264323,14610,222.14 105,067 11,920.6116,987.6
280.4583660714,416.32 84,675.2 84,675.2
15.296135,0746622.609 229,034 26221.8255,255.8
170.446318,67241,837.33 0
160.373611,96232,018.2 0
22B, 22C4.732272,21615,260.56 213,78065497 279,277
Total =53.0548666,202 124,6812,376,51265,49754,7662,621,456
(yi) and (yii) are the dependent variable and (x) is independent variable.
Table A8. Table showing ward-wise open space catchment used for accessibility analysis of urban green open spaces of Area 3.
Catchment Area (Km2)Vegetation Cover
Ward NumberPark and Playground CatchmentOpen Space Buffer CatchmentForest CatchmentWater Body Buffer CatchmentOverlapTotal Catchment Area (x)Vegetation Area (m2)
2 0.017195 0.017195237,730
3 0.490215 0.4902151,345,210
4 2.95946 2.959461,083,580
5 1.03535 1.03535157,515
6 010,185.8
7 0.331357 0.3313572052.7
8 1.37148 1.37148144,890
91.149952.12736 0.2088173.0684931,810,240
100.0285180.137937 0.0130390.15341698,840.9
11 0.650747 0.650747860,126
12 0.425443 0.4254439135.17
13 0.28028 0.2802820,092.6
14 0.212072 0.21207290,828
30 0.578561 0.578561173,556
150.0759820.576644 0.0742470.578379136,950
200.0972280.564403 0.0571680.60446319,487.3
18 00
19 0.392958 0.3929581005.96
240.0157350.6397 0.0157350.639712,959.9
25 0.398528 0.39852837,410
260.1878950.5274 0.0000470.1802770.5350653154.96
270.3271060.20887 0.0022770.1072480.43100572,543.2
22 1.23964 0.7722560.7722561.2396410,410.8
23 0.38833 0.388333564.66
210.0433271.3611 0.5118590.3624111.553875197,170
28 0.4473 0.1653990.1653990.447339,192.8
1 2.10279 1.224481.18952.13777424,203
17 02986.89
16 07245.05
22B, 22C 3.435841.020.401281.73.15712473,596
Total =1.92574122.900961.023.0775984.84609724.07827,341,432
Table A9. Table showing ward-wise data of serving population and per capita open space based on the provided data of urban green open spaces of Area 3.
Ward NumberPark and Playground Served PopulationOpen Space Buffer Served PopulationForest Served PopulationWater Body Buffer Served PopulationOpen Space Served PopulationPer Capita Open Space (m2/Capita)
20196.017100196.01710
303273.043003273.0430
4018,603.240018,603.2418.76787
5017,766.630017,766.630.793921
6000000
706519.176006519.1760
8014,570.330014,570.331.874393
93579.6366622.179009551.79690.44958
10429.62542078.029002311.2210
1103907.205003907.2051.248293
12011,773.820011,773.820.302335
1309924.075009924.0750.081967
1405369.212005369.2120
3006032.976006032.9763.853286
151840.66913,969.240014,011.271.125811
202657.4715,426.460016,521.41.202591
18000000
19012,921.520012,921.520.046459
24400.914116,2990016,2993.994601
2507520.209007520.2090
267204.98320,223.5701.80225220,517.491.029291
273512.3392242.766024.449554627.9661.382957
22026,264.04016,361.6526,264.042.825013
2308769.677008769.6770.594263
21442.894813,913.3605232.29615,883.935.054333
2806448.4202384.4456448.4212.81598
1013,925.9608109.25214,157.627.277636
17000000
16000000
22B, 22C052,432.8315,565.776123.75648,179.43.867245
Total =20,068.53316,99315,565.7738,237.65321,920.7
Figure A3. Map of Urban Green Open Space and Catchment Area of Area 3. (Source: Patna Municipal Corporation ward Boundary and Corporation Boundary, Patna Master Plan 2031—Open Space Map, Map Generated in ArcMap 10.4.1).
Sustainability 15 01609 g0a3

References

  1. Hayward, D.G.; Weitzer, W.H. The public’s image of urban parks: Past amenity, present ambivalance, uncertain future. Urban Ecol. 1984, 8, 243–268. [Google Scholar] [CrossRef]
  2. Bilgili, B.; Gökyer, E. Urban Green Space System Planning. In Landscape Planning; Ozyavuz, M., Ed.; IntechOpen: London, UK, 2012. [Google Scholar] [CrossRef] [Green Version]
  3. Wang, H.; Dai, X.; Wu, J.; Wu, X.; Nie, X. Influence of urban green open space on residents’ physical activity in China. BMC Public Health 2019, 19, 1093. [Google Scholar] [CrossRef] [PubMed] [Green Version]
  4. Mensah, C.A. Urban Green Spaces in Africa: Nature and Challenges. Int. J. Ecosyst. 2014, 4, 1–11. [Google Scholar]
  5. Shackell, A.; Walter, R. Greenspace Design for Health and Well-Being; Forestry Commission: Edinburgh, UK, 2012; pp. 1–70.
  6. Dewi, O.C.; Chairunnisa, I.; Hidayat, T.; Anggraini, M.; Napitupulu, A. Green Open Space: Awareness for Health or Sustainability? In IOP Conference Series: Earth and Environmental Science; IOP Publishing: Bristol, UK, 2018; Volume 120, p. 012014. [Google Scholar] [CrossRef] [Green Version]
  7. Town and Country Planning Organisation, Governemnt of India, Ministry of Urban Development. Urban Greening Guidelines; Ministry of Urban Development: New Delhi, India, 2014.
  8. Ahirrao, P.; Khan, S. Assessing Public Open Spaces: A Case of City Nagpur, India. Sustainability 2021, 13, 4997. [Google Scholar] [CrossRef]
  9. Shah, A.; Garg, A.; Mishra, V. Quantifying the local cooling effects of urban green spaces: Evidence from Bengaluru, India. Landsc. Urban Plan. 2021, 209, 104043. [Google Scholar] [CrossRef]
  10. Das, M.; Das, A.; Momin, S. Quantifying the cooling effect of urban green space: A case from urban parks in a tropical mega metropolitan area (India). Sustain. Cities Soc. 2022, 87, 104062. [Google Scholar] [CrossRef]
  11. Matos, P.; Vieira, J.; Rocha, B.; Branquinho, C.; Pinho, P. Modeling the provision of air-quality regulation ecosystem service provided by urban green spaces using lichens as ecological indicators. Sci. Total Environ. 2019, 665, 521–530. [Google Scholar] [CrossRef]
  12. Włodarczyk-Marciniak, R.; Sikorska, D.; Krauze, K. Residents’ awareness of the role of informal green spaces in a post-industrial city, with a focus on regulating services and urban adaptation potential. Sustain. Cities Soc. 2020, 59, 102236. [Google Scholar] [CrossRef]
  13. Ashraf, M.; Ghose, D.S. An Assessment of Declining Urban Greens under Patna Municipal Corporation Based on Normalized Difference Vegetation Index. Univ. J. Environ. Res. Technol. 2015, 5, 220–232. [Google Scholar]
  14. Duygu, Ç.R.; Fatma, A. Benefits of Urban Green Spaces For Citizens: Ankara Case Study. In Proceedings of the IV International Conference “Ecology of Urban Areas” 2014, Zrenjanin, Serbia, 9–10 October 2014. [Google Scholar]
  15. Tripathy, P.; Kumar, A. Monitoring and modelling spatio-temporal urban growth of Delhi using Cellular Automata and geoinformatics. Cities 2019, 90, 52–63. [Google Scholar] [CrossRef]
  16. Dinda, S.; Chatterjee, N.D.; Ghosh, S. An integrated simulation approach to the assessment of urban growth pattern and loss in urban green space in Kolkata, India: A GIS-based analysis. Ecol. Indic. 2021, 121, 107178. [Google Scholar] [CrossRef]
  17. Nation, U. World Population Prospects; Department of Economics and Social Affairs: New York, NY, USA, 2019. [Google Scholar]
  18. Chandramouli, C.; General, R. Census of India; Registrar General & Census Commissioner: New Delhi, India, 2011.
  19. Govindarajulu, D. Urban green space planning for climate adaptation in Indian cities. Urban Clim. 2014, 10, 35–41. [Google Scholar] [CrossRef]
  20. Ramaiah, M.; Avtar, R. Urban green spaces and their need in cities of rapidly urbanizing India: A review. Urban Sci. 2019, 3, 94. [Google Scholar] [CrossRef] [Green Version]
  21. Kumar, S. Study & analysis of urban green spaces and an integrative approach to sustainable development in historic city Patna. Int. J. Adv. Res. 2015, 3, 66–75. [Google Scholar]
  22. Rao, P.; Puntambekar, K. Evaluating the Urban Green Space benefits and functions at macro, meso and micro level: Case of Bhopal City. Int. J. Eng. Res. 2014, 3, 359–369. [Google Scholar]
  23. Town and Country Planning Organisation. Urban and Regional Development PLans Formulation nad Implementation Guidelines; Ministry of Urban Development, Government of India: New Delhi, India, 2015.
  24. Maharina, J.; Beau, B. Developing an Open Space Standard in a Densely Populated City: A Case Study of Chittagong City. Infrastructures 2018, 3, 40. [Google Scholar] [CrossRef] [Green Version]
  25. Kumari, B.; Tayyab, M.; Hang, H.T.; Khan, M.F.; Rahman, A. Assessment of public open spaces (POS) and landscape quality based on per capita POS index in Delhi, India. SN Appl. Sci. 2019, 1, 368. [Google Scholar] [CrossRef] [Green Version]
  26. Şenik, B.; Uzun, O. A process approach to the open green space system planning. Landsc. Ecol. Eng. 2022, 18, 203–219. [Google Scholar] [CrossRef]
  27. Gupta, K.; Kumar, P.; Pathan, S.K.; Sharma, K.P. Urban Neighborhood Green Index—A measure of green spaces in urban areas. Landsc. Urban Plan. 2012, 105, 325–335. [Google Scholar] [CrossRef]
  28. CEPT. Master Plan for Patna2031; Urban Development & Housing Department: Patna, India, 2019.
  29. Sharma, R.T. Safe and Inclusive Cities, Patna: City Profile, Poverty, Inequality and Violence in Urban India: Towards Inclusive Planning and Policies; Institute for Human Development: New Delhi, India, 2016. [Google Scholar]
  30. Bell, S.; Hamilton, V.; Montarzino, A.; Rothnie, H.; Travlou, P.; Alves, S. Greenspace Scotland Research Report; Green Space Scottland: Stirling, UK, 2008. [Google Scholar]
  31. Bid, S. Change Detection of Vegetation Cover by NDVI Technique on Catchment Area of the Panchet Hill Dam, India. Int. J. Regul. Gov. 2016, 2, 11–20. [Google Scholar] [CrossRef]
  32. Schober, P.; Boer, C.; Schwarte, L.A. Correlation Coefficients: Appropriate Use and Interpretation. Anesth. Analg. 2018, 126, 1763–1768. [Google Scholar] [CrossRef] [PubMed]
  33. Kakon, A.N.; Reza, F. Pearson Correlation based Approach for Estimating the Association between Energy Consumption and Households’ Characteristics in Residential Buildings. Int. J. Adv. Sci. Technol. 2018, 114, 49–58. [Google Scholar] [CrossRef]
  34. Brunsdon, C.; Fotheringham, A.S.; Charlton, M.E. Geographically Weighted Regression: A Method for Exploring Spatial Nonstationarity. Geogr. Anal. 1996, 28, 281–298. [Google Scholar] [CrossRef]
  35. Urban Development and Housing Department Government of Bihar. City Development Plan (2010–30); Government of Bihar: Patna, India, 2010.
  36. Strohbach, M.W.; Haase, D. Above-ground carbon storage by urban trees in Leipzig, Germany: Analysis of patterns in a European city. Landsc. Urban Plan. 2012, 104, 95–104. [Google Scholar] [CrossRef]
  37. Nowak, D.J.; Crane, D.E.; Stevens, J.C.; Hoehn, R.E.; Walton, J.T.; Bond, J. A Ground-Based Method of Assessing Urban Forest Structure and Ecosystem Services. Arboric. Urban For. 2008, 34, 347–358. [Google Scholar] [CrossRef]
  38. Kumar, V. Coping with Climate Change: An Analysis of India’s State Action Plans on Climate Change; Centre for Science and Environment: New Delhi, India, 2018. [Google Scholar]
  39. Lahoti, S.; Lahoti, A.; Joshi, R.K.; Saito, O. Vegetation Structure, Species Composition, and Carbon Sink Potential of Urban Green Spaces in Nagpur City, India. Land 2020, 9, 107. [Google Scholar] [CrossRef] [Green Version]
  40. Rupprecht, C.D.; Byrne, J.A. Informal urban greenspace: A typology and trilingual systematic review of its role for urban residents and trends in the literature. Urban For. Urban Green. 2014, 13, 597–611. [Google Scholar] [CrossRef] [Green Version]
  41. Kim, M.; Rupprecht, C.D.; Furuya, K. Residents’ Perception of Informal Green Space—A Case Study of Ichikawa City, Japan. Land 2018, 7, 102. [Google Scholar] [CrossRef] [Green Version]
  42. Baqa, M.F.; Chen, F.; Lu, L.; Qureshi, S.; Tariq, A.; Wang, S.; Jing, L.; Hamza, S.; Li, Q. Monitoring and Modeling the Patterns and Trends of Urban Growth Using Urban Sprawl Matrix and CA-Markov Model: A Case Study of Karachi, Pakistan. Land 2021, 10, 700. [Google Scholar] [CrossRef]
  43. Zhao, M.; Zhou, Y.; Li, X.; Cheng, W.; Zhou, C.; Ma, T.; Li, M.; Huang, K. Mapping urban dynamics (1992–2018) in Southeast Asia using consistent nighttime light data from DMSP and VIIRS. Remote Sens. Environ. 2020, 248, 111980. [Google Scholar] [CrossRef]
Figure 1. Map of study area location with reference to India and Bihar State, showing three meso levels based on the three zones of Patna Master Plan and growth pattern within the Patna Municipal Corporation boundary.
Sustainability 15 01609 g001
Figure 2. Map showing Study Areas of Patna and context in satellite imagery in ArcGIS and open spaces as per Master Plan 2031 (Source: City Master Plan 2031).
Sustainability 15 01609 g002
Table 1. India Population Projection by United Nations [17].
YearPopulationDensity (P/km2)Urban Population (%)Urban Population
20101,234,281,17041530.8%380,744,554
20201,380,004,38546435.0%483,098,640
20301,503,642,32250640.4%607,341,981
20401,592,691,51353646.7%744,380,367
20501,693,176,03355153.5%876,613,025
Table 2. Materials used and their sources.
DataSource
Open space map, 2021Patna Master Plan 2031
Study area land use and boundary, 2019Existing land use plan of Patna, Patna Master Plan 2031
Population data, 2011Census of India 2011
Area of open space, special area, land useGeoreferenced Arc Map software
Landsat 8 remote sensing image, 2022USGS EarthExplorer
Table 3. Parameters, independent and dependent variables for assessment.
  • Quantity
    • Urban Green Open Space (Independent Variable)
      • Area (Dependent Variable)
      • Population Density (Dependent Variable)
Correlation (r) between the independent and dependent variables
(Independent variables: open space, catchment area, and vegetation cover; and dependent variables are ward area and population density)
Sustainability 15 01609 i031
Geographically weighted regression
(R-squared value, AICc, sigma, bandwidth, and effective number)
Sustainability 15 01609 i031
2.
Accessibility
b.
Accessible Area (Independent Variable)
  • Area (Dependent Variable)
  • Population Density (Dependent Variable)
3.
Quality
c.
Healthy Vegetation (Independent Variable)
  • Area (Dependent Variable)
  • Population Density (Dependent Variable)
Strength and significance of the variables (result = distribution of open space within the wards)Will determine the area with best fit within the given variables (result = distribution within the three meso areas)
Table 4. Urban green space of Patna (variable data as per 2011 census population data).
Area 1Area 2Area 3
Total Area (km2)22.332.253.15
Total Urban Green Open Space (km2)2.322.6
Total Ward Density (People/km2)29,57311,13712,556
Total Vegetation Cover (km2)0.84 (3.7%)2.5 (7.7%)7.4 (13.9%)
Open Space Per Capita (km2)3.455.63.95
Served Population485,182246,299321,920
Table 5. Study area population forecast for 2021 and 2030 based on City Development Plan 2010 and Patna Master plan 2031.
20112021 (@39% Growth)2030 (@78.2% Growth)
Area 1657,212913,5251,167,837
Area 2358,035497,668637,302
Area 3666,202926,0201,185,839
Table 6. Urban green space of Patna (variable data for projected population of 2021 as per CDP 2010).
2021Area 1Area 2Area 3
Total Area (km2)22.3 32.2 53.15
Total Urban Green Open Space (km2)2.3 2 2.6
Total Ward Density (People/km2)40,96515,44517,422
Open Space Per Capita (m2)2.5 4.012.8
Served Population637,825359,405418,128
Table 7. Urban green space of Patna (variable data for projected population of 2030 as per CDP 2010).
2030Area 1Area 2Area 3
Total Area (km2)22.3 32.2 53.15
Total Urban Green Open Space (km2)2.3 2 2.6
Total Ward Density (People/km2)52,36919,79122,311
Open Space Per Capita (m2)1.96 3.132.19
Served Population811,719459,151535,464
Disclaimer/Publisher’s Note: The statements, opinions and data contained in all publications are solely those of the individual author(s) and contributor(s) and not of MDPI and/or the editor(s). MDPI and/or the editor(s) disclaim responsibility for any injury to people or property resulting from any ideas, methods, instructions or products referred to in the content.

