Abstract
In this study, we explored the performance transfer effect of the coal industry’s reliance on green technology innovation to achieve green transformation and upgrading, as well as the crucial role of government. From the perspective of government macro-regulation, three instruments were used as entry points, i.e., environmental regulation, green credit policy, and fiscal incentives. Furthermore, the data of listed companies in China’s coal industry from 2010 to 2020 were selected as samples to construct an environmental performance evaluation system for the coal industry based on triple performance theory. We analyzed the link between green technology innovation and environmental performance, as well as the moderating effect of government macro-regulation. Our results prove that green technology innovation improves environmental performance, with a moderating effect of government environmental macro-regulations.
1. Introduction
At present, China is in the middle and late stages of industrialization, and the bearing capacity of resources and the environment is difficult to support under original production model; therefore, the concept of new green development has become an important part of the new era of ecological civilization. With the continuous promotion of China’s efforts to deal with environmental pollution problems, the introduction of the “carbon peak and carbon neutral” dual carbon target at the 75th session of the UN General Assembly in 2020 marked a new journey of ecological environmental protection in China. Green technology plays an important role in saving resources and reducing environmental pollution at the source, and green technology innovation has become an important link in achieving high-quality economic development.
However, research in the field of green technology innovation in China started late, and most enterprises have a lack of motivation with respect to green technology innovation. The scale of green innovation in China has increased significantly in the last decade, mainly as a result of utility model patents, but the quality of green innovation did not begin to improve until 2015 (Wang, 2019) [1]. Zhang et al. (2022) used the SBM model to construct a green technology innovation efficiency model and found that the level of green innovation efficiency of industrial enterprises in China was low before 2018 [2]. The ultimate purpose of enterprises, as market players, is to take initiative to carry out green technology innovation in order to improve their own performance (Wang et al., 2018) [3]. Environmental responsibility is a social responsibility that enterprises should fulfill; an increasing number of investors consider environmental performance an important criterion for investment decisions. Therefore, whether green technology innovation can have an impact on the dual environmental and economic benefits is important with respect to driving enterprises to use green technology innovation as a strategic decision. However, at present, China’s environmental governance system is not perfect, and there is no unified answer to the relationship between green technology innovation and environmental and economic performance. Green technology innovation has double externalities, and the government can play an important role in environmental governance by compensating for market failure in the process of green technology innovation through macro-regulatory instruments (Li et al., 2019) [4]. By combing academic studies on green technology innovation and environmental performance, it is found that most studies are based on one instrument of government environmental regulation to study its direct impact on environmental performance and green technology innovation, with few combining government macro-regulation with green technology innovation and environmental performance in the same framework. Therefore, the focus of this paper is to identify the transmission path of enterprise green technology innovation performance and design corresponding policy tools to promote green technology innovation to achieve green transformation development.
As the world’s largest financier of coal-fired electricity, China’s resolution to propose no new coal-fired power projects overseas in 2021 reflects the country’s determination to address climate change but also rings an alarm bell for coal companies. The carbon peak and carbon-neutral targets will push back the green and low-carbon transformation of the energy system. The energy structure of coal-dominated poses serious challenges to carbon emission reduction, and green transformation and upgrading become the inevitable choice for coal enterprises. In this context, we selected listed companies in the coal industry as the research object to explore the impact of green technology innovation of coal enterprises on comprehensive environmental and economic performance under different government macro-regulation instruments, with the aim of helping coal enterprises to implement green transformation and upgrading, strengthen the level of government regulation, and provide a theoretical basis for improving the environmental governance system.
In summary, in order to strengthen the internal driving force of green technology innovation in coal enterprises and to play the regulatory role of the visible hand of the government, the following questions need to be urgently addressed: (1) whether there is a positive relationship between green technology innovation and the environmental performance of enterprises; (2) how government subjects play a regulatory role, mediating green technology innovation and the environmental performance of enterprises; and (3) whether there are differences in the effects of different types of government regulation instruments. In order to solve the above problems, we constructed a theoretical model to test the relevant empirical evidence. The main innovations of this work are as follows. First, based on the triple bottom line principle, we constructed a comprehensive environmental performance evaluation index system considering three levels—economic, social, and environmental—and incorporated environmental performance and economic performance into the same framework according to the characteristics of coal enterprises. Furthermore, a carbon emission management module is introduced in the environmental layer through evaluation indices to evaluate the enterprise performance level more comprehensively. Second, government macro-regulation was taken as the regulating variable, and the performance transmission effect of green technology innovation in coal enterprises was explored by combining external pressure and internal driving factors. Third, government macro-regulation was divided into three dimensions, and the regulating effects of government macro-regulation behaviors were refined through implementation of environmental regulations, green credit policies, and fiscal incentives.
2. Theoretical Analysis and Research Hypothesis
2.1. Green Technology Innovation and Environmental Performance
The Organization for Economic Cooperation and Development (OECD) defines green innovation as new ways of improving products and processes that have a positive impact on the environment. Sustainable development cannot be achieved without advances in green technology, and green technology innovation is the optimal tradeoff that firms make between economic growth and environmental damage (Krabbe, 1992) [5]. Green technology innovation is mainly influenced by factors such as government regulatory pressure (Cheng et al., 2020) [6] and public environmental awareness (Qin et al., 2022) [7], and companies can improve their environmental management performance by solving environmental problems and simultaneously maintaining their corporate reputation to gain competitive advantage through green innovation activities (Li et al., 2017) [8]. Li et al. (2020) constructed a theoretical model of the environmental performance of green innovation based on the principles of meso-stem science and empirically concluded that green innovation contributes to environmental improvement but has a degree of rebound effect [9]. Based on the theory of circular economy, there are two main ways to promote ecological environmental protection through green technological innovation. On the one hand, by adopting new green processes and technologies, enterprises can reduce the production of three types of waste and other pollutants or maximize harmless treatment in the production process and promote the recycling of resources. On the other hand, through green technology innovation, enterprises can improve the efficiency of resource utilization, increase the output efficiency of green products, and achieve a positive increase in the capacity of ecological environmental protection and the economic benefits of enterprises.
Based on the above analysis, hypothesis 1 is proposed.
H1:
Green technology innovation contributes to the improvement of enterprise environmental performance.
2.2. The Regulatory Role of Government Macro-Control
(1) The regulating role of environmental regulation
Environmental protection has public goods attributes compared to its weak market-driven ability, which makes government macro-environmental regulation the main driver of green transformation and upgrading for heavily polluting firms. Firms’ perceived technological innovation opportunities and benefits differ under different environmental regulation policies, which, in turn, can affect their innovation levels (You et al., 2022) [10]. The well-known Porter hypothesis, one of the most representative views of environmental regulation, argues that environmental regulation promotes innovation, improves firms’ environmental performance, and promotes steady economic growth while achieving environmental protection. Some scholars also hold the opposite view, arguing that environmental regulation has a crowding-out effect on original investment and that increased environmental investment negatively affects firms’ economic performance and discourages innovative behavior. Through empirical research, Liang et al. (2021) found that the effects of command-and-control and market-incentive environmental regulations differed in terms of the three levels of green technological innovation [11]. Based on an integrated supply chain model, Zhu et al. (2015) concluded that all three types of government incentives and penalties have incentive effects on green technology innovation and environmental performance, with different effects on economic performance [12].
Enterprises mainly achieve green transformation and upgrading through green technology innovation. The complexity of technological innovation itself, the uncertainty of the market prospect of innovation results, and the fact that technological innovation often requires huge investment and even cannot recover the capital once the innovation fails have hindered the technological innovation behavior of enterprises to a certain extent. However, in the context of environmental regulation, technological innovation further introduces a green connotation; the public’s environmental awareness is getting stronger, and enterprises are not only under pressure from the government but also face the supervision of the whole society, which, to a certain extent, reverses enterprises’ attitudes toward technological innovation, with an increasingly close relationship between green technological innovation and enterprises’ environmental performance becomes. Based on the choice of environmental strategy, enterprises actively fulfill their environmental responsibility and increase environmental protection investment. In the short term, environmental regulation may inhibit the environmental and economic benefits of green technology innovation due to rising costs, but as the intensity of environmental regulation increases, green transformation and upgrading become inevitable, and enterprises accelerate green transformation and upgrading through green technology innovation to show their environmental responsibility attitudes to society so as to drive consumption and ultimately achieve a combination of economic, environmental, and social benefits.
Based on the above analysis, hypothesis 2 is proposed.
H2:
Government environmental regulation plays a U-shaped regulating role in the relationship between green technology innovation and environmental performance.
(2) Moderating effect of green credit policy
The level of environmental performance affects the financing cost of enterprises; banks ensure the quality of loans and reduce the proportion of non-performing loans by reviewing the environmental performance level of relevant enterprises before lending, and investing assets in environmental management actions becomes the final choice of enterprises and banks (Wang, 2016) [13]. The development of green credit policy is based on the theory of sustainable development; green credit is a concerned of all parties in society in the process of implementation, and enterprises need to disclose relevant information in a timely manner to reduce pollution emissions, improve environmental levels, and enhance environmental performance in order to obtain green credit funds (Han and Wang, 2014) [14]. Positive environmental information disclosure helps companies to obtain bank loans and further reduce debt financing costs (Ni and Kong, 2016) [15]. Green credit policy can effectively reduce the uncertainty and risk level of R&D and further encourage firms to engage in innovative activities by promoting the mediating variable of corporate R&D investment (He et al., 2019) [16]. Bian et al. (2022) found that incentive-based environmental regulation policies and green credit policies are effective in promoting enterprises’ green technology innovation by constructing a three-way evolutionary game model among the government, banks, and enterprises; however, there are certain policy conflicts in the dynamic evolutionary process [17]. A green credit policy is an important decision of the government to introduce economic instruments into environmental protection. Bank credit is one of the most important sources of funds for enterprises, and the green attribute requires enterprises to disclose their internal environmental performance in a timely manner, which restricts the flow of funds to heavy polluters and increases financing costs. Therefore, coal companies prefer to rely on the advantages of scientific and technological resources to explore low-carbon development pathways, enhance production efficiency through technological transformation, reduce energy consumption and pollutant emissions, promote the green flow of funds, and improve environmental performance to obtain green funding support.
Based on the above analysis, hypothesis 3 is proposed.
H3:
The implementation of green credit policy increases the financing cost of enterprises and encourages them to improve the level of environmental performance through green technological innovation.
(3) The moderating role of fiscal incentives
By constructing a research framework for the integration of fiscal and tax policies and innovation efficiency, Cao et al. (2018) empirically concluded that government fiscal and tax incentive behaviors have an incentive effect on innovation inputs and outputs but that differences in the target behaviors of government and enterprises can hinder the innovation transformation mechanism and affect innovation efficiency [18]. Through empirical analysis, Ning et al. (2019) concluded that fiscal and tax policies have incentive effects on technological innovation activities through direct financial subsidies while providing indirect benefits; however, there are differences in the degree of incentives [19]. Providing fiscal incentives for corporate environmental behavior helps to increase the motivation of companies to obtain legitimate resources through proactive environmental responsibility, which, in turn, improves corporate environmental performance (Luo, 2020) [20]. From a social responsibility perspective, Wu and Huang (2015) empirically found that government subsidies enhance firms’ willingness to invest in environmental protection funds for environmental management and improve their environmental performance [21]. Based on the signaling effect, enterprises that obtain government subsidies send positive signals of green development to the outside world, which not only solve the funding problem of green technology innovation but also attract more investors who follow the government’s choice, further alleviating the financing problem and improving the motivation of enterprises to practice green innovation (Chen et al., 2019) [22]. In summary, the innovative behavior of firms enables them to gain competitive advantages and increase profits in a “perfectly competitive” state. However, the risk and uncertainty of innovation activities often restrict the innovation behavior of enterprises, and government fiscal incentives enable enterprises to obtain additional subsidies to correct market failure with respect to technological innovation activities, strengthening the environmental and economic benefits of green upgrading through green technology innovation.
Based on the above analysis, hypothesis 4 is proposed.
H4:
Government fiscal incentives make enterprises more willing to improve environmental performance through green technology innovation.
Based on the above research hypotheses and combined with the research objectives of this paper, the propose the theoretical model of this study, as shown in Figure 1.
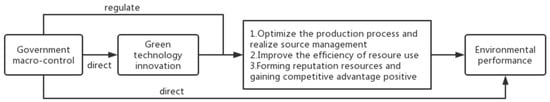
Figure 1.
Schematic diagram of the research framework.
3. Research Design
3.1. Sample Selection and Data Source
We selected listed coal companies as the research object. In 2010, China proposed to establish and improve the carbon emission trading system. The time span of this study is 2010–2020. As one of the industries with the most serious industrial pollution record and under the most pressure of green transformation, the sample reported in this paper was selected to be representative. The sample was screened, and companies with incomplete disclosure and missing variables in their annual reports were excluded; ultimately, 297 valid samples were obtained. The environmental performance data reported in this paper were collected manually from the publicly disclosed financial reports, social responsibility reports, and environmental reports of listed companies. The data on green technology innovation were obtained from the SPOOT patent website. The data on environmental regulation were obtained from the Environmental Statistics Yearbook. All other data were obtained from the WAND database. The continuous variable data were treated with 1% tail reduction. We used Stata version 15.0 for empirical testing.
3.2. Model Design and Variable Setting
3.2.1. Construction of Environmental Performance Indicators
(1) Selection of indicators
The construction of indicators in this study was based on four basic principles—comprehensiveness, scientificity, independence, and representativeness—according to the GRI Sustainability Reporting Guidelines and the triple bottom line principles of economy, society, and environment. The indicators of the economic layer were selected to represent the basic indicators of enterprise profitability; the indicators of the social layer were selected from the perspectives of government, public, and internal employees; and the environmental layer was designed based on several dimensions of pollution prevention and control, environmental management, and carbon emission management, in combination with reference to the previous work of research scholars (Shou Ying et al., 2019; Zhang et al., 2019; Wang et al., 2016) [23,24,25]. Ultimately, 3 primary indicators, 8 secondary indicators, and 32 basic indicators were determined. The details are shown in Table 1.

Table 1.
Indicators of environmental performance.
(2) Weight setting
In this study, the CRITIC method was used for objective weighting.
Initially, the data were dimensionless.
Next, the following indicators were derived by applying the formula.
Variability of indicators:
Conflicting nature of indicators:
Amount of information:
Objective weights:
The results of indicator weights are shown in Table 2. The weighted summation method was applied to fit the sample data with the indicator weights to obtain the final environmental index (EI). The higher the EI, the better the environmental performance level of the enterprise.
Table 2.
Weight of index.
3.2.2. Variable Setting
The variables used in this study were selected as shown in Table 3.
Table 3.
Variable selection.
(1) Explained variables
Environmental performance (EI). At present, scholars use both qualitative and quantitative methods to measure environmental performance, which are divided into absolute indicators (e.g., pollutant emissions), relative indicators (e.g., emission fees per unit of business income), and weighted indicators (e.g., constructing a comprehensive evaluation index system) in nature, etc. Because it is difficult to comprehensively measure the level of environmental performance with a single indicator, we combined previous research based on the triple bottom line principle to construct a comprehensive environmental performance evaluation index system and measure the level of environmental performance based on the calculated environmental index (EI).
(2) Explanatory variables
Green technology innovation (Patent). Enterprises can gain sustainable competitive advantage through green technology patents (Dangelico et al., 2013) [26], and there are various available measurement indicators of green technology innovation. For example, Dong and Wang (2019) constructed a quadratic curve model of environmental regulation and technological progress by expressing green technology progress in terms of the number of green technology patents per 10,000 R&D population [27]. The number of patents granted represents the R&D output of enterprises’ green technology innovation and reflects their green technology innovation capability. Therefore, we used the number of patents granted as a basic indicator of green technology innovation, and in order to avoid the influence of individual extreme values and conform as much as possible to the normal distribution to satisfy the model assumptions, we logarized the indicator and further smoothed the data to the right by 1 unit in order to make the data meaningful so that patent = Ln (number of patents granted + 1).
(3) Moderating variables
① Environmental regulation (ER).
Environmental regulation is a policy tool used by the government to avoid the pollution of the ecological environment by the production behavior of enterprises. At present, there is no unified standard for the measurement of environmental regulation; existing measurement indicators of environmental regulation include high-level pollution control investment per unit of industrial output value (Liu et al., 2019) [28], pollution emission intensity (Si, 2020) [29], and the proportion of energy-saving and environment-related vocabulary frequency (Zhou and Han, 2020) [30]. The government’s environmental expenditure is an important source of environmental governance and responds to the government’s environmental regulation intensity; therefore, we drew on the work of Liu and He (2021) [31] to represent the intensity of environmental regulation according to the ratio of total completed investment in industrial pollution control relative to the value added by secondary industry, using specific data from the Yearbook of Environmental Statistics and the National Bureau of Statistics.
② Financial incentives (FT).
Most of the loans of heavily polluting listed companies come from banks, and after the implementation of green credit policy, banks will measure the green capital flow of enterprises, as well as their environmental performance, which increases their financing constraints for heavily polluting listed companies and forces coal enterprises to adopt to green practices. China began to implement a green credit policy in 2007, and the level of financing constraints on enterprises after the implementation of the green credit policy reflects, to some extent, the effect of the green credit policy. Therefore, we drew on the SA index mentioned by Ju et al. (2013) [32] to reflect the constraints of the green credit policy on enterprises.
③ Green credit policy (GL).
Fiscal incentive policy is a means for the government to achieve policy goals, alleviate the market failure problem, and macro-control the environmental problems of enterprises. The government mainly carries out fiscal incentives by means of fiscal subsidies and tax incentives; we initially adopted the perspective of fiscal subsidies and drew on existing literature (Yang et al., 2015) [33] to represent the level of fiscal incentives received by enterprises according to the natural logarithm of direct government subsidies.
(4) Control variables
Size of the company (Size). Enterprise size is mainly reflected in human and financial resources. Large enterprises often have an advantage in terms of human resources, which provide a knowledge base for enterprise innovation and enable enterprises to better adopt green technology innovation. Secondly, enterprises with a large scale often have brand advantages, and the green products obtained through green technology innovation are more likely to be recognized by consumers, which can enhance the competitiveness of enterprises, in addition to improving environmental and economic performance. In addition, enterprises with a large scale have relatively sufficient financial resources, and the economy-of-scale effect also helps to reduce the innovation cost, which, in turn, influences the green innovation decisions of enterprises. Therefore according to existing research, enterprise scale was used as a control variable in this study.
Shareholding concentration (Oc). The shareholding ratio of the top-three shareholders reflects the degree of concentration of equity. The higher the concentration of equity, the more the decision-making power of the company is concentrated in the hands of the controlling shareholders, and the interests of the major shareholders are more convergent with those of the company. Compared with minority shareholders, major shareholders attach more importance to long-term interests and tend to maintain corporate reputation and obtain long-term environmental and economic benefits by fulfilling environmental responsibilities and making green innovations.
Growth of the company (Growth). The assessment of the growth capability of an enterprise affects the decision-making behavior of investors. When the growth capability of an enterprise is high, it has sufficient funds to carry out green innovation activities, and green innovation, in turn, promotes the competitiveness of the enterprise, which, in turn, enhances the growth capability of the enterprise. Therefore, we referred to the method of Chi (2021) [34] to measure the growth ability of enterprises according to the growth rate of main business revenue.
Percentage of independent directors (Ind). As members of the board of directors, independent directors do not have significant interests within the enterprise and play a supervisory role in the corporate governance structure. Independent directors are able to represent the perspective of stakeholders and prevent corporate decision makers from making decisions that deviate from the interests of stakeholders for their own benefit, promoting corporate responsibility for environmental protection and improving the level of environmental performance.
Capital intensity (Capin). On the one hand, higher capital intensity may help human capital and physical capital to support green factors, improve production efficiency, and promote environmental performance; on the other hand, it may have a crowding-out effect on green technology factors, resulting in a waste of resources, which is not conducive to green and high-quality development of enterprises. Therefore, in this paper, capital intensity was used as a control variable based on existing studies.
3.2.3. Model Construction
To test hypothesis H1 and examine the effect of green technology innovation on environmental performance, a multiple linear regression model was constructed (6).
where i,t represent the industry and the year, respectively; EIi,t represents the environmental performance of the firm, Patenti,t represents the level of green technology innovation; Sizei,t, Oci,t, Growthi,t, Indi,t, Capini,t, and Zonei,t represent the control variables of firm size, shareholding concentration, growth, independent director ratio, capital intensity, and regional attributes, respectively; and εi,t is a random disturbance term.
EIi,t=μ0 + μ1Patenti,t + μ2Sizei,t + μ3Indi,t + μ4Oci,t + μ5Growthi,t + μ6Capini,t + μ7Zonei,t + εi,t
To test hypothesis H2–H4, the moderating role of environmental regulation, green credit policy, and fiscal incentives in the relationship between green technology innovation and environmental performance was tested by introducing the cross-product term based on the baseline regression model (6), as shown in models (7), (8), and (9).
EIi,t = α0 + α1Patenti,t + α2ERi,t + α3ERi,t × Patenti,t + α4ERi,t2 + α5ERi,t2 × Patenti,t + α6Sizei,t + α7Indi,t +
+ α8Oci,t + α9Growthi,t + α10Capini,t + α11Zonei,t + εi,t
+ α8Oci,t + α9Growthi,t + α10Capini,t + α11Zonei,t + εi,t
EIi,t = β0 + β1Patenti,t + β2GLi,t + β3GLi,t × Patenti,t + β4Sizei,t + β5Indi,t + β6Oci,t + β7Growthi,t + β8Capini,t + β9Zonei,t + εi,t
EIi,t = γ0 + γ1Patenti,t + γ2FTi,t + γ3FTi,t × Patenti,t + γ4Sizei,t + γ5Indi,t + γ6Oci,t + γ7Growthi,t + γ8Capini,t + γ9Zonei,t + εi,t
4. Empirical Analysis
4.1. Descriptive Statistical Analysis
As can be seen from Table 4, the maximum values of the environmental index (EI) is 89.4, the minimum value is 4.85, the mean value is 43.47, the standard deviation is 22.01, and P75 is 58.69, indicating that the environmental index of the sample companies has a large gap, there is a lack of uniform standards for environmental information disclosure, the overall environmental information disclosure situation is not optimistic, and there are leaders in environmental socioeconomic responsibility as a whole but that the overall environmental performance of most listed coal companies is still unsatisfactory. The mean value of the number of patents granted is 1.65, and the standard deviation is 1.75, with a large coefficient of variation, indicating a large gap in the level of green technology innovation among the sample companies. The mean value of green credit policy is 3.67, the maximum value is 4.15, the minimum value is 2.67, and the standard deviation is 0.29, which means that the sample companies are subject to relatively average financing constraints and that the overall level of constraints is higher. In addition, in terms of regional distribution, most of the sample enterprises are located in underdeveloped regions. To further verify the accuracy of the regression model, a J-B test was conducted on the residuals of the multiple linear regression model (1), with a p-value of 0.0826 > 0.05. The original hypothesis was accepted, and the residuals were consistent with the normal distribution, indicating that the setup of the linear regression model used in this study is reasonable.
Table 4.
Description of statistical results.
4.2. Correlation Analysis
In this study, Pearson’s correlation test was conducted on the variables; the specific results are shown in Table 5.
Table 5.
Pearson correlation coefficient.
As can be seen from Table 5, the correlation coefficient between the explained variables environmental performance (EI) and the explanatory variable green technology innovation (Patent) is 0.632, and the result is significant at the 1% level, indicating that environmental performance and green technology innovation have a positive effect, which tentatively verifies hypothesis 1. The correlation coefficients between environmental regulation (ER), green credit policy (GL), government fiscal incentives (FT), and environmental performance and green technology innovation passed the 1% level test, whereas other control variables showed different degrees of correlation, indicating that the selection of variables in this study was reasonable. Furthermore, the inflation factor (VIF) was calculated, with a mean value of 1.9 and values for each of the variables ranging between 1 and 3, indicating a lack of multicollinearity.
4.3. Regression Analysis
In order to verify the relationship between green technology innovation (Patent)and comprehensive environmental performance (EI), as well as the moderating effect of different government macro-control instruments, regressions were conducted on models (6)–(9), the results of which are shown in Table 6. As shown in column (1) of Table 6, the coefficient of Patent is 0.350, and the regression coefficient is significant at the 1% level. The green technology innovation and environmental index passed the correlation coefficient test, with a mean VIF value of 1.9, no serious multicollinearity, and an adjusted R2 of 0.6464; therefore, the fit met the criteria, and the results indicate that green technology innovation helps to improve the level of corporate environmental performance.
Table 6.
Regression result.
In Table 6, column (2), column (3), and column (4) regress the moderating effects of government environmental regulation, green credit policy, and fiscal incentive behavior, respectively. The results all pass the multicollinearity test. The ER2 × Patent coefficient is 0.0321, and the regression coefficient is not significant; therefore, hypothesis H2 was not confirmed, i.e., environmental regulation may not play a U-shaped regulatory role. The GL × Patent coefficient is 0.110, passing the significance test at the 1% level, indicating that the government implements green credit policy, incorporates the results of environmental performance assessment into the financing link, and increases the credit cost of heavily polluting enterprises, forcing coal enterprise capital to flow to green construction and promoting green transformation and upgrading; therefore, hypothesis H3 was verified. The FT × Patent coefficient is 0.0237, the regression result did not pass the significance test, and government fiscal incentives with respect to green technology innovation and environmental performance are not linearly related; therefore, hypothesis H4 was not verified.
In order to test the effect of government environmental regulation and fiscal incentives, we conducted further analysis. As shown in column (2) of Table 6, the coefficient of environmental regulation one-time cross product is significant, and there may be a linear regulation effect; the linear regulation of environmental regulation and the U-shaped regulation effect of fiscal incentives were tested separately. As shown in column (5) and column (6) of Table 6, the ER × Patent coefficient is −0.0773, and the FT2 × Patent coefficient is −0.118, passing the significance test at the 5% and 1% levels, respectively, indicating that the stronger the intensity of government environmental regulation, the greater the suppressive effect of the negative externality of green technology innovation crowding on environmental performance. Fiscal incentives have an inverted U-shaped moderating effect on green technology innovation and environmental performance, and the initial implementation of fiscal incentives enhances the promotion effect of corporate green technology innovation on environmental performance, although the implementation effect may slowly diminish.
4.4. Robustness Test
Because there is a certain lag effect in the formulation as well as in the implementation of government policies, in order to ensure the reliability of the results, we conducted a one-period lag test on the explained variables. The regression results are shown in Table 7. Column (1) of Table 7 shows the results of the main regression effect of green technology innovation and lagged one-period environmental performance; the Patent coefficient is 0.391, which passes the significance test at the 1% level, and the results indicate that the promotion effect of green technology innovation on lagged one-period environmental performance is still significant. As shown in columns (2)–(4) of Table 7, the moderating effects of the three government macro-control instruments pass the significance test, and green credit policy still plays a positive moderating role in the relationship between green technology innovation and lagged one-period environmental performance, and environmental regulation and fiscal incentives still play a negative moderating and U-shaped moderating role, respectively, in the relationship between green technology innovation and lagged one-period environmental performance, indicating that the results of this paper are robust to a certain extent.
Table 7.
Robustness test regression results.
5. Further Analysis
In this paper, we further examined the role of the resource mismatch problem in coal enterprises on the relationship between green technology innovation and environmental performance. Resource mismatch has become a common problem across industries due to information asymmetry and imperfect market development. Factor market distortion can inhibit innovation efficiency (Bai and Bian, 2016) [35], as well as the scale of corporate R&D investment (Zhou and Hai, 2020) [36], and capital resource mismatch can lead to an increase in corporate financing costs and inhibit innovation activities (Kang, 2014) [37]. Therefore, we propose hypothesis H3: the greater the degree of resource mismatch, the less significant the impact of green technology innovation on environmental performance. We drew on the work of Lv and Wang (2019) [38] to measure the degree of resource mismatch of coal enterprises in terms of both capital and labor. The degree of capital (labor) resource mismatch is the degree of deviation of the sample firms from the industry average cost of capital (labor) use. Accordingly, the following model was constructed in this study.
EIi,t = ɵ0 + ɵ1Patenti,t + ɵ2Lmsi,t+ɵ3Lmsi,t × Patenti,t + ɵ4Sizei,t + ɵ5Oci,t + ɵ6Growthi,t + ɵ7Indi,t + ɵ8Capini,t + ɵ9Zonei,t + εi,t
EIi,t = ɳ0 + ɳ1Patenti,t + ɳ2Kmsi,t+ɳ3Kmsi,t × Patenti,t + ɳ4Sizei,t + ɳ5Oci,t + ɳ6Growthi,t + ɳ7Indi,t + ɳ8Capini,t + ɳ9Zonei,t + εi,t
Model (10) tests the moderating effect of capital resource mismatch on green technology innovation and environmental performance, and model (11) tests the moderating effect of labor resource mismatch on green technology innovation and environmental performance. Lmsi,t indicates the degree of capital resource mismatch, and Kmsi,t measures the degree of labor resource mismatch.
As shown in Table 8, the maximum value of capital resource mismatch in the sample industries is 3.999, the minimum value is −0.868, the mean value is −0.024, and the standard deviation is 0.849. The difference in the degree of capital resource mismatch in the sample companies is large, and the difference in the degree of capital resource mismatch in the sample companies is much higher than that of labor resource mismatch.
Table 8.
Statistical results of resource misallocation description.
According to regression analysis of model (10) model (11), as shown in column (1) and column (2) of Table 9, the Lms × Patent coefficient is −0.0605, and the Kms × Patent coefficient is −0.0494, passing the significance test and indicating that corporate resource mismatch has an inverse moderating effect on green technological innovation and environmental performance.
Table 9.
Resource mismatch regression results.
6. Discussion
6.1. Conclusions
In this paper, we argue that under the new situation of “carbon peaking” and “carbon neutral”, green technology innovation is the main driving force to realize the new green development concept, and enterprises can achieve both environmental performance and economic performance through green technology innovation. However, the huge amount of capital and uncertainty required for green technology innovation may inhibit enterprises’ enthusiasm for green innovation, whereas the government, as a policy maker, plays an important role in guiding and encouraging enterprises to take initiative in environmental management and compensate for market failure. Therefore, we incorporated green technology innovation, comprehensive environmental performance, and government macro-regulation into the same framework and tested the rationality of the hypotheses through a series of empirical analyses by constructing a regression model with moderation. The main findings are as follows.
First, green technology innovation helps to improve the level of environmental performance of enterprises. Green upgrading through green technology innovation cannot only improve the efficiency of resource utilization and reduce pollutant emissions but also convey to society the active fulfillment of environmental responsibility, reduce information asymmetry with investors so as to drive green consumption, and realize the overall improvement of environmental, economic, and social integration of the environmental performance level.
Secondly, government macro-control has a moderating effect on green technology innovation and environmental performance. Uncertainty, high risk, and other limitations of technological innovation activities often discourage enterprises, whereas government intervention can guide green consumption behavior, reduce the hindrance of enterprises in the innovation process, correct market failure, stimulate enterprises’ green innovation behavior, and promote the fulfillment of corporate environmental social responsibility.
Thirdly, government macro-control instruments do not have the same moderating effect on the relationship between green technology innovation and environmental performance. The implementation of green credit policy has a positive regulating effect on the environmental and economic benefits of green technology innovation, and the implementation of green credit policy has increased the financing constraints on heavily polluting enterprises, which must improve their comprehensive environmental performance through green transformation and upgrading in order to obtain green financial support. Environmental regulation has a negative moderating effect, and from the current perspective, it can weaken the contribution of green technology innovation to environmental performance. Fiscal incentives have an inverted U-shaped regulation effect; appropriate fiscal incentives play a positive role, but excessive subsidies have a negative effect.
Fourthly, resource mismatch weakens the contribution of green technology innovation to environmental performance. Compared with the traditional production model, green technology innovation requires higher efficiency in terms of talent allocation and factor resource use. When the labor market is distorted, the high-quality talents required for green technology innovation cannot be reasonably allocated, which hinders the transformation of green innovation knowledge and inhibits the green optimization and upgrading of industrial structure, thus inhibiting the enhancement of environmental performance. When the capital market is distorted, the financing dilemma of green technology innovation increases, leading to a further reduction in resource allocation efficiency, thus weakening the positive impact of green technology innovation on environmental performance.
6.2. Research Significance
My dissertation contributes to several research directions in accounting. First, my dissertation complements related research on green technology innovation (e.g., Zhang and Fang, 2022; Wei et al., 2022; Xiaon et al., 2022) [39,40,41] and environmental performance by examining the mechanisms of action of green technology innovation affecting firms’ environmental performance. Secondly, my study constructs an empirical model with regulation, which provides a theoretical basis for the ubiquitous moderating role of government macro-regulation, complementing previous related studies on green technology innovation and environmental performance (e.g., Li et al., 2019; Wang et al., 2021; Wang et al., 2021) [42,43,44]. By combing previous studies of scholars on green technology innovation and environmental performance, we found that most studies are based on one instrument of government environmental regulation and an investigation of its direct impact on environmental performance and green technology innovation, whereas few studies have included government macro-regulation with green technology innovation and environmental performance in the same framework to study its indirect regulatory role and to explore the effects of different government macro-regulation instruments. Therefore, the study reported in this paper provides new insights, drawing on previous work.
6.3. Research limitations
First, by constructing a model and conducting a series of empirical tests, we were able to clarify the internal logic and mechanism of action of the relationship between green technology innovation and environmental performance, which represents a contribution to the overall testing effect of hypothesis 1. However, we only tested one possible causal path, which does not exclude the possibility that other factors may influence the overall model relationship through other paths. Therefore, future research can further explore whether there are other causal paths and whether there are differences in the implementation effects of different factors.
Secondly, we selected listed coal companies as the research object; therefore, the generalizability of the findings is not sufficient, and additional research should be conducted in other industries in the future. The top-down governance model in China may increase the significance of the effect of the role played by government macro-regulation and may produce different effects when applied to other countries. In addition, the number of coal enterprises in China is large, although limited data are available, and after eliminating the missing data variables, the data on listed coal companies were further reduced, resulting in insufficient sample data in this study, which may have had an impact on the results.
Thirdly, there is no unified standard for environmental information disclosure in China, and each enterprise may selectively disclose information that is favorable to itself, resulting in a lack of a true measure of the status of corporate environmental responsibility fulfillment. There are also no uniform standards for environmental performance evaluation indicators, and the selection of measurement indicators may have an impact on the results. Therefore, future research should improve on the above issues.
6.4. Research Recommendations
First, at the enterprise level, enterprises need to increase investment in R&D and optimize the energy industry structure. At present, the development of high-carbon industries is restricted, and coal enterprises need to rely on green technological innovation to achieve green transformation and upgrading and actively fulfill their environmental responsibilities. In the production process, it is necessary to improve the efficiency of resource utilization and reduce the generation of pollutants at the source, focus on the skills training of R&D personnel, improve innovation ability, and produce green products that meet consumer preferences through green technology innovation, which helps to improve the competitiveness of enterprises and enables them to improve their environmental performance while increasing profits.
Secondly, at the government level, because different government intervention instruments have different effects on the relationship between green technology innovation and environmental performance, government intervention instruments should be tailored to local conditions to avoid the problem of resource mismatch caused by excessive intervention. Government should actively promote green credit policy and strengthen green credit auditing and supervision mechanisms in combination with big data information mining technology to rate green credit funds and incorporate an environmental information disclosure system to strengthen stakeholder supervision. At present, for coal enterprises, the negative externality effect of environmental regulation between green technology innovation and environmental performance is obvious; according to Porter’s hypothesis, environmental regulation plays a role in forcing green innovation in the long run, so we should control the intensity of environmental regulation to ensure that it plays a positive role in improving environmental performance. With respect to government subsidies, we should clarify the scope of the use of funds, strengthen audit supervision of government subsidies, and ensure that government subsidies are used for green projects, in addition to scientifically selecting subsidized units and subsidies. Government subsidies should be used to improve environmental performance and achieve win–win environmental and economic benefits. In addition, there is still no unified standard for an environmental performance evaluation system. The government should establish a sound environmental information disclosure policy to guide enterprises to actively disclose relevant information; reduce information asymmetry; and increase the importance of environmental protection to the government, enterprises, and society so as to achieve the goal of improving the environment.
Thirdly, at the public level, environmental protection publicity should be strengthened to encourage consumers to consume green products, increase their willingness to purchase green products, reach a green consensus among producers and consumers, and strengthen the relationship between green development and economic performance so as to promote the green flow of corporate funds.
6.5. Future Prospects
Under the new situation of “carbon peaking” and “carbon neutral”, further research is required to investigate the following aspects.
(1) Research on the influence of informal institutions on green technology innovation and environmental performance.
According to new institutional economics, informal institutions are unwritten values, ethical norms, customs, and codes of conduct that have been agreed upon, which play an important role in the system of human behavior constraints. The mechanism of the influence of informal institutions (such as traditional culture, religion, and social trust) on green technology innovation and environmental performance can be further studied in the future in order to improve institutional theory.
(2) Research on the impact of green technology innovation on environmental performance and macroeconomics in the post-pandemic era.
The impact of the pandemic is still very profound, affecting every individual, family, country, and even the global community as a whole, from the level of values to behavior patterns, including the development of environmental issues and environmental law. On the other hand, globalization is a topic that is closely related to environmental protection, especially global environmental issues. With the development of economic globalization and the scale and effect of ecological globalization, the other side of economic development, i.e., globalized environmental issues, has become increasingly prominent and important.
Author Contributions
Conceptualization, M.Z. (Maochun Zhou) and M.Z. (Min Zhao); methodology, M.Z. (Min Zhao); data curation, M.Z. (Min Zhao); writing—original draft preparation, M.Z. (Min Zhao); writing—review and editing, M.Z. (Min Zhao); funding acquisition, M.Z. (Maochun Zhou). All authors have read and agreed to the published version of the manuscript.
Funding
This research was funded by University Research Fund of Education Department of Liaoning Province grant number LJKR0140. The APC was funded by Liaoning Technical University.
Institutional Review Board Statement
Not applicable.
Informed Consent Statement
Not applicable.
Data Availability Statement
The data presented in this study are available on request from the corresponding author. The data are not publicly available, owing to privacy concerns.
Conflicts of Interest
The authors declare no conflict of interest.
References
- Wang, B.B.; Zhao, C. China’s Green Technological Innovation: Patent Statistics and Influencing Factors. J. Ind. Technol. Econ. 2019, 38, 53–66. [Google Scholar]
- Zhang, L.K.; Zhang, Y.P.; Liang, Y. The Measurement and Evaluation of Green Technology Innovation Efficiency of Industrial Enterprises in China:Analysis Based on Network Super SBM-Malmquist Mode. J. Technol. Econ. 2022, 41, 13–22. [Google Scholar]
- Wang, F.Z.; Jiang, T.; Guo, X.C. Government quality, environmental regulation and green technological innovation of enterprises. Sci. Res. Manag. 2018, 39, 26–33. [Google Scholar] [CrossRef]
- Li, Y.N.; Lin, J.; Qian, Y.J. Manufacturer’s Green Production Decision under Environmental Regulation and the Influence of Technology Learning Factors. Chin. J. Manag. 2019, 16, 721–727. [Google Scholar]
- Krabbe, J.J.; Heijman, W.J.M. National Income and Nature: Externalities, Growth and Steady State; Springer: Dordrecht, The Netherlands, 1993. [Google Scholar]
- Cheng, Q.W.; He, X.X.; Li, B.S. Green technology innovation efficiency and its influencing factors: Empirical study based on 35 industries in China. J. Cent. South Univ. (Soc. Sci.) 2020, 26, 97–107. [Google Scholar]
- Qin, B.T.; Guo, Y.G.; Ge, L.M. How Public Participation Affects Corporate Green Technology Innovation? Analysis Based on Intermediary Effect and Spatial Effect. J. Technol. Econ. 2022, 41, 50–61. [Google Scholar]
- Li, Y.N.; Xu, L. Competitive Environment, Green Practices and Performance. Sci. Sci. Manag. Sci. Technol. 2017, 38, 44–54. [Google Scholar]
- Li, K.J.; Dong, D.D.; Han, Y.F. The Analysis on the Environmental Performance of Green Innovation An Examination Based on Spatial Spillover Effect and Rebound Effect. China Soft Sci. 2020, 20, 112–121. [Google Scholar]
- You, D.M.; Li, L.N. Environmental Regulation Intensity, Frontier Technology Gap and Firms’ Green Technology Innovation. Soft Sci. 2022, 36, 108–114. [Google Scholar] [CrossRef]
- Liang, M.; Cao, H.J.; Chen, Z.W. Environmental Regulation, Environmental Responsibility and Enterprise Green Technological Innovation. Enterp. Econ. 2021, 40, 15–23. [Google Scholar] [CrossRef]
- Zhu, J.F.; Yv, P.L.; Shi, J.G. Study on the Relationship between Green Technical Innovation, Environmental Performance, Economic Performance and Governmental Rewards and Punishments: Based on Integrated Supply Chain. Forecasting 2015, 34, 61–66. [Google Scholar]
- Wang, X.R. Environmental Improvement Investment and Quality of Bank Assets: An Analysis Based on Green Credit. Financ. Forum. 2016, 21, 12–19+60. [Google Scholar] [CrossRef]
- Han, L.Y.; Wang, Z. International Comparison and Insights of Green Credit Development. J. Int. Econ. Coop. 2014, 2, 90–94. [Google Scholar]
- Ni, J.; Kong, L.W. Environmental Information Disclosure, Bank Credit Decisions and Debt Financing Cost: Evidence from the Listed Company in Heavy Polluting Industries of A-Shares in Shanghai Stock Market and Shenzhen Stock Market. Econ. Rev. 2016, 149–158. [Google Scholar] [CrossRef]
- He, L.Y.; Liang, X.; Yang, X.L.; Zhong, Z.Q. Can Green Credit Promote the Technological Innovation of Environmental Protection Enterprises? Financ. Econ. Res. 2019, 34, 109–121. [Google Scholar]
- Bian, C.; Chu, Z.P.; Sun, Z.L. Policy Simulation Modeling Environmental Regulation and Green Credit in Enterprise’s GreenInnovation in Technology: An Evolutionary Game Analysis of Government Intervention. Manag. Rev. 2022, 34, 122–133. [Google Scholar] [CrossRef]
- Cao, Y.J.; Chen, M.S.; Su, G.C. Do financial incentives help improve the efficiency of corporate innovation? Southeast Acad. Res. 2018, 96–104. [Google Scholar] [CrossRef]
- Ning, L.; Li, J.C. The Incentive Effect of Fiscal and Tax Policies on Enterprise Technology Innovation. Econ. Probl. 2019, 38–45. [Google Scholar] [CrossRef]
- Luo, E.Y. Fiscal Incentives, Green Technology Innovation and Corporate Environmental Performance. Commun. Financ. Account. 2020, 46–49. [Google Scholar] [CrossRef]
- Wu, C.S.; Huang, S.Q.A. Research on the Effect of Government Subsidies Based on the Perspective of Corporate Social Responsrbility: Empirical Evidence from A-share Listed Companies of Manufacturing in Shanghai Stock Market. J. Nanjing Audit. Univ. 2015, 12, 92–103. [Google Scholar]
- Chen, X.; Li, M.L.; Zhang, Z.Z. Environmental Regulation, Government Subsidies and Green Technology Innovation: Empirical Research Based on the Mediation Effect Model. J. Ind. Technol. Econ. 2019, 38, 18–25. [Google Scholar]
- Shu, Y.; Xu, G.; Shen, Z.; Lv, M. Measurement of Environmental and Financial Integration of Heavily Polluting Enterprises: The Theoretical Analysis and System Construction of Environmental Financial Index. Account. Res. 2019, 8, 3–11. [Google Scholar]
- Zhang, J.P.; Feng, S.Q. Construction of environmental performance audit index system for coal enterprises based on PSR-ANP. Friends Account. 2019, 3, 131–135. [Google Scholar]
- Wang, Y.; Wang, X.; Zhao, L.Y. The Research on the Environmental Performance Evaluation Index System of the Iron and Steel Enterprises: Based on the Ecological Civilization Perspective. Ecol. Econ. 2016, 32, 46–50. [Google Scholar]
- Dangelico, R.M.; Pontrandolfo, P. Being “Green and Competitive”: The Impact of Environmental Actions and Collaborations on Firm Performance. Bus. Strateg. Environ. 2015, 24, 413–430. [Google Scholar] [CrossRef]
- Dong, Z.Q.; Wang, H. Local-Neighborhood Effect of Green Technology of Environmental Regulation. China Ind. Econ. 2019, 100–118. [Google Scholar] [CrossRef]
- Liu, B.B.; Yan, W.; Huang, X.Y. Analysis of the Impact of Loan Misallocation on China’s Green Technology Innovation: From the Perspective of Regional Environment Regulation Discrepancies. Contemp. Financ. Econ. 2019, 19, 60–71. [Google Scholar] [CrossRef]
- Si, L.J. Impact of Environmental Regulation on Green Technology Innovation:Empirical Analysis Based on Panel Data of the Cities in Yellow River Basin. Res. Financ. Econ. Issues 2020, 19, 41–49. [Google Scholar]
- Zhou, J.Q.; Han, Z.Z. Environmental Regulation, Factor Market Reform Dividends and Green Competitiveness: Theory and Chinese Experience. Contemp. Financ. Econ. 2020, 3–15. [Google Scholar]
- Liu, R.Z.; He, C. Study on the Threshold Effect of Environmental Regulation on Income Inequality of Urban Residents. China Soft Sci. 2021, 8, 41–52. [Google Scholar]
- Ju, X.S.; Lu, D.; Yv, Y.H. Financing Constraints, Working Capital Management and the Persistence of Firm Innovation. Econ. Res. J. 2013, 48, 4–16. [Google Scholar]
- Yang, Y.; Wei, J.; Luo, L.J. Who Innovate from the Government Subsidies? The Joint Moderate Effects of the Ownership and the Factor Market Distortions. J. Manag. World 2015, 1, 75–86+98+188. [Google Scholar]
- Chi, Z. Haze Pollution Degree, Short-Term Credit Financing Ability With Corporate Growth. Res. Financ. Econ. Issues 2021, 10, 86–92. [Google Scholar] [CrossRef]
- Bai, J.H.; Bian, Y.C. Factor Market Distortion and the Efficiency Losses of Chinese Innovative Production. China Ind. Econ. 2016, 1, 39–55. [Google Scholar] [CrossRef]
- Zhou, S.; Hai, P. Resource Mismatch and Enterprise Innovation:The Microcosmic Evidence from Manufacturing Enterprises in China. Mod. Econ. Res. 2020, 99–107. [Google Scholar] [CrossRef]
- Kang, Z.Y. Does Financial Misallocation Block Chinese Local Enterprises’ Innovation? RD Manag. 2014, 26, 63–72. [Google Scholar] [CrossRef]
- Lv, C.C.; Wang, Z.G. The mechanism and empirical test of factor resources mismatching to enterprise innovation: Empirical analysis based on the listed companies in manufacturing industry. Syst. Eng. Theory Pract. 2019, 39, 1137–1153. [Google Scholar]
- Zhang, Y.; Fang, Y.W. The Strategic Choice of Enterprise’ Green Technology Innovation:Empirical Evidence from Regional Peer Effect. Commer. Res. 2022, 58–69. [Google Scholar] [CrossRef]
- Wu, H.W.; Cai, H.B.; Feng, X.K.; Zhang, A.M. Peer Effect and Its Inducing Mechanism of Enterprise Green Technology Innovation. Sci. Technol. Manag. Res. 2022, 42, 197–203. [Google Scholar]
- Xiao, H.J.; Yang, Z.; Ling, H.C. Is Corporate Social Responsibility Conducive to Green Innovation? Econ. Perspect. 2022, 14, 117–132. [Google Scholar]
- Li, J.Y.; Zhang, G.; Xie, L.N. Environmental Knowledge Learning, Green Innovation Behavior and Environmental Performance. Sci. Technol. Prog. Policy 2019, 36, 122–128. [Google Scholar]
- Wang, M.Y.; Li, Y.M.; Wang, Z.T. U-shaped relationship between enterprises’ environmental performance and economic performance of green technology innovation and the moderation effect of government competition regulation. Sci. Manag. Res. 2021, 39, 107–116. [Google Scholar] [CrossRef]
- Wang, M.Y.; Zhang, H.; Li, Y.T.; Wang, Z. Research on the Dual Heterogeneity of Performance Transmission Paths of Green Technology Innovation: Based on the Data of 642 Industrial Enterprises in China. Sci. Sci. Manag. S T 2021, 42, 141–166. [Google Scholar]
Disclaimer/Publisher’s Note: The statements, opinions and data contained in all publications are solely those of the individual author(s) and contributor(s) and not of MDPI and/or the editor(s). MDPI and/or the editor(s) disclaim responsibility for any injury to people or property resulting from any ideas, methods, instructions or products referred to in the content. |
© 2023 by the authors. Licensee MDPI, Basel, Switzerland. This article is an open access article distributed under the terms and conditions of the Creative Commons Attribution (CC BY) license (https://creativecommons.org/licenses/by/4.0/).