Abstract
Private sector investment, the mainstream financing method for procuring public road transport development projects, has encountered several profound difficulties and risks during execution, particularly in developing countries. However, there needs to be more extensive investigations on the major barriers facing road transport infrastructure projects in these countries. In this vein, the present study aims to identify and assess the perceived barriers inhibiting private sector investment in delivering public road transport infrastructure projects in the developing country of Iran. The research method adopted is based on a descriptive survey with a three-round Delphi technique with 35 experts from both the private and public sector in Iran. According to the research study results, four main groups of legal and organizational, political, economic, and operational barriers have been found to significantly impact the attraction of private sector investment in such projects. The three most significant obstacles for public road transport infrastructure projects in developing countries include: (i) a lack of financial and investment safety; (ii) a lack of proficient managers and policies of public organizations in order to facilitate the process of privatization; and (iii) corruption in the privatization process. The survey findings can help the government and policymakers to eliminate or alleviate the potential barriers towards private sector participation in future public road infrastructure projects, particularly in those developing countries such as Iran.
1. Introduction
Economic growth happens when there are investments in different parts and activities of the economy; without investments, especially in infrastructure and superstructure plans, there is no expectation of reaching any increase in employment and public welfare [1]. Accordingly, one of the important elements of infrastructure and superstructure plans is transport infrastructure, particularly regarding the road transport network [2], which could benefit from the mass production of building suitable accommodation for people [3]. The appearance of some important phenomena, such as the increase in e-commerce and one-day delivery service [1], refs. [4,5,6,7,8], has allowed the present transport infrastructure to be more pivotal than in the past.
A United Nations statement is even more crucial when considering developing countries; indeed, “the importance of sustainable transport for countries in special situations is also recognized by the international community” [9]. In these countries, 70% of freight transportation and 90% of passenger transportation are currently carried out through the road network [10]. Due to this fact, each year more than ten thousand light and heavy vehicles are added to the transport system in developing countries [11], leading to a rush toward the development of roads and accessways [12]. Hence, the increasing trend of having public vehicles and roads needs simultaneous development of the road infrastructure and an increase in transport capacity [13,14,15].
However, one of the main problems that developing countries are facing is the existing poverty and lack of expenditure budget at the government level [16], which restricts the ability to perform infrastructure projects. In essence, a real problem exists as to how to supply and attract private investment in such infrastructure projects in order to support government plans [17]. The solution identified by governments of developing countries is to reduce financing that comes from public budgeting in order to promote the private sector to invest in infrastructure projects [18]. Therefore, private investment—often based on so-called Public–Private Partnerships (PPPs)—have become the major resource for such projects in developing countries [18,19,20].
To finance projects, different methods can be used; their adoption can vary according to the type of the project and related industry, the financial volume and required duration of the project, and circumstances of the host country—such as political and economic safety and existing rules and regulations—and the priority and sensitivity of the project for the country [21]. However, the participation of the private sector in developing countries is sometimes not sufficient for sustaining infrastructure projects. Studies explain that many developing countries failed to make proper accommodations for the entrance of investments from the private sector [10], mainly because of: (1) uncertainty about the duration of projects that consequently increases their costs and lowers their economic returns [22] and (2) the intrusion by the government in determining pricing tools and in posing excessive taxes for the building of infrastructure [12,23]. For example, Jamali [24], in his study on PPPs for infrastructure projects in Lebanon, found a series of barriers underpinning PPPs, such as trust, openness, and fairness among partners. However, this large number of causes does not allow for recognition of the main ones that developing countries should address. In this regard, Trebilcock and Rosenstock [25], from their review of PPPs for infrastructure projects adopted in developing countries, found that “PPPs have met efficiency expectations [in these countries], but have proven relatively less successful in terms of broadening access to infrastructure” (p. 350). This has opened up the following phenomenon: though the number of PPPs is growing, they remain a relatively small share of the total infrastructure and are concentrated in more prosperous developing countries. However, Cui et al.’s [26] review, which included 754 studies on PPPs for transport projects, highlighted how further studies on PPPs are needed to examine and understand the spread of PPP-supporting policies, regulations, and other arrangements as well as how these elements serve as barriers to the development of PPPs for transport projects. In this regard, deep study of previous research [21], refs. [27,28,29] can reveal that most studies believe that the main barriers for transport PPPs in developing countries are related to financial and political barriers—although there are other important barriers, such as organizational, operational, and legal ones, which are less frequently considered by researchers. In this vein, with regard to transport projects that are considered to be the propellant for world growth in the coming years for developing countries [30], there are few studies that discuss all the above-mentioned subjects together and that find a priority according to their importance. Stemming from this issue, this study seeks to answer the following unanswered research question: “What are the main barriers that developing countries should overcome to attract private sector investment in public road infrastructure?”
In order to fill the above identified research gap, the Delphi survey method has been implemented to collect experts’ opinions about the barriers to delivering public infrastructure projects that developing countries have to face to attract private sector investment. In particular, the data collection method consisted of a questionnaire and semi-structured interviews administered to 35 experts, including contractors, consultants, and employers. Findings showed that the barriers can be categorized into four clusters: (1) legal, (2) political, (3) economic, and (4) operational. The most important barriers found among these have been: (i) the lack of financial and investment safety, and (ii) the lack of efficient management and proper policymaking imposed on public organizations in order to ease the process of privatization.
Thanks to proposed results, policymakers will know, from the beginning, which barriers can undermine infrastructure projects in developing countries and promptly act to reduce or eliminate them. Thus, the study helps to shed light on the ways in which to attain the Sustainable Development Agenda with regard to goal no. 11—target 11.2: “providing access to safe, affordable, accessible and sustainable transport systems for all, improving road safety, notably by expanding public transport” [9]. In particular, the results can help governments to spot and reduce potential barriers toward private sector participation in future road infrastructure projects in developing countries. This significantly touches on another Sustainable Development Goal (no. 17), which recognizes “multi-stakeholder partnerships as important vehicles for mobilizing and sharing knowledge, expertise, technologies and financial resources to support the achievement of the sustainable development goals in all countries, particularly developing countries” [31].
Although the importance of the barriers and challenges in private sector investment in public road infrastructure projects in developing countries is not equal, the aggregation of research results is an essential part of identifying these barriers in the case of a particular developing country such as Iran. Hence, a brief review of the previous research studies is presented in Section 2. The study’s methodology is described in Section 3, and the survey results are illustrated in Section 4. Moreover, the analytical results are discussed in light of the theory, and finally, conclusions and research implications are provided in Section 5.
2. Literature Review
Henckel and McKibbin [32] have studied the economy of infrastructures all over the world and note that in order to improve the returns of infrastructure investments, there are plenty of issues surrounding developing and developed countries that are important to consider. These include: (i) measuring the size of the economic return on infrastructure, (ii) the evaluation method of projects, (iii) the delivery mechanism and the controlling environment of the project, and (iv) clarity on the process of evaluation and delivery (see also Babatunde et al. [13], Thomas et al., and Panayiotou and Medda [33,34]. The first point is one of the main debates in this area; indeed, cost overrun in transport infrastructure projects has been cited in different studies as a main factor of the failure of such projects (e.g., Flyvbjerg et al. [35,36]). In particular, it was found that the length of the implementation phase, the size of the project, and the sole ownership of governments or companies increase cost overrun in transport infrastructure projects. The other three points above made by Henckel and McKibbin [32] have also been confirmed as valid by the literature concerned with infrastructure projects supported by PPPs (e.g., Abatecola et al. [37]). For example, according to Koppenjan [38], the lack of clarity—due to difficulties in interactions among partners—in the evaluation method of projects and delivery mechanisms are at the basis of infrastructure project failure.
Besides the difficulties in completing infrastructure projects per se, there are complications in attracting private investors, especially for developing countries in which governments struggle with very limited resources. There are various major barriers to attracting investors. In this regard, based on studies by Boeing and Kalidindi [39] and Medda [40], investors should be sure about the profitability of the activity and ownership rights of assets in order to reach a decision before investing in any asset. Investors can decide which activities are appropriate for investment to gain the maximum income over the project’s total duration. Based on this, there are economic parameters that are important for every type of investment; this means that the future horizon of the developing economy should guarantee the safety of the investment. Similarly, Martin et al. [29] found that private investments in developing countries are mostly influenced by important financial variables and the macro economy. In this regard, Arshad et al. [27] believe that effective factors to attract direct investment in both developed and developing countries for infrastructure projects include exchange rate, tax subsidies, foreign reserves, and financial politics. This is a very important point, as demonstrated by Ouédraogo et al. [41], who highlighted the way in which public investment and a high amount of bank credits have the most influence on private sector investment and transport growth, especially in developing countries [18,27,39]. To countervail this viewpoint, according to research conducted by Mir and Mousavizadeh [42], building economic and industrial cities based on sustainable development can attract private funds—usually coming from PPPs.
Copious studies on the barriers of PPPs in developing countries have been produced, which are synthesized, as follows, according to their geographical setting. Starting from studies based in Africa, Babatunde and Pereira [21] assessed the barriers and risks to bond financing for PPP infrastructure projects in Nigeria; the results of their study showed that among the 12 identified barriers and risks, “governance and institutional capacity issues”, “higher issuance costs and risks”, “difficulties in getting approval for changes”, “the small size of bond markets”, and “stringent disclosure requirements” are considered to be the most harmful for PPPs for infrastructure projects. However, Chileshe et al. [28], through a survey of 27 Kenyan stakeholders, studied critical success factors for PPPs’ infrastructure and housing projects in Kenya; the results showed that “acceptance and support given by the community”, “project feasibility”, “the laws, regulations and guidelines put in place”, “available financial market”, and “having a well-organized and committed public agency” were among the highly ranked critical barriers.
When considering the Middle East, Rezouki and Hassan [43] empirically evaluated barriers obstructing the applicability of PPPs in infrastructure development in Iraq; 25 risk factors were derived from 98 respondents, who agreed to rank corruption and barriers as factors that the government should deal with to ensure the success of PPPs’ infrastructure projects—followed by scarcity of private funds and insufficient public administration processes. Despite differences in perceptions according to the categories of respondents, the findings generally indicated that government must work on building a solid, empowering environment before the initiation of a PPP approach in Iraq. A recent work by Tamošaitienė et al. [44] that investigated PPPs for infrastructure projects in the Middle East found that: (i) economic and financial barriers and risks, (ii) technical and organizational barriers and risks, and (iii) political and legal barriers and risks are the three main barriers and risks for the support of private-to (general)-public real estate projects in the Middle East. This result is similar to that from an experimental study on economy and asset organization in developing countries by Hafezi [22], who found four main clusters of barriers undermining private sector investments in public infrastructure projects: (i) official and law barriers, (ii) government-related barriers, (iii) economic barriers, and (iv) cultural and local barriers.
Some studies set explicitly in the Far East have also been produced. In this vein, Kim and Le [45] investigated the impact of key barriers to PPP transportation projects based on the perceptions of respondents in Vietnam; six barrier groups emerged: (i) social and political, (ii) legal, (iii) financial market, (iv) procurement process, (v) implementation risk, and (vi) management. Among these six, “project management” and “social and political barriers” are the two most important barrier groups influencing PPPs in infrastructure projects. However, Sarvari et al. [46] found that countries such as South Korea, Malaysia, Hong Kong, and some others in East Asia lack proficiency in human resources, and that political consistency, when mitigated, leads to gaining successful outcomes—through infrastructure projects—such as economic growth, the reduction of poverty, and increased public welfare. Nevertheless, Sarvari et al. [46] stated that easy and low-cost access to production factors, such as financial resources, strategic and corrective preparations, the elimination of bothersome rules, and regulations over investment, are the positive parameters that encourage investors to enter into infrastructure projects in developing countries. Yet Mahalingam [47], through a combination of archival sources, case studies, and insights from a roundtable discussion, assessed key barriers and risks that PPPs in infrastructure projects face in the urban Indian context and cited the following five areas: (i) distrust between the public and private sector, (ii) a lack of political willingness to develop PPPs, (iii) the absence of an enabling institutional environment for PPPs, (iv) a lack of project preparation capacity on the part of the public sector, and (v) poorly designed and structured PPPs for infrastructure projects.
Other studies, instead, have compared developing countries across many continents. This is the case with the work by Willoughby [48], who investigated large-scale PPPs for infrastructure projects in several cities in South America and Eastern Asia. The study showed that despite delays and mistakes in the development of many PPPs in infrastructure projects, the overall results are still positive and promote the use of PPPs; their involvement significantly improves the development of transportation networks. This is aligned with the results emerging from the review by Trebilcock and Rosenstock [25], who found that PPPs in infrastructure projects have met efficiency expectations in developing countries, but their adoption remains a relatively small share, concentrated in more flourishing developing countries. Similar to Willoughby [48], Kang et al. [49] adopted a multiple-case holistic design to analyze 19 selected projects across several areas (such as public health, public utilities, public works, transportation, and water/wastewater infrastructure) and developing countries (including Africa, Asia, and South America) to identify and pool clusters of variables that facilitate or impede PPPs in infrastructure projects. Their results indicated—without, however provide a ranking—five broad categories of political, economic, legislative, financial, and management requisites that help the successful adoption of PPPs in infrastructure projects in developing countries.
Some studies have also tried making comparisons between developed and developing countries with regard to barriers in PPPs in infrastructure projects. In this regard, Liu et al. [50], through 15 interviews and 57 questionnaires in Australia and China, identified the critical factors affecting the effectiveness and efficiency of tendering processes in PPPs; among the 14 critical factors affecting PPP tendering processes, they found that “clarity and responsiveness of governance structures” ranked among the top three in both countries. According to that which has been reported, a first list of barriers affecting private sector investments in public infrastructure projects can be derived; see Table 1.

Table 1.
Summary of the identified barriers inhibiting private sector investment in public transport infrastructure projects.
Of course, the list provided is just the starting point of the barriers for PPPs in infrastructure projects in developing countries, which does not have the intention of being exhaustive; nonetheless, this forms the basis of the methodological investigation implemented in this study.
3. Study Materials and Methods
In line with other similar works (Olawumi and Chan [56]; Yeung et al. [57]) a Delphi research method was implemented to reach the goal of this study. In particular, the Delphi method aimed to collect the views of various experts involved in infrastructure projects on the barriers that the developing country of Iran encounters when attracting private sector investment. In fact, the Delphi survey technique was carried out to seek and consolidate the investment barriers identified in developing countries through the review of relevant literature, particularly in the case of Iran. The data collection method consisted of an empirical questionnaire and semi-structured interviews administered to fifteen experts, including contractors, consultants, and employers (similar to Olawumi and Chan [58]; Tamošaitienė et al. [44]). The Delphi approach is a perspective or a systematic research method to obtain collective comments from a group of experts on a special subject or a question. It also aids in reaching group agreement by using question-based rounds, which keep the responders anonymous and hide each answer from the other responders in the panel [59]. Experts can answer the same question at least twice. Participants in the Delphi survey are experts, critics, and panelists who have knowledge and experience in the same subject, time to participate, and effective communication skills [57]. There is no explicit or firm rule as to how to choose participants or how many experts to select for the test. The number of responders depends on the factors of: a homogeneous or heterogeneous type of sample, the target of the Delphi survey, the duration of data gathering, the domain of the problem, and the acceptability of the answer. The number of participants is usually less than 50 and generally around 15 to 20 (Sarvari et al. [46]; Tamošaitienė et al. [44]). Most of the time, sampling is based on a used target, and agent samples are not important, but the quality of the panelists is more important than the number [59]. Yet the Delphi process comprises a structure to predict and aid decision making, which is completed through a three-round survey, data gathering, and finally, group agreement. The Delphi method includes multiple survey or questionnaire rounds that, through using the primary questionnaire, elicit questionnaires for the next rounds. Agreement is considered when there is accordance among participants on a subject. The structure of the Delphi method implemented in this work is presented in Figure 1 [60,61,62].
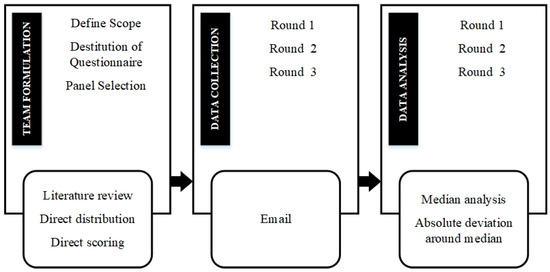
Figure 1.
Process of the Delphi survey technique.
In this study (similarly to others, see [44]), experts were required to: have a background in the field of construction projects, be familiar with different types of project execution, and have experience in construction management. The sampling type was purposeful sampling, a technique used in qualitative research for the identification and selection of information-rich cases [63]. The main phase of this technique is identifying respondents who have experience in a phenomenon of interest [64], as well as the availability and willingness to participate [65]. The Delphi technique uses 3 rounds to reach agreement on answers.
3.1. Data Collection
To collect the data in this study, previous research studies were methodically surveyed. Based on a comprehensive and accurate review of the literature, 44 barriers were identified, as reported in Table 1. The questionnaire for the first round of the Delphi was prepared based on these barriers; 15 experts were given the questionnaire that consisted of 44 questions regarding barriers to infrastructure projects. After the first round, a total of 38 barriers were identified as barriers to attracting private sector investment in public road transport infrastructure projects. In the second round, respondents were asked to give their ideas about these 38 barriers, and two further barriers were added after this round. The third round started with the basis of the 40 barriers, and final agreement was reached at this stage. Therefore, 40 barriers were identified as barriers to investment in the private sector for road transport infrastructure projects. At this point, respondents were asked to give their ideas about each of the identified barriers based on a five-point Likert scale, from strongly agree (1) to strongly disagree (5).
The face validity of the questionnaire was confirmed according to the opinions of some of the participants. Test validity refers to the appropriateness, significance, and utility of inferences drawn from test scores. In this study, item impact scores were used to examine the face validity. In this vein, after obtaining experts’ opinions on the significance of each of the barriers listed in the questionnaire on 5-point Likert scale measurements (i.e., very important (score 5), important (score 4), relatively important (score 3), slightly important (score 2), and unimportant (score 1)), the impact scores were calculated using Equation (1) [58]. To accept the face validity of each item, its impact score must be equal to or greater than 1.5. In fact, an item impact score greater than or equal to 1.5 corresponds to 50% of frequency and a mean of 3 on a 5-point Likert scale. If the item impact score of an item is equal to or more than 1.5, it will be retained in the instrument; otherwise, it will be eliminated. Given that each item on the research questionnaire received the required impact score, it may be argued that it has the necessary face validity.
where frequency = % of subjects scoring an item as 4 or 5, and importance = mean importance score of the item.
Impact score = importance × frequency (%)
In addition, the consensus among experts was carried out using Kendall’s coefficient of concordance in each Delphi round. Kendall’s coefficient of concordance (W) is a scale used to determine the degree of compatibility and agreement between several ranking categories related to N items or people [58]. Using this scale, it is possible to determine the rank correlation, K, between the set of ranks. This scale is helpful in validity studies among referees. Kendall’s coefficient of concordance indicates whether people who have sorted items according to their importance have a similar criterion for their judgement with regard to these items, and whether they agree with each other [66]. In this study, Kendall’s coefficient of concordance was computed using SPSS software. The values of this scale are in the range of 0 to 1 and indicate the amount of agreement among the Delphi panel (W > 0.9 indicating very strong agreement; W > 0.7 strong agreement; W = 0.5 average agreement; W = 0.3 weak agreement, and W = 0.1 very weak agreement). Furthermore, the significance of W does not affect the output from the Delphi panel if more than 10 experts are involved—even small values of W are sometimes significant [58,66]. Kendall’s coefficient of concordance in the third round of the Delphi technique was calculated to be 0.731, indicating strong agreement between participants.
Moreover, the selection of experts and the way in which to administer questions played a main role in the validation of the research. The main criteria to make decisions regarding the validation of the research were based on having experience and knowledge in the field of PPPs and understanding the related issues. The experts were determined using purposeful sampling. Participants were selected based on their level of education, experience, and functional background (engineers in construction, architecture, and urban development; economists in universities; and urban construction managers) from both the public and private sectors. All experts had prior experience working on PPPs and road projects. The questionnaires were distributed to 35 experts, all of whom completed the survey.
Table 2 shows the background information of the respondents. The respondents were representative of a wide range of experts in the public and private sectors in order to form a balanced viewpoint in the survey. People with Master’s degrees or higher education comprised around 66%, which was the highest proportion among respondents. More than 40% of the sample size worked in the private sector, and 60% of respondents had more than 10 years’ experience in the field of construction projects. In addition, more than 48% had at least 10 years’ experience on road projects, and more than 54% had more than 10 years’ experience on PPP projects.
Table 2.
Demographic information on the survey’s experts.
3.2. Data Analysis
Both descriptive statistics and inferential statistics are employed in the scientific analysis of data and are equally important in statistics. In the present study, we have discussed the summary measures to describe and test the collected data. To draw the inference from the study participants in terms of different groups, etc., statistical methods were used. These statistical methods have some assumptions, including the normality of the continuous data. There are different methods used to test the normality of data, and each method has its own advantages and disadvantages [67].
There are several statistical tests that can be used to assess whether data are from a normal distribution. The most popular are the Kolmogorov–Smirnov test [68] and the Shapiro–Wilk test [69]. However, the most practical approach to assessing the normality of questionnaire data based on a Likert scale involves investigating the distributional form of the outcome in the sample using a histogram (kurtosis and skewness). Scheffe [70] stated that kurtosis and skewness are an intuitive means to understanding normality. The normality test for the data distribution was performed to ensure that there was no violation of the assumption of normality, one of the basic conditions for inferential statistics [71]. Skewness and kurtosis indexes were used to identify the normality of the data with SPSS [72]. George and Mallery [73] stated that values for asymmetry and kurtosis between −2 and +2 are considered acceptable in order to prove normal univariate distribution. Therefore, the data considered were normal for the range of skewness from −2 to +2 [71,73,74,75]. These tests were conducted with SPSS software [72].
However, the Student’s t-test was used to illustrate the influence of the identified barriers (within each group) of the private sector to investment. The Student’s t-test is a parametric test, and according to Bridge and Sawilowsky [76], who compared this test with other similar tests such as the Wilcoxon test, the t-test is more powerful than the other tests under relatively symmetric distributions and small sample sizes (as small as 15 per group). In construction research, t-tests and Friedman tests are the two types of statistical tests most commonly used [77]. However, there are several different types of Student’s t-tests that can be performed depending on the data and type of analysis required [78]; in this study, based on the type of analysis required, one sample t-test was used to determine the meaningful difference in the observed average in comparison to real value. The purpose of the one sample t-test was to determine whether sample observations could have come from a process that follows a specific parameter (such as the mean). Usually, the t-test is typically implemented on small samples [76]; in this study, one sample t-test was used to determine the meaningful difference in observed averages in comparison to real value.
Finally, in line with similar works [77], for ranking identified barriers, the Friedman test—a one-way repeated-measure analysis of variance by ranks—has been implemented. The Friedman test, unlike parametric statistics, uses non-parametric statistics that do not require the assumption of a normal population [79]. Strictly, the Friedman test can be used on quantitative or ordinal variables (e.g., the Likert scale), as in this study [80]. In addition, with large enough sample sizes (>30), the violation of the normality assumption should not cause major problems [72]. Figure 2 illustrates the entire research process of the study.
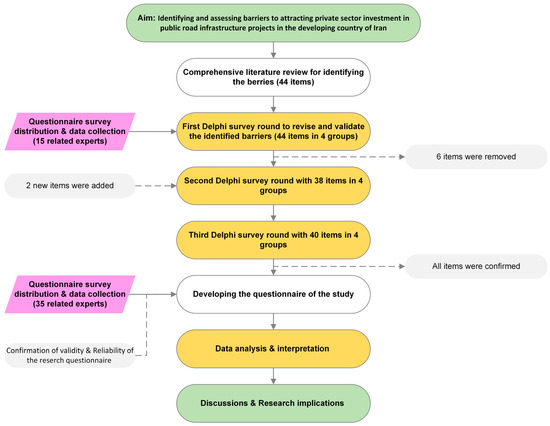
Figure 2.
The overall research design for the study.
4. Survey Findings
4.1. Questionnaire Reliability and Validity
First, due to using questionnaires for the present research, it was important to survey the reliability of questions. Cronbach’s alpha reliability test was used to measure the reliability of the research. The domain for Cronbach’s alpha reliability coefficient is in the range from 0 to 1. A reliability coefficient of zero indicates a lack of reliability, and 1 indicates complete reliability. If Cronbach’s alpha coefficient is more than 0.7, then reliability is good; if it is between 0.5 and 0.7, then the reliability is average; and if less than 0.5, the questionnaire lacks the required reliability. Table 3 shows the results of Cronbach’s alpha reliability test for the variables of the research; all of them are above 0.6, thus indicating good reliability.
Table 3.
Cronbach’s alpha reliability test results of barriers to private sector investment.
4.2. Legal and Organizational Barriers
With regard to legal and organizational barriers, elements relating to these factors caused the main deterrent barriers to investments from the private sector; this can be seen in Table 4, in which the level of significance of the Friedman test is equal to 0.001 (highly significant).
Table 4.
Results of Friedman test for legal and organizational barriers.
Table 5 shows the averages and standard deviations of legal and organizational variables. Comparison of the averages for questions showed that the highest average was (4.29) for B3, which is “high and complex bureaucracies”.
Table 5.
Description of the legal and organizational barriers using descriptive indicators.
To survey the normality of the data using the standard deviation, the values of skewness and elongation were 0.3 and 0.6, respectively. Since these values were placed between 2 and −2, the distribution of the data was normal. Based on the average and deviation of each barrier within the questionnaire, it can be explained that the averages for all legal and organizational barriers were higher than 3 (the mean). Therefore, statistically, the sample of effectiveness of legal and organizational barriers was evaluated as higher than average.
To survey the influence of each of the mentioned barriers in the hypothesis of the research, one sample t-test was used. Then, statistically significant values were expressed as effective factors of main deterrent barriers to private sector investment. To study each of these items, one sample t-test was performed separately on all the barriers. All the reports for these items are presented in Table 6; all the questions related to legal and organizational barriers were effective in main deterrent barriers toward investment from the private sector, because the amount of possibility (significance) was equal to 0.000 and was less than 0.05. As a result, the null hypothesis about the ineffectiveness of these barriers was rejected. Based on the t-test, it was concluded that the mentioned barriers have a great effect on existing barriers.
Table 6.
Results of one sample t-test test of the legal and organizational barriers.
4.3. Political Barriers
When considering political barriers, there seems to be a lack of significance of elements of political barriers as a main deterrent for private sector investments—see Table 7, in which the significance level of the Friedman test is 0.260.
Table 7.
Results of Friedman test for political barriers.
Table 8 shows the results for the average and standard deviation of variables related to political barriers. Comparing the averages of the questions, it expresses that the highest average (4.31) belonged to B11, which is “lack of proficient managers and policies of public organizations in order to facilitate the process of privatization”.
Table 8.
Description of political barriers using descriptive indicators.
Based on the calculated average and standard deviation shown in Table 8, the data scattering was normal. Further, based on Table 8, the mean value for all of the political barriers was more than 3, which means the statistical sample was evaluated more than the average.
To survey the influence of each of the mentioned barriers, one sample t-test was used. Then, the significance value of this test was determined as effective, and single elements needed to be studied. To investigate each of these items, one sample t-test was performed separately on all elements. All the reports for these items are presented in Table 9. Based on the information in Table 9, all the elements related to legal and organizational barriers were effective as the main deterrent toward investment in the private sector—the amount of significance is equal to 0.00 (less than 0.05). As a result, the null hypothesis about the ineffectiveness of these barriers was rejected. Based on the t-statistic, it was concluded that the mentioned factors had an instant effect on existing barriers.
Table 9.
Results of one sample t-test of the political barriers.
4.4. Economic Barriers
Regarding economic barriers, Table 10 shows that the significance level of the Friedman test was equal to 0.00, thus highlighting the statistical significance of elements related to economic barriers as a deterrent for private sector investments.
Table 10.
Results of Friedman test for economic barriers.
Table 11 shows the results for the average and standard deviation of elements related to economic barriers. Comparing the averages of these elements, the highest average was (4.26), belonging to B23, which is “lack of financial and investment safety”.
Table 11.
Description of economic barriers using descriptive indicators.
Based on the calculated average and standard deviation in Table 11, the data scattering was normal. Further, based on Table 11, the mean values for all political barriers were higher than 3, which means the statistical sample is evaluated more than the average.
To survey the influence of each of the mentioned barriers, one sample t-test was used. Then, the significance value of this test was determined as effective, and single elements needed to be studied. To investigate each of these items, one sample t-test was performed separately on all the elements. All the reports for these items are presented in Table 12; all the elements related to economic barriers are effective as a main deterrent toward private sector investment—their significance is equal to 0.00 (less than 0.05). As a result, the null hypothesis of the ineffectiveness of these barriers was rejected. Based on the t-statistic, it was concluded that the mentioned barriers have an instant effect on existing barriers.
Table 12.
Results of one sample t-test of the economic barriers.
4.5. Operational Barriers
With regard to operational barriers, Table 13 shows a significance level of the Friedman test equal to 0.004, which underlines the statistical significance of ranking elements related to operational barriers as a deterrent for private sector investments.
Table 13.
Results of Friedman test for operational barriers.
Table 14 shows the results for the average and standard deviation of variables related to operational barriers. Comparing averages of the questions, the highest average was (3.83), belonging to B40, which is “Insist on using the same implementation methods in different projects regardless of climate and environmental conditions”.
Table 14.
Description of operational barriers using descriptive indicators.
Based on the calculated average and standard deviation in Table 14, the data scattering was normal. Further, based on Table 14, the mean values for all operational barriers were higher than 3, which means the statistical sample is evaluated more than the average.
To survey the influence of each of the mentioned barriers in the hypothesis of the research, one sample t-test was used. Then, the significance value of this test was determined as effective, and single elements needed to be studied. To study each of these items, one sample t-test was performed separately on all elements. The results for these elements are presented in Table 15. Except for the elements included in questions 6–8, which had significant values of more than 0.05, the remaining elements form barriers toward investment from the private sector. Based on the t-statistic, it was concluded that the mentioned barriers have a great effect on existing barriers.
Table 15.
Results of one sample t-test of the operational barriers.
The results showed that the barriers in the four groups all have a statistically significant effect on attracting investments by the private sector in the development of public road infrastructure projects. After the study using the Friedman ranking test, the effects of different barriers were ranked by group: (i) legal and organizational, (ii) political, (iii) economic, and (iv) operational.
Table 16 shows the ranking of the barriers (within the groups and overall). The results showed that among the group of legal and organizational barriers, “high and complex bureaucracies” (B3), the “slow process of financing agencies for privatizing projects” (B6), and a “lack of public supportive laws supporting investment in the private sector” (B2) had a higher score as compared to other barriers in this group. Meanwhile, for the political group, the “lack of proficient managers and policies of public organizations in order to facilitate the process of privatization” (B11), the “corruption in privatization process” (B10), the “extreme political relativism in the divestments” (B15), and the “lack of an independent and responsive oversight body on the proper implementation of privatization policy” (B16) ranked as the first four major barriers in this group. Under the economic group, a ”lack of financial and investment safety” (B23), the “inflation/exchange rate” (B22), a “lack of construction credits and lack of proper budget allocation” (B30), and” the “lack of competitiveness of foreign investors due to the boycott of exchange rate fluctuations” (B20) ranked the highest. In addition, the first four barriers of the operational group included “insist on using the same implementation methods in different projects regardless of climate and environmental conditions” (B40), the “lack of proper feasibility studies for project construction” (B31), “environmental and social project construction hazards (impacts of climate and wildlife ecosystems along the road)” (B35), and a “lack of proper allocation of project risks between government and investor sectors” (B33).
Table 16.
Rankings of the barriers to private sector investment on development of public road infrastructure projects.
Moreover, the results revealed that barriers such as “lack of financial and investment safety” (B3), “lack of proficient managers and policies of public organizations in order to facilitate the process of privatization” (B11), and “corruption in privatization process” (B10) had the highest ranking among all the groups. Meanwhile, the barriers including a “lack of specialized and efficient technical and executive forces” (B36), “land use change around the project” (B34), and “the extent of government investment in the road sector as a barrier to the growth and promotion of private companies” (B18) had the lowest ranking among all the groups. The overall findings of this study are portrayed in Figure 3.
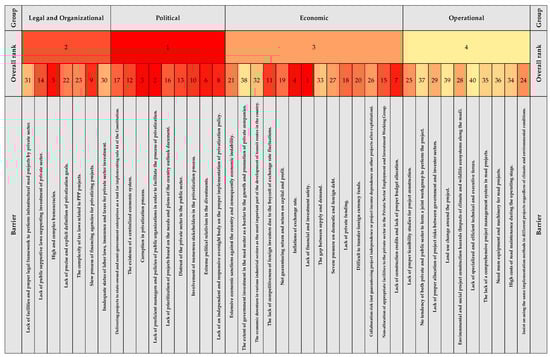
Figure 3.
Heatmap delineating the levels of significance of perceived barriers inhibiting private sector investment in delivering public road transport infrastructure projects in the developing country of Iran (the significance of the factors declines from red to yellow).
5. Discussion of Analytical Results
The results of the implemented Delphi method showed that barriers to PPPs for transport projects can be categorized into four main groups: (i) legal and organizational, (ii) political, (iii) economic, and (iv) operational. As highlighted in Figure 4, each of these four main groups has the potential to form substantial roadblocks in the way of seeking investment from the private sector; however, the following results need to be underlined. (i) In the group of legal and organizational barriers, the seven items all had acceptable levels of significance, and the highest average rating was for “high and complex bureaucracies”. (ii) In the group of economic barriers, all had a significant level of significance; the highest average rating was related to “financial insecurity and investment”. (iii) In the political barriers group, the highest average rating was related to “lack of efficient managers in government agencies’ policies to facilitate the privatization process”. (iv) In the operational barriers group, all the barriers evaluated had an acceptable level of significance. Among them, the “lack of financial and investment safety” and the “lack of efficient managers and proper policy making in public organizations” in order to ease the process of privatization were found to be the most influential barriers. These latter two barriers highlight the economic and operational sides of infrastructure projects when trying to attract private investors in developing countries, in line with prior studies (Arshad et al. [27]; Flyvbjerg et al. [35]; Gupta et al. [6]; Boeing and Kalidindi [39]; Medda [40]; Teklay [51]), highlighting the problem of cost and profitability and human resources and skills (Akbiyikli et al. [52]; Ashuri and Mostaan [4]; Henckel and McKibbin [32]; Li and Liang [55]; Martin et al. [29]; Shabani and Safaie [53]) as the main obstacles to the attraction of private investors. These two underlined barriers, of course, must be considered—despite not having been tested in this work—as connected with other important ones that are detrimental to the success of projects. For example, the “lack of efficient managers” is linked with the “lack of clarity in the evaluation method of projects and delivery mechanisms” [38] as well as with “bad government procedures” [81].
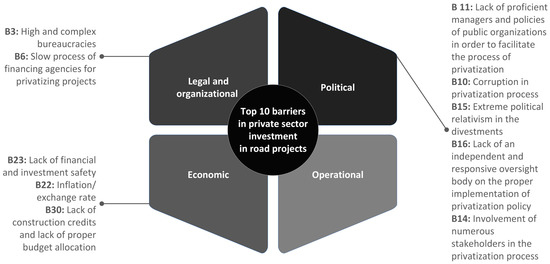
Figure 4.
Top 10 critical barriers to attracting private sector investment in public road infrastructure projects in Iran.
In comparison to separate studies produced in other developing countries, looking at the results of this work can provide food for thought for further reflection. Indeed, when considering the Middle East, the four categories of barriers identified in this work ((i) legal and organizational, (ii) political, (iii) economic, and (iv) operational) are almost equal to the ones found by Tamošaitienė et al. [44] and Hafezi [22]; however, in contrast, technical and local barriers, respectively, have not been found relevant in this work. Yet when considering the study by Rezouki and Hassan [43] that was set in Iraq, the ranking of the “corruption in privatization process”, “lack of financial and investment safety”, and “lack of proficient managers and policies of public organizations in order to facilitate the process of privatization” is different in respect to the three similar elements provided in this paper, with the lack of financial resources and proficiency of managers counting more in Iran than in Iraq—but the similarity with Rezouki and Hassan’s [43] study lies in having three similar barriers on the podium.
An analogous trend to the above—i.e., similar clusters of barriers, but different ranks together with their sub-elements—emerges when looking at the results of more studies on the barriers of PPPs in other developing countries. Indeed, the four clusters of barriers that emerged in this work are similar to those pointed out in the studies by Willoughby [48] and Kang et al. [49]— political, economic, legislative, financial, and management—that broadly considered developing countries over the world. Different trends in the sub-elements of the barriers can also be seen in other works set in the Far East, such as those by Kim and Le [45] (for whom “project management” and “social and political barriers” were the most important), Sarvari et al. [46] (who found “proficiency of human resources” and “political consistency” at the top of the rank), and Mahalingam [47] (who underlined “distrust between the public and private sector” as the most influential barrier). Contrasts emerge, instead, when comparing the results of this paper with the ones related to developed countries or fast-growing developing countries. Indeed, the study of Liu et al. [50] identified, according to the latter, “clarity and responsiveness of governance structures” as the most prominent barrier to PPPs for transport projects.
Figure 4 depicts the top ten individually identified barriers to attracting private sector investment in public road infrastructure projects based in Iran. Examining these barriers reveals that half of them are related to the political group. This clearly demonstrates that the current policies to attract private sector investment in infrastructure road projects in the developing country of Iran are ineffective; as a result, decision-makers and policymakers must take serious action to overcome political barriers. Using the successful experiences of other emerging economies with situations like Iran’s, rather than accumulating contradicting strategies, is viewed as a crucial solution in this regard. Even though there is no operational barrier among the top 10 responses, as evidenced by the results, each of the identified barriers has the potential to impede the attraction of private sector investment in road projects in Iran. Therefore, methods for the development of human resources and the application of project management skills might be effective in this regard. The top 10 barriers comprise three economic and two legal and organizational barriers. Most emerging economies, including Iran, struggle with economic challenges. In recent years, this problem has gained prominence in Iran. Due to the unprecedented increase in the currency rate and the severity of inflation, the private sector faces numerous investment risks. In this vein, a focus on government incentives and support as well as profit guarantees might be viewed as an appropriate instrument for mitigating the private sector’s investment risks.
6. Conclusions and Implications of the Study
What are the main barriers that developing countries should overcome to attract private sector investment in delivering public road infrastructure projects? This is the formal research question that this work has addressed in order to support the Sustainable Development Agenda with regard to goal no. 11—“providing access to safe, affordable, accessible and sustainable transport systems for all, improving road safety” [9] and no. 17—pushing multi-stakeholder partnerships to help to reach sustainable development goals in all countries, especially developing countries [31]. Yet answering this research question helps to contribute to the literature on PPPs for transport projects that has holistically missed investigating the barriers to developing countries that are related to financial and political barriers (Cui et al. [26]; Trebilcock and Rosenstock [25]).
The existing gap identified in this study was filled by applying the Delphi technique to experts in transport projects in Iran. Through three different rounds, the Delphi technique was used to accurately identify the barriers, and after having obtained expert opinions, data analysis was focused on weighting and determining the levels of importance of the barriers in each of the four main groups.
From the juxtaposition of the provided results with those of other works set in developing countries, the following trends seem to emerge:
- (1)
- There is a substantial agreement on the main clusters of barriers to PPPs for transport/infrastructure projects, i.e.: (i) legal (or legislative) and organizational (or management), (ii) political, (iii) economic (or financial), and (iv) operational (or technical).
- (2)
- The rankings of these clusters and their sub-elements mainly depend on the investigated context, with financial issues related more to developing countries in the Middle East, such as Iran, where a “lack of financial and investment safety” has been cited as the most important barrier from this study. The pace of growth of developing countries seems to form the basis for these distinctions, but, of course, more studies should be performed to confirm this and the above statements. Indeed, the main limitation of this research study is that data have been collected from Iran only; therefore, the perceptions on barriers to overcome for the implementation of PPPs in transport projects are rather restricted to that context. Another limitation is the small sample size of the respondents, which can be attributed to the relative infancy of the PPP approach in Iran.
Moreover, future research should be committed to finding the connections among the studies’ barriers and looking at their variations according to the modification of the intensity level of others to find antecedents and consequences; this would help to map the identified barriers across the PPP life cycle. Such an approach could lead to the development of a PPP framework specifically tailored for Iranian (and maybe Middle Eastern) transport projects. In addition to this approach, it would also be possible to identify which barriers are differently ranked according to the culture in which they are assessed. Indeed, it would be interesting to investigate, in a quantitative manner and building on the Upper Echelons Theory literature [82,83], whether socio-demographic characteristics and/or other psychological variables are significant in the definition and evaluation of barriers by the practitioners whose perceptions are assessed. Linked to this, future studies can identify differences among the nature of respondents to identify similarities and differences (see, for example, [77]). Indeed, it can be assumed—but this should be demonstrated—that public and academic respondents have concerns regarding the private sector’s competence in carrying out PPPs, whereas private sector respondents might be concerned about the availability of government incentives to support this type of infrastructure.
In terms of practical implications for policymakers, based on the findings of this study, the following effective implementation strategies are suggested to improve the status of private sector investment in developing countries: (i) trying to secure foreign exchange and removing barriers and investment fears; (ii) meeting international trade requirements, such as clearance time, and ensuring political stability in the country, especially for foreign investor satisfaction; (iii) ensuring adequate return on capital by the government in a given period; and (iv) identifying, through the governments of developing countries, well-educated integrator managers who have to deal with private investors when trying to attract favor for transport infrastructure projects. From what has been reported, in sum, industrial practitioners and government policymakers must both put more effort into the successful execution of PPPs, with the institutional effort in guaranteeing transparency requirements and the objective evaluation of legislation for the assessment of PPP criteria being a primus inter pares key determinant for PPP success. In this regard, policymakers should also be concerned with establishing a comprehensive regulatory framework combined with specific and clear selection criteria of the best private partners for PPPs in public road transport development projects.
Author Contributions
Conceptualization, H.S.; methodology, H.S. and M.G.; formal analysis, A.A.J.A.H. and K.M.A.; investigation, D.W.M.C. and M.C.; data curation, H.S. and M.G.; writing—original draft preparation, H.S. and M.G.; writing—review and editing, D.W.M.C., A.A.J.A.H., K.M.A. and M.C.; visualization, H.S.; supervision, H.S.; project administration, H.S. All authors have read and agreed to the published version of the manuscript.
Funding
This research received no external funding.
Institutional Review Board Statement
Not applicable.
Informed Consent Statement
Not applicable.
Data Availability Statement
The authors confirm that the raw data supporting the findings of this study are available from the corresponding author upon reasonable request.
Conflicts of Interest
The authors declare no conflict of interest.
References
- Zhankaziev, S. Current trends of road-traffic infrastructure development. Transp. Res. Procedia 2017, 20, 731–739. [Google Scholar] [CrossRef]
- Yuan, J.; Li, W.; Guo, J.; Zhao, X.; Skibniewski, M.J. Social risk factors of transportation PPP projects in china: A sustainable development perspective. Int. J. Environ. Res. Public Health 2018, 15, 1323. [Google Scholar] [CrossRef] [PubMed]
- Nguyen, A.; Mollik, A.; Chih, Y.-Y. Managing critical risks affecting the financial viability of public–private partnership projects: Case study of toll road projects in Vietnam. J. Constr. Eng. Manag. 2018, 144, 1–13. [Google Scholar] [CrossRef]
- Ashuri, B.; Mostaan, K. State of private financing in development of highway projects in the United States. J. Manag. Eng. 2015, 31, 04015002. [Google Scholar] [CrossRef]
- Cabrera, M.; Suárez-Alemán, A.; Trujillo, L. Public Private Partnerships in Spanish Ports: Current status and future prospects. Util. Policy 2015, 32, 1–11. [Google Scholar] [CrossRef]
- Gupta, A.K.; Trivedi, M.; Kansal, R. Risk variation assessment of indian road PPP projects. Int. J. Sci. Environ. Technol. 2013, 2, 1017–1026. [Google Scholar]
- Tanaka, D.F.; Ishida, H.; Tsutsumi, M.; Okamoto, N. Private finance for road projects in developing countries: Improving transparency through VFM risk assessment. J. East. Asia Soc. Transp. Stud. 2005, 6, 3899–3914. [Google Scholar]
- Yuan, J.F.; Skibniewski, M.J.; Li, Q.; Shan, J. The driving factors of china's public-private partnership projects in Metropolitian transportation systems: Public sector's viewpoint. J. Civ. Eng. Manag. 2010, 16, 5–18. [Google Scholar] [CrossRef]
- United Nations. Sustainable Transport. 2015. Available online: https://sustainabledevelopment.un.org/topics/sustainabletransport (accessed on 23 September 2021).
- World Bank. Road Safety: An Integral Part of the World Bank's Mission. 2019. Available online: https://www.worldbank.org/en/news/feature/2019/05/09/how-can-you-help-save-lives-on-the-road (accessed on 21 December 2019).
- Wang, Y. Evolution of public–private partnership models in American toll road development: Learning based on public institutions' risk management. Int. J. Proj. Manag. 2015, 33, 684–696. [Google Scholar] [CrossRef]
- Valipour, A.; Yahaya, N.; Md Noor, N.; Kildienė, S.; Sarvari, H.; Mardani, A. A fuzzy analytic network process method for risk prioritization in freeway PPP projects: An Iranian case study. J. Civ. Eng. Manag. 2015, 21, 933–947. [Google Scholar] [CrossRef]
- Babatunde, S.O.; Perera, S.; Udeaja, C.; Zhou, L. Challenges of implementing infrastructure megaprojects through public-private partnerships in Nigeria: A case study of road infrastructure. Int. J. Archit. Eng. Constr. 2014, 3, 142–154. [Google Scholar]
- Cheung, E.; Chan, A.P.C. Risk factors of public-private partnership projects in China: Comparison between the water, power, and transportation sectors. J. Urban Plan. Dev. ASCE 2011, 137, 409–415. [Google Scholar] [CrossRef]
- Pathan, E.R.; Pimplikar, S. Risk Assessment of BOT Road Projects. J. Mech. Civ. Eng. 2013, 5, 40–59. [Google Scholar] [CrossRef]
- Shrestha, P.P.; Mani, N. Impact of design cost on project performance of design-bid-build road projects. J. Manag. Eng. 2014, 30, 1–8. [Google Scholar] [CrossRef]
- Haj-Aliakbari, F.; Alizadeh, B.; Dolatkhah, R. Explaining the factors affecting investment attraction and prioritizing them based on the TOPSIS FUZZY Process case study of industrial towns in Zanjan Province. In Proceedings of the National Conference on Key Issues in Management and Accounting, Gorgan, Iran, 4 May 2015; pp. 1–18. [Google Scholar]
- Sihombing, B.L.; Latief, Y.; Rarasati, D.A.; Wibowo, A. Developing a toll road financing model wirh a hybrid of deep discont project bonds and land leases in Indonesia. Int. J. Civ. Eng. Technol. 2018, 9, 1310–1323. [Google Scholar]
- Rudžianskaitė–Kvaraciejienė, R.; Apanavičienė, R.; Gelžinis, A. Modelling the effectiveness of PPP road infrastructure projects by applying random forests. J. Civ. Eng. Manag. 2015, 21, 290–299. [Google Scholar] [CrossRef]
- Soleimani, I.E.; Ali Pour, H.; Nobakht, M. Ways to equip private sector capital to participate with the public sector in financing infrastructure projects in Iran's special economic energy areas. In Proceedings of the 7th International Project Management Conference, Tehran, Iran, 4–5 January 2013. [Google Scholar]
- Babatunde, S.O.; Perera, S. Analysis of traffic revenue risk factors in BOT road projects in developing countries. Transp. Policy 2017, 56, 41–49. [Google Scholar] [CrossRef]
- Hafezi, H. Investigating the Role of the Banking System on Private Sector Investment in Iran. Trends 2015, 21, 33. [Google Scholar]
- Heravi, G.; Hajihosseini, Z. Risk allocation in public–private partnership infrastructure projects in developing countries: Case study of the Tehran–Chalus Toll Road. J. Infrastruct. Syst. 2012, 18, 210–217. [Google Scholar] [CrossRef]
- Jamali, D. Success and failure mechanisms of public private partnerships (PPPs) in developing countries. Int. J. Public Sect. Manag. 2004, 17, 414–430. [Google Scholar] [CrossRef]
- Trebilcock, M.; Rosenstock, M. Infrastructure Public–Private Partnerships in the developing world: Lessons from recent experience. J. Dev. Stud. 2015, 51, 335–354. [Google Scholar] [CrossRef]
- Cui, C.; Liu, Y.; Hope, A.; Wang, J. Review of studies on the public–private partnerships (PPP) for infrastructure projects. Int. J. Proj. Manag. 2018, 36, 773–794. [Google Scholar] [CrossRef]
- Arshad, M.; Majeed, S.; Shah, A. The determinants of capital inflow in developing economies an empirical study of pull factors. J. Basic Appl. Sci. Res. 2012, 2, 9764–9769. [Google Scholar]
- Chileshe, N.; Njau, C.W.; Kibichii, B.K.; Macharia, L.N.; Kavishe, N. Critical success factors for Public-Private Partnership (PPP) infrastructure and housing projects in Kenya. Int. J. Constr. Manag. 2020, 22, 1606–1617. [Google Scholar] [CrossRef]
- Martin, L.; Lawther, W.; Hodge, G.; Greve, C. Internationally Recommended Best Practices in Transportation Financing Public-Private Partnerships (P3s). Public Adm. Res. 2013, 2, 15–25. [Google Scholar] [CrossRef]
- United Nations. Innovative Ways for Financing Transport Infrastructure. 2018. Available online: https://unece.org/info/Transport/pub/2633 (accessed on 23 September 2021).
- United Nations. Multi-Stakeholder Partnerships and Voluntary Commitments. 2015. Available online: https://sdgs.un.org/topics/multi-stakeholder-partnerships-and-voluntary-commitments (accessed on 23 September 2021).
- Henckel, T.; McKibbin, W.J. The economics of infrastructure in a globalized world: Issues, lessons and future barriers. J. Infrastruct. Policy Dev. 2017, 1, 254–272. [Google Scholar] [CrossRef]
- Thomas, A.V.; Kalidindi, S.N.; Ganesh, L.S. Modelling and assessment of critical risks in BOT road projects. Constr. Manag. Econ. 2006, 24, 407–424. [Google Scholar] [CrossRef]
- Panayiotou, A.; Medda, F. Attracting private sector participation in infrastructure investment: The UK case. Public Money Manag. 2014, 34, 425–431. [Google Scholar] [CrossRef]
- Flyvbjerg, B.; Skamris Holm, M.K.; Buhl, S.L. What causes cost overrun in transport infrastructure projects? Transp. Rev. 2004, 24, 3–18. [Google Scholar] [CrossRef]
- Flyvbjerg, B.; Garbuio, M.; Lovallo, D. Delusion and deception in large infrastructure projects: Two models for explaining and preventing executive disaster. Calif. Manag. Rev. 2009, 51, 170–194. [Google Scholar] [CrossRef]
- Abatecola, G.; Mari, M.; Poggesi, S. How can virtuous real estate public-private partnerships be developed? Towards a co-evolutionary perspective. Cities 2020, 107, 102896. [Google Scholar] [CrossRef]
- Koppenjan, J.J.F. The formation of public-private partnerships: Lessons from nine transport infrastructure projects in the Netherlands. Public Adm. 2005, 83, 135–157. [Google Scholar] [CrossRef]
- Boeing, S.L.; Kalidindi, S.N. Traffic revenue risk management through Annuity Model of PPP road projects in India. Int. J. Proj. Manag. 2006, 24, 605–613. [Google Scholar] [CrossRef]
- Medda, F. A game theory approach for the allocation of risks in transport public private partnerships. Int. J. Proj. Manag. 2007, 25, 213–218. [Google Scholar] [CrossRef]
- Ouédraogo, R.; Sawadogo, H.; Sawadogo, R. Impact of Public Investment on Private Investment in Sub-Saharan Africa: Crowding In or Crowding Out? Afr. Dev. Rev. 2019, 31, 318–334. [Google Scholar] [CrossRef]
- Mir, Y.; Mousavizadeh, R. Identifying and ranking the factors influencing the attraction of investors in Golestan province using the fuzzy multi-attribute decision-making technique (FAHP). In Proceedings of the Nathinal conference on capacity building of the Nineva Corps to realize a resistance economy in Golestan province, Ali Abad, Gorgan, Iran, 6 February 2018. [Google Scholar]
- Rezouki, S.E.; Hassan, J.K.A. An evaluation of barriers obstructing the applicability of Public Private Partnership (PPP) in infrastructure development. Civ. Eng. J. 2019, 5, 2643–2664. [Google Scholar] [CrossRef]
- Tamošaitienė, J.; Sarvari, H.; Chan, D.W.M.; Cristofaro, M. Assessing the barriers and risks to private sector participation in infrastructure construction projects in developing countries of Middle East. Sustainability 2021, 13, 153. [Google Scholar] [CrossRef]
- Kim, S.Y.; Le, T.D. Evaluating the impact index of key barriers to public-private partnership transportation projects in Vietnam: Comparison between selected Asian countries. J. Urban Plan. Dev. 2021, 147, 04021016. [Google Scholar] [CrossRef]
- Sarvari, H.; Valipour, A.; Yahya, N.; Noor, N.; Beer, M.; Banaitiene, N. Approaches to risk identification in public–private partnership projects: Malaysian private partners’ overview. Adm. Sci. 2019, 9, 17. [Google Scholar] [CrossRef]
- Mahalingam, A. PPP experiences in Indian cities: Barriers, enablers, and the way forward. J. Constr. Eng. Manag. 2010, 136, 419–429. [Google Scholar] [CrossRef]
- Willoughby, C. How much can public private partnership really do for urban transport in developing countries? Res. Transp. Econ. 2013, 40, 34–55. [Google Scholar] [CrossRef]
- Kang, S.; Mulaphong, D.; Hwang, E.; Chang, C.K. Public-private partnerships in developing countries: Factors for successful adoption and implementation. Int. J. Public Sect. Manag. 2019, 32, 334–351. [Google Scholar] [CrossRef]
- Liu, T.; Wang, Y.; Wilkinson, S. Identifying critical factors affecting the effectiveness and efficiency of tendering processes in Public–Private Partnerships (PPPs): A comparative analysis of Australia and China. Int. J. Proj. Manag. 2016, 34, 701–716. [Google Scholar] [CrossRef]
- Teklay, B. The financial determinants of private sector investment: The Case of Ethiopia. Int. J. Sci. Technol. Soc. 2017, 5, 9. [Google Scholar] [CrossRef]
- Akbiyikli, R.; Dikmen, S.U.; Eaton, D. Private finance initiative (PFI) for road projects in UK: Current practice with a case study. Promet Traffic Transp. 2011, 23, 215–223. [Google Scholar] [CrossRef]
- Shabani, Z.D.; Safaie, S. Do transport infrastructure spillovers matter for economic growth? Evidence on road and railway transport infrastructure in Iranian provinces. Reg. Sci. Policy Pract. 2018, 10, 49–63. [Google Scholar] [CrossRef]
- Fernandes, C.; Oliveira Cruz, C.; Moura, F. Ex post evaluation of PPP government-led renegotiations: Impacts on the financing of road infrastructure. Eng. Econ. 2019, 64, 116–141. [Google Scholar] [CrossRef]
- Li, Q.; Liang, G. Political Relations and Chinese Outbound Direct Investment: Evidence from Firm-and Dyadic-level Tests; Research Center for Chinese Politics and Business Working Paper 19; Research Center for Chinese Politics and Business: Bloomington, IN, USA, 2012. [Google Scholar]
- Chan, D.W.M.; Sadeq, D.A.H.; Fadhil, A.M.; Cristofaro, M.; Sarvari, H. Barriers and solutions in adopting public–private partnerships in road transportation infrastructure projects for developing countries: Results of a Delphi survey in Iran. J. Facil. Manag. 2023, in press. [Google Scholar] [CrossRef]
- Chan, D.W.M.; Baghbaderani, A.B.; Sarvari, H. An empirical study of the human error-related factors leading to site accidents in the Iranian urban construction industry. Buildings 2022, 12, 1858. [Google Scholar] [CrossRef]
- Sarvari, H.; Cristofaro, M.; Chan, D.W.M.; Noor, N.M.; Amini, M. Completing abandoned public facility projects by the private sector: Results of a Delphi survey in the Iranian Water and Wastewater Company. J. Facil. Manag. 2020, 18, 547–566. [Google Scholar] [CrossRef]
- Ramiani, A.J.; Sarvari, H.; Chan, D.W.M.; Nassereddine, H.; Lotfata, A. Critical success factors for private sector participation in accomplishing abandoned public sports facilities projects in Iran. Int. J. Constr. Manag. 2023, 1–15, in press. [Google Scholar]
- Chalmers, J.; Armour, M. The Delphi Technique. In Handbook of Research Methods in Health Social Sciences; Liamputtong, P., Ed.; Springer: Singapore, 2019; pp. 1–21. [Google Scholar]
- Green, R.A. The Delphi technique in educational research. Sage Open 2014, 4, 2158244014529773. [Google Scholar] [CrossRef]
- Landeta, J. Current validity of the Delphi method in social sciences. Technol. Forecast. Soc. Chang. 2006, 73, 467–482. [Google Scholar] [CrossRef]
- Patton, M.Q. Qualitative Research and Evaluation Methods; Sage: Thousand Oaks, CA, USA, 2002. [Google Scholar]
- Cresswell, J.W.; Plano Clark, V.L.P. Designing and Conducting Mixed Method Research; Sage: Thousand Oaks, CA, USA, 2011. [Google Scholar]
- Suri, H. Purposeful sampling in qualitative research synthesis. Qual. Res. J. 2011, 11, 63–75. [Google Scholar] [CrossRef]
- Schmidt, R.C. Managing Delphi surveys using nonparametric statistical techniques. Decis. Sci. 1997, 28, 763–774. [Google Scholar] [CrossRef]
- Altman, D.G.; Bland, J.M. Statistics notes: The normal distribution. BMJ 1995, 310, 298. [Google Scholar] [CrossRef]
- Elhan, A.H.; Tuccar, E. Investigation of four different normality tests in terms of type 1 error rate and power under different distributions. Turk. J. Med. Sci. 2006, 36, 171–176. [Google Scholar]
- Barton, B.; Peat, J. Medical Statistics: A Guide to SPSS, Data Analysis and Critical Appraisal; John Wiley & Sons: Hoboken, NJ, USA, 2014. [Google Scholar]
- Scheffe, H. Contrast Analysis: Focused Comparison in the Analysis of Variance; John Wiley & Sons: Hoboken, NJ, USA, 1959. [Google Scholar]
- Field, A. Discovering Statistics Using SPSS for Windows; Sage: Thousand Oaks, CA, USA, 2000. [Google Scholar]
- Elliott, A.C.; Woodward, W.A. Statistical Analysis Quick Reference Guidebook: With SPSS Examples; Sage: London, UK, 2007. [Google Scholar]
- George, D.; Mallery, M. SPSS for Windows Step by Step: A Simple Guide and Reference; Pearson: Boston, MA, USA, 2010. [Google Scholar]
- Gravetter, F.; Wallnau, L. Essentials of Statistics for the Behavioral Sciences; Wadsworth: Belmont, CA, USA, 2014. [Google Scholar]
- Trochim, W.M.; Donnelly, J.P. The Research Methods Knowledge Base; Atomic Dog: Cincinnati, OH, USA, 2006. [Google Scholar]
- Bridge, P.D.; Sawilowsky, S.S. Increasing physicians’ awareness of the impact of statistics on research outcomes: Comparative power of the t-test and Wilcoxon rank-sum test in small samples applied research. J. Clin. Epidemiol. 1999, 52, 229–235. [Google Scholar] [CrossRef] [PubMed]
- Sarvari, H.; Chan, D.W.M.; Alaeos, A.K.F.; Olawumi, T.O.; Aldaud, A.A.A. Critical success factors for managing construction small and medium-sized enterprises in developing countries of Middle East: Evidence from Iranian construction enterprises. J. Build. Eng. 2021, 43, 103152. [Google Scholar] [CrossRef]
- Fadem, B. High-Yield Behavioral Science; High-Yield Series; Lippincott Williams & Wilkins: Hagerstown, IN, USA, 2008. [Google Scholar]
- Williamson, K. Research Methods for Students, Academics and Professionals: Information Management and Systems; Elsevier: Amsterdam, The Netherlands, 2002. [Google Scholar]
- Sheldon, M.R.; Fillyaw, M.J.; Thompson, W.D. The use and interpretation of the Friedman test in the analysis of ordinal-scale data in repeated measures designs. Physiother. Res. Int. 1996, 1, 221–228. [Google Scholar] [CrossRef]
- Bel, G.; Estache, A.; Foucart, R. Transport infrastructure failures in Spain: Mismanagement and incompetence, or political capture? In Corruption, Grabbing and Development; Søreide, T., Williams, A., Eds.; Edward Elgar Publishing: Cheltenham, UK, 2013; pp. 129–139. [Google Scholar]
- Abatecola, G.; Cristofaro, M. Upper echelons and executive profiles in the construction value chain: Evidence from Italy. Proj. Manag. J. 2015, 47, 13–26. [Google Scholar] [CrossRef]
- Abatecola, G.; Cristofaro, M. Hambrick and Mason’s “Upper Echelons Theory”: Evolution and open avenues. J. Manag. Hist. 2020, 26, 116–136. [Google Scholar] [CrossRef]
Disclaimer/Publisher’s Note: The statements, opinions and data contained in all publications are solely those of the individual author(s) and contributor(s) and not of MDPI and/or the editor(s). MDPI and/or the editor(s) disclaim responsibility for any injury to people or property resulting from any ideas, methods, instructions or products referred to in the content. |
© 2023 by the authors. Licensee MDPI, Basel, Switzerland. This article is an open access article distributed under the terms and conditions of the Creative Commons Attribution (CC BY) license (https://creativecommons.org/licenses/by/4.0/).