Article

Study on the Interaction between Green Competitiveness of Coastal Ports and Hinterland Economy

1
Collaborative Innovation Center for Transport Studies, Dalian Maritime University, Dalian 116000, China
2
School of Maritime Economics and Management, Dalian Maritime University, Dalian 116000, China
*
Author to whom correspondence should be addressed.
Sustainability 2023, 15(2), 1364; https://doi.org/10.3390/su15021364
Submission received: 13 December 2022 / Revised: 31 December 2022 / Accepted: 9 January 2023 / Published: 11 January 2023

Abstract

:
Accelerating the construction of green ports and promoting the green transformation of the economy and society are important trends in port and regional development today. This research explores the interaction between the green competitiveness of coastal ports and the hinterland economy from 2007 to 2019 by taking the 10 largest coastal ports in China as the research object and combining the Super-SBM Model with the panel data model. The results show that the green competitiveness of coastal ports is fluctuating, and the green competitiveness of Qingdao and Shanghai ports is stronger in the production frontier surface. Compared with the size of ports, the level of port technology is an important factor to improve the green competitiveness of ports. In terms of interaction, the total economic volume of the hinterland, the proportion of the added value of the tertiary industry, and the waterway transportation between the port and the hinterland have a significant positive impact on the green competitiveness of the port, and the improvement of the green competitiveness of the port and the waterway transportation between the port and the hinterland effectively drive the economic development of the hinterland. This study provides an important basis for the rational use of the port–hinterland interaction and promotes the coordinated and healthy development of both.

1. Introduction

As the central hub of regional foreign trade, ports provide commodities, raw materials, and other transportation services for the development of the hinterland; promote market integration and service clustering; have a radiating effect on the economic and industrial development of the hinterland; and are an important growth point for the coastal economy [1]. The hinterland economy provides sufficient capital and cargo security for the port, which is an important carrier for port development and the basis for port survival and development [2].
However, the construction and operation of ports at the cost of energy and the environment in the past have disrupted the ecological balance between ports and hinterlands, and the resulting environmental pollution and health and safety problems, such as harmful gas emissions, traffic congestion, and land conflicts, have hindered the sustainable development of the port and hinterland economies. In recent years, governments, enterprises, and researchers have been exploring ways to reduce port waste emissions and energy consumption, as well as to coordinate the benign development between ports and hinterlands under the condition of promoting energy conservation and emission reduction [3,4]. In 2019, the Ministry of Transport issued the “Guidance on Building World-Class Ports”, which requires accelerating the construction of green ports and proposes that, by 2035, the green development of major ports should reach the world-class level. In 2020, China proposed the strategic goals of “carbon peaking” and “carbon neutrality”. Building a green, low-carbon, and sustainable port development model and exploring the integration and coordination of its interaction with the hinterland economy has become an inevitable trend for future development.
The interaction between the port and the hinterland economy gradually enters the stage of green cycle development. As an important index to measure the economic value created by the system unit resources, the green competitiveness of the port carries the concepts of saving resources, protecting and improving the ecological environment, and low-carbon emission reduction into the operation and strategy of the port. It is important to study the interaction between the green competitiveness of ports and the hinterland economy in the new stage to build a strong maritime country and realize the upgrading of ports and the transformation of the hinterland economy.
Currently, the existing studies on the interaction between ports and hinterland economies are mainly conducted from a single perspective, such as port throughput, infrastructure, and logistics. There is a relative lack of studies that consider green and low-carbon factors. No research has combined the green competitiveness of ports, green efficiency, and other indicators that reflect ports’ green development and management level with the hinterland economy and explored the interaction between the two. Therefore, this paper takes coastal ports as the research object, overcomes the shortage of previous studies, and explores the interaction between the green competitiveness of coastal ports and the hinterland economy from the perspective of sustainable development. Compared with similar studies, the research results are more universal and comprehensive and more in line with the main theme of port and macroeconomic development. The research results provide references for the green transformation of ports and high-level coordination between ports and hinterlands and also provide a theoretical basis for subsequent studies.
The structure of this paper is as follows: Section 2 reviews the relevant studies on port green competitiveness and the interaction between port and hinterland economy. Section 3 analyzes the mechanism of interaction between port green competitiveness and hinterland economy based on existing studies and theories. Section 4 selects indicators from both port and hinterland and constructs the port green competitiveness evaluation model, the interaction model between port green competitiveness and hinterland economy based on panel data. Section 5 presents the results of the empirical study. Section 6 provides a discussion and analysis of the results. Finally, the conclusions of this paper are summarized.

2. Review of the Literature

2.1. Green Competitiveness Evaluation of Ports

Port green competitiveness takes into account both the economic and environmental benefits of port operations and is an important indicator of the sustainability of ports [5]. The current academic community has explored the green competitiveness of ports based on qualitative and quantitative approaches. The former mostly uses hierarchical analysis, evidence-based reasoning, and the DPSIR method [6,7,8] to construct indicator systems from multiple latitudes, such as port production and operation, to qualitatively describe the green development of ports. The latter mostly utilizes the advantages of good assessment methods, such as stochastic frontier analysis (SFA), non-radial and non-angle DEA models, two-stage DEA model, and DEA combined with directional distance function to quantify the degree of green development of the port. Taking into account mainly the inputs of the port in the production and operation process, desired outputs such as container throughput, cargo throughput, and non-desired outputs are mainly CO2, NOx, and solid waste [9,10,11,12]. The comparison, judgment, and calculation process of the results of the existing qualitative studies are relatively rough, which is very likely to lead to biased results, while the DEA model commonly used in quantitative studies cannot compare multiple ports with an efficiency value of 1 and can only set individual input-oriented or output-oriented, which is difficult to accurately assess the green competitiveness of ports. The super-SBM model can measure both orientations in the evaluation process, and the evaluation results achieve an adequate ranking among all decision units [13]. Due to its ability to further differentiate effective decision units and its low data volume requirements, this model is gradually becoming an important analytical tool for the port industry [14].

2.2. The Interaction between Ports and the Hinterland Economy

In the study of the interaction mechanism between port and hinterland economy, few studies have been conducted to investigate the interaction between port green competitiveness and hinterland economy from the perspective of green sustainable development. Bird pioneered the Anyport ideal model, which argues that the development of the port and hinterland undergoes an evolutionary process from symbiosis to separation and finally to redevelopment, which initially explains the interaction between the port and hinterland [15]. After that, scholars put forward the seaport location theory, regional division of labor theory, synergy theory, etc. [16]. The existing studies on the interaction mechanism between ports and hinterlands are mainly based on the above theories. The role of ports on the hinterland economy—port cargo throughput, port economic growth, etc.—can promote the economic development of the hinterland, enhance the attractiveness of foreign investment in the hinterland, and promote the upgrading and evolution of the economic structure of the hinterland [3,17,18]. Direct and indirect interactions between port infrastructure and the hinterland economy are shown, and the rate of infrastructure construction is directly proportional to the economic development of the hinterland [19]. The increase in the economic pull coefficient of maritime transport activities in ports helps to promote the growth of GDP in port cities, but it also causes environmental pollution and waste of resources in the hinterland [20]. Compared to industrial enterprises, port production and operations have a stronger impact on the hinterland environment, and hinterlands should pay more attention to the implementation of port emission reduction measures [21]. The mechanism of the role of the hinterland economy on ports—hinterland demographic factors, economic structure, trade, and logistics accessibility—have a positive effect on port competitiveness, and the relationship between ports and hinterland economy varies significantly by region and size [18,22,23,24]. Hinterland economic development can increase pollutant gas emissions from ports, and the implementation of emission reduction measures can significantly reduce port pollutant gas emissions [25]. The total economic volume and industrial structure can promote the green efficiency of ports, and the population density of the hinterland has a significant negative impact on the green development of ports [6]. The development of the port is also influenced by the market demand in the hinterland. For freight forwarders and VOCCs, the size and level of market demand is the strategic basis for them to choose whether to share information or not, thus affecting the efficiency of port operations [26]. Active or passive capacity sharing under different demand conditions and operating costs is also an important factor affecting port competitiveness [27]. In terms of population factors, the increased number of COVID-19 infections effectively affected BDI fluctuations and, thus, port performance [28].
System dynamics, VAR models, panel data regression models, the coupling coordination degree model, and gray correlations are often used to quantify the interaction between ports and hinterland economies. Panel data regression models are often used to consider the interaction between ports and hinterland economies from a dynamic perspective [29]. VAR models are used to analyze interrelated time series and predict the dynamic effects of stochastic perturbations on variables, and Granger causality tests are highly specialized in exploring the causal relationship between ports and regional economic development [30]. The gray correlation model can analyze the degree of association between the port and the hinterland and further investigate the factors affecting the interactive and coordinated development of both [31]. The coupling coordination degree model can explain the relationship between ports and hinterlands in a time series dimension [32]. System dynamics can map the complex causal relationships and feedback mechanisms between the economic subsystems of ports and hinterlands [33]. Summarizing the existing research methods, although system dynamics have a strong advantage in explaining macro factors, their parameter settings are rather subjective. The results of gray correlation models do not reflect the interactions between factors, while VAR models have a limited number of variables when applied. The coupling coordination degree model cannot further analyze the relationship between port and hinterland factors. The panel data model considers both temporal and cross-sectional dimensions, can solve the problems of individual differences and homogeneity among research subjects, and has high accuracy. Through a review of the literature, we found that in the evaluation of the green competitiveness of ports, the existing quantitative studies still lack the distinction between multiple effective decision-making units with an efficiency value of 1. In the study of the interaction between ports and hinterland economy, the interaction between ports and hinterland economy is mostly explored from a single level, such as throughput and infrastructure, but few studies have explored the relationship between ports and hinterland economies from a sustainable development perspective, and there are still no studies that combine the green competitiveness of ports with hinterland economies to explore the interaction between the two.

3. Analysis of the Mechanism of Interaction between the Green Competitiveness of Ports and the Hinterland Economy

3.1. The Mechanism of the Hinterland Economy to Port Green Competitiveness

The special location conditions between the hinterland and the port determine that the hinterland is the basis for the development and expansion of the port, and the economic development, market scale, infrastructure construction, and transportation network system of the hinterland all have an important impact on the transformation and upgrading of the port. The hinterland is both the supply place of foreign trade goods and the sales market of the industry near the port, which determine the development of the port. At the same time, the enhancement of the green competitiveness of the port also requires the guarantee of the hinterland cities in various aspects, such as materials, equipment, and labor.
The hinterland’s total economic volume provides resources for enhancing the port’s green competitiveness [6,29]. Government policies and financial support are necessary conditions that ports rely on for their initial construction as well as the initial stage of development. Clear policy orientation, reasonable development planning, advanced service concepts, and a good market atmosphere in hinterland regions, such as the establishment of coastal special economic zones, coastal economic and technological development zones, and bonded zones, are the necessary external environmental guarantees for the rapid development of ports. The total economic volume of the hinterland provides capital and trades soft environment for the green development of ports; promotes the improvement and optimization of port infrastructure and functions; develops low-carbon, energy-saving, and emission-reducing technologies; and enhances the green competitiveness of ports. The hinterland economy’s strength determines the port’s foreign trade frequency. The better the development of the hinterland economy, the more it can drive the expansion of the port’s import and export trade, increasing the port’s income and promoting the port’s green construction.
The economic structure optimization and adjustment of the hinterland provide support for the green competitiveness of the port and promote the transformation and upgrading of the green port business [33,34,35]. The port industrial chain groups formed in the hinterland during the development of the port, including the port symbiotic industries directly generated by the existence of the port, and the port-dependent industries formed and developed by relying on the port and the symbiotic industries, will play an important role in supporting the development of the port. In recent years, the proportion of new industries has gradually increased, and the emergence of high-tech industries has provided the required human resources, technology, and logistics support for the green construction of the port. Secondly, the hinterland cities in the process of high-quality, sustainable development and the economic operation of the resource conditions made a qualitative choice and quantitative provisions, thus affecting the development direction of the port. The transformation and upgrading of the hinterland economy can influence the industrial structure and cargo type structure within the port industry and also make changes to the development strategy, functional positioning, and service scope of the port. The new round of upgrading and optimization of the hinterland industrial structure promotes the port to gradually form an integrated hub with informationization, wisdom, and ecology. Effectively, this improves the green competitiveness of the port in terms of industrial function layout.
The level of investment and consumption in the hinterland provides financial and factor support for the improvement of the green competitiveness of ports [18,35]. The increase in the amount of investment in fixed assets in the hinterland is accompanied by an increase in the amount of investment in energy-saving and emission-reduction infrastructure in ports, including information network systems as well as hardware facilities, increased productive berths, improvements in loading and unloading machine equipment, etc. Economic level development, the level of investment in fixed assets, will also increase, reducing the cost of port production and operation and further promoting the level of progress in port green development-related supporting facilities. Hinterland cities are both the supply of foreign trade goods and the sales market for industrial industries near the port, which determine the development of the port. Additionally, the increase in total retail sales of social consumer goods in the hinterland indicates an increase in hinterland consumption and import and export demand; the hinterland through the port with the region and foreign trade volume is increased, which in turn promotes the increasing types and quantity of goods transported by the port to improve the economic benefits of green development of the port.
The logistics accessibility between the hinterland and the port enhances the attractiveness of green port development [18,20,35]. The accelerated economic integration process in the hinterland has promoted changes in the regional economic structure, reorganization among enterprises, and many new management systems. These also drive the development of the logistics industry in the port hinterland; promote port logistics and shipping, highways, railroads, and other transportation modes to jointly construct a linked supply chain; integrate logistics resources with production factor markets and consumer markets to build logistics information networks, develop e-logistics,; improve the logistics system; build a low-carbon emission reduction logistics method; promote the transformation of port transportation transit function to green and intelligent; and improve the social and environmental benefits of the port. The logistics accessibility between the hinterland and the port also affects the attractiveness of the port to shipping companies as well as carriers. The stronger the logistics accessibility, the greater the chance of shipping companies and carriers choosing the port and the higher the green benefits of the port.

3.2. The Mechanism of Port Green Competitiveness on the Hinterland Economy

Ports are the windows of a country or region opening to the world and an important bridge for the regional economy to participate in the international division of labor and international competition. Port green competitiveness integrally reflects the strong development of port enterprises in the economic circle and their ability to gain strong vitality within the ecosystem cycle. The green development of the port constantly promotes the green competitiveness of the port in the process of upgrading and also has a tremendous full-shot driving effect on the hinterland economy, which is mainly reflected in the improvement and upgrading of the logistics system and the improvement of the total economic volume, industrial gathering, and optimization, driving investment and consumption demand.
The improvement of the green competitiveness of ports directly drives the economic growth of the hinterland [16,29,33]. China has a superior port location and rich marine and coastline resources, and the port hinterland in coastal areas has gained rapid development since the reform and opening up. Port operators and shipping companies are gradually implementing emission reduction plans while improving their services and focusing on sustainable economic and resource development; the production and operation benefits brought by the improvement of port green competitiveness bring direct output value, national income, and tax revenue to the hinterland economy. The port relies on its geographical location and sustainable development advantages to attract domestic and foreign capital, technology, and talent to the port industry, which bring a lot of resources to the economic development of the hinterland, enhance the employment rate of the hinterland cities, and produce a scale aggregation effect. At the same time, the Matthew effect of port green development shows that ports with strong green competitiveness are more likely to maintain their competitive advantage and enhance their market share, thus enabling the ports to obtain both considerable economic and great environmental benefits in their future development, which will continue to promote the high-quality development of the hinterland economy and provide a power source for the hinterland economic development.
The enhancement of the green competitiveness of ports promotes the gathering and optimization of hinterland industries [25,34,35]. On the one hand, the green infrastructure construction of ports drives the development and gathering of infrastructure manufacturing, engineering construction, electronic equipment, and other industries required for port construction, sound environmental protection, and clean energy infrastructure, promoting hinterland industries to adapt to the green development requirements of ports and form a reasonable resource utilization system and industrial layout. On the other hand, environmentally friendly ports in the process of operation will generate huge demand for other industries, leading to the linked development of metallurgy, petrochemicals, finance, insurance, new energy, etc. As the window of the regional economy to the outside world, ports also play a great role in technology exchange. Due to the superior location conditions, hinterland cities often become the gathering areas of multinational companies and high-tech industries, creating conditions for the dissemination and exchange of advanced technology and management experience, improving informationization and network construction, and driving the improvement of the city’s industrial level. The green development of the port industry plays an important role in the efficient operation of upstream and downstream industries and the sustainable development of the whole national economy.
Ports assume the role of hubs in cargo transportation due to their geographical location, and the enhancement of green competitiveness of ports stimulates the development of port-side industries, logistics, and trade, thus driving hinterland investment and consumption demand [18,35]. In the process of ports going green and smart, the expected profitability of ports increases, costs are optimized, and related industries come into being, promoting hinterland and investor investment demand to gather in the direction of green development of ports, optimizing port infrastructure, and enhancing port informatization and low carbonization. Green port construction has the advantages of small environmental pollution, high energy utilization, large comprehensive benefits, good development potential, etc. With the deepening of global trade and economic integration, countries tend to establish free trade zones in advanced ports with strong green competitiveness to better develop foreign trade and thus deepen the exchange of advanced technologies, which are conducive to eliminating international trade barriers, promoting international exchanges and cooperation, and meeting and stimulating consumption demand in the hinterland and surrounding cities.
The improvement of the green competitiveness of ports promotes improving and upgrading the hinterland logistics system [18,20,36]. Ports are the combination point for the mutual transformation of maritime transport and other modes of transport, and they are integrated hubs of transportation. The development mode of ports is shifting from the traditional and single mode of cargo transportation to the third-party logistics center mode, which promotes the rapid emergence of enterprises that provide comprehensive and efficient logistics services. The port transportation system and spatial layout structure directly affect the spatial development and spatial layout of the hinterland and have an important impact on the formation of the transportation network system between the hinterland. Port energy saving, emission reduction, and low carbon development require a convenient transportation system and, through the docking of the highway, railroad, navigation, and aviation conditions, reduce transportation costs and realize sea–land–air intermodal transport, which is a requirement for the hinterland in the process of continuous development of the port. In the process of gradual improvement of the green competitiveness of ports, reasonable transportation and greening are created, and regional ecological patterns are formed. Port logistics and transport systems are gradually intelligent, green, and specialized, which further promote the improvement and upgrading of hinterland logistics systems in the process of interaction with hinterlands, drive the construction of infrastructure and transportation network systems in the region, and improve logistics accessibility and circulation efficiency between ports and hinterlands.
The mechanism of interaction between the green competitiveness of ports and the hinterland economy is shown in Figure 1.

4. Indicator Selection and Model Setting

4.1. Sample and Indicator Selection

Given the completeness and availability of data, the top 10 coastal ports in China in terms of container throughput in 2019 were selected as samples according to the China Ports Yearbook 2020, as shown in Table 1. The production and operation capacity of these 10 major ports are in the leading position, which can reflect the overall level of coastal ports, and their green development capacity directly affects the overall green competitiveness of coastal ports, so it is representative to take these 10 major ports as the sample [11]. To avoid the bias of the epidemic on the research results, the research interval of this paper is 2007–2019, and the data are obtained from the China Port Statistical Yearbook of each year, the annual reports of port enterprise, local statistical yearbooks, the statistical database of the China Economic Network, China Knowledge Network, and other official websites.
Summarizing the selection of indicators from related studies [8,11,14], the port green competitiveness evaluation indicators are selected by combining the principles of quantifiability, accessibility, and representativeness of indicators. As shown in Table 2, labor input is a prerequisite for production activities in ports, and the daily operation of ports and terminal equipment requires personnel; a sufficient labor force is beneficial to the development of ports, so the number of employees is used in this paper to represent labor input factors. Capital input is the material prerequisite for the production and operation of the port, which is represented by the number of berths for production that occupy a large part of the construction cost of the port. Land input is an important symbol of the scale of the port, and the wharf is an important part of the port, so this paper uses the length of the production wharf to represent the land input. The expected output is the product expected to be obtained in the process of port operation. Container throughput is the sum of the number of imported and exported containers in a period, which reflects the port’s important role in domestic material exchange and foreign trade transportation. The expected output is expressed by container throughput in this paper. Undesired output refers to the substances that harm the environment when obtaining desired output, such as CO2, SO2, dust, sewage, etc. Because of the availability of data, CO2 is selected as the indicator of non-desired output in this paper.
The non-desired output indicator selected in this paper for calculating the green competitiveness value of ports is CO2, but since the data on pollutant emissions generated during the operation of Chinese ports are not publicly available in detail, this paper refers to the method proposed by Men et al. [37] for calculating port carbon dioxide emissions with the following formula.
C = S C H C β
In the formula: C is the port carbon dioxide emissions, S C is the current year’s standard coal unit consumption, H C is the current year’s cargo throughput, and β is the carbon emission factor; this paper takes 2.4589.
To make the research results more direct and accurate, the direct economic hinterland of the port, i.e., the city where the port is located, is selected as the object of the port hinterland in this paper [38]. Combined with the analysis of the interaction mechanism in the previous section, this paper mainly explores the interaction with the green competitiveness of ports from four aspects: the total economic volume of the hinterland, the economic structure of the hinterland, the investment and consumption level in the hinterland, and logistics accessibility between ports and hinterland. The hinterland economic indicators are also selected from these four aspects. Total local output and local budget revenue are important indicators to show the overall development level of the hinterland economy and local construction capacity, so these two indicators are used to represent the total economic volume of the hinterland [18]. The contribution of value added by primary industry to regional GDP is low, and the level of industry and service industry are the main factors affecting the quality and speed of economic growth; therefore, the proportion of the added value of the secondary industry and the proportion of the added value of the tertiary industry are chosen to represent the economic structure of the hinterland in this paper [39]. Fixed asset investment, including port and other fixed asset investments, reflects the construction of infrastructure such as ports, and total retail sales of consumer goods is an important response to the level of local trade and consumption, both of which are the main drivers of economic growth in the hinterland; so, this paper chooses total investment in fixed assets and total retail sales of consumer goods to represent the investment and consumption level in the hinterland [40]. In Chinese port cargo and container transport, waterway and road transshipment account for a high proportion, while rail–waterway transshipment accounts for a smaller proportion. This paper chooses road freight turnover and waterway freight turnover to represent the logistics accessibility between ports and hinterlands [18,41,42]. The indicators are shown in Table 3.

4.2. The Super-SBM Model

The traditional DEA approach ignores the input–output slackness problem, which may overestimate the results once there is non-zero slack and insufficient inputs and outputs. Tone proposed the SBM model based on the slack measure in 2001, and the economic interpretation of the model shifts from maximizing the benefit ratio to maximizing the actual profit. In practical measurements, the above SBM model results in a situation where multiple decision units are simultaneously 1 and the representation is fully valid, creating an obstacle to further research on effective decision units. Therefore, Tone has given a super-SBM with modified slack variables based on the SBM including non-expected output [13]. This model allows the existence of cases where the measurement result is greater than 1, which makes the comparative analysis among multiple effective decision units possible and takes into account the non-expected output during the production operation of the decision unit, which is relevant to the real production life environment. The formula is as follows.
M i n   ρ = 1 + 1 m i = 1 m S i X i k 1 1 q 1 + q 2 ( r = 1 q 1 S r g + y r k g + t = 1 q 2 S t b y t k b )
j = 1 , j k n x i j λ j S i X i k j = 1 , j k n y r j g λ j + S r g + y r k g j = 1 , j k n y t j b λ j S t b y t k b 1 1 q 1 + q 2 ( r = 1 q 1 S r g + y t k b + t = 1 q 2 S t b y t k b ) > 0 S > 0 , S g > 0 , S b > 0 , λ > 0 i = 1 , 2 , , m ; r = 1 , 2 , , q ; j = 1 , 2 , n ( j k )
Equations (2) and (3): ρ is the efficiency value of the decision unit, which represents the green competitiveness value of each port measured in this paper. n is the number of decision units, which represents the number of ports in this study.   X i i = 1 , 2 , , m denotes the input of each decision unit, the desired output is denoted by y r g ( r = 1 , 2 , , q 1 ) , and non-desired outputs are denoted by y t b ( t = 1 , 2 , , q 2 ) . x i k , y r k g , and y t k b are the values of the input, expected output, and non-expected output indexes, respectively. s i , s r g + , s t b are the relaxation variables of input, expected output, and non-expected output, respectively. λ is the weight vector.

4.3. Panel Model of Interaction between Port Green Competitiveness and Hinterland Economy

This paper uses the panel data model to analyze the interaction between port green competitiveness and the hinterland economy. Compared with the cross-sectional model and the time series model, which only considers the influence of a single dimension, the panel data has both cross-sectional and time dimensions, which can solve problems that cannot be solved by cross-sectional data and time series data alone. Moreover, it can effectively solve the problem of missing variables due to unobservable individual differences or “heterogeneity” among ports, and at the same time, the sample size of panel data increases significantly, which can significantly improve the estimation accuracy compared with cross-sectional data.
In terms of the role of the hinterland economy on the green competitiveness of ports, this paper mainly explores the role of the hinterland economy on the green competitiveness of ports from four aspects. Model I is constructed as follows.
ln E F i t = β 0 + β 1 ln G D P i t 1 + β 2 ln F Y i t + β 3 ln S Y i t + β 4 ln T Y i t + β 5 ln I i t + β 6 ln R E T i t + β 7 ln R O i t + β 8 ln W A i t + β 9 ln E F i t 1 + ε i t
The variables G D P i t 1 of total local output, F Y i t of local budget revenue, S Y i t of the proportion of the added value of the secondary industry, T Y i t of the proportion of the added value of the tertiary industry, I i t of total investment in fixed assets, R E T i t of total retail sales of consumer goods, R O i t of road freight turnover, and W A i t of waterway freight turnover are used in Equation (4) to represent the hinterland economy, and port green competitiveness is expressed using E F i t . Since the effect of the improvement of the total hinterland economy on the green competitiveness of ports has a certain time lag, the total local output in Model I uses the lagged one-period data G D P i t 1 . Considering that ports can maintain their existing green competitive advantages only through long-term construction and operation, the lagged one-period variable E F i t 1 of port green competitiveness is added in Model I to reveal the “Matthew effect”.
In terms of the role of port green competitiveness on the hinterland economy, according to macroeconomic theory, the output is equal to the sum of consumption, investment, and government purchase, and port green competitiveness, road freight turnover, and waterway freight turnover are components of total investment and total consumption, respectively; therefore, the three variables have a real impact on total local output. Model II is constructed in this paper as follows.
ln G D P i t = β 0 + β 1 ln E F i t 1 + β 2 W A i t + β 3 ln R O i t + ε i t
To normalize the numerical units, the logarithm of the original data for each variable is used in the panel data model, and the coefficients before each variable in the model represent elasticities. The price variables are all deflated by the consumer price index (CPI) released in China in the corresponding year, using 2007 as the base period.

5. Results

5.1. Port Green Competitiveness

This paper uses Matlab software to calculate port green competitiveness. The numerical value obtained by the super-SBM model comprehensively considers the influence brought by port technology and scale. In the result analysis, this paper breaks it down into pure technical efficiency and scale efficiency for further analysis, reflecting the port input conversion and resource utilization capacity.

5.1.1. Green Competitiveness of 10 Major Coastal Ports

According to Table 4 and Figure 2, the green competitiveness values of ports from 2007 to 2019 show a fluctuating trend. The ports with stable development and upward trend are Qingdao Port, Shanghai Port, Guangzhou Port, Tianjin Port, and Rizhao Port. Qingdao Port and Shanghai Port are in the leading position of green competitiveness with high efficiency of port input–output transformation. The ports with more fluctuating development are Xiamen Port, Yingkou Port, Dalian Port, and Lianyungang Port. The green competitiveness of Xiamen Port was in the production frontier side until 2017; it was 0.744 in 2017 and showed a decreasing trend. The green competitiveness of Yingkou Port gradually stabilized after 2013. Combined with the green competitiveness average of each port, Qingdao Port, Shanghai Port, and Xiamen Port are in the first echelon with a green competitiveness average greater than 1. Ningbo Port, Guangzhou Port, Tianjin Port, and Dalian Port are in the second echelon with green competitiveness average between 0.515 and 0.642. Yingkou Port, Lianyungang Port, and Rizhao Port are in the third tier with an average value of green competitiveness below 0.5.

5.1.2. Pure Technical Efficiency of 10 Major Coastal Ports

Pure technical efficiency reflects the green competitiveness of the port due to the influence of management and technology, etc. In addition to external factors such as national policies and financial support, pure technical efficiency is also related to the internal technical factors of the port.
According to Table 5 and Figure 3, the pure technical efficiency of the top 10 coastal ports in China from 2007 to 2019 is high, with the average value of each port above 0.6. The ports that were able to maintain effective pure technical efficiency were Lianyungang Port, Xiamen Port, Shanghai Port, and Qingdao Port, with mean values remaining between 1.310 and 1.651. The mean value of pure technical efficiency of Yingkou Port is 1.049, which is at the production front side and ranks in the middle of the top 10 ports. The pure technical efficiency of Guangzhou Port, Tianjin Port, Ningbo Port, and Dalian Port is greater than 1 in only a few years. In general, the pure technical capacity of the top 10 ports has a small gap, indicating that the progress of green and low-carbon technologies in recent years is a necessary factor for the green development of ports.

5.1.3. Scale Efficiency of 10 Major Coastal Ports

Port scale efficiency reflects the green competitiveness of the port influenced by the scale factor, i.e., the value-added benefit of the expansion of the port industry to the improvement of the green competitiveness of the port.
From Table 6 and Figure 4, we can learn that the scale efficiency of the top 10 coastal ports in China from 2007 to 2019 does not exceed 1 and shows a stratification phenomenon. The average value of scale efficiency of Qingdao Port, Tianjin Port, Guangzhou Port, Shanghai Port, Ningbo Port, Xiamen Port, and Dalian Port is greater than 0.7, among which the average value of scale efficiency of Qingdao Port and Tianjin Port is the highest at 0.936 and 0.927, respectively. The scale efficiency of Shanghai Port shows an increasing trend in recent years, while the scale efficiency of Xiamen Port gradually decreases. The scale efficiency of Rizhao Port, Lianyungang Port, and Yingkou Port is lower, with an average value below 0.5. From a comprehensive point of view, the scale efficiency of the top 10 ports shows a polarization phenomenon, but the gap between the ports is gradually narrowing as time goes by.

5.2. The Interaction between Port Green Competitiveness and Hinterland Economy

This section uses a panel data model to explore whether hinterland economic variables have a boosting effect on port green competitiveness in the context of sustainable development and whether port green competitiveness can contribute to hinterland economic development.

5.2.1. Stability Test

Before conducting regression estimation of panel data, a unit root test is used to check whether the data of each variable is smooth to avoid the pseudo-regression phenomenon, which in turn affects the final results of the model. In this paper, the results of LLC and Fisher-ADF tests are used to determine the unit root of variables.
From the results in Table 7, it is known that the original series of lnGDP, lnWA is not smooth by the LLC and Fisher-ADF tests, and the first-order difference between the two variables results in a smooth series of lnGDP, lnWA after the difference. Therefore, the data used in the regression are the log-differenced series of lnGDP and lnWA, which represent the changes in the growth rates of the corresponding variables.

5.2.2. Model Setting Test

The commonly used panel regression models are mainly fixed-effects models, random-effects models, and mixed-effects models. In order to determine the types of Models I and II that are applicable, F-tests and Hausman tests were conducted on the data after unit root tests in this paper.
From Table 8, it can be learned that both Model I and Model II are greater than the critical value at the 95% level of the F-test, rejecting the original hypothesis and indicating that both models are non-mixed-effects models. The Hausman test is further performed on the models, and the results show that Model I and Model II reject the random effects model at the 99.9% and 95% significance levels, respectively. Therefore, the form of both model one and model two is a fixed-effects model.

5.2.3. Regression Result

In Model I, there is a contemporaneous correlation between GDP and the variables FY, I, and RET; in Model II, there is a contemporaneous correlation between GDP, RO, and WA, while there is heteroskedasticity in the data in the two models. Therefore, in the regressions, both Model I and Model II are estimated using cross-sectional approximate uncorrelated regressions. Since the obtained results may be overestimated, only the sign of the coefficients before each variable is considered. The model estimation results are in Table 9.
Model I mainly explores the influence of the hinterland economy on the green competitiveness of ports. According to the regression results in Table 9, we can learn that, in terms of the total economic volume of the hinterland, the lagged one-period total local output growth rate ΔLnGDPit−1 and local fiscal budget revenue lnFYit have a significant positive influence on the green competitiveness of ports, showing that the green development of ports cannot be separated from the support of the total hinterland economy. In terms of the economic structure of the hinterland, the proportion of the added value of the secondary industry lnSYit has a significant negative impact on the green competitiveness of the port. The proportion of the added value of the tertiary industry lnTYit has a significant positive influence on the green competitiveness of ports. Regarding the investment and consumption level of the hinterland economy, the regression results show that total investment in fixed assets Lnit and total retail sales of consumer goods lnRETit have a significant negative impact on the green competitiveness of ports. In terms of logistics accessibility between ports and hinterlands, the road freight turnover lnROit has a significant negative impact on the green competitiveness of ports. The waterway freight turnover ΔlnWAit has a significant positive influence on the green competitiveness of the port. The lagging one-period port green competitiveness lnEFit−1 has a significant positive impact on the green competitiveness of ports in the current period, indicating that the green competitiveness of ports has certain inertia, and the stronger the green competitiveness of ports, the more they can maintain their leading position, while the ports with weaker green competitiveness have relatively fewer resources and opportunities, and the green development of ports is promoted more slowly.
In Model II, the lagged period of port green competitiveness lnEFit−1 has a significant positive effect on the total local output of the hinterland region, which indicates that the improvement of port green competitiveness has a significant boosting effect on the total economic volume of the hinterland region, and the green development of ports is one of the important factors to promote the high quality and healthy cycle development of the hinterland economy. Waterway freight turnover ΔlnWAit has a significant positive effect on the hinterland economy. Road freight turnover lnROit has a significant negative impact on the total economic volume of the hinterland.

6. Discussions

6.1. Green Competitiveness Analysis of Ports

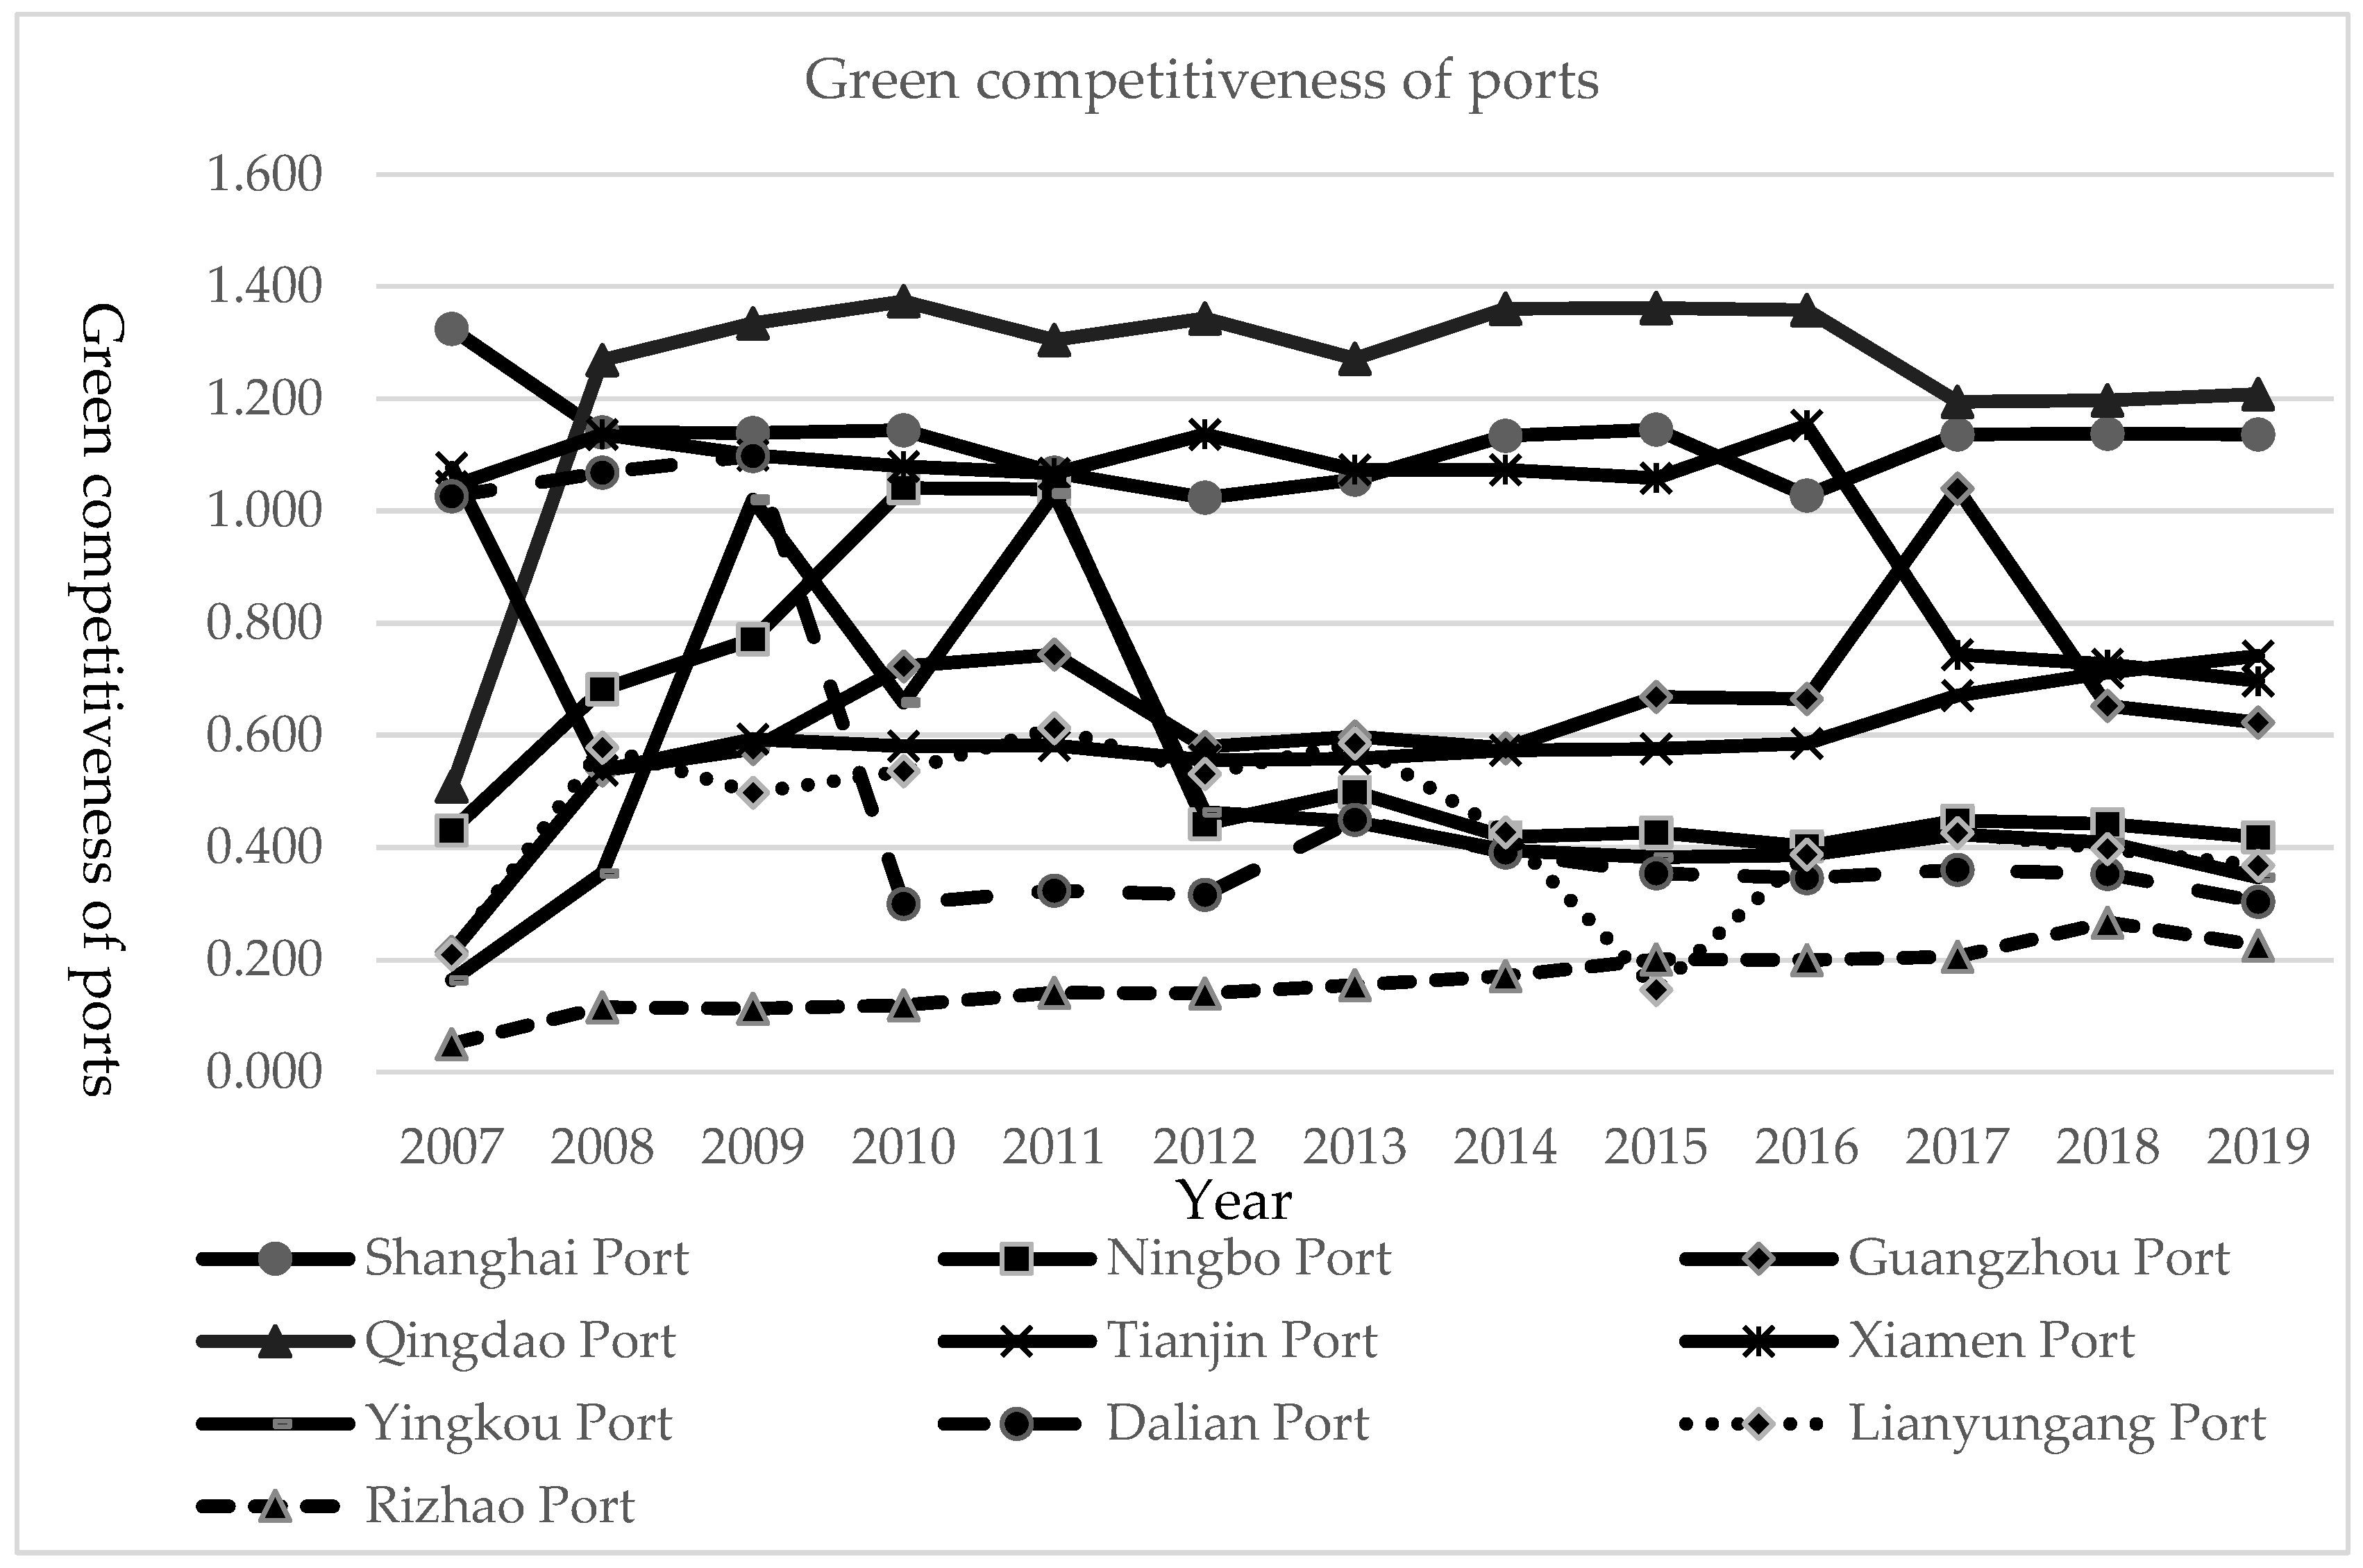
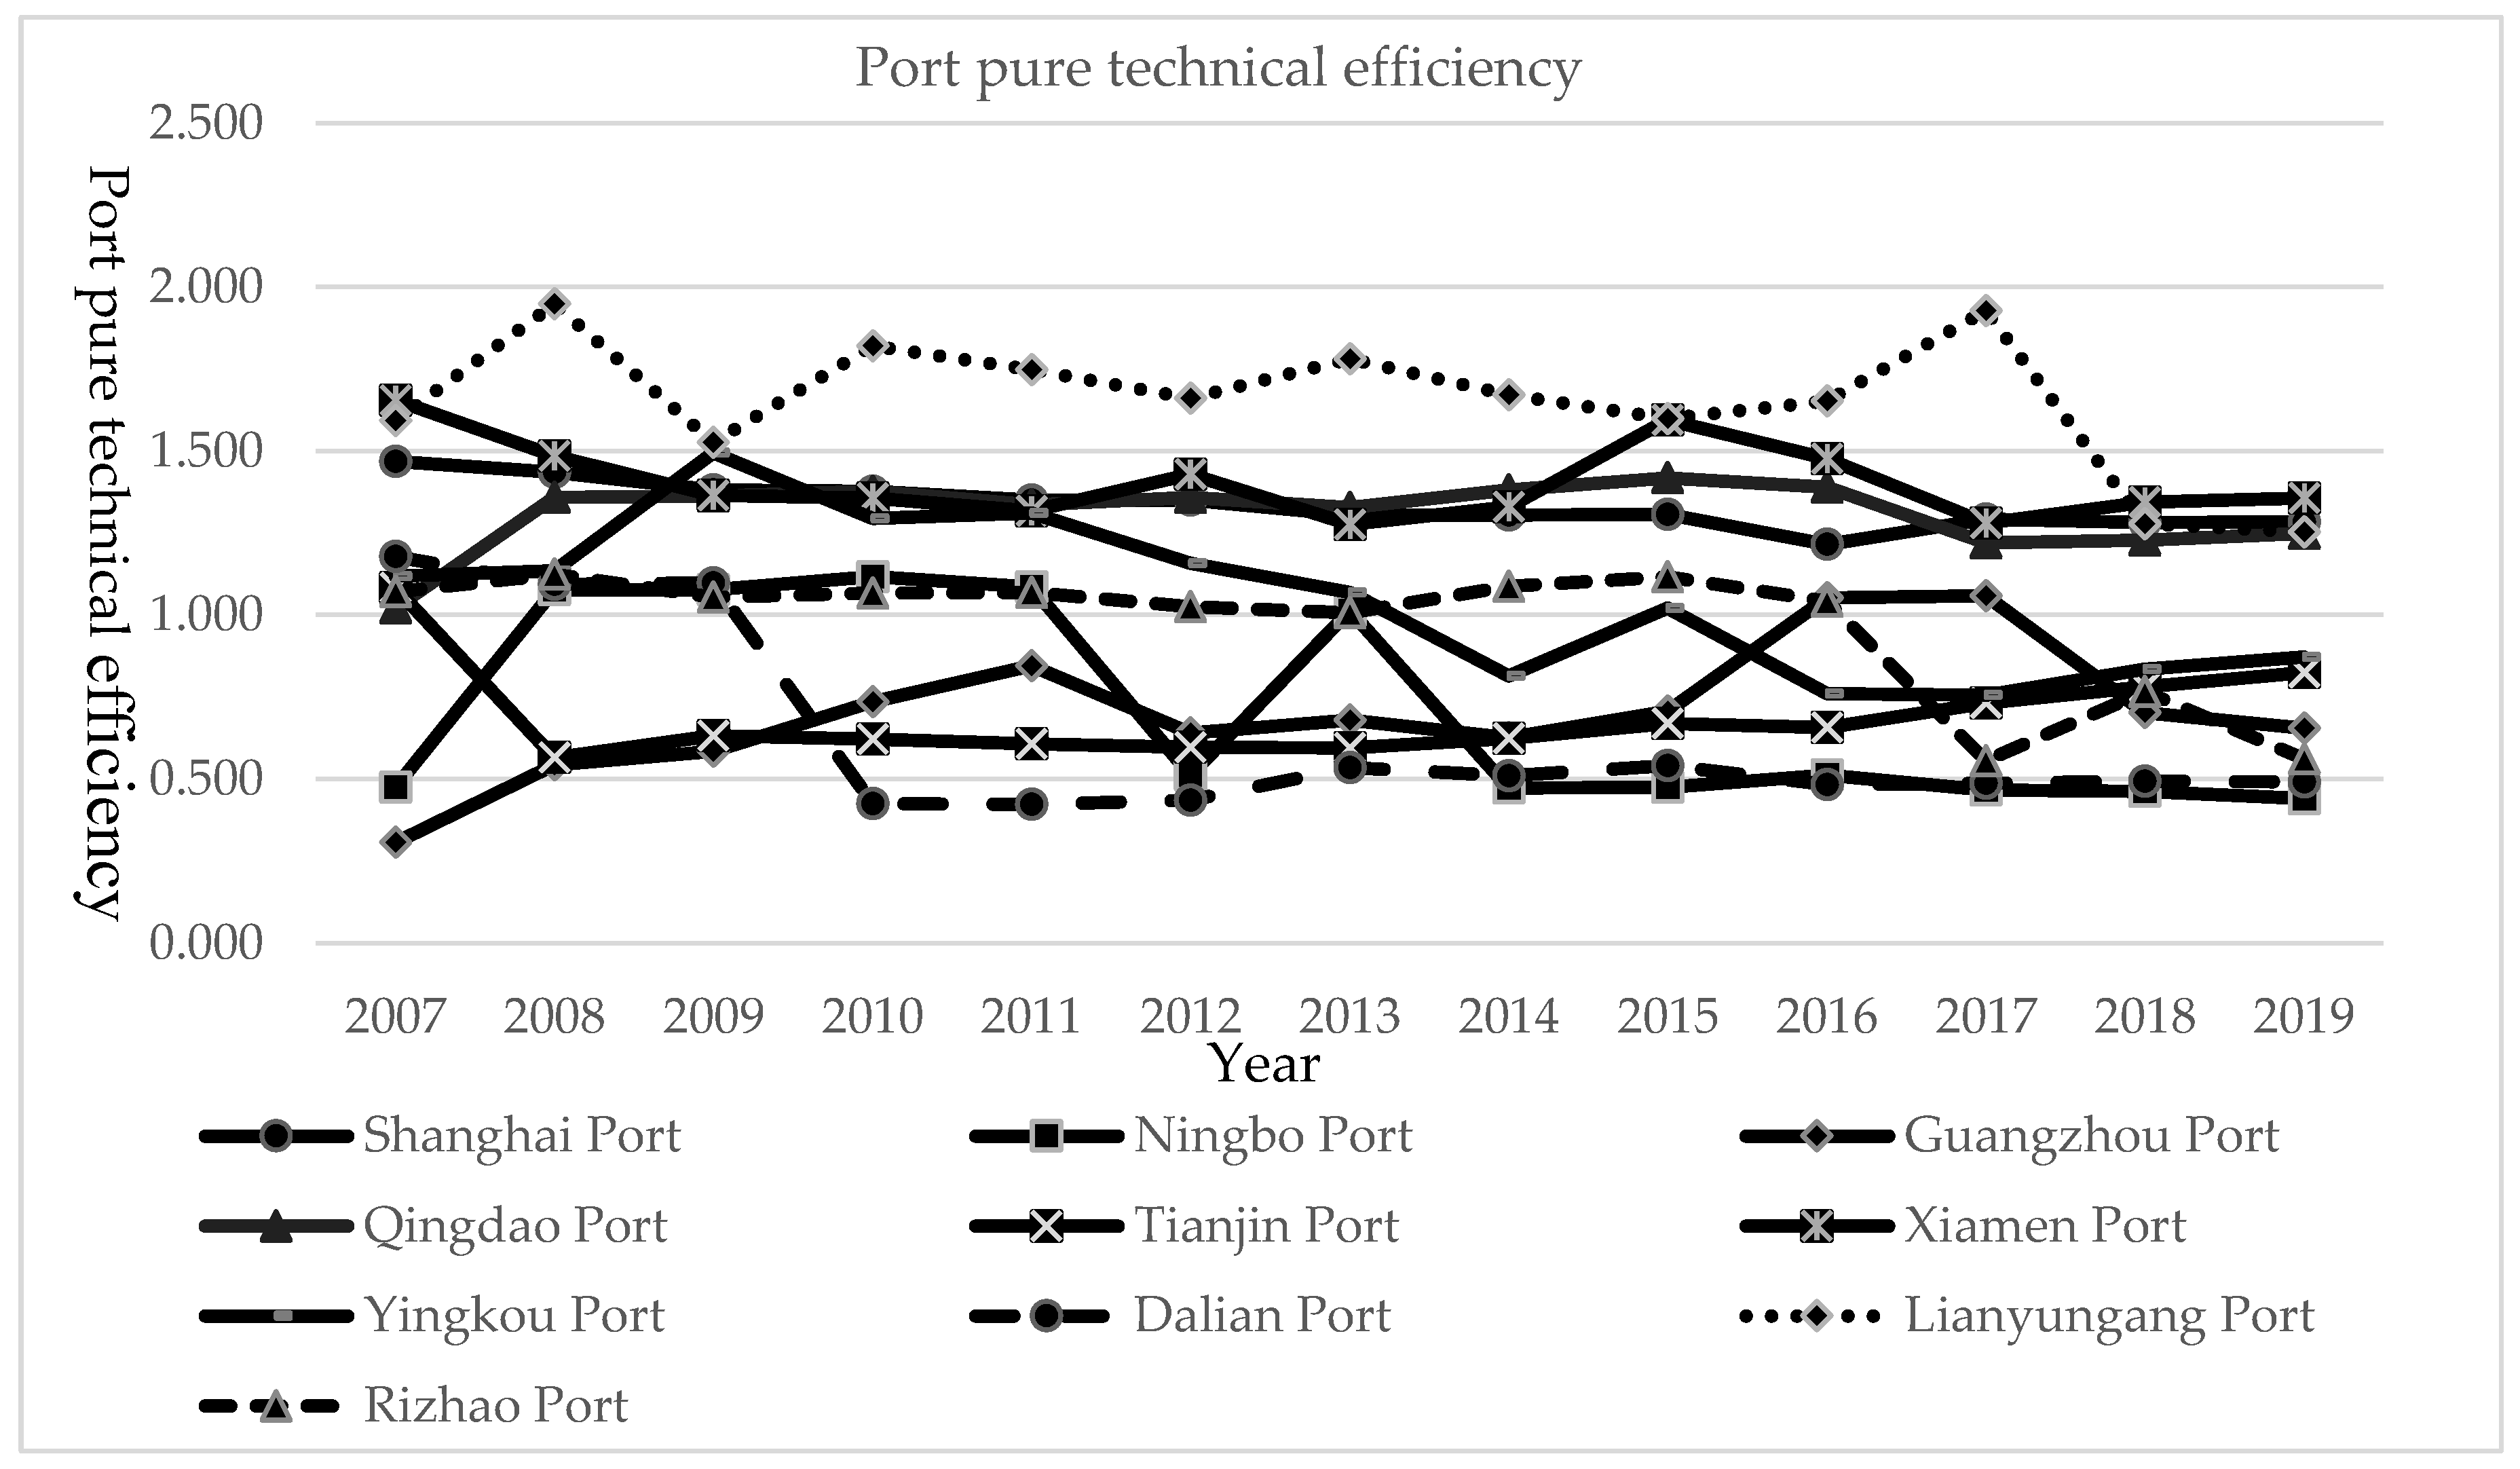
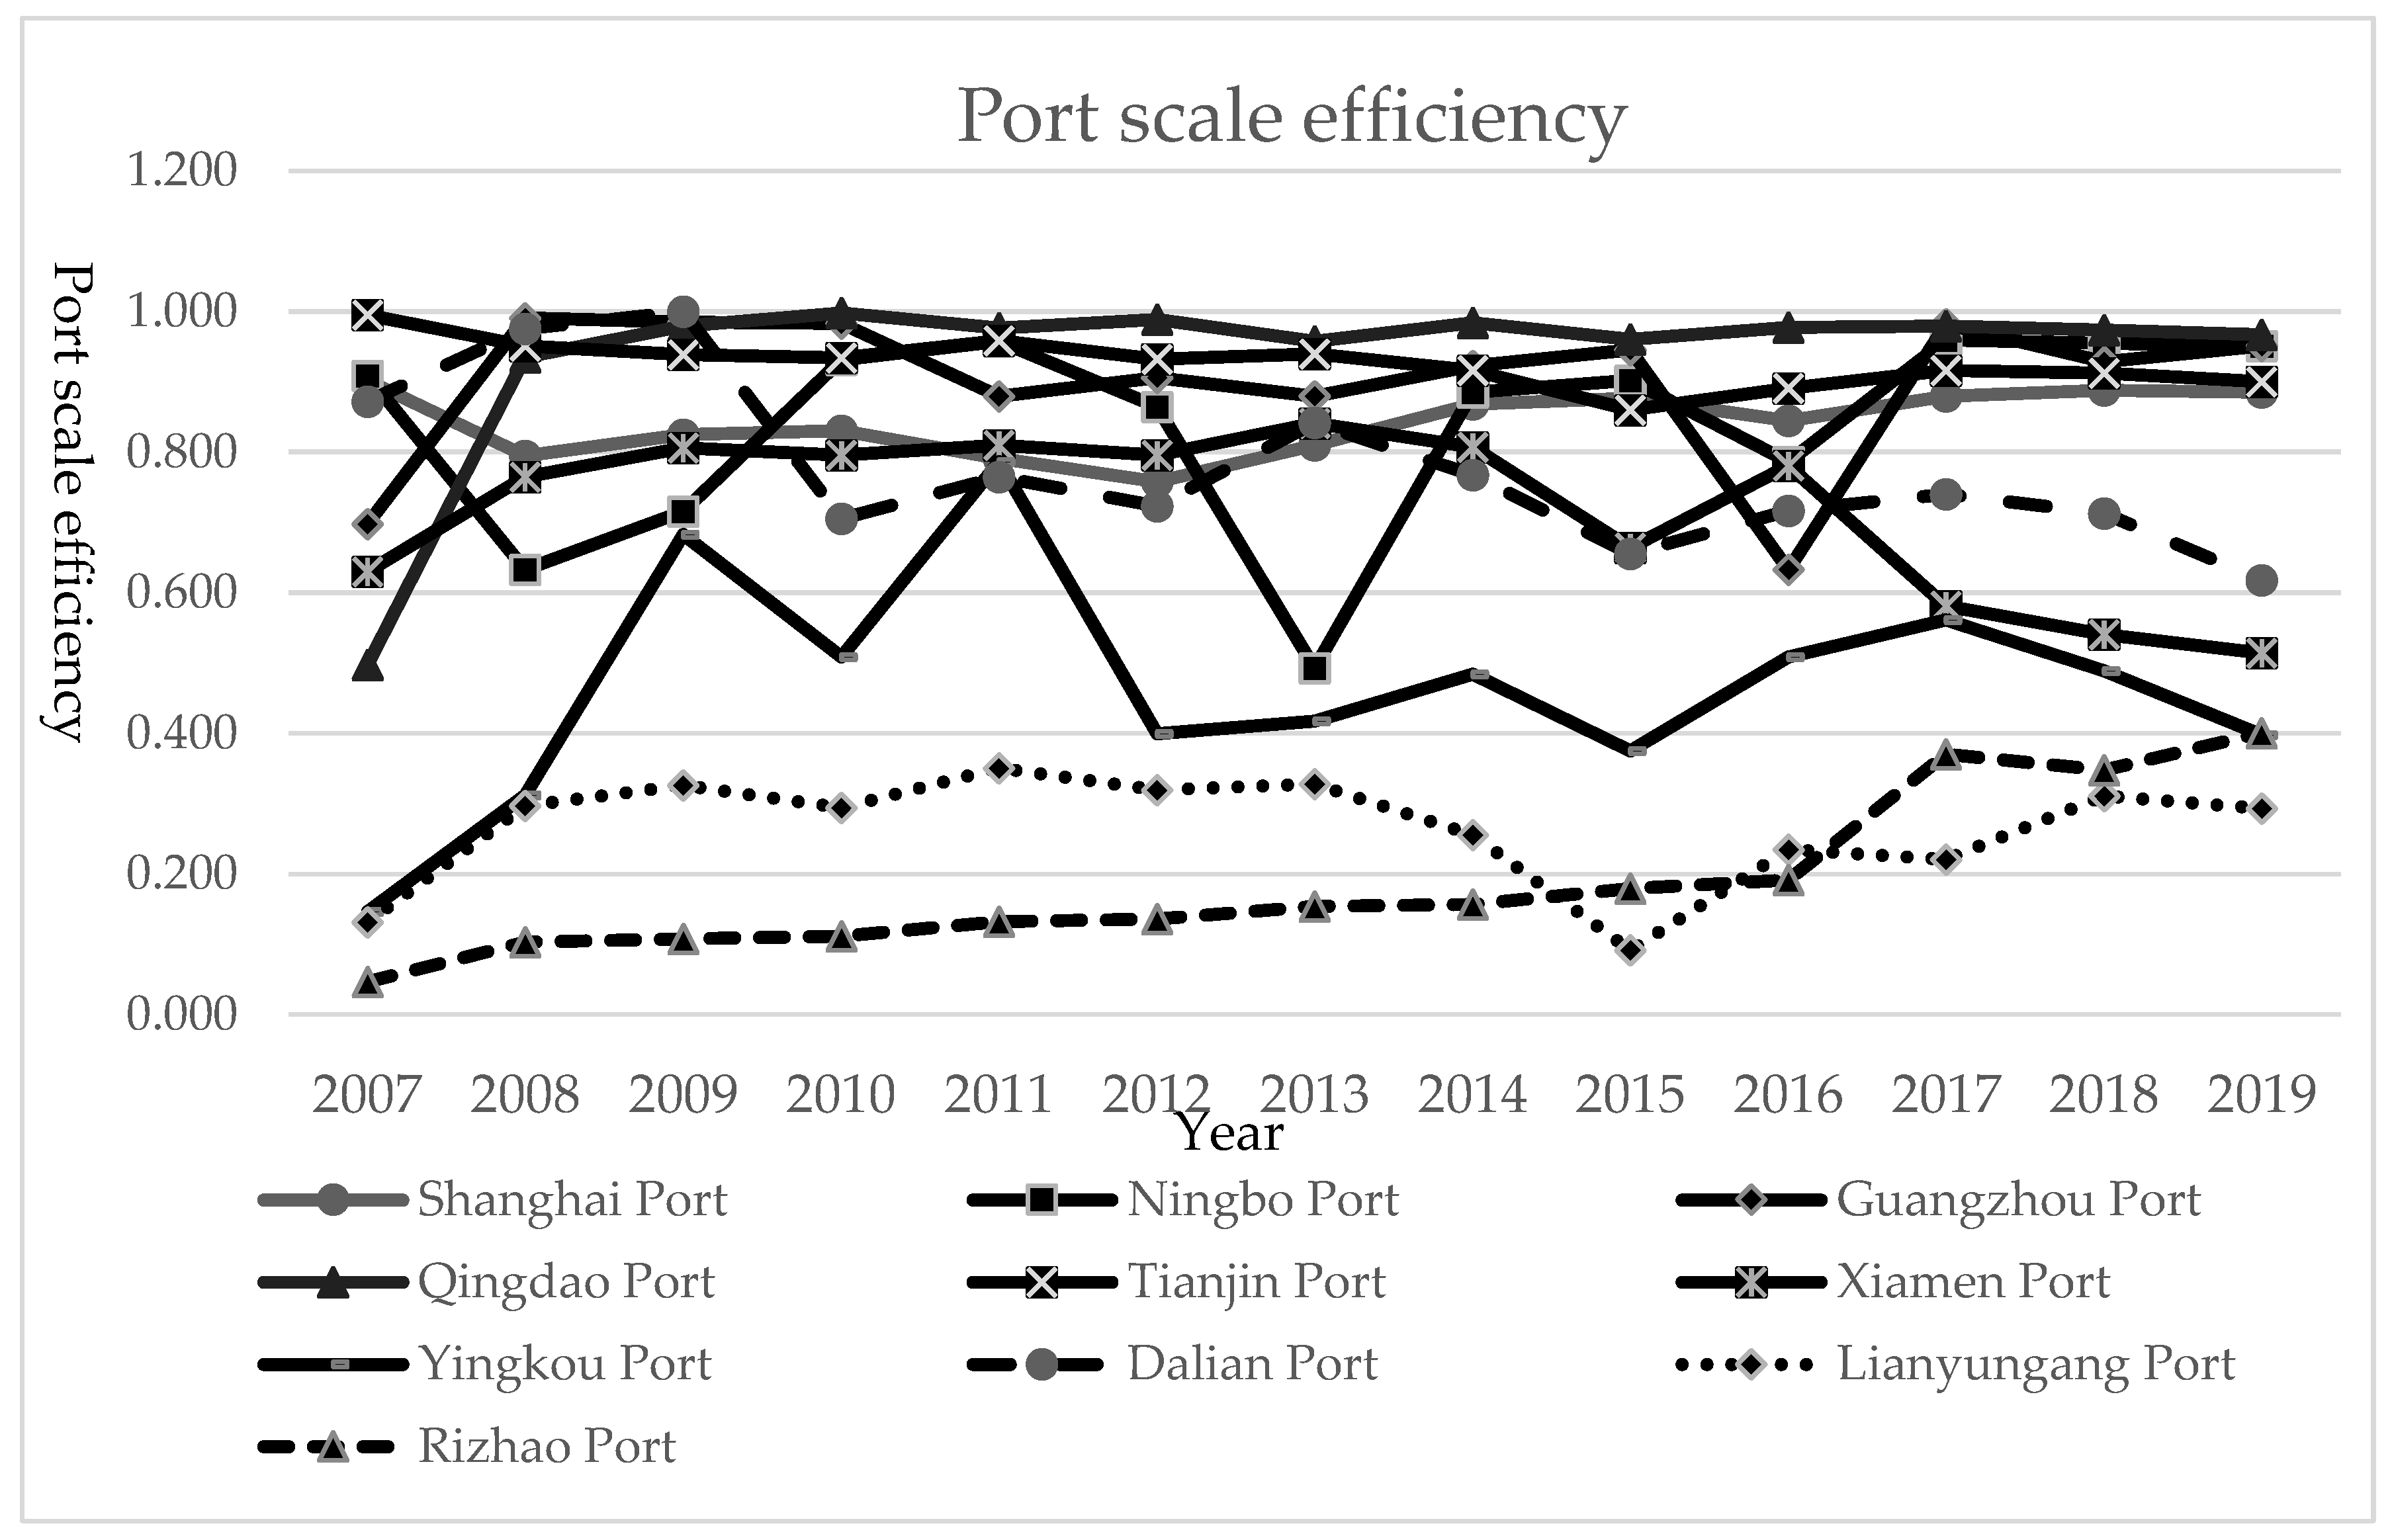
According to the evaluation results of port green competitiveness, it can be known that, from the perspective of time sequence, the green competitiveness of the top 10 ports is in a dynamic change and gradually becomes stable in 2017. The pure technical efficiency is stable and the gap between ports is small, indicating that technological improvement and upgrading is the cornerstone of green port development. Under the background of “double carbon”, Chinese ports actively build ecological green ports, and energy-saving and emission-reduction technologies, such as automatic rail cranes, new energy card collection, and oil-to-electricity conversion, have been applied in the production and operation of most ports. Port scale efficiency presents a polarization trend, but as time goes by, the gap between ports becomes smaller and scale efficiency gradually increases. This reflects the excessive investment in port infrastructure and scale in the pre-construction process of the port, resulting in the problem of investment redundancy, which makes the port scale and port green development unable to reach the optimal configuration. Due to different natural geographical conditions and the economic size of the hinterland, ports in China have different sizes, so port scale efficiency presents stratification. However, with the rapid development of cooperation between ports, information flow, and logistics, the conversion rate of port scale input gradually increases, and the scale efficiency gap between ports gradually narrows.
Based on the horizontal comparison of average values, the scale efficiency of Dalian Port, Ningbo Port, Guangzhou Port, and Tianjin Port is greater than the pure technical efficiency. In future development, these four ports should pay more attention to regulating input factors, developing and applying low-carbon emission reduction technology, improving port infrastructure, and improving resource utilization efficiency. The pure technical efficiency of Shanghai Port, Qingdao Port, Xiamen Port, Yingkou Port, Lianyungang Port, and Rizhao Port is greater than the scale efficiency. In the future, attention should be paid to the rational adjustment of port investment and construction scale and harbor industrial structure to promote the green development of ports.

6.2. Analysis of the Interaction between Port Green Competitiveness and the Hinterland Economy

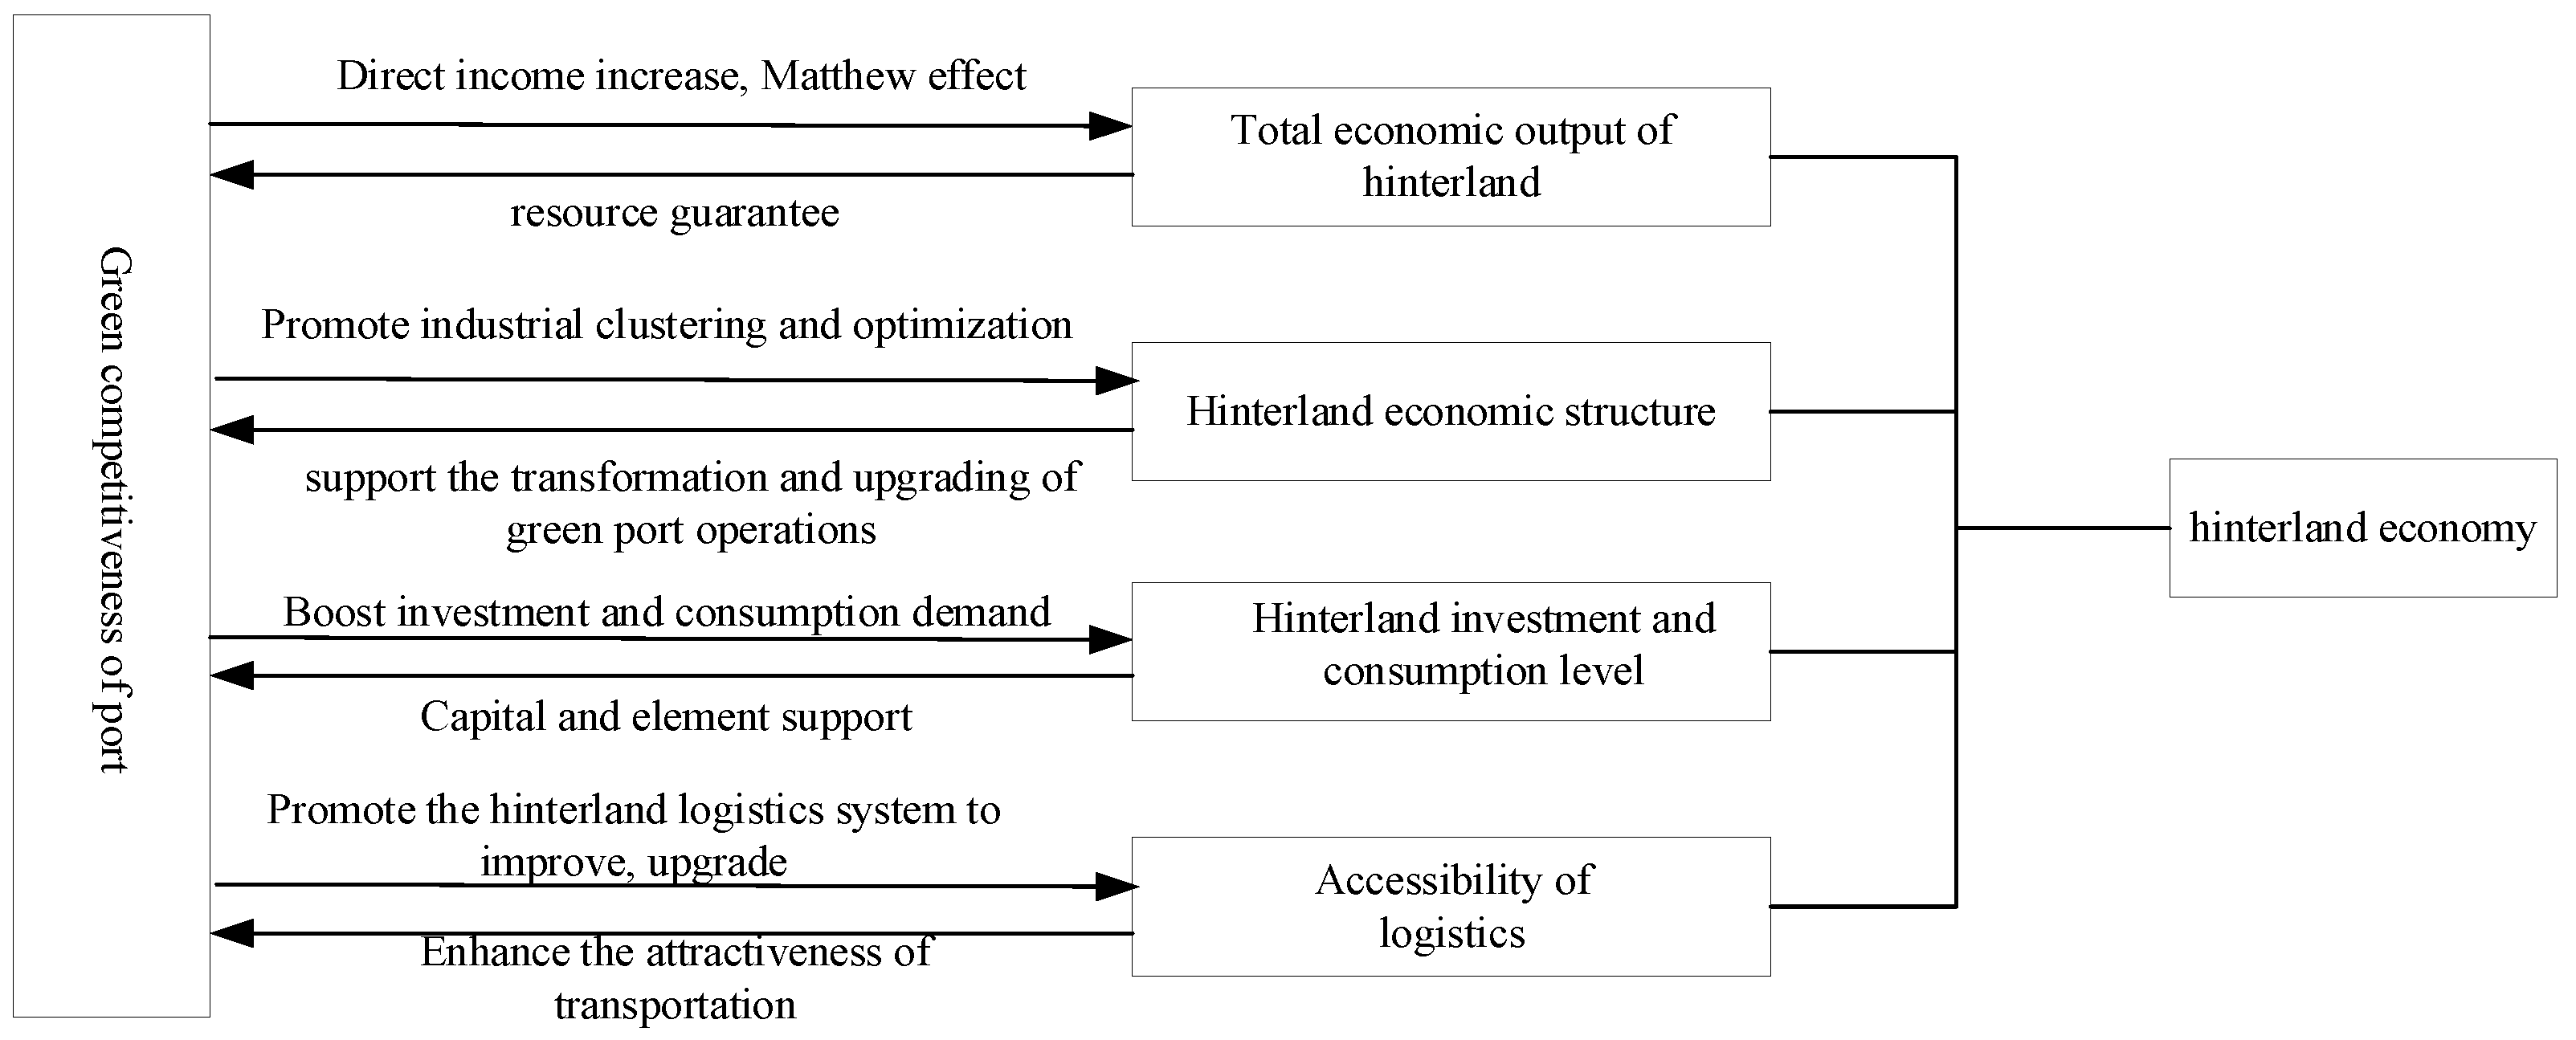
According to the regression results of the panel data model, the relationship between port green competitiveness and the hinterland economy is not completely coordinated and promoted. There is a mutual influence and promotion relationship between port green competitiveness and hinterland economy, while there are also some factors that have a negative effect on port green competitiveness enhancement and hinterland economy development.
In terms of the role of the hinterland economy on the green competitiveness of ports, the total hinterland economy is an important support for the development of ports, and although the growth rate of China’s GDP has gradually slowed down in recent years, it is still an important factor in the improvement of the green competitiveness of ports. The increase in the total output of the hinterland economy is accompanied by the growth of global trade, which will further promote the increase in the direct income of ports. On the other hand, local budget revenue provides financial input for ports; supports port infrastructure construction and transformation; researches and applies low-carbon emission reduction technologies; and promotes ports to realize a virtuous cycle of energy saving, consumption reduction, carbon reduction, and efficiency increase. In terms of hinterland economic structure, with the accelerated implementation of China’s strategic economic restructuring and transformation and upgrading, the scale of tertiary industry gradually exceeds that of secondary industry, and the ratio of secondary industry added value gradually decreases. Especially in northern China, the secondary industry was once the dominant industry, and its decreasing proportion has affected the planning and construction of port infrastructure and transformation; the support role for the green construction of ports has gradually decreased or even become negative. Additionally, the tertiary industry in the three major industries in the proportion of increasing, in science and technology and education level driven and oriented gradually increased, not only conducive to the port to absorb foreign advanced science and technology and good management experience, optimize the trade structure. At the same time, it is also conducive to improve the quality of labor, enhancing the port’s technological innovation ability, realizing the transformation of traditional industries with modern science and technology, and enhancing the hard and soft strength of the port. In terms of the level of investment and consumption in the hinterland, during the 2007–2019 period, China’s economy has moved from high-speed development to high-quality development, and the growth rate of total fixed asset investment has also seen a steady decline with the gradual stabilization of economic development The trend is that the support for the green competitiveness of ports is not strong enough. Secondly, the local government’s excessive investment in port infrastructure construction at the early stage of port development. Although China has become the world’s largest port country, excessive investment has led to oversupply and blind expansion of ports, failing to bring into play the port scale effect, thus having a negative effect on the enhancement of port green competitiveness. Total social consumer goods refer to the amount of non-productive and non-operating physical goods sold directly by enterprises to individuals and social groups through transactions, as well as the amount of income obtained from the provision of food and beverage services. The goods transported by port vessels are usually bulk cargo, bulk grain groceries, containers, etc. Most of the goods are not sold directly by enterprises to end consumers, so they cannot be directly counted in the index. When the products produced by local enterprises meet the growing demand, correspondingly, the same type of goods imported and transported by the port will be reduced, thus having a negative effect on the green economic benefits of the port and hindering the improvement of the green competitiveness of the port. In terms of logistics accessibility between the port and the hinterland, waterway transportation, with its advantages of high load capacity, low cost, high efficiency, and environmental friendliness, promotes the green economic benefits of the port to improve the development of ports and hinterlands. The current road transport mode has the defects of high cost and environmental pollution, etc. The larger the road freight turnover, the corresponding increase in the cost and environmental pollution, so it has a certain negative impact on the green development of the port. On the other hand, road freight turnover includes other goods turnover except for port logistics, and there is a lack of road freight turnover records for port trade logistics, so the results obtained have a certain deviation, which has a negative impact on the green competitiveness of ports.
As for the role of the green competitiveness of ports on the hinterland economy, the improvement of green competitiveness of ports has a significant boosting effect on the total economic volume of the hinterland region, and the green development of ports is one of the important factors to promote the high-quality and healthy circular development of the hinterland economy. Waterway transport has a large cargo volume, low transportation cost, and is suitable for large-scale transportation, and these advantages have attracted a large number of developers and investors to the hinterland region, prompting the gathering and flow of capital in the hinterland region. Although road transportation is flexible, fast, and suitable for short- and medium-distance transportation, it also has small capacity, high energy consumption, and high pollutant emission, which is negatively limited to the interior of the port hinterland and combined with the positive advantages and negative defects of road transportation. Its negative effect is greater than the positive effect for the direct economic hinterland of the port, which weakens the economic growth capacity of the direct economic hinterland of the port. In the long run, it is not conducive to the healthy and sustainable development of the regional economy of the hinterland.
In order to achieve sustainable development of the port and the hinterland, in the future, the hinterland region should focus on adjusting the industrial structure, reasonably deploying the proportion of secondary and tertiary industries in the economic development of the hinterland region, and accelerating the formation of an industrial layout supported by high technology. Additionally, the hinterland region should promote the integration of port and hinterland resources, optimize the transport structure between the port and the hinterland, and give full play to the location advantages of the port to achieve healthy and coordinated economic development. In the post-epidemic era, in the face of the normalization of epidemic prevention and control, the government should increase support to help port enterprises cope with the adverse effects of the epidemic faster and more forcefully, namely through tax relief, helping port financing, and reducing the cost of green investment and construction for enterprises. During the epidemic period, under the dual influence of the decline in global trade volume and the upgrading of port capacity, the intensity of regional competition gradually strengthened. As a solid backing for port development, the hinterland should use the existing rich port resources as a basis to vigorously develop and build green and intelligent supply chain bases within the port area to create a more comprehensive node network base, enhance connectivity with ports, and improve core competitiveness. Ports with strong green competitiveness should combine with the industrial structure of the hinterland, business environment, and logistics services to further enhance their hard strength in green development and soft strength in trade services to maintain competitive advantages. The ports with weak competitiveness should take advantage of the economic structure of the hinterland and the financial support of the local government, as well as the cooperation between ports, to improve the sustainable development capacity of the ports. In the state of epidemic prevention and control, the port should accurately grasp the trend of waterway freight demand in the hinterland based on the analysis of changes in throughput during the epidemic period, adjust the cargo structure, and develop timely response routes to ensure that the port’s production capacity can proactively respond to changes in demand. Secondly, the port should improve the construction of the port consolidation and distribution system; do a good job of information interchange and capacity coordination between railroad, highway, waterway, and other modes of consolidation and distribution; and speed up the turnover of goods in port transportation efficiency.

7. Conclusions

In the context of sustainable development, this study first applies the super-SBM model to explore the green competitiveness of the top 10 coastal ports in China and then uses a panel data model to explore the interaction between the green competitiveness of ports and the hinterland economy. This paper bridges the gap of existing studies on the ecological and benign interaction concerns between ports and hinterlands and provides a reference for green port development as well as economic recovery in the post-epidemic era and coordinated development between ports and hinterlands. The conclusions are as follows.
(1) In terms of port green competitiveness evaluation, the green competitiveness of coastal ports has been fluctuating during the study period, and the green development of ports is not stable. The pure technical efficiency of most ports is greater than the scale efficiency of ports, which indicates that port management and technology are the main driving forces to improve the green competitiveness of ports. (2) In the empirical study of the interaction relationship, the green competitiveness of ports and the hinterland economy both promote and constrain each other. Total local output value, local fiscal revenue, the proportion of tertiary industry value added, and waterway transportation between ports and hinterlands have positive effects on the improvement of port green competitiveness, while the proportion of secondary industry value added, hinterland investment and consumption level, and road transportation between ports and hinterlands have negative effects on port green competitiveness. Port green competition and waterway transportation between ports and hinterlands effectively drive the development of the hinterland economy, while road transportation between ports and hinterlands is detrimental to the sustainable development of the hinterland economy. Finally, this paper also verifies that there is a “Matthew effect” in the green development of ports, where ports with stronger green competitiveness have more resources and opportunities and have accumulated advantages, while ports with weaker green competitiveness have insufficient development momentum to surpass ports with stronger green development.
The following deficiencies still exist in this study. In assessing the green competitiveness of ports, only port CO2 emissions are considered due to the difficulty of obtaining data on pollutants, such as NOX, SO2, and solid waste. In the future, based on the consideration of port pollutant emissions, the size of the interaction between hinterland economic factors and port green competitiveness should be further explored to improve the research between green ports and the hinterland economy.

Author Contributions

H.K. and J.Z. conceived the research idea, established the mathematical models, and co-wrote the paper. Z.B. guided the writing process and revised the paper. All authors have read and agreed to the published version of the manuscript.

Funding

The authors gratefully acknowledge support from the National Natural Science Foundation of China (Grant NO. 71831002 and 72174035). However, the authors are solely responsible for all the views and analyses in this paper.

Institutional Review Board Statement

Not applicable.

Informed Consent Statement

Not applicable.

Data Availability Statement

Data available in a publicly accessible repository that does not issue DOIs.

Conflicts of Interest

The authors declare no conflict of interest.

References

  1. Lin, L.; Fen, Y. Spatial Spillover Effects of Ports on Economic Growth of Hinterland Cities. J. Transp. Syst. Eng. Inf. Technol. 2020, 20, 6. [Google Scholar]
  2. Lei, Y.; Huafu, J.; Xianzhong, C. Assessment of coordinated development between port level and urban economy: A case study of 5 cities along the Yangtze River in Anhui Province. World Reg. Stud. 2018, 27, 76–84. [Google Scholar]
  3. Shan, J.; Yu, M.; Lee, C.Y. An Empirical Investigation of the Seaport’s Economic Impact: Evidence from Major Ports in China. Transp. Res. Part E 2014, 69, 41–53. [Google Scholar] [CrossRef]
  4. Lugt, L.; Rodrigues, S.B.; Berg, R. Co-evolution of the Strategic Reorientation of Port Actors: Insights from the Port of Rotter-dam and the Port of Barcelona. J. Transp. Geogr. 2014, 41, 197–209. [Google Scholar] [CrossRef]
  5. Wang, L.; Zhou, Z.X.; Yang, Y.; Wu, J. Green Efficiency Evaluation and Improvement of Chinese Ports: A Cross-efficiency Model. Transp. Res. Part D 2020, 88, 102590. [Google Scholar] [CrossRef]
  6. Honghan, B.; Liangfu, Z.; Yutong, S. Construction of green port evaluation index system. Port Sci. Technol. 2021, 11, 20–23. [Google Scholar]
  7. Asgari, N.; Hassani, A.; Jones, D.; Nguye, H.H. Sustainability Ranking of the UK Major Ports: Methodology and Case Study. Trans-Portation Res. Part E 2015, 78, 19–39. [Google Scholar] [CrossRef] [Green Version]
  8. Yang, Y.; Lei, W. Research on the Spatial Relationship of Chinese Coastal Container Ports. J. Qingdao Univ. (Nat. Sci. Ed.) 2019, 32, 104–110. [Google Scholar]
  9. Wan, C.; Zhang, D.; Yan, X.; Yang, Z. A Novel Model for the Quantitative Evaluation of Green Port Development—A Case Study of Major Ports in China. Transp. Res. Part D 2017, 61, 431–443. [Google Scholar] [CrossRef]
  10. Ye, S.; Jiang, Z.; Qi, X. Spatiotemporal characteristics and influencing factors of container terminals efficiency in the Yangtze River Delta. Geogr. Res. 2020, 39, 1782–1793. [Google Scholar]
  11. Li, S.; Yu, C.; Wang, Z. Environmental Efficiency Measurement and Influence Mechanism Analysis of Ten Major Container Ports in China. Math. Pract. Theory 2018, 48, 88–95. [Google Scholar]
  12. Liu, Y.; Wang, C. Evaluation of Container Port Cluster Efficiency Based on Undesirable Output Network DEA. Syst. Eng. 2018, 36, 121–126. [Google Scholar]
  13. Kaoru, T. A Slacks-based Measure of Super-efficiency in Data Envelopment Analysis. Eur. J. Oper. Res. 2002, 143, 32–41. [Google Scholar]
  14. Ge, Y.; Wang, S. Total Factor Productivity and Influencing Factors Analysis for Ports Considering Carbon Emis-sions. J. Transp. Syst. Eng. Inf. Technol. 2021, 21, 22–29. [Google Scholar]
  15. Appleton, J.H.; Bird, J. The Major Seaports of the United Kingdom. Geogr. J. 1963, 129, 512. [Google Scholar] [CrossRef]
  16. Liu, B.; Cheng, C. Study on Fundamental Theory of Economic Relations of Port and Hinterland. Resour. Dev. Mark. 2013, 29, 1160–1162+1197. [Google Scholar]
  17. Merkel, A.; Holmgren, J. Dredging the Depths of Knowledge: Efficiency Analysis in the Maritime Port Sector. Transp. Policy 2017, 60, 63–74. [Google Scholar] [CrossRef]
  18. Lu, B.; Xing, J.; Wang, Q.; Wang, S. Analysis of cooperation mechanism between port competitiveness and hinterland by panel data. Syst. Eng. Theory Pract. 2019, 39, 1079–1090. [Google Scholar]
  19. Si, Z. Interactive Development of Port Infrastructure and Port City Economy. Bus. Rev. 2015, 27, 33–43. [Google Scholar]
  20. Zhang, L.; Lin, H. The Analysis of a Simulation of a Port–City Green Cooperative Development, Based on System Dynamics: A Case Study of Shanghai Port, China. Sustainability 2019, 11, 5948. [Google Scholar]
  21. Qiao, W.; Guan, W.; Wang, X.; Wang, X. Study on the Dynamics of Port-City Coupling System Based on Green Concept-A Case Study of Lianyungang City. J. Nanjing Norm. Univ. (Nat. Sci. Ed.) 2018, 41, 140–148. [Google Scholar]
  22. Sun, J.; Li, Z.; Li, Y.; Zhang, X. Evolution of Spatio-Temporal Association Model of Port lndustry and Regional Eco-nomic Growth in China. Econ. Geogr. 2018, 38, 120–128. [Google Scholar]
  23. Fan, H.; Ma, M.; Wen, W.; Qu, L. Research on the Relationship between the Synergy Degree of Port-City Sys-tem and Urban Economic Growth. China Soft Sci. 2015, 9, 96–105. [Google Scholar]
  24. Cheung, S.; Yip, T.L. Port City Factors and Port Production: Analysis of Chinese Ports. Transp. J. 2011, 50, 162–175. [Google Scholar] [CrossRef] [Green Version]
  25. Lee, Y.; Song, H.; Jeong, S. Prioritizing Environmental Justice in the Port Hinterland Policy: Case of Busan New Port. Res. Transp. Bus. Manag. 2021, 41, 100672. [Google Scholar] [CrossRef]
  26. Xu, L.; Shi, J.; Chen, J.H. Agency encroachment and information sharing: Cooperation and competition in freight forwarding market. Marit. Policy Manag. 2022, 1–14. [Google Scholar] [CrossRef]
  27. Xu, L.; Xie, F.; Wang, C. Passive or proactive capacity sharing? A perspective of cooperation and competition between two regional ports. Marit. Policy Manag. 2021, 49, 492–509. [Google Scholar] [CrossRef]
  28. Xu, L.; Zou, Z.; Zhou, S. The influence of COVID-19 epidemic on BDI volatility: An evidence from GARCH-MIDAS model. Ocean Coast. Manag. 2022, 229, 106330. [Google Scholar] [CrossRef]
  29. Xiong, Y.; Xu, Z. Research of interactive Relationship between Port Development and Urban Economic Development Based on the Key Port City of Maritime Silk Road. Theory Pract. Financ. Econ. 2017, 38, 128–133. [Google Scholar]
  30. Tan, K.B.; Liu, A.D. Countermeasures and Key Technologies of Port Economic Development under Anti-dumping Policy. J. Coast. Res. 2020, 11, 11–14. [Google Scholar] [CrossRef]
  31. Guo, Z.; Kang, H.; Zhao, W.; Liu, Q. Research on the interactive Relationship Between Port Locistics and Regional Economic Development of Being-Tianjin-Hebei Region Analvsis based on Granger causality test and grey correlation degree. J. Math. Pract. Theory 2020, 50, 32–39. [Google Scholar]
  32. Chen, J.; Zhang, W.; Song, L.; Wang, Y. The coupling effect between economic development and the urban ecological environment in Shanghai port. Sci. Total Environ. 2022, 841, 156734. [Google Scholar] [CrossRef] [PubMed]
  33. Guo, Z.; Fan, H.; Cui, W.; Li, Y. Dynamic Simulation of Green and Low-Carbon Port City System Co-Built by Port and City. Ecol. Econ. 2016, 32, 98–102. [Google Scholar]
  34. Chen, Y.; Lv, Y.; Xie, Y. Study on Sustainable Development of Port-city Coupling System based on System Dynamics: A case study of Qingdao Port. China Storage Transp. 2019, 113–120. [Google Scholar] [CrossRef]
  35. Zhang, L.; Li, N.; Shi, B. The Quantitative Research on the Symbiotic Relationships of Port Economy and Low Carbon Economy in Coastal City: Taking Tangshan as an Example. Ecol. Econ. 2018, 34, 59–63. [Google Scholar]
  36. Wang, J.; Deng, Y. Relationship of Coupling Coordination Between Port Logistics and Direct Hinterland Economy—A Case Study on Nine Seaport-type National Logistics Hubs Like Tianjin Port and Yingkou Port. J. Ind. Technol. Econ. 2020, 39, 62–68. [Google Scholar]
  37. Men, L.; Gan, A.; Chen, K. Under the trend of green ports, the prediction and mitigation strategy of carbon emission in Chinese main ports. Shipp. Manag. 2014, 36, 6–8+11. [Google Scholar]
  38. Meng, F.; Gao, X. Research on Coupling Coordination Degree of Port and Direct Hinterland Economy and lts lnfluencing Factors: A Case Study of Beibu Gulf Rim Port Group. Geogr. Geo-Inf. Sci. 2017, 33, 94–100+127. [Google Scholar]
  39. Xu, W.; Xu, Y. The Evaluation of Comprehensive Competitiveness of Coastal Ports and Spatial Evolution of Sea Port Hinterland in China. Econ. Geogr. 2018, 38, 26–35. [Google Scholar]
  40. Yu, L.; Xu, P.; Shi, J.; Chen, J.; Zhen, H. Driving Mechanism of Port-City Spatial Relation Evolution from an Ecological Perspective: Case Study of Xiamen Port of China. Sustainability 2020, 12, 2857. [Google Scholar] [CrossRef] [Green Version]
  41. Hales, D.; Lam JS, L.; Chang, Y.T. The Balanced Theory of Port Competitiveness. Transp. J. 2016, 55, 168–189. [Google Scholar] [CrossRef]
  42. Haynes, K.E.; Hsing, Y.M.; Stough, R.R. Regional Port Dynamics in the Global Economy: The Case of Kaohsiung, Tai-wan. Marit. Policy Manag. 1997, 24, 93–113. [Google Scholar] [CrossRef]
Figure 1. Interaction mechanism between port green competitiveness and hinterland economy.
Sustainability 15 01364 g001
Figure 2. The green competitiveness value of 10 major coastal ports.
Sustainability 15 01364 g002
Figure 3. The pure technical efficiency value of 10 major coastal ports.
Sustainability 15 01364 g003
Figure 4. The scale efficiency value of 10 major coastal ports.
Sustainability 15 01364 g004
Table 1. Sample selection of coastal ports.
RankingPortThroughput (10,000 TEU)RankingPortThroughput (10,000 TEU)
1Shanghai port43306Xiamen port1112
2Ningbo port27537Dalian port876
3Guangzhou port23228Lianyungang port478
4Qingdao port21019Yingkou port548
5Tianjin port173010Rizhao port459
Table 2. Port green competitiveness evaluation index.
IndicatorsVariableUnit
Input indicatorsLabor inputNumber of employeesperson
Capital inputNumber of berths for productionone
Land inputLength of the production wharfmeter
Desirable output Container throughput10,0000 TEU
Undesirable output CO2ton
Table 3. Economic indicators of the hinterland.
IndicatorsVariablesUnit
The total economic volume of the hinterlandTotal local outputCNY 100 million
Local budget revenueCNY 100 million
The economic structure of the hinterlandThe proportion of the added value of the secondary industry%
The proportion of the added value of the tertiary industry%
The investment and consumption level in the hinterlandTotal investment in fixed assetsCNY 100 million
Total retail sales of consumer goodsCNY 100 million
Logistics accessibility between ports and hinterlandWaterway freight turnoverBillion tons/km
Road freight turnoverBillion tons/km
Table 4. The green competitiveness of 10 major coastal ports.
YearShanghai PortNingbo PortGuangzhou PortQingdao PortTianjin PortXiamen PortYingkou PortDalian PortLianyungang PortRizhao Port
20071.3240.4310.2140.5091.0771.0440.1641.0270.2090.050
20081.1410.6820.5381.2690.5381.1360.3541.0680.5780.115
20091.1390.7710.5761.3340.5931.1001.0201.0980.4980.113
20101.1441.0410.7241.3740.5811.0790.6580.3000.5360.119
20111.0691.0390.7451.3050.5821.0671.0320.3230.6130.141
20121.0240.4430.5801.3440.5561.1370.4630.3160.5310.140
20131.0560.4990.5991.2710.5581.0740.4460.4500.5850.154
20141.1340.4190.5771.3600.5731.0730.3940.3920.4270.171
20151.1460.4280.6681.3620.5751.0590.3830.3550.1460.200
20161.0270.4020.6651.3580.5861.1520.3870.3460.3880.199
20171.1370.4481.0401.1940.6710.7440.4240.3610.4260.206
20181.1380.4420.6531.1970.7120.7270.4080.3520.3980.267
20191.1360.4190.6231.2080.7420.6970.3470.3040.3680.226
Mean1.1240.5740.6311.2370.6421.0070.4980.5150.4390.162
ranking26514387910
Table 5. The pure technical efficiency values of 10 major coastal ports.
YearShanghai PortNingbo PortGuangzhou PortQingdao PortTianjin PortXiamen PortYingkou PortDalian PortLianyungang PortRizhao Port
20071.4690.4740.3061.0221.0831.6561.1191.1781.5931.072
20081.4361.0780.5421.3580.5651.4861.1341.0951.9491.124
20091.3811.0770.5851.3620.6321.3651.4951.0981.5271.054
20101.3771.1180.7361.3770.6221.3561.2950.4251.8211.068
20111.3501.0850.8471.3360.6071.3181.3120.4231.7481.070
20121.3510.5120.6401.3590.5971.4291.1590.4371.6601.026
20131.3041.0120.6801.3270.5941.2771.0690.5341.7821.007
20141.3060.4730.6251.3820.6251.3300.8140.5111.6711.088
20151.3070.4740.7071.4180.6691.5941.0210.5411.6001.118
20161.2150.5111.0521.3900.6581.4760.7610.4831.6521.043
20171.2930.4671.0591.2190.7321.2800.7560.4871.9270.556
20181.2810.4640.7031.2290.7811.3450.8350.4951.2790.767
20191.2840.4410.6551.2490.8241.3560.8730.4921.2540.563
Mean1.3350.7070.7031.3100.6911.4051.0490.6311.6510.966
Ranking37849251016
Table 6. The scale efficiency value of 10 major coastal ports.
YearShanghai PortNingbo PortGuangzhou PortQingdao PortTianjin PortXiamen PortYingkou PortDalian PortLianyungang PortRizhao Port
20070.9020.9090.6980.4980.9950.6300.1460.8720.1310.047
20080.7940.6330.9910.9350.9510.7650.3120.9750.2970.103
20090.8250.7160.9850.9800.9390.8060.6831.0000.3260.107
20100.8300.9310.9830.9980.9340.7960.5090.7060.2950.112
20110.7910.9580.8800.9770.9580.8090.7860.7650.3510.132
20120.7580.8650.9060.9890.9320.7960.4000.7230.3200.136
20130.8100.4930.8800.9580.9400.8410.4170.8420.3280.153
20140.8680.8850.9230.9840.9160.8070.4850.7680.2560.157
20150.8770.9020.9460.9600.8600.6640.3750.6560.0920.179
20160.8450.7860.6330.9770.8910.7800.5080.7160.2350.191
20170.8790.9600.9820.9790.9170.5810.5610.7410.2210.370
20180.8880.9540.9290.9730.9130.5410.4890.7130.3110.348
20190.8850.9510.9510.9670.9000.5140.3970.6180.2940.401
Mean0.8420.8420.8990.9360.9270.7180.4670.7760.2660.187
Ranking45312786910
Table 7. Model variable unit root test results.
VariablesLevel ValuesThe First-Order Difference
LLCADFLLCADF
lnGDP−2.0168 ** (0.0219)21.4387 (0.3717)−7.081 *** (0.0000)48.0740 *** (0.0004)
lnFY−6.2271 *** (0.0000)37.8109 *** (0.0093)
LnI−5.8120 *** (0.0000)38.4575 *** (0.0078)
lnSY−5.3373 *** (0.0000)35.3798 ** (0.0182)
lnTY−4.8932 *** (0.0000)33.3862 **(0.0306)
lnRET−12.7565 *** (0.0000)75.5555 *** (0.0000)
lnRO−12.1219 *** (0.0000)110.197 *** (0.0000)
lnWA6.2838 (1.0000)9.8998 (0.9700)−5.2037 *** (0.0000)57.8854 *** (0.0000)
lnEF−5.9066 *** (0.0000)53.8480 *** (0.0001)
p-values are in parentheses; **, *** represent a rejection of the original hypothesis at 5% and 1% significance levels, respectively.
Table 8. Results of F-tests and Hausman tests.
ModelF-TestsHausman Tests
Statistics95% Horizontal ThresholdStatisticsp-Value
Model I2.444891.84288438.4520850.0000 ***
Model II3.4234141.8380411.1512080.0109 **
**, *** represent a rejection of the original hypothesis at 5% and 1% significance levels, respectively.
Table 9. Panel analysis results of the interaction between port green competitiveness and hinterland economy.
VariablesModel IModel II
ΔLnGDPit−10.514088 *** (105.0299)
lnFYit0.116366 *** (30.23393)
lnSYit−0.123633 *** (−6.737202)
lnTYit0.203923 *** (5.696706)
LnIit−0.036221 *** (−18.00204)
lnRETit−0.145351 *** (−22.17757)
lnROit−0.126557 *** (−36.13834)−0.065472 *** (−47.39686)
ΔlnWAit0.057140 *** (68.02026)0.004404 * (1.936231)
lnEFit−10.334119 *** (99.07716)0.037509 *** (14.11441)
Constant term0.606962 *** (3.675869)0.456422 *** (52.18265)
R-square0.9998150.959764
p-value0.0000000.000000
F-value27252.24212.6921
T-values are in parentheses; *, *** represent a rejection of the original hypothesis at 10% and 1% significance levels, respectively.
Disclaimer/Publisher’s Note: The statements, opinions and data contained in all publications are solely those of the individual author(s) and contributor(s) and not of MDPI and/or the editor(s). MDPI and/or the editor(s) disclaim responsibility for any injury to people or property resulting from any ideas, methods, instructions or products referred to in the content.

