Article

Evaluating the Economic Feasibility of Plant Factory Scenarios That Produce Biomass for Biorefining Processes

Department of Industrial Engineering, Faculty of Engineering, Stellenbosch University, Stellenbosch 7600, South Africa
*
Author to whom correspondence should be addressed.
Sustainability 2023, 15(2), 1324; https://doi.org/10.3390/su15021324
Submission received: 30 November 2022 / Revised: 29 December 2022 / Accepted: 30 December 2022 / Published: 10 January 2023

Abstract

:
The use of a plant factory is typically associated with the cultivation of edible biomass for local markets within the urban environment and leads to economic feasibility being evaluated in this context. This paper explored the use of plant factories to produce biomass and value-added compounds for the biorefining industry to help frame the debate regarding the expansion of plant factory applicability to the greater biorefining value chain. Information regarding plant factory technology, crop selection for biorefining markets, and the industrial integration potential of plant factories was used to evaluate the economic feasibility of theoretical plant factory scenarios. From these scenarios, it was shown that plant factories showed economic feasibility while serving the food market and had significant potential in the biopharmaceutical market when accumulating adequate levels of biopharmaceutical products within the plants grown in the plant factories. These results suggested economic feasibility beyond the food market by selecting appropriate crops, based on plant factory and end-user market demands, and value-added compounds which could be accumulated in economically viable quantities.

1. Introduction

The use of controlled environment agriculture (CEA), with plant factories being technologically complex variants of CEA structures, has shown significant improvements in crop yields, over open-field systems, by controlling environmental conditions to provide optimal growth rates for crops [1]. Together with increased crop growth rates, improved resource use efficiencies were also noticed in terms of water and fertiliser demands within plant factories [2]. Plant factories can also be used to address the mismanagement of land, as the structures do not require fertile land to be productive and can be constructed on marginal lands [3]. Plant factories can also form part of the bioeconomy as they use renewable biological resources to cultivate biomass which can be used to produce bio-based products [4]. Despite these benefits, the use of plant factories has remained limited. The use of a plant factory is typically associated with an expensive indoor cultivation system which requires significant capital investments and energy demands for artificial lighting and environmental control systems [2]. Due to these limitations, plant factories have been used primarily for the cultivation of edible biomass in the urban environment, and it is in this context which the relevance and economic feasibility of plant factories are discussed in the literature [5,6,7,8]. Plant factories that produced edible biomass were used to evaluate the energy efficiency of plant factory structures [5], to discuss the use of land for urban agriculture [6], to design urban agriculture structures [7], and to develop decision support systems for operating urban agriculture systems [8]. The constraint of only considering edible biomass as viable plant factory products ultimately limits the market potential of plant factory projects to that of food production.
The study of biomass cultivation within plant factories already consists of a significant body of knowledge in the literature where various aspects of plant factories are evaluated. This includes research into location selection [6,9,10], technological interventions to improve productivity and resource use efficiencies [11,12,13], energy demands of plant factories [5,14,15], environmental impacts and industrial symbiosis potential [16,17], and economic analyses to evaluate the financial viability of plant factory projects [7,8,18]. As mentioned earlier, various aspects of plant factories can be researched, but it is typically assumed that edible biomass is cultivated within these systems. Examples of this include Zeidler, Schubert, and Vrakking [7] who designed a vertical farm to cultivate lettuce and tomatoes by considering all the relevant constituent elements of the plant factory structure which influenced crop growth and resource use efficiency. Li et al. [8] developed a decision support system to help with the design and operation of urban agriculture structures. Although variations of urban agriculture structures and scenarios were evaluated using the decision support system, all the scenarios were based on producing edible biomass for the surrounding urban environment. Baumont de Oliveira et al. [18] stated that any crop could theoretically be cultivated within a plant factory and that the limiting factor was economic viability, rather than technical feasibility. This sentiment was also reinforced by the fact that the overwhelming majority of indoor cultivation studies have focused on edible leafy green biomass [13].
Despite the abovementioned research, not much has been written regarding the leveraging of crop growth rates and environmental control within plant factories to produce biomass for markets beyond the food market. Additionally, regarding plant factories as isolated systems diminishes its role within its surrounding economic environment. The economic relevance of plant factories can be improved by broadening the market potential of biomass grown in these facilities and by integrating plant factories more efficiently with the surrounding environment to improve overall economic viability. Through this approach, plant factories can contribute towards the sustainability discourse by focusing on changing production patterns and industrial development, respectively.

1.1. Knowledge Gap in Literature

A research opportunity was identified to increase the economic relevance of plant factory facilities beyond that of typical food cultivation. This opportunity was based on the concept of leveraging the crop growth performance, the resource use efficiencies [2], and the enhanced levels of environmental control [13] of plant factories to grow biomass for markets which were able to benefit from these properties. Therefore, the application of plant factories within the biorefining industry was of interest, as this opened the possibility of growing multiple crops with multiple potential value-added compounds for the biorefining markets. In this paper, the biorefining industry referred to any process or market that made use of biomass feedstocks to produce bio-based products. This broad definition was adopted to help identify markets ranging from biofuels to biopharmaceuticals, as an example. Expanding the use of plant factories to the greater biorefining industry required the exploration of new interpretations of the plant factory system boundary, the viability of plant factory crops based on crop growth performance and value-added compound accumulation, and the role of a plant factory in the economy.

1.2. Research Aim and Structure

The aim of this paper is to explore the use of plant factories as a biomass cultivation method within the greater biorefining value chain by evaluating the economic viability of biorefinery products and end-product markets, outside the food industry, that can make use of plant factory infrastructure as a biomass cultivation method. This paper does not aim to develop a novel method for evaluating the economic feasibility of plant factories and, as such, uses previously established methods. Instead, this paper explores the economic feasibility of novel theoretical plant factory scenarios which are not constrained by the economic potential of the food market for the produced products within plant factories.
This paper proposes, motivates, evaluates, and discusses the economic viability of using a plant factory to produce biomass under different theoretical scenarios. The scenarios are defined in terms of the technology being used within the plant factories, the end-user markets, crop selection, value-added compounds being accumulated in the biomass, and the use of industrial integration to lower operating costs. This knowledge is combined with previously developed decision support systems for urban farming [8,10] to model and evaluate the proposed plant factory scenarios in terms of expenses and the maximum revenue potential obtainable from the produced biomass. This paper shows the economic potential of plant factories when cultivating crops which accumulate value-added compounds in sufficient quantities and specifically highlights the potential of the biopharmaceutical industry to take advantage of plant factory infrastructure.
The aim of this paper is addressed by answering the research questions below:
  • What are the main drivers and variables to consider during an economic feasibility evaluation of plant factory projects that produce feedstocks for biorefining processes?
  • What is the economic feasibility for the use of plant factories to produce biomass feedstocks for the biorefining industry?
Section 2 describes the literature review which was conducted to define a plant factory system boundary which was not constrained by end-user market assumptions, and which could be used to accurately define and cost plant factory scenarios. Section 3 presents the overall methodology used to define and evaluate novel plant factory scenarios which produce biomass and value-added compounds for markets beyond the food market. Section 4 provides the economic results of the simulated plant factory scenarios. Section 5 discusses the implications and limitations of the paper, and Section 6 concludes the paper.

2. Literature

In this section, the results of a preliminary literature review of plant factory knowledge are summarised. The related plant factory works are categorised according to the main objectives of the studies, along with the crop selection which was made to fulfil the objectives. This was performed to illustrate the research gap of evaluating plant factories in terms of their viability in markets beyond the food market. The second half of this section shows the literature review which was conducted to establish a comprehensive plant factory system boundary, which could be used to guide the economic feasibility assessments of plant factories without being constrained by market limitations. The system boundary is used in Section 3 of this paper to define and assess novel plant factory scenarios.

2.1. Literature Review of Existing Plant Factory Knowledge

Table 1 shows the different types of the plant factory literature which were consulted in identifying the knowledge gap in crop- selection and data. The economic modelling literature all had different plant factory scenarios and objectives defined for their analyses. This included detailed designs of modular vertical farms [7], uncertainty analysis of case study plant factories [18], the development of decision support systems to help with decision-making when designing new plant factories, and the assessment of plant factories on the supply chain level [9]. Despite the varying scenarios and economic modelling methods, the crop selection remained limited primarily to leafy greens and herbs.
The technology review literature of plant factories showed similar limitations in crop diversity. Evaluating the impact of technology differences between greenhouses and plant factories requires adequate crop data from both versions of CEA structures. This has led to comparison articles of CEA structures using well-known crops, such as lettuce [11,14]. Similarly, it was concluded that research which focused on the impact of technology solutions within plant factories only used well-known plant factory crops to avoid additional complexity and to place the technology impacts in the context of available crop data [5,13,19,20].
Plant factory integration research was concerned with placing the plant factory within the greater economy by highlighting interactions with surrounding industries [21], and by assessing the impact of plant factory industrial symbiosis on economic and environmental levels [16,22]. There was also no specific focus on expanding the crop selection options for plant factories within the cited plant factory integration literature.
Lastly, the plant factory assessment literature assessed plant factories based on environmental, economic, and social impacts through literature reviews and surveys [23]. Specific assessments were also linked to case studies of technology selection [24] and the environmental impact of plant factory operations [25]. The literature review showed that multiple approaches have been used to investigate plant factories, each with their own objectives, and that none of the studies specifically considered an expansion of the crop selection process for economically viable plant factories. The next section shows the literature review which was conducted to develop a plant factory system boundary which has not yet been limited to the food market.

2.2. Literature Review for the Establishment of a Plant Factory System Boundary

This paper used a holistic approach to describing a plant factory system boundary. This was performed through a structured literature review that identified the important constituent elements which had to be considered for the economic feasibility evaluation of plant factories that serviced the biorefining industry. The initial investigation into plant factory projects [11] elucidated the potential for considering a system boundary which extended beyond the physical plant factory. The inputs and outputs of the physical structure were assumed to be part of the broader plant factory system boundary and were considered part of the plant factory supply chain. This paper drew on previous work regarding supply chain development for industries with large uncertainty [26], along with the literature concerned with CEA operations [2,8,11] and biorefining markets [27] to identify the main constituent elements of a plant factory system boundary. Therefore, the main research themes that emerged during the initial literature review included plant factory designs and operations, the alternative market potential that the biorefining industry offered to plant factory projects, and the supply chain considerations when introducing plant factories into the biorefining value chain.
These initial research themes are summarised in Table 2 and were expanded into more detail by using the literature search algorithm in Figure 1.
A structured literature search was used to expand on the key themes identified in Table 2. Each theme was researched in detail by dividing it into key terms. The Scopus database was used primarily, and all searches were performed using article title, abstract, and keywords to search for the desired terms. Document and access type were set to ‘All’, and published was set from ‘All years’ to ‘Present’. The search algorithm is illustrated in Figure 1, and the expanded key themes are summarised in Tables S1–S3 in the Supplementary Material document. The literature which was consulted was not limited to plant factory studies, but correlations were found between the reported literature and the broader interpretation of plant factory system boundaries in this paper.
The expanded key themes in Tables S1–S3 were used to develop the plant factory system boundary shown in Figure 2.
The drivers and variables which were identified in the literature review were consolidated and are represented as a conceptual model in Figure 2 to correlate these considerations to capital expenditure (CAPEX), operating expenditure (OPEX), and revenue indexes. Figure 2 provides a framework for the economic assessment of plant factories at an industry level by highlighting considerations related to infrastructure design and operations, the expansion of plant factory revenue streams by considering alternative biomass markets, and by considering a plant factory as an open-loop system with interactions between the system and the surrounding environment. This conceptual model was used to define and describe novel plant factory scenarios to be evaluated for economic feasibility.

3. Methodology

This section presents the steps which were taken to define, describe, and evaluate novel plant factory scenarios which produced biomass and value-added compounds for the biorefining industry. Firstly, the conceptual model in Figure 2 was used to identify the main components of a plant factory scenario which had to be defined. These components included plant factory structural designs, equipment selection, market selection, crop identification for biorefining markets, value-added compound identification and pairing with appropriate host plants, and the identification of plant factory industrial symbiosis opportunities.
Secondly, the theoretical plant factory scenarios of interest were defined and motivated for their inclusion into the exploration of the use of plant factories beyond the food market. Lastly, the selected economic modelling method, data acquisition, and data processing steps were explained to provide insight into how the plant factory scenarios were evaluated for economic feasibility.

3.1. Plant Factory Scenario Descriptions

A range of plant factory scenarios were proposed to be evaluated in terms of economic feasibility. Each scenario cultivated different crops and accumulated different value-added compounds for various markets within the biorefining industry. A plant factory with a constant 1000 m2 footprint and floor-to-roof height of 4 m was assumed throughout all the scenarios. This resulted in a footprint and total growing area which was equivalent to other plant factory studies found in the literature [7,18]. The space breakdown within the plant factory also remained constant throughout all scenarios, as shown in Table 3, and resulted in a constant growing area of 600 m2. An effective 60% growing area footprint was the most important footprint characteristic, as plant factories are unable to use the total footprint of the facility for cultivation [18,53]. The remaining footprint components were based on specifications and assumptions from the literature. The dimensions of the plant factory were kept constant for the scenarios so that the main variations between plant factory scenarios would be the selected crop, value-added compound, and variations in plant factory equipment needed to accommodate the crop cultivation.
Table 4 summarises the plant factory scenarios which were investigated. Most scenarios made use of vertically stacked horizontal grow racks which made up the entire 600 m2 growing area footprint. All scenarios used artificial light-emitting diode (LED) lighting with no solar irradiation and used a hydroponic system to supply water and nutrients.
The scenarios described above had variations in crop selection, value-added compound accumulation, end-user markets, and plant factory configurations. The motivations for selecting the abovementioned scenarios are discussed below.

3.1.1. Crop Selection

Tomato was included in the tomato—food (TF) scenario for its presence in the plant factory literature [7,55], but it was selected primarily for the tomato—miraculin (TM) scenario, where transgenic dwarf tomatoes were successfully cultivated in plant factory chambers and accumulated significant amounts of the taste modifier called miraculin [56,57]. The TM scenario represented a novel use of plant factory cultivation to produce a value-added compound for the biopharmaceutical industry. Lettuce was chosen as a plant factory crop in the lettuce—food (LF), lettuce—miraculin (LM), and lettuce—renewable—integrated (LRI) scenarios as it is considered a viable baseline crop selection for plant factories. The successful cultivation of lettuce in plant factories is also reflected in the fact that it is commonly chosen as a research crop to investigate plant factory operations and productivity [13,14,24,58]. Lettuce-based scenarios were used as benchmark scenarios to confirm that the developed economic model was defined appropriately to show the economic viability of plant factories that produced leafy greens, as has been shown in the literature [7,8]. Tobacco was the selected crop for the tobacco—conventional (TC), tobacco—PHB (TPHB), tobacco—transgenic (TT), and tobacco—transgenic—dwarf (TTD) scenarios. Tobacco was chosen for its multiple revenue streams which included its baseline producer price value, its potential to accumulate anti-malarial artemisinin [51,59], polyhydroxybutyrate (PHB) [60], and plant-made pharmaceuticals, such as hepatitis B virus (HBV) antibodies [61,62]. Tobacco can also be used as a feedstock to produce bio-based products which include biomethane and biodiesel [63,64,65]. This meant that tobacco was a promising multipurpose crop and was used to explore the production of products for the biorefining industry. Cannabis was added for its well-known cultivation within a plant factory setting [66] and for its application in the biopharmaceutical industry [67]. The crop selections yielded crops which were suitable for the food market, biopharmaceutical market, biofuel market, and biopolymer market and allowed for the economic feasibility assessment to consider the appropriateness of plant factories for all these markets.

3.1.2. Market and Product Selection

As mentioned earlier, the food market was included as the baseline biomass market as it is currently the most widely adopted market for plant factories and makes up a significant part of the available plant factory literature [9,68]. The inclusion of the food market also allows for the exploration of the economic feasibility of hydroponically cultivated food which is typically sold at a premium price for its freshness and lack of pesticides used during cultivation.
The biopharmaceutical market was included due to the revenue potential of accumulating high-value products in transgenic plants and the fact that the cultivation of the host plants benefit from the enhanced environmental control and insulation of plant factory systems [30,43]. Additionally, the large-scale production costs of transgenic plant cultivation and molecular farming is lower when compared to microbial fermentation systems and mammalian cell cultures [69]. Despite this, it still remains difficult to obtain specific production cost data of plant-made pharmaceuticals [70] and direct production cost comparisons across different platforms. This is partly attributed to the variations in techno-economic analyses used in the molecular farming literature [71]. Therefore, artemisinin and HBV antibodies were selected as biopharmaceutical products for their accumulation levels in host plants [59,62] and market value [51,72,73]. Miraculin was included for similar reasons [57,74], and represented recombinant proteins, instead of the typically investigated drug and vaccine products [56]. Miraculin has also been accumulated in host plants that are viable candidates for plant factory cultivation [74,75].
Lastly, bio-based products were included as alternatives to fossil-fuel products. The biopolymer PHB was selected for its accumulation levels in host plants that were suitable for plant factory cultivation [60] and it serves as an alternative product to polypropylene [76]. Additionally, biomass conversion into energy was considered in terms of biodiesel and biomethane production [65,77,78].

3.1.3. Technology and Integration Selection

The LRI scenario was selected to evaluate the economic impact of using renewable energy technology and integrating a plant factory with a surrounding industry. The importance of plant factory technology selection and industrial symbiosis from Figure 2 was represented in the LRI scenario. The energy cost of plant factories has been known to account for up to 30% of total operating costs [5] and one way of supplementing the energy demands, without requiring additional space, is through the use of photovoltaic (PV) panels being integrated onto the plant factory façade [5,79]. The LRI scenario will investigate to what extent the use of PV panels on the plant factory façade can supplement the high energy demands of the structure. Additionally, waste valorisation through industry integration was evaluated in the LRI scenario by considering the use of brewers’ spent grains as growing substrate supplements [16,21,80]. The influence of the integration was evaluated in terms of potential cost reductions in growing media expenses in the LRI scenario.

3.2. Economic Modelling of Plant Factory Scenarios

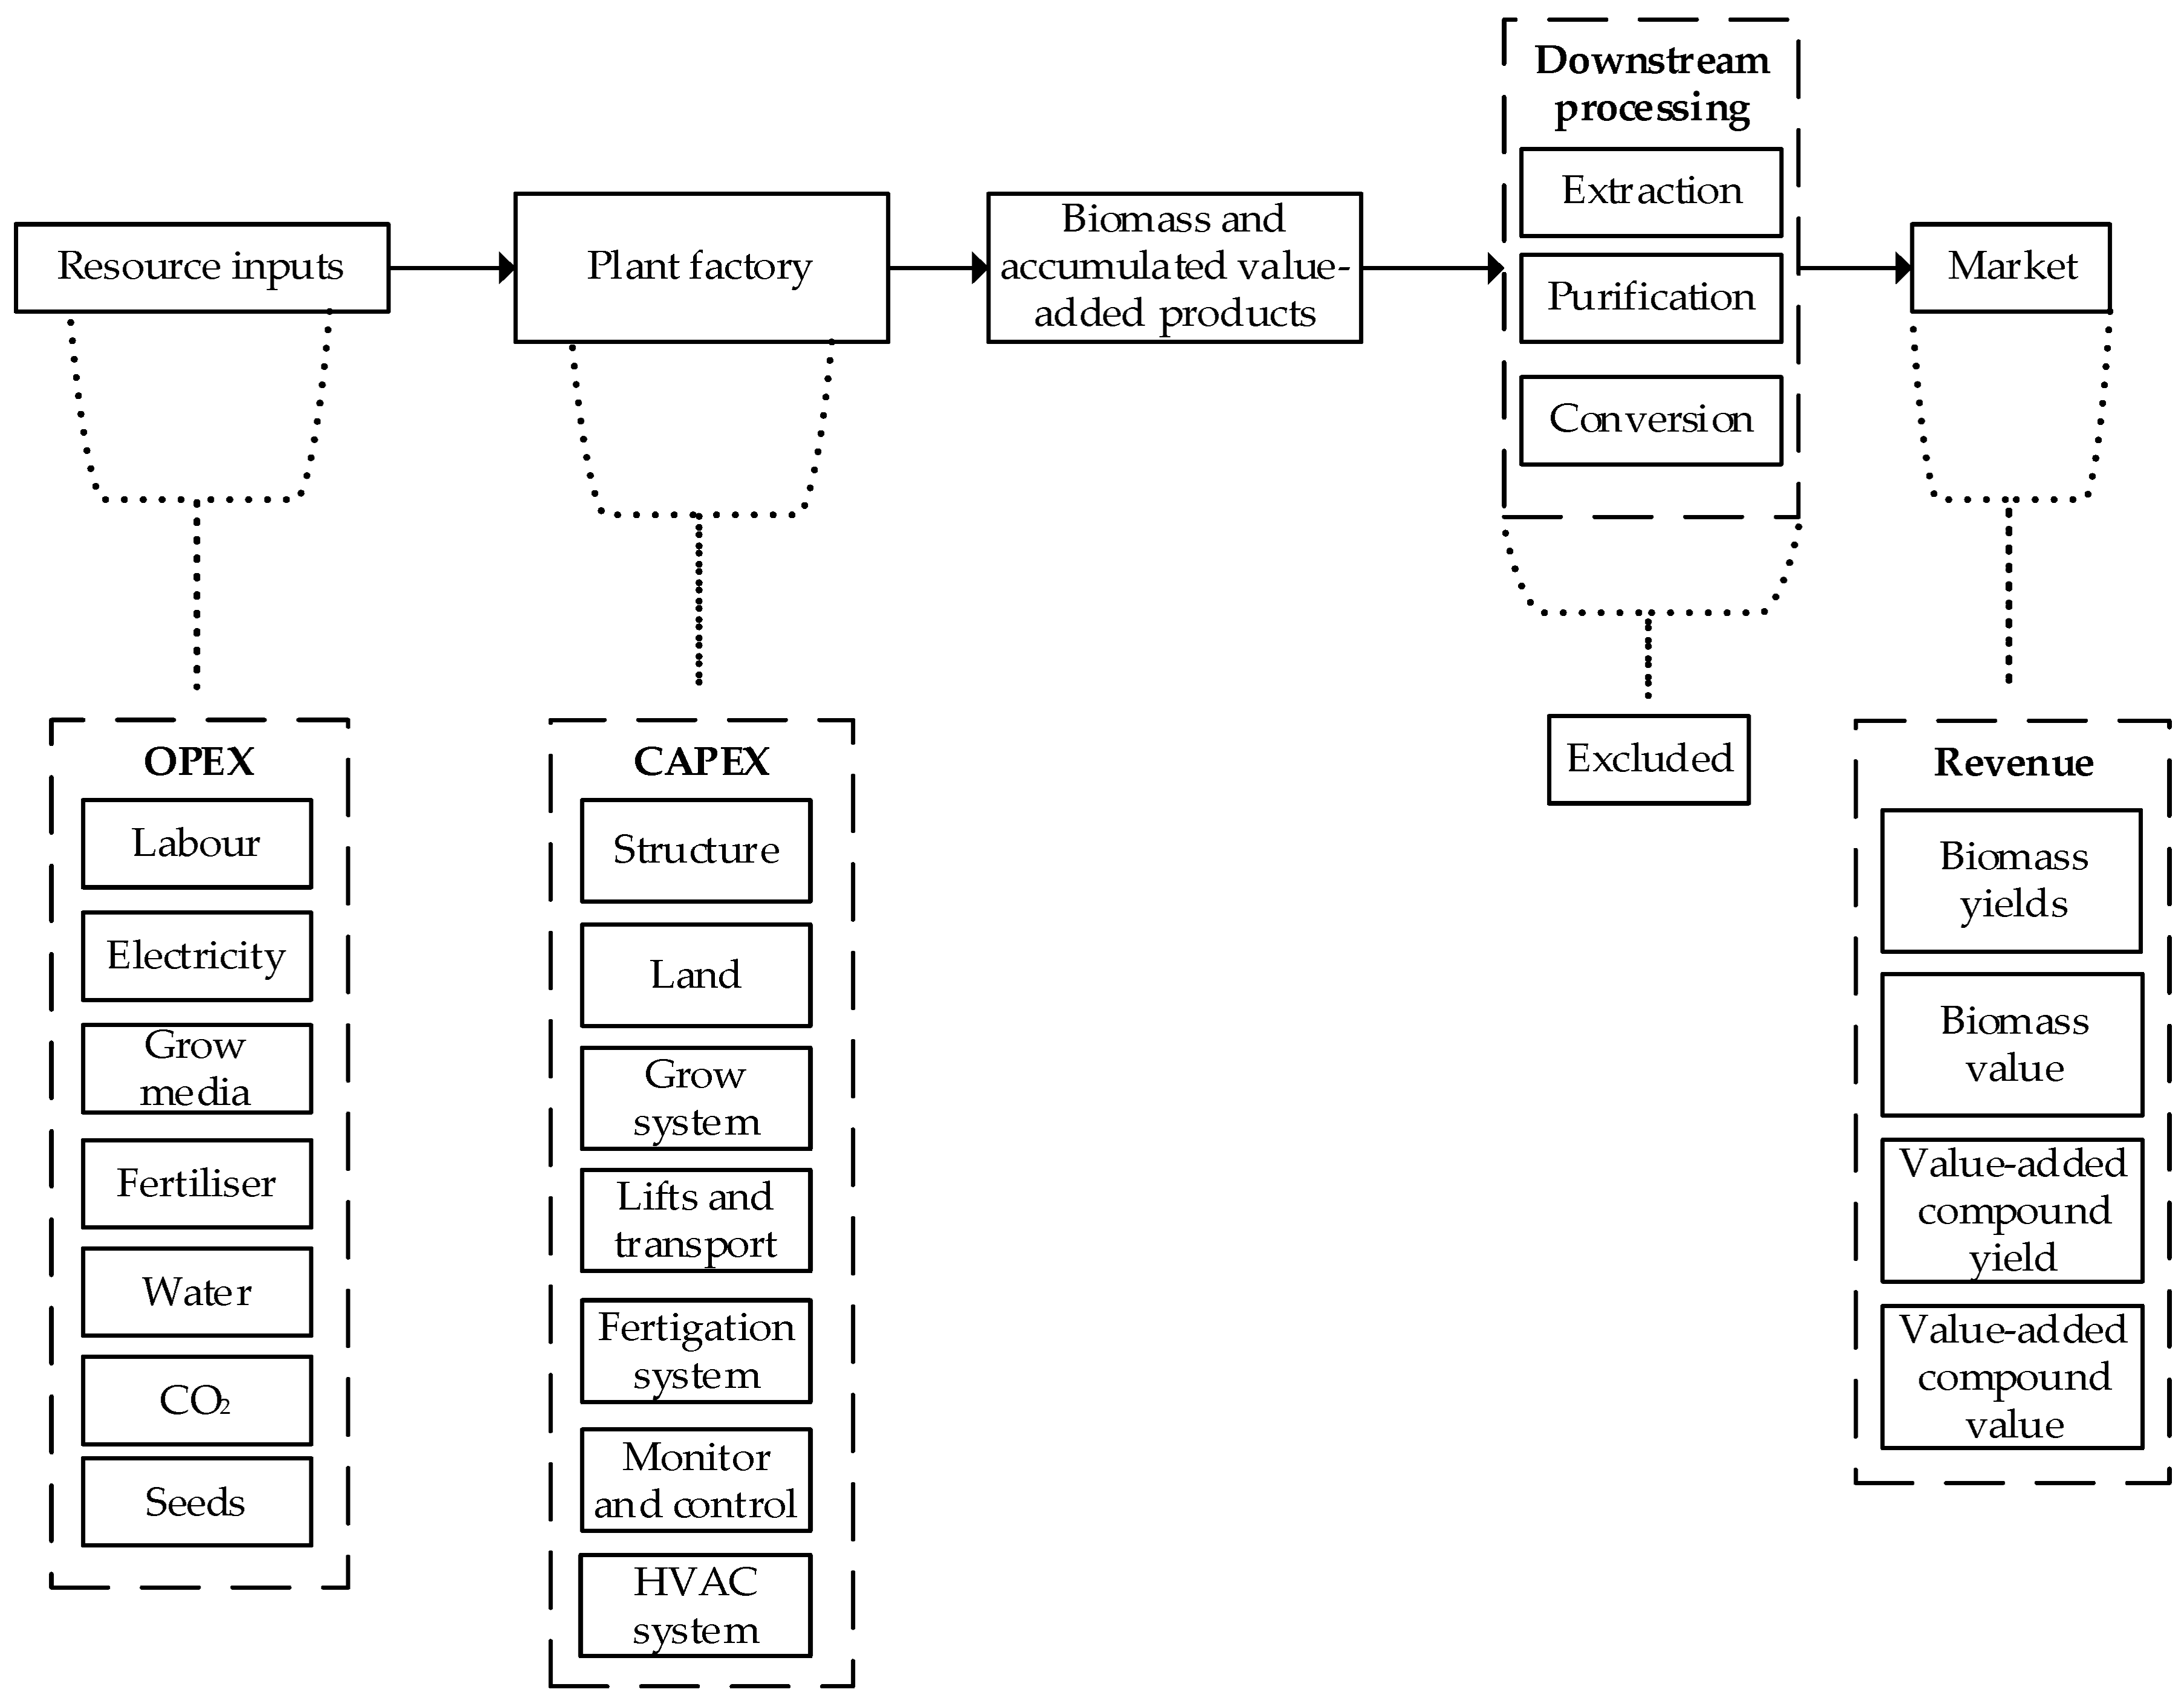
The plant factory literature which considered economic feasibility used different approaches, but all had to define, scale, and cost the plant factory scenarios of interest to comment on the economic feasibility of the case studies. Zeidler, Schubert, and Vrakking [7] provided a detailed design of a modular vertical farming structure for the cultivation of leafy greens and tomatoes; Baumont de Oliveira et al. [18] used two well-defined plant factory case studies to investigate economic risks, while Thomson et al. [22] had to define and size a theoretical plant factory to comment on the economic benefit of integrating the structure with an on-site composting system. Based on this literature, it was decided to provide detailed costing information for the constituent elements of the plant factories. The system boundary of the economic analysis is shown in Figure 3.
Figure 2 was used, along with the plant factory literature, to provide the refined plant factory system boundary which showed the constituent elements of a plant factory which were included and excluded from further economic feasibility analyses [18]. The system boundary also indicated the exclusion of the variable downstream processing and extraction costs, to obtain the desired products, in each of the scenarios. Downstream processing steps were excluded from the system boundary for the sake of simplicity. This paper did not consider variations in extraction-, purification-, and conversion processes to obtain the desired products. Instead, the revenue potential of cultivated biomass and value-added compounds was calculated based on accumulation levels within the host plants, prior to any extraction processes. The methods used to quantify and process the CAPEX, OPEX, and revenue values in Figure 3 are discussed in Section 3.2.1 and Section 3.2.2.
This paper had to define plant factory scenarios using the best-available data and assumptions. A full list of assumptions for the economic analyses is tabulated in Tables S4 and S5. Therefore, uncertainty analysis was used during the economic feasibility analysis of the investigated plant factory scenarios. Table 5 shows the literature which was consulted for the selection of Monte Carlo simulations.
Monte Carlo simulations have found use in the CEA literature [29,83] and in biorefining studies [65,81,82,84]. Therefore, it seemed appropriate to use Monte Carlo sensitivity analysis in this paper which combined the research themes of plant factories and the biorefining industry. Baumont de Oliveira et al. [18] preferred the use of probability bound analysis to avoid making the necessary assumptions regarding the distribution shapes of input variables. This paper used a significant amount of the literature to populate plant factory input variables, and it was deemed acceptable to make the necessary assumptions to allow for Monte Carlo simulations to be used.

3.2.1. Data Acquisition

Data acquisition for the plant factory economic model was guided by the system boundary in Figure 3. In all instances, the literature was consulted to populate the economic model variables. The data were classified as (i) plant factory data, (ii) crop data, and (iii) biorefining market data. Plant factory data included structure costs, equipment specifications, and running costs, as summarised in the Supplementary Materials. Tables S6–S9 provides the literature values which were used to calculate the CAPEX values of plant factory scenarios. This includes plant factory footprint costs, grow rack costs, fertigation, and monitor and control infrastructure. Tables S10–S16 provides the OPEX values for the plant factory scenarios, as calculated using the literature values. This includes salary (fixed cost) values, LED lighting demand, electricity pricing, heating, ventilation and air conditioning (HVAC) demands, water, fertiliser, grow media, seeds, and CO2 augmentation amounts. Tables S17 and S18 provide summarised plant factory dimensions and value-added compound pricing data, respectively.
Crop data consisted of optimal environmental conditions for crop cultivation, resource requirements, planting densities and biomass yields. The crop data literature, which was used to populate the economic model for each of the scenarios, is shown in Table 6 and in Tables S19–S22.
Lastly, the biorefining market data included biomass selling prices, value-added compound accumulation levels which were achievable in biomass, and value-added compound selling prices for revenue calculations. Tables S19–S22 summarise the plant factory yields and market values, based on reported values in the literature.

3.2.2. Data Processing

The CAPEX, OPEX, crop data, and market data which were acquired in Section 3.2.1 were tabulated in Excel spreadsheets. The raw data were processed into economic indexes for the plant factory scenarios by using the list of simulation model equations below [18].

Capital Expenditure (CAPEX) Calculations

The CAPEX value was divided into construction and equipment costs in Equation (1) to represent the costs of building a plant factory structure and furnishing it with the required equipment, respectively.
CAPEX = Construction cost + Equipment cost
The construction cost and equipment cost were expanded into more detailed calculations using Equations (S1)–(S3) in the Supplementary Materials.

Operating Expenditure (OPEX) Calculations

The OPEX costs consisted of fixed and variable costs, as shown in Equation (2). The fixed cost represents the yearly salary costs for indirect labour positions. Table S10 shows the fixed positions considered for the plant factory scenarios and the hourly salary wages assumed.
OPEX = Fixed cost + Variable (COGS) cost
The variable cost was expanded and calculated using the literature data and Equations (S4)–(S20) in the Supplementary Materials.

Economic Feasibility Calculations

Revenue calculations were based on the amount of saleable biomass being cultivated within the plant factory, the amounts of value-added compounds or potential biorefining feedstocks accumulated in the biomass, and the market value of the biomass, value-added compounds, and alternative biorefining products. The return on investment (ROI) was calculated using Equation (3) and calculated revenue, OPEX, depreciation, and CAPEX values. The payback period, inverse of ROI, was also calculated with Equation (4) to show how long it would take to recover the investment [8]. The tax and loan components were omitted from further consideration for simplicity.
ROI = (Revenue − OPEX − Depreciation − Tax − Loan)/CAPEX × 100
Payback period = CAPEX/(Revenue − OPEX − Depreciation − Tax − Loan)
The cost of cultivation was also calculated using Equation (5) to comment on the required market price of plant factory products to maintain a certain level of profitability.
Cost of cultivation = (OPEX + Depreciation)/(Saleable product produced)
This allowed for a yearly cultivation cost to be calculated for the plant factory and allowed the cost to be correlated to the yield of the plant factory product being produced with the cultivation cost. The economic model did not consider the downstream processing costs associated with the extraction, purification, and processing of the produced biomass to obtain the accumulated value-added products or to transform the biomass into bio-based products. The model only considered the cost of cultivating the specified host plant, feedstock, or edible biomass in a plant factory, and calculated the potential revenue based on accumulation levels and biomass yields reported in the literature. Capital for uncertainty was calculated for each of the plant factory scenarios using Equation (6).
Capital for uncertainty = Revenue − Cost of cultivation
This calculated the difference between revenue potential and the cost of cultivation. Capital for uncertainty was an indication of potential profits for each of the scenarios and showed the capital buffer available to absorb intermediate and downstream processing costs which were not included in the model.
The economic indexes were based on published biomass yields and value-added compound accumulation levels found in the specific crop literature. Monte Carlo simulations were performed using the acquired plant factory-, crop-, and market data. The referenced equations were used with input data as triangular distribution functions with the specified minimum, mean, and maximum values which were obtained in the literature. The Monte Carlo simulations were performed using the populated Excel spreadsheets and by using @Risk 8.2, which added Monte Carlo sensitivity analysis capabilities to Excel. The value ranges of the plant factory model input data reflected the uncertainty associated with the data. The economic model was simulated using 10,000 iterations for each of the plant factory scenarios to generate the economic indexes, which are reported in Section 4 of this paper.

4. Results

The plant factory scenarios were grouped together according to the biomass being produced within each scenario. The results were structured to show the cultivation conditions, and the CAPEX, OPEX, and revenue results of the theoretical plant factory scenarios which were being evaluated for economic feasibility. This allowed for the economic indexes of different scenarios to be compared directly to illustrate the effect of crop and product selection on the economic feasibility of the plant factory scenarios. Results included structural and equipment costs of the plant factories, cultivation conditions for each of the investigated crops, and breakdowns of the running costs and the overall economic potential of each scenario. Results were provided as value ranges with 95% probability. The differences in ROI, payback period, cost of cultivation, and capital for uncertainty were discussed in more detail to provide additional clarity to the calculated results. The plant factory descriptions for each of the scenarios are shown in Table S17.

4.1. Plant Factory Scenario Cultivation Conditions

The cultivation conditions for the tomato-based plant factory scenarios are summarised in Table 6. The growing area for the tomato high-wire system in tomato—food (TF) was based on the specified growing area footprint of the 1000 m2 plant factory. Based on the specified high-wire rows and dimensions in Table S17, the vertical growing area of the TF scenario was estimated as 1020 m2, while the five levels of vertically stacked horizontal growing trays in tomato—miraculin (TM) resulted in a total growing area of 2720 m2. The planting densities [7,56,85], fresh weight per plant [7,86], photosynthetic photon flux density (PPFD) [5,56], cultivation temperature [55], desired CO2 level, photoperiod [5], and cultivation days [57] were based on reported values in the literature. The economic feasibility of TF was evaluated for cultivating edible tomatoes within a high-wire plant factory facility, and all revenue potential was based on the market value of the edible tomatoes being produced. The TM scenario was evaluated for using transgenic dwarf tomatoes as a host system to accumulate miraculin [74]. The dwarf tomato plants allowed for high density cultivation in a vertical farming grow room, and the revenue potential was linked to the accumulation levels and market value of miraculin.
The lettuce-based scenarios operated under the same conditions with lettuce—food (LF) producing edible lettuce and lettuce—miraculin (LM) producing similar lettuce which accumulated miraculin. Lettuce—renewable—integration (LRI) also produced edible lettuce but used PV panels and brewers’ spent grains to lower electricity demand from the grid [79] and use valorised waste material as grow media [8,16], respectively. The planting density, biomass yields [7,87], PPFD, temperature, CO2 levels, photoperiod, and cultivation time [5,68,88] resulted in lettuce plants that were of sufficient size to be cultivated in a five level vertical farming plant factory module with a fixed floor-to-roof height.
Tobacco plant heights of less than 100 cm were used for all the tobacco-based scenarios while calculating annual biomass yields [62,64]. As a result, it was assumed that five levels of vertical growing area were viable within the confines of the 4 m high structure and resulted in a total growing area of 2720 m2 for all the tobacco scenarios. The tobacco—conventional (TC) scenario was investigated for selling tobacco at producer prices, being used as biodiesel and biomethane feedstocks, and for accumulating the anti-malarial drug, artemisinin. The economic feasibility of tobacco—PHB (TPHB) was evaluated by considering the revenue potential of the annual PHB polymer accumulation within transgenic tobacco plants. The tobacco—transgenic (TT) and tobacco—transgenic—dwarf (TTD) scenarios both accumulated HBV antibodies and were compared to investigate the influence which genetic modification had on the profitability of plant factories. In this case, TT and TTD produced similar amounts of biopharmaceutical products per unit of biomass [62] but the dwarf tobacco plants in TTD resulted in more biomass being produced in a similar plant factory space. The PPFD, average temperature [89], CO2 levels [90], and photoperiod [89,91] remained constant for all the tobacco scenarios. The planting density and cultivation period of TC was approximated using open-field data for larger plants [77,92], and the planting densities for TPHB, TT, and TTD were assumed to be similar to lettuce planting densities, as the tobacco plants were sufficiently small to fit into vertical farming infrastructure [60,62]. Cultivation period data for TPHB, TT, and TTD was obtained from the same literature as the planting densities to improve the accuracy of estimate annual biomass yields.
The growing area of 1632 m2 for CC was less than the five level growing areas of 2720 m2 in tomato, lettuce, and tobacco scenarios. The cannabis-based scenario used a plant factory with three levels, instead of five. This was decided as the typical indoor cannabis plant height was 100–140 cm [93] and would not fit into five levels of grow trays with a 4 m plant factory room height. The planting density, artificial lighting, average temperature, CO2 levels, photoperiod, and cultivation period data were obtained from the literature which considered cannabis cultivation under plant factory conditions [5,66]. Although industrial hemp has shown to be a promising multipurpose crop [94], it was omitted due to a lack of large-scale cultivation data within plant factories and the marginal revenue potential of the multiple revenue stream approach in scenario TC. Instead, the economic potential of CC was determined by selling cannabis based on medicinal and recreational market uses [66,93].

4.2. Plant Factory Scenario CAPEX Results

The CAPEX results, for all the plant factory scenarios which were evaluated using the economic model in this paper, are shown in Table 7 and Table 8. The structure cost did not change between the two tomato-based scenarios, TF and TM, but the cost differences between a high-wire system and vertical growing rack system were illustrated in the equipment costs. The plant factory module cost in TF was significantly less than the TM module. This was attributed to the fact that the TF high-wire CAPEX cost was estimated as a single level grow system while TM was costed as five levels of grow racks, which also gave it a significantly larger growing area in Table 6. The lower monitor and control system costs were also attributed to the differences in total growing area between the high-wire and vertical farming scenarios. The TF scenario required less equipment to maintain an adequate sensor density within the growing space. The lift and transport, fertigation system, and HVAC system costs were assumed to be similar between scenarios, as they were not the primary cost drivers of the CAPEX calculations and simplified further calculations.
The CAPEX of LF, LM, and LRI are shown with LF and LM sharing the same CAPEX values. The total CAPEX value of LRI increased from R27,659,880 to R30,709,880, and was attributed to the rooftop installation of PV panels onto the plant factory. The costs were added to the plant factory module cost component. The PV system cost breakdown is shown in Table 7 with a depreciation lifespan of 25 years [95]. Additional battery storage was not added to the system, as it was assumed that the electricity being generated from the system would be used on a continual basis and would not be stored.
Based on the provider details, the PV system could generate 37,538 kWh of electricity per month, or 450,456 kWh per year [95]. The impact which this system had on the COGS for the LRI scenario was discussed later in terms of energy cost savings.
The total CAPEX costs for the tobacco-based plant factory scenarios did not vary as the growing space and environmental conditions in Table 6 remained constant. The total CAPEX cost for the tobacco scenarios turned out to be the same as TM. The equipment costs were kept constant, as all the tobacco scenarios made use of five layers of vertical farming grow area. As a result, the plant factory module was the largest cost.
The CAPEX costs of R19,522,622 for scenario CC was significantly lower than the CAPEX of R27,659,880 for the tomato (excluding high-wire TF), lettuce, and tobacco scenarios. The lower CAPEX of CC was attributed to the reduction in vertical growing racks from five levels to three levels. This resulted in a lower plant factory grow module cost, and in a reduction in the monitor and control system cost. The smaller growing area of CC also required fewer monitor and control sensors to control the environmental parameters.

4.3. Plant Factory Scenario OPEX Results

The OPEX results for TF and TM remained a function of fixed costs and variable (COGS) costs. The calculated range of OPEX costs for TF and TM are tabulated in Table 9. The electricity costs made up significant portions of the total OPEX and were consistent with the literature which investigated plant factories with artificial lighting [5,7]. The individual components which made up the variable costs for TF resulted in a COGS range of R3,026,155–R4,033,157. The sensitivity analysis of the COGS value is shown in Figure S1, and shows that the COGS was most sensitive to electricity tariff changes, HVAC energy demand, and fertiliser requirements.
The COGS for TM, had a price range of R7,649,327–R9,904,036 and was more than double that of the TF. The high-density biomass cultivation of the vertical farming structure in TM led to planting density, fertiliser requirements, and seeds costs having a large effect on COGS, when compared to their influence on COGS for high-wire TF. This was also reflected in the sensitivity analysis shown in Figure S2.
The calculated OPEX for the lettuce-based scenarios are shown in Table 10 and Figure S3. The annual grid electricity cost for LRI was reduced from R3,969,748–R5,569,269 to R3,509,923–R4,955,137 by installing the PV system which is described in Table 7. This resulted in an annual electricity cost reduction of ~10%. Assuming brewers’ spent grains were able to fully replace inert rockwool as a grow media, the annual grow media cost was reduced by almost 90% from R522,790–R1,064,527 to R71,693–R136,903. Calculations were based on replacing rockwool with volume-equivalent brewers’ spent grains [16]. Table 10 also shows that the PV system and brewers’ spent grains both lowered the total COGS values for LRI, and that the lowest annual COGS range of R4,990,546–R6,499,481 was achieved by implementing both strategies.
The annual OPEX values for the tobacco-based plant factory scenarios are shown in Table 11, with the differences in COGS values for each of the tobacco scenarios illustrated in Figure S4. Most of the OPEX values remained constant throughout the tobacco scenarios, similar to the CAPEX results. Variability was only detected with the grow media and seed costs. This was attributed to the fact that each of the tobacco scenarios had varying planting densities and cultivation periods. This resulted in different amounts of tobacco plants being cultivated annually in each scenario, and the grow media and seed purchases had to correspond to the number of plants being cultivated each year.
As mentioned above, the variability in COGS results was also attributed to the different plant densities and cultivation periods of Table 6. The annual COGS values, at 95% probability, were R5,816,197–R7,840,108 for TC, R6,393,465–R8,434,953 for TPHB, R6,435,846–R8,488,624 for TT, and R6,692,149–R8,737,868 for TTD. The elevated COGS value for TTD was expected, as the planting density was the highest of the tobacco scenarios and the cultivation period was the shortest. This resulted in the largest number tobacco plants being cultivated in the TTD scenario, even though the low fresh weight per plant in Table 6 meant that TTD did not produce the most amount of biomass. The electricity cost and fertiliser requirements remained the two main cost drivers, and are shown in Figures S5–S8.
The OPEX breakdown for CC is shown in Table 12. The seed cost, R7,572,613–R18,710,626, made up the majority of the R14,152,192–R25,731,525 COGS. This was the only scenario which had seed cost as the main OPEX driver, and it pointed to the high retail value of cannabis plants [96].
The value of the cannabis plant was also reflected in the sensitivity analysis of COGS in Figure S9. The main cost drivers were planting density and seed cost, with electricity tariff rates being third.
The planting density directly influenced the total cost of all the consumables required for optimal cultivation and had a cumulative effect on the COGS. Variations in planting density were also more impactful than cultivation period. This was attributed to the long cultivation period of 70–80 days [5,66] which meant that small variations in cultivation period did not have a significant impact on the biomass throughput of the plant factory.

4.4. Plant Factory Scenario Revenue Results

This section provides the calculated economic indexes for all the plant factory scenarios which were evaluated for economic feasibility. The market values of the produced biomass and value-added products, along with the calculated yields for each of the plant factory scenarios, are summarised in Tables S19–S22 in the Supplementary Materials. The tabulated values were used, along with Equations (3)–(6) to populate Table 13, which summarises the economic indexes for all the investigated scenarios.

4.4.1. Tomato-Based Plant Factory Revenue Results

The economic indexes for TF and TM are summarised in Table 13, as calculated using the market values and biomass yields in Table S19. For TF, the revenue obtained when selling tomatoes at the typical producer price was significantly lower than the annual cost of cultivation. This resulted in a negative average ROI of −36% and resulted in omission from further consideration. After considering the hydroponic tomato retail value of R27.00–82.00/kg, the annual revenue potential of TF went up from R1,010,876–R1,635,218 to R4,195,270–R10,599,920 and suggested improved economic viability by providing tomatoes directly to consumers, instead of accepting producer price rates. The ROI values of TF in Figure 4 shows the potential of making an annual loss, even when using hydroponic prices. Despite this, there was a 78% probability of making a profit and a 25% probability of making a ROI of 20% or greater.
The sensitivity analysis, Figure 5, for TF shows that tomato prices, fresh weight yield, cultivation period, and electricity tariff changes had the most significant impact on ROI values [97]. The fresh weight yield and cultivation periods can be managed to some extent by controlling the environmental conditions within the plant factory, but the fresh weight value is dependent on market conditions. The sensitivity analysis showed that the production of high-value and high-yield products within the plant factory was more influential on profitability, compared to the electricity costs.
The annual capital for uncertainty, −R1,624,654–R4,871,751, in Table 13, represents the potential profits of the TF scenario and the capital available to absorb costs which were omitted from the system boundary of the economic model. For TF, these uncertainties included harvest losses, packaging costs, storage, transportation, and market demands at the specified hydroponic prices.
The profitability of TM was evaluated using two price estimates for the miraculin, in Table S19, that accumulated in transgenic tomatoes. Miraculin is not readily available in its pure extracted form and so its value was estimated by considering the market price of miracle berries, which naturally contain miraculin, and the miraculin accumulation levels in the miracle berries [57,98]. This resulted in a miraculin price range of R59 million–89 million/kg. Upon further investigation, it was found that recombinant miraculin proteins were expressed in Escherichia coli (E. coli) host systems and were sold for R125–215/µg [99,100]. The estimated price in this paper equated to R0.059–0.089/µg and was used in further calculations, as it was below the market price of lab-purity miraculin.
Alternatively, miraculin was considered as a substitute for sucrose and would need to be economically competitive to replace common sugar. Therefore, a miraculin price range was estimated by considering sucrose retail prices and the miraculin:sucrose molecular ratio required to induce a similar sweetness [56]. Table S18 elaborates on the calculations which resulted in a miraculin price range of R290,481–376,830/kg in Table S19.
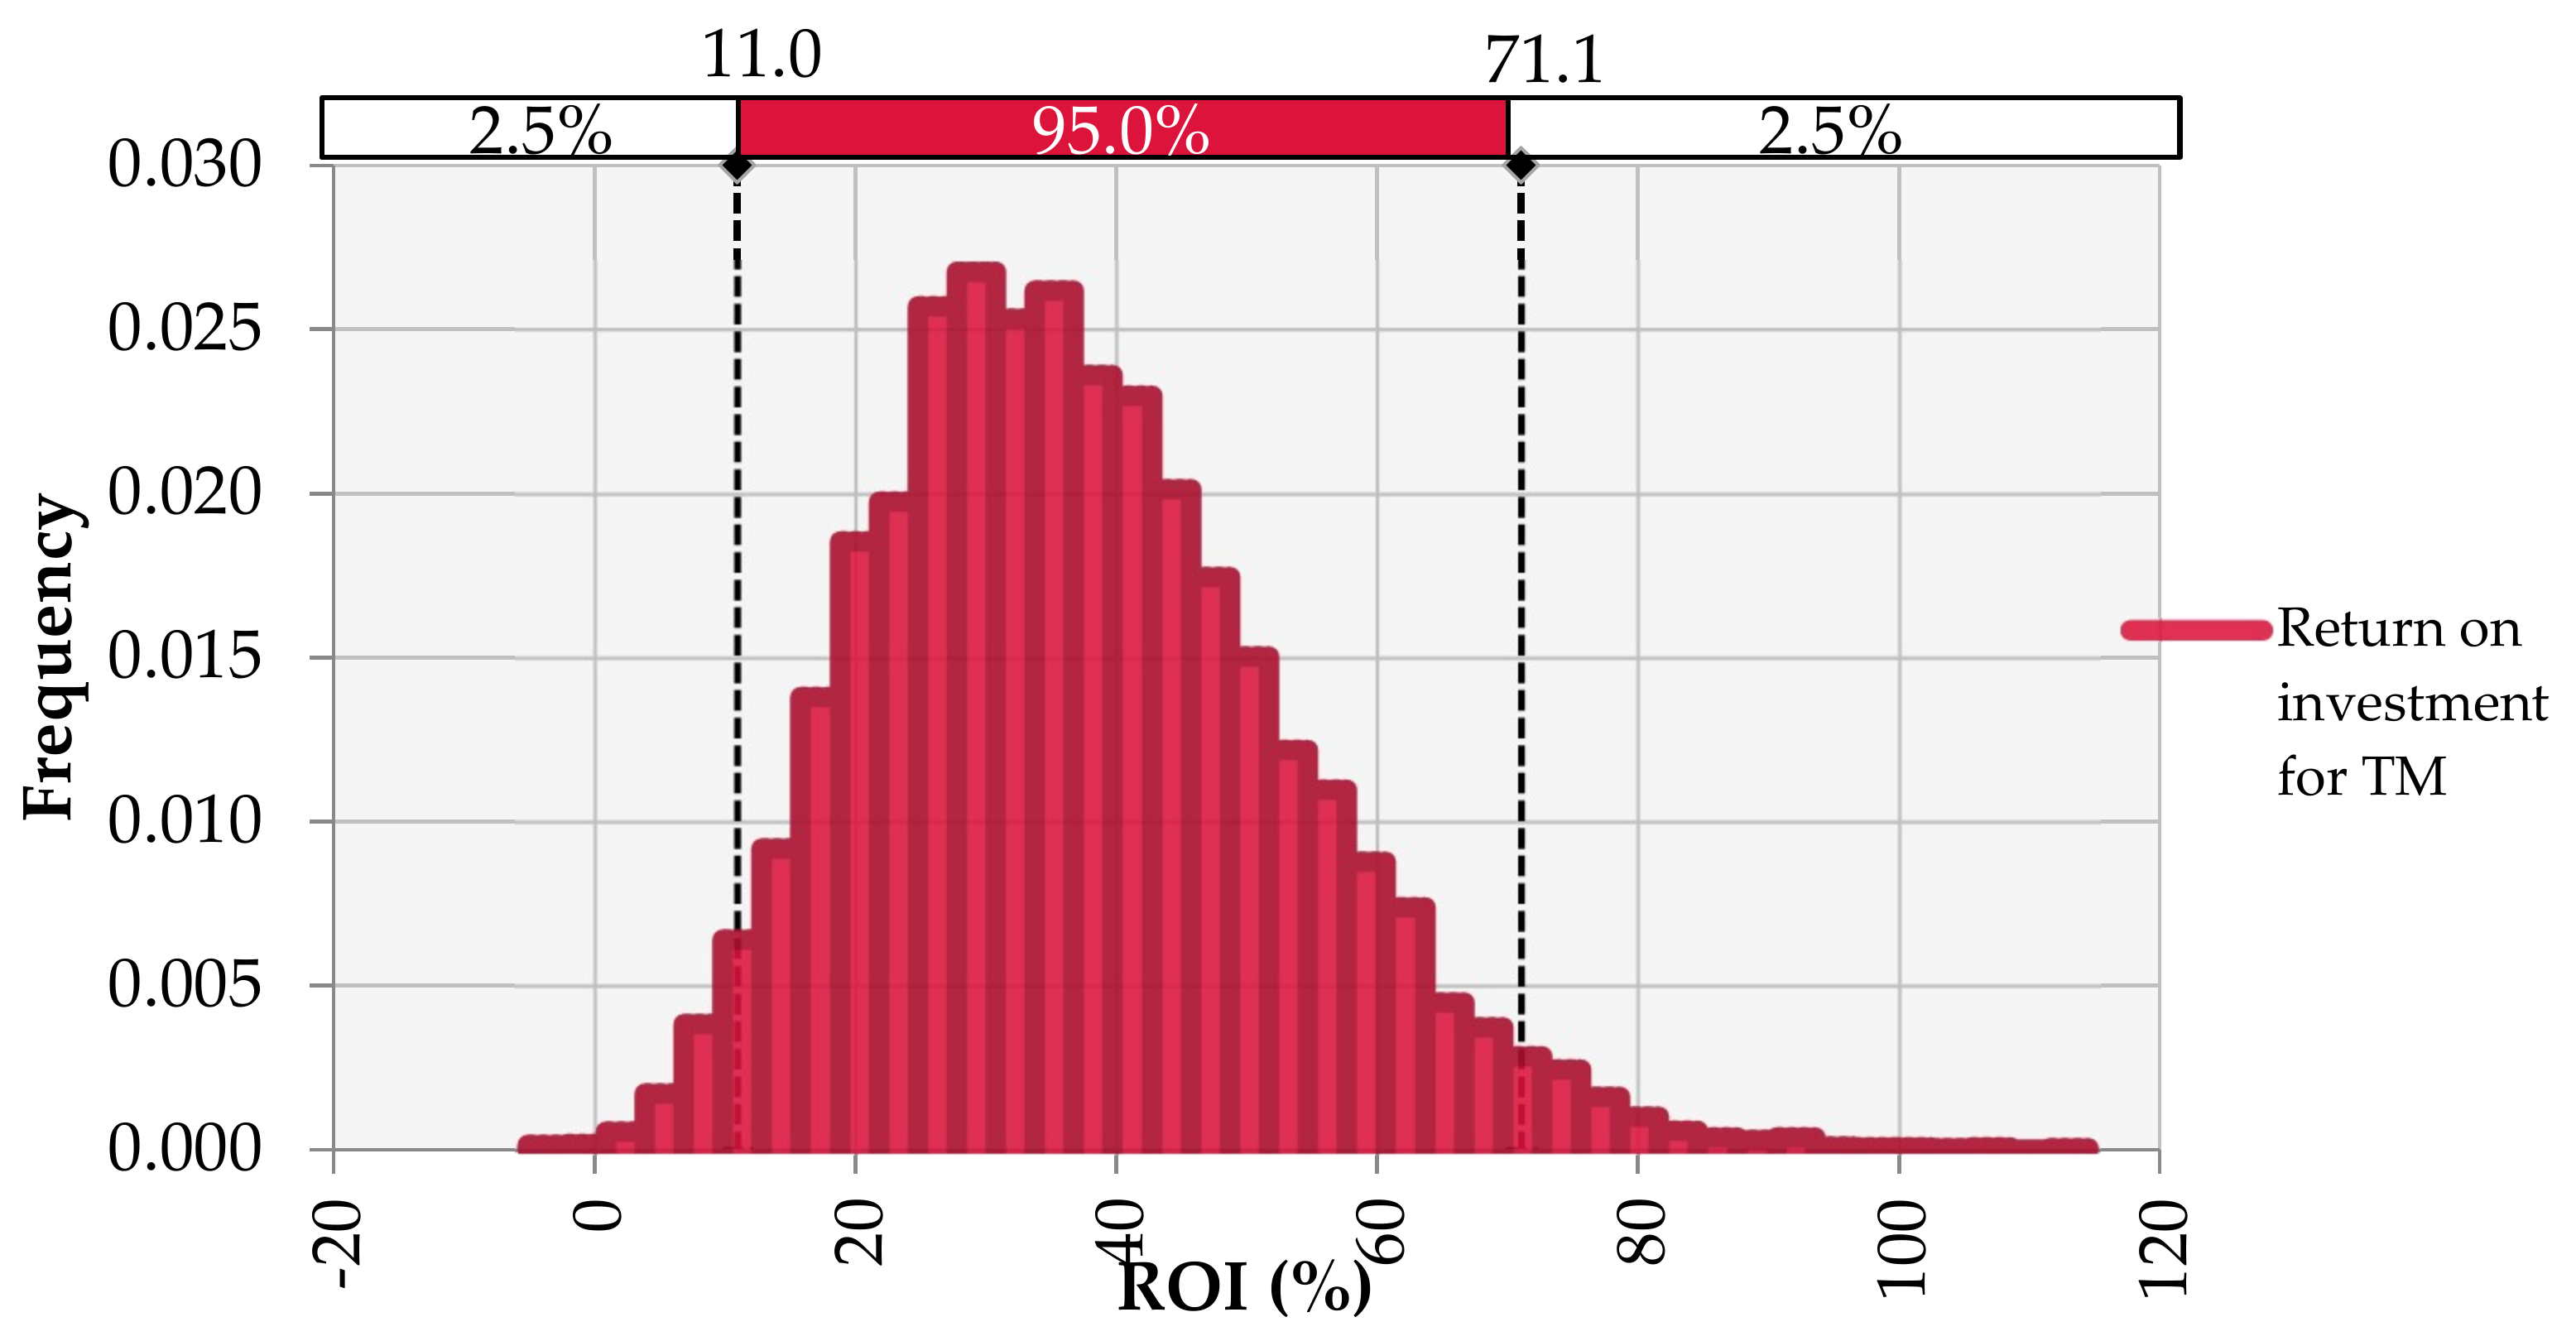
The profitability of TM was evaluated further based on the sugar equivalent pricing. Table 13 shows the revenue potential when considering the miraculin pricing based on miracle berries, but it was assumed that the large-scale adoption of miraculin would not focus on lab-grade pricing. The miraculin pricing which was based on sugar equivalent value was a more realistic value for further evaluation. Based on published miraculin accumulation levels [74] and the required amount of miraculin to induce taste modification [56], the TM scenario yielded favourable ROI values in Figure 6. It resulted in a 99.9% probability of making a profit and an 87% probability of making a ROI larger than 20%.
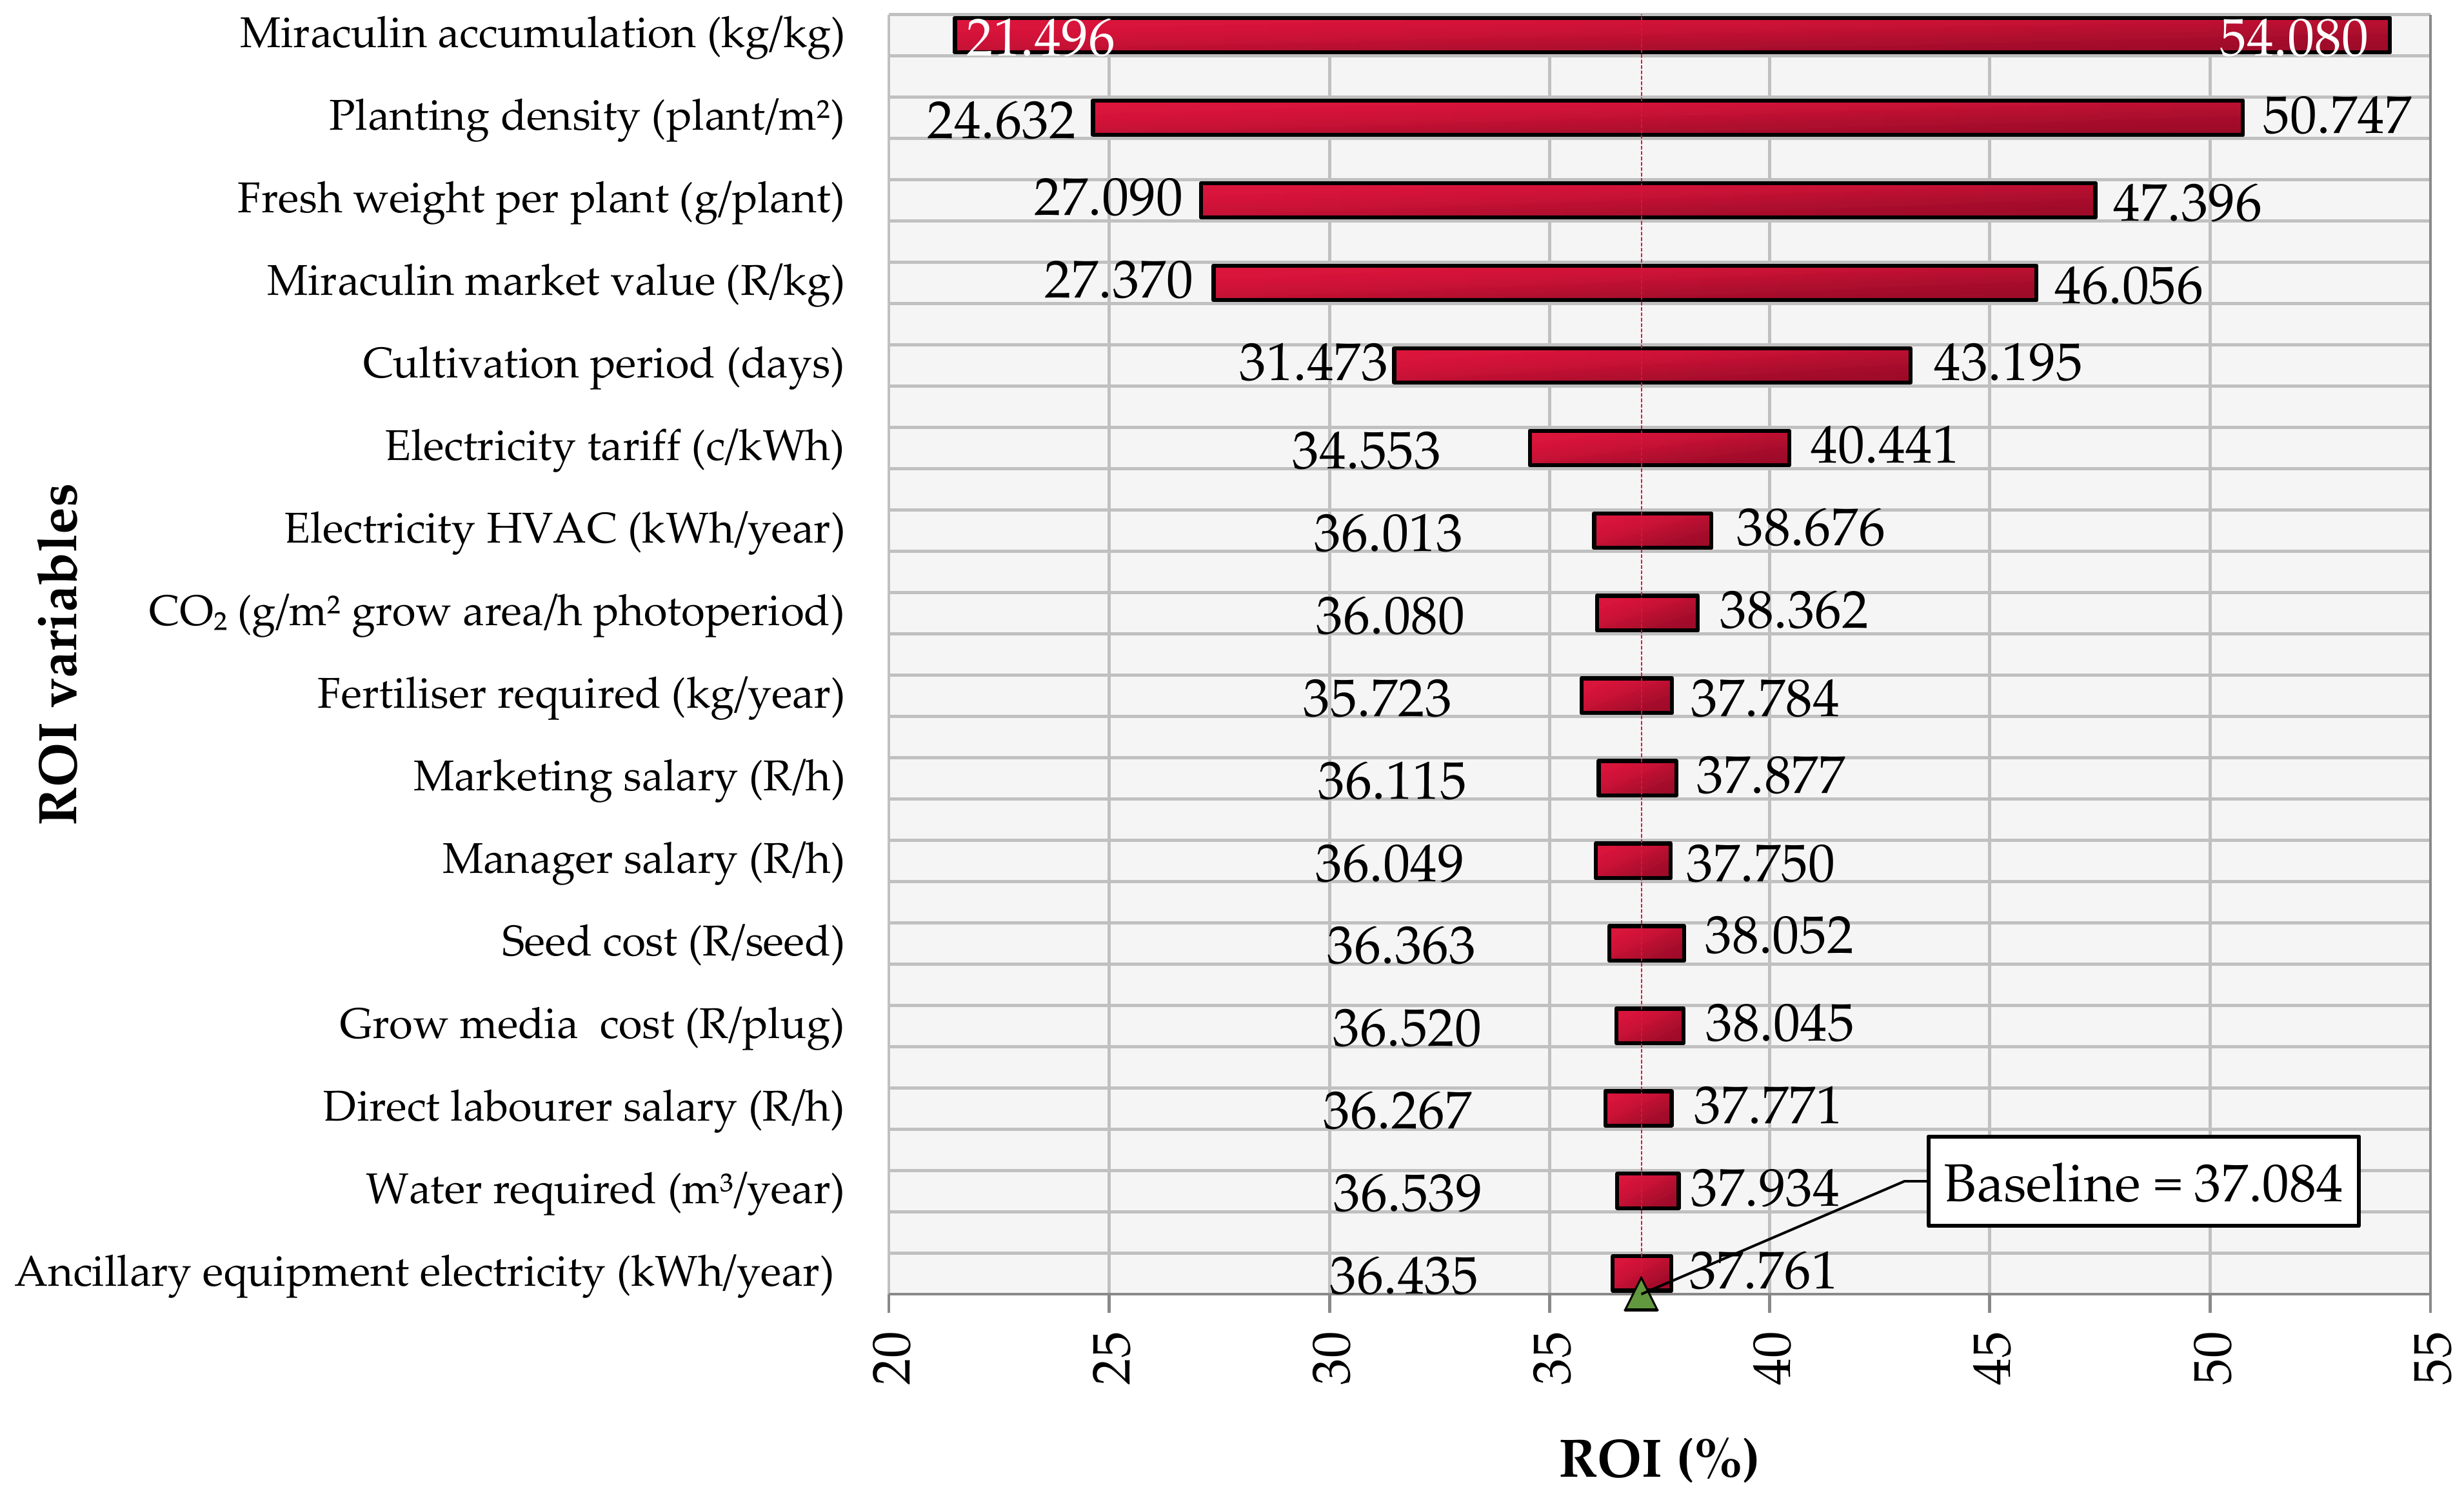
The sensitivity analysis in Figure 7 shows that the ROI was primarily dependent on miraculin accumulation levels in the transgenic tomatoes. This also explained why planting density and fresh mass per tomato plant were significant. The top three variables all related back to the annual miraculin being produced in TM, and as miraculin was the primary product of the TM scenario, it had the most significant influence on profitability.
The annual capital for uncertainty, R3,031,137–R19,655,509 must consider market demands and absorb downstream processing costs to obtain miraculin in a usable form. This includes extraction and purification costs [101,102] and variable recovery rates of 45–62% [74] from transgenic tomatoes. Depending on the application, miraculin extraction and purification from host plants is not needed [57]. Miraculin has also been shown to accumulate in successive generations of transgenic tomatoes, which meant that plant transformation was not required at the start of each crop cycle [74] Lastly, miraculin is mostly accepted and researched in Japan [57,74] and requires more widespread acceptance before it can reach large-scale market penetration.

4.4.2. Lettuce-Based Plant Factory Revenue Results

The main economic indexes for the lettuce scenarios are shown in Table 13 by using the market values and product yields from Table S20. The baseline LF scenario showed promising revenue potential by selling edible lettuce directly to the consumers. As with TF, the producer price did not provide a pathway towards profitability. The need for asking a premium price for hydroponic and pesticide-free lettuce was confirmed by the cultivation cost of R40–101/kg for lettuce. An average ROI of 31% was achieved with a payback period of 3.23 years. The LF scenario showed a 99% probability of making a profit in Figure S10 and a 72% probability of making a ROI of 20% or more. The ROI value was mostly influenced by lettuce mass per plant, planting density, and cultivation time in Figure S11. The LM scenario achieved an average ROI of −29%. This was attributed to the low accumulation levels of miraculin in lettuce [75], and excluded LM from further analysis.
Lastly, the individual and combined contributions of PV panels and brewers’ spent grains were marginal when considering the average ROI value of LRI to the baseline LF scenario. The ROI reduced from 31% to 29% when only considering the influence of rooftop PV panel installations. This reduction was attributed to the increased CAPEX cost and yearly depreciation of the panels in Table 7. Additionally, the plant factory dependence on grid electricity was only reduced by ~10% without expanding the plant factory footprint to allow for additional renewable energy to be generated. Zeidler, Schubert, and Vrakking [7] also concluded that the high energy requirements of plant factories limited the economic impact of façade-based PV panel installations. The energy generated from the PV system was also subject to variability, such as panel degradation, solar availability and policies regarding independent power generation.
The use of brewers’ spent grains increased the baseline ROI from 31% to 33% but it was assumed that spent grains could fully substitute inert grow media, such as rockwool. In reality, the spent grains would need to be moulded or placed in containers to function as hydroponic grow media. This would have to be absorbed by the capital buffer provided using spent grains. Despite the marginal economic benefits shown in Table 13, the use of spent grains is an act of waste valorisation and carries environmental benefits with its use [16], although these benefits were not discussed in this paper.

4.4.3. Tobacco-Based Plant Factory Revenue Results

The revenue potential of TPHB was calculated by only considering the value of accumulated PHB polymers in the transgenic tobacco. The economic feasibility of TPHB was evaluated by using published prices for PHB [103] and by considering PHB to be equal in value to polypropylene, as they shared similar properties [76]. The revenue potential of TT and TTD was linked directly to the accumulation of HBV antibodies and their market price. The market data in Table S21 was used, along with the CAPEX and OPEX results of the tobacco scenarios, to calculate the economic indexes in Table 13.
The TC and TPHB scenarios were omitted from further analysis after the potential revenue and cost of cultivation values were calculated. The TC maximum revenue potential of R3,329,928 per year was obtained by selling tobacco plants for the producer price. The scenario of selling the tobacco for the simultaneous production of methane, biodiesel, and artemisinin extraction resulted in a maximum potential revenue of R163,019 per year and was significantly lower than the annual cultivation costs of R8,743,519–R10,795,692. Yang et al. [51] investigated the accumulation of artemisinin and PHB in biomass feedstocks to supplement biofuel production costs but required the feedstock to cost ~R1.40/kg, instead of the calculated R147–203/kg.
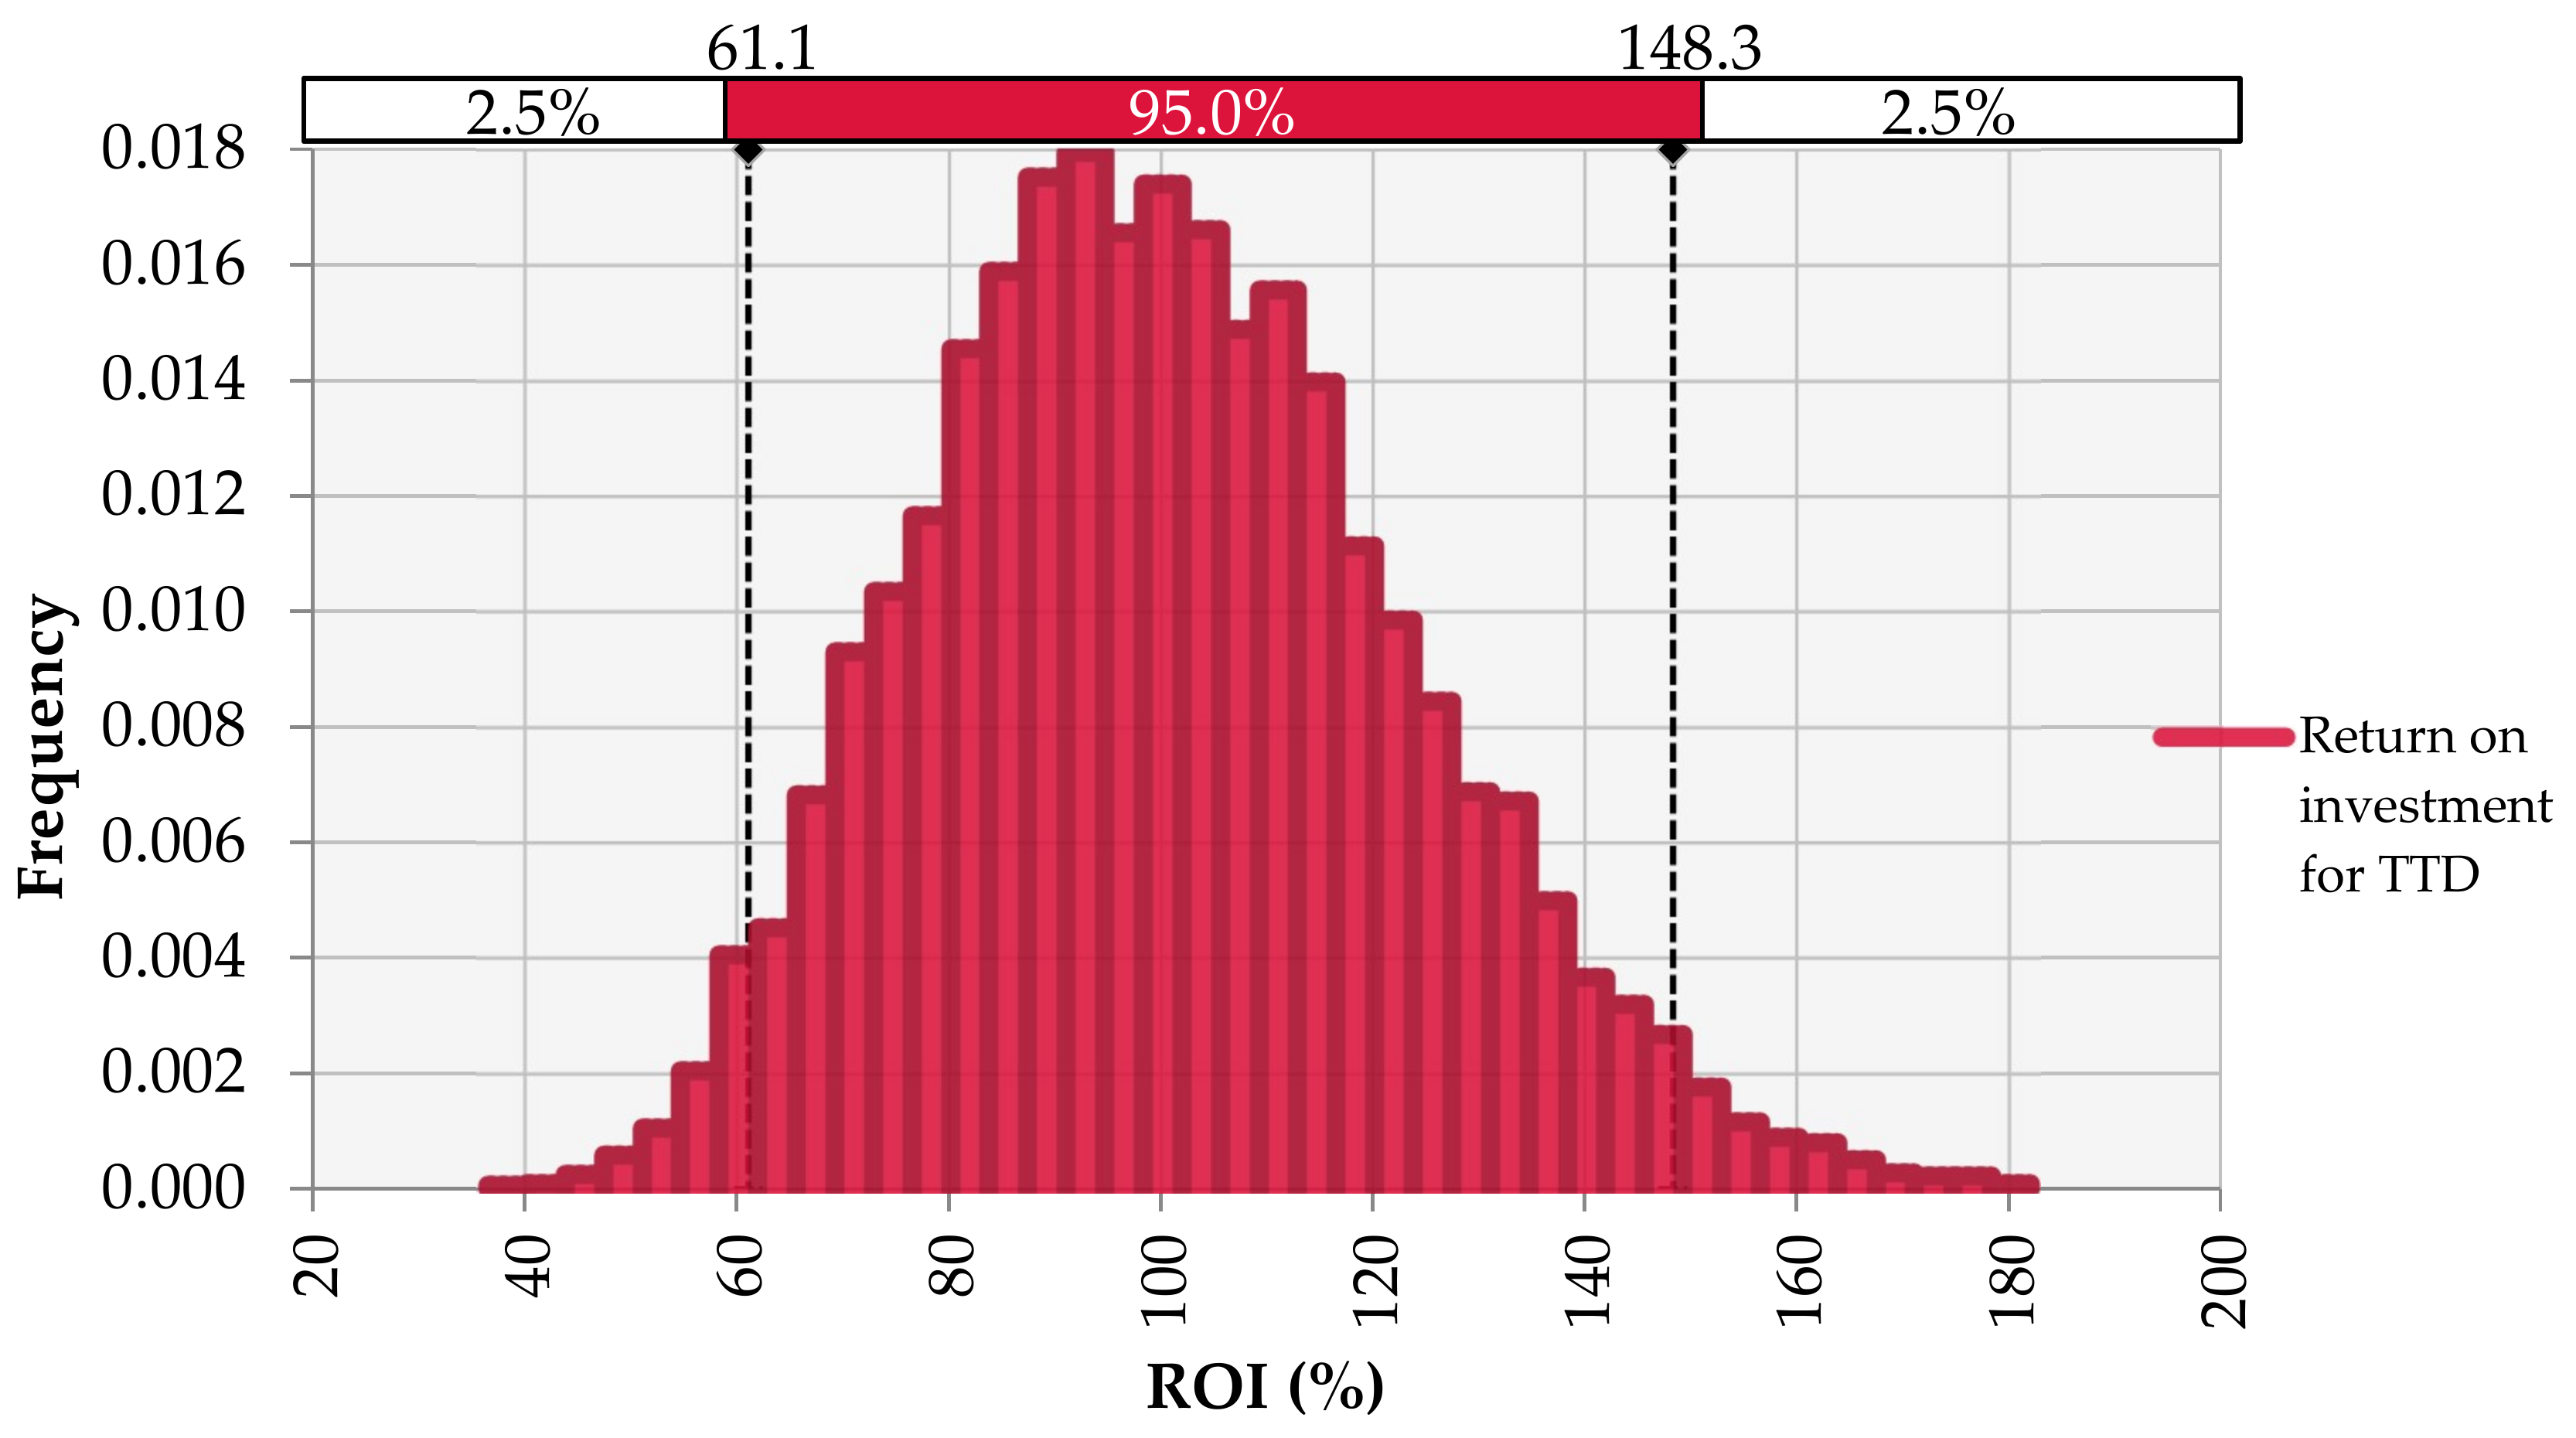
The TT and TTD scenarios were similar in nature as both cultivated transgenic tobacco plants expressed HBV antibodies. The variations in revenue potential and cultivation costs were fully attributed to the genetically modified tobacco plants in TTD that resulted in dwarf plants. This allowed for more plants to be cultivated in the same growing area and did not influence HBV antibody expression [62]. The elevated annual revenue potential in TTD from R25,231,351–R48,806,539 to R27,519,590–R51,613,595 served as an example of how the genetic modification of crops could be used in plant factory infrastructure to improve profitability and limit the exposure of genetically modified crops to the environment [43]. The economic indexes of TTD were discussed further, as it was the most profitable tobacco-based scenario. The economic potential of TTD is illustrated by Figure 8, which shows a 95% probability of achieving a ROI between 61–148% and which resulted in an average payback time of one year. This also resulted in an annual capital buffer of R16,888,055–R41,009,508 to mitigate against uncertainty and generate a profit. For TTD, the excluded costs included successful transformation of tobacco plants to induce a dwarfing effect and to express HBV antibodies at the specified levels [62], the extraction and purification of HBV antibodies from the transgenic host plants, navigating regulatory frameworks for plant-made pharmaceuticals [43,104,105], and the market demand of plant-made pharmaceuticals.
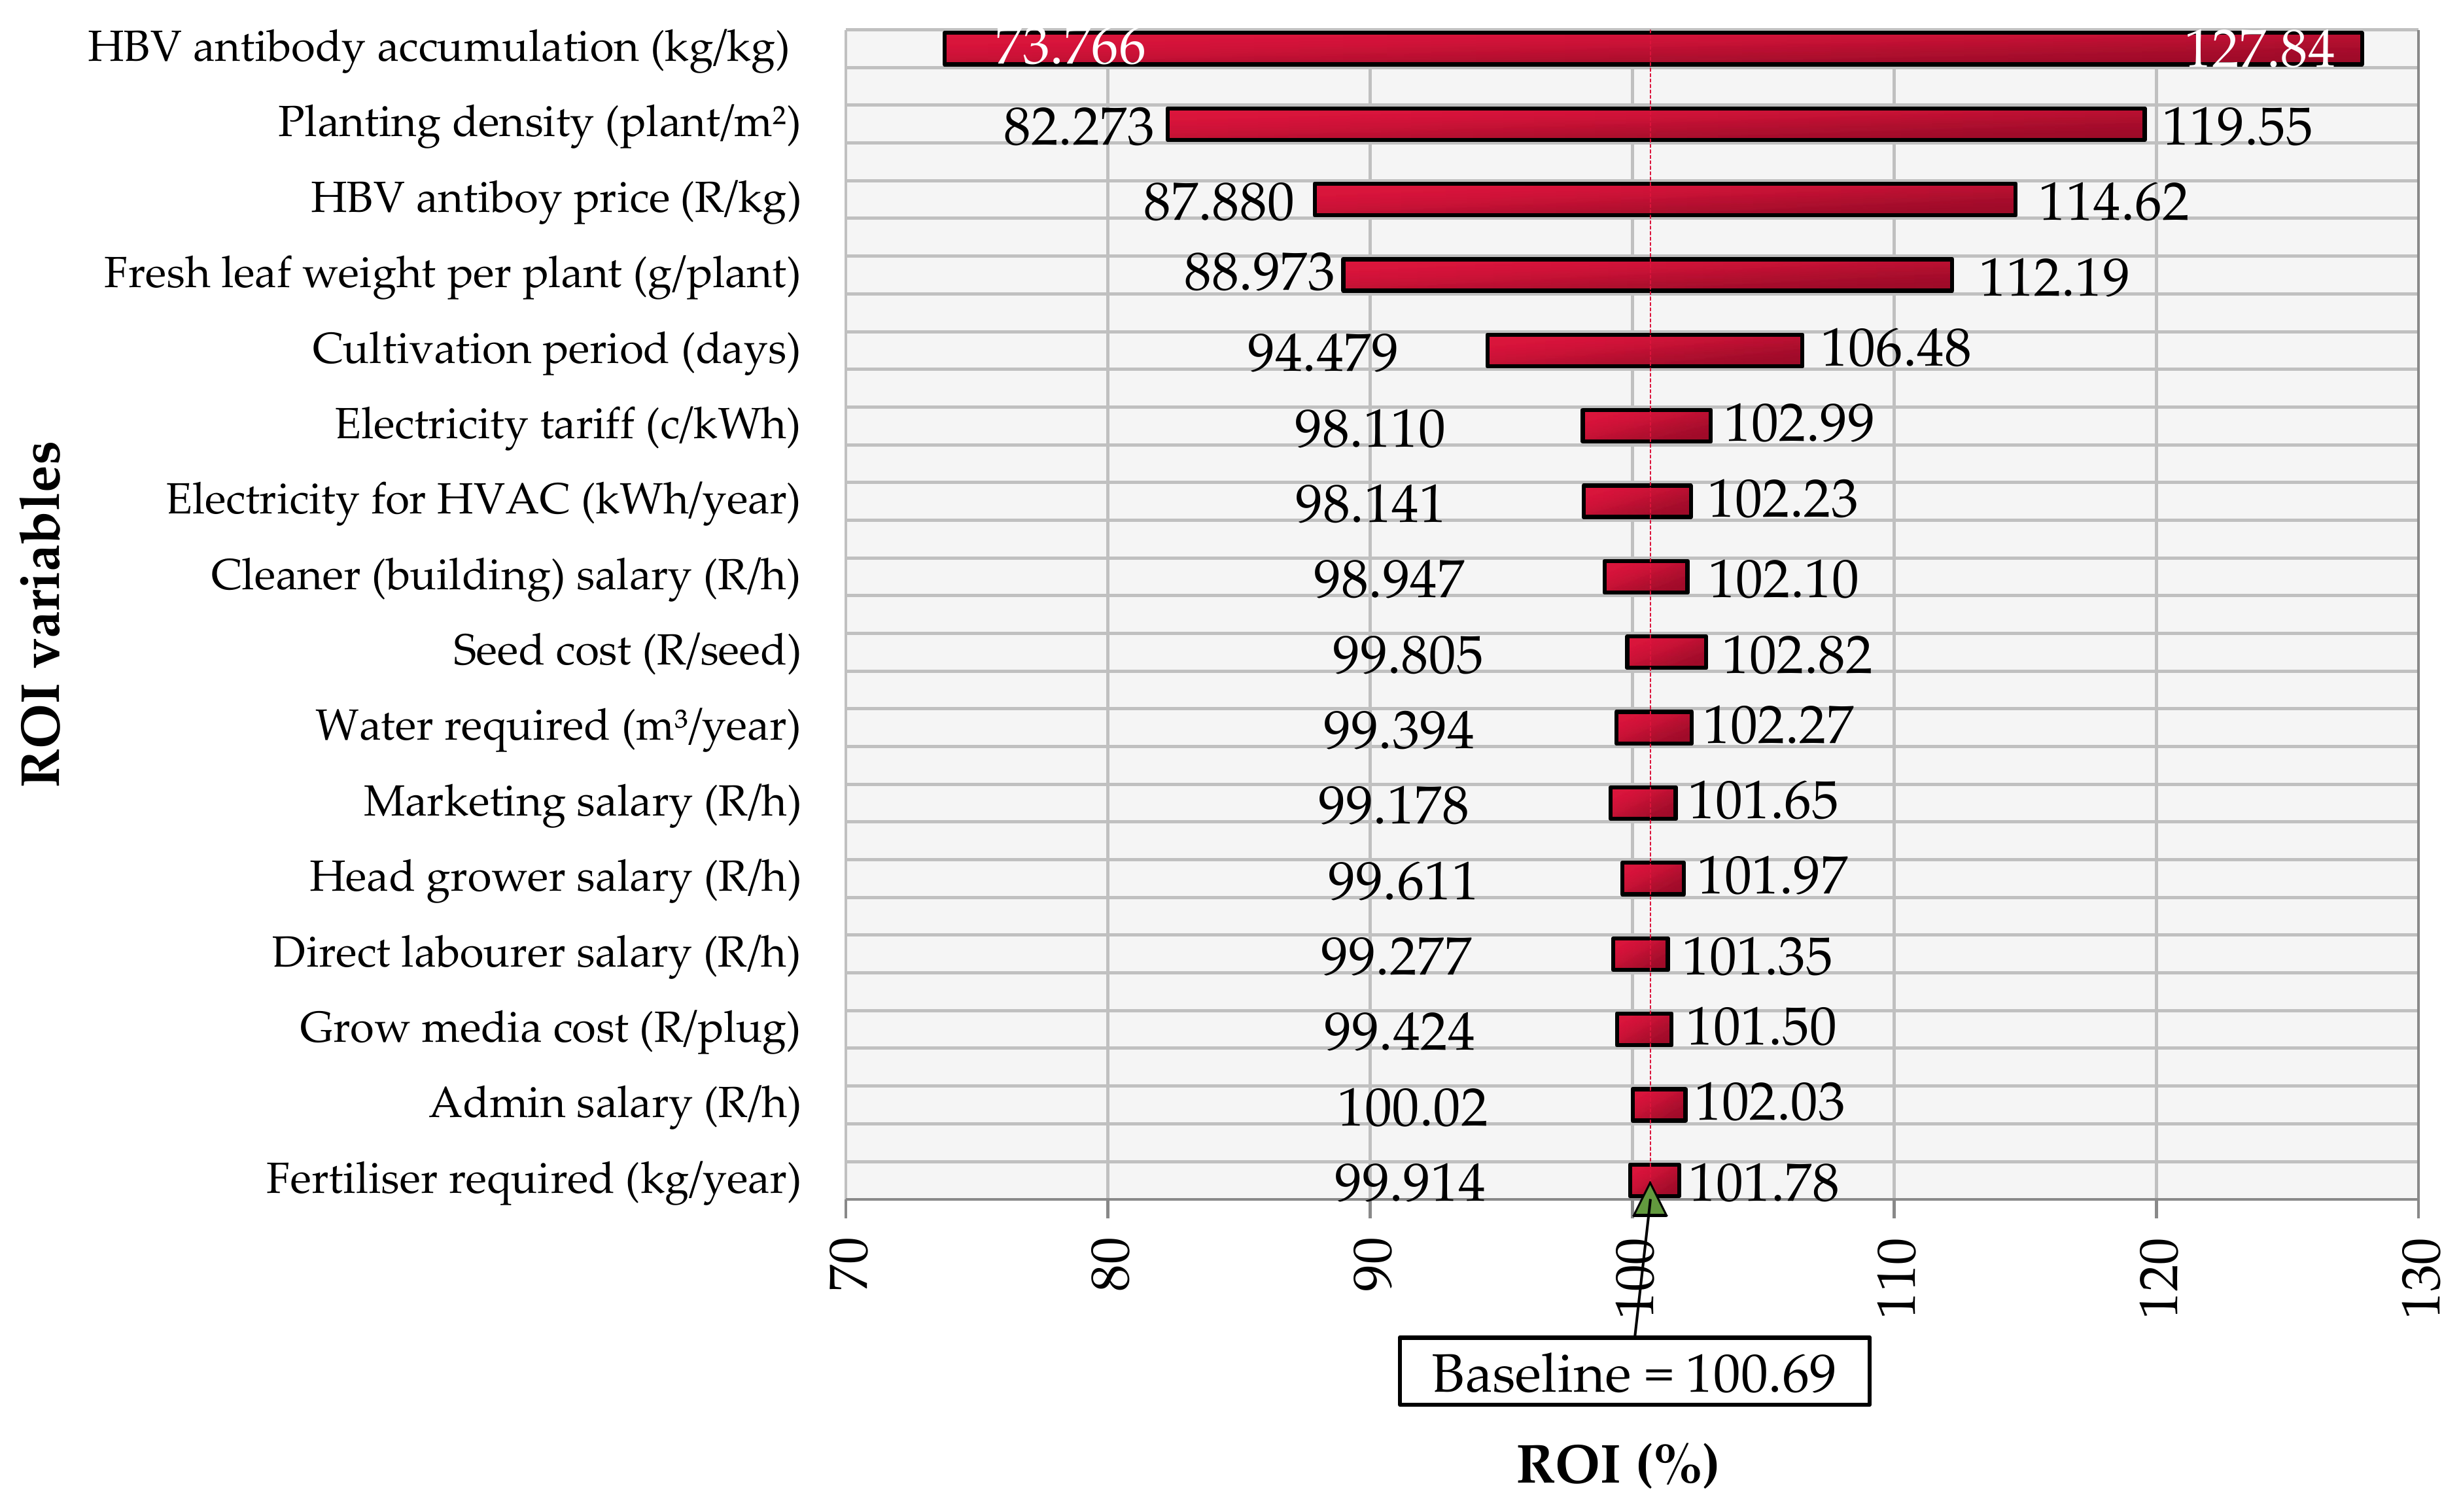
Figure 9 shows that the profitability of TTD was most dependent on the level of HBV antibody expression in the host plant, and was followed by the planting density in the plant factory. This highlighted the importance of research into improving the expression levels of value-added compounds in transgenic host plants. The sensitivity of the planting density also drew attention to the impact which the tobacco dwarfing had on TTD profitability.
The novelty of producing plant-made pharmaceuticals on a large scale added another layer of uncertainty to TTD and made it a high-risk and capital-intensive scenario. In an attempt to mitigate against some of the mentioned uncertainty, TTD was also evaluated to determine how much of the 2720 m2 growing space had to be dedicated to the cultivation of dwarf tobacco plants which expressed HBV antibodies to obtain an average ROI of 20%. This evaluation concluded that ~41%, or 1102 m2, of the total 2720 m2 had to be dedicated to the cultivation of the transgenic tobacco plants to obtain the desired ROI. The remaining 59% of growing area could be used to cultivate biomass that required fewer environmental control and resource inputs. This result suggested that plant factories could make use of a multiple revenue stream approach to mitigate against the uncertainty of market demands for specialty products.

4.4.4. Cannabis-Based Plant Factory Revenue Results

As shown in Table S22, the economic indexes, in Table 13, were calculated using the leaf and inflorescence yields in CC. Despite only selling ~30 wt% of the total cannabis biomass, a favourable average ROI of 508% was achieved and resulted in a payback period of 0.20 years. The probability density distribution is shown in Figure S12. The cultivation costs of R455–1,480/kg cannabis plants and R1,516–4,935/kg of cannabis leaves and inflorescences also reflected the high seed costs.
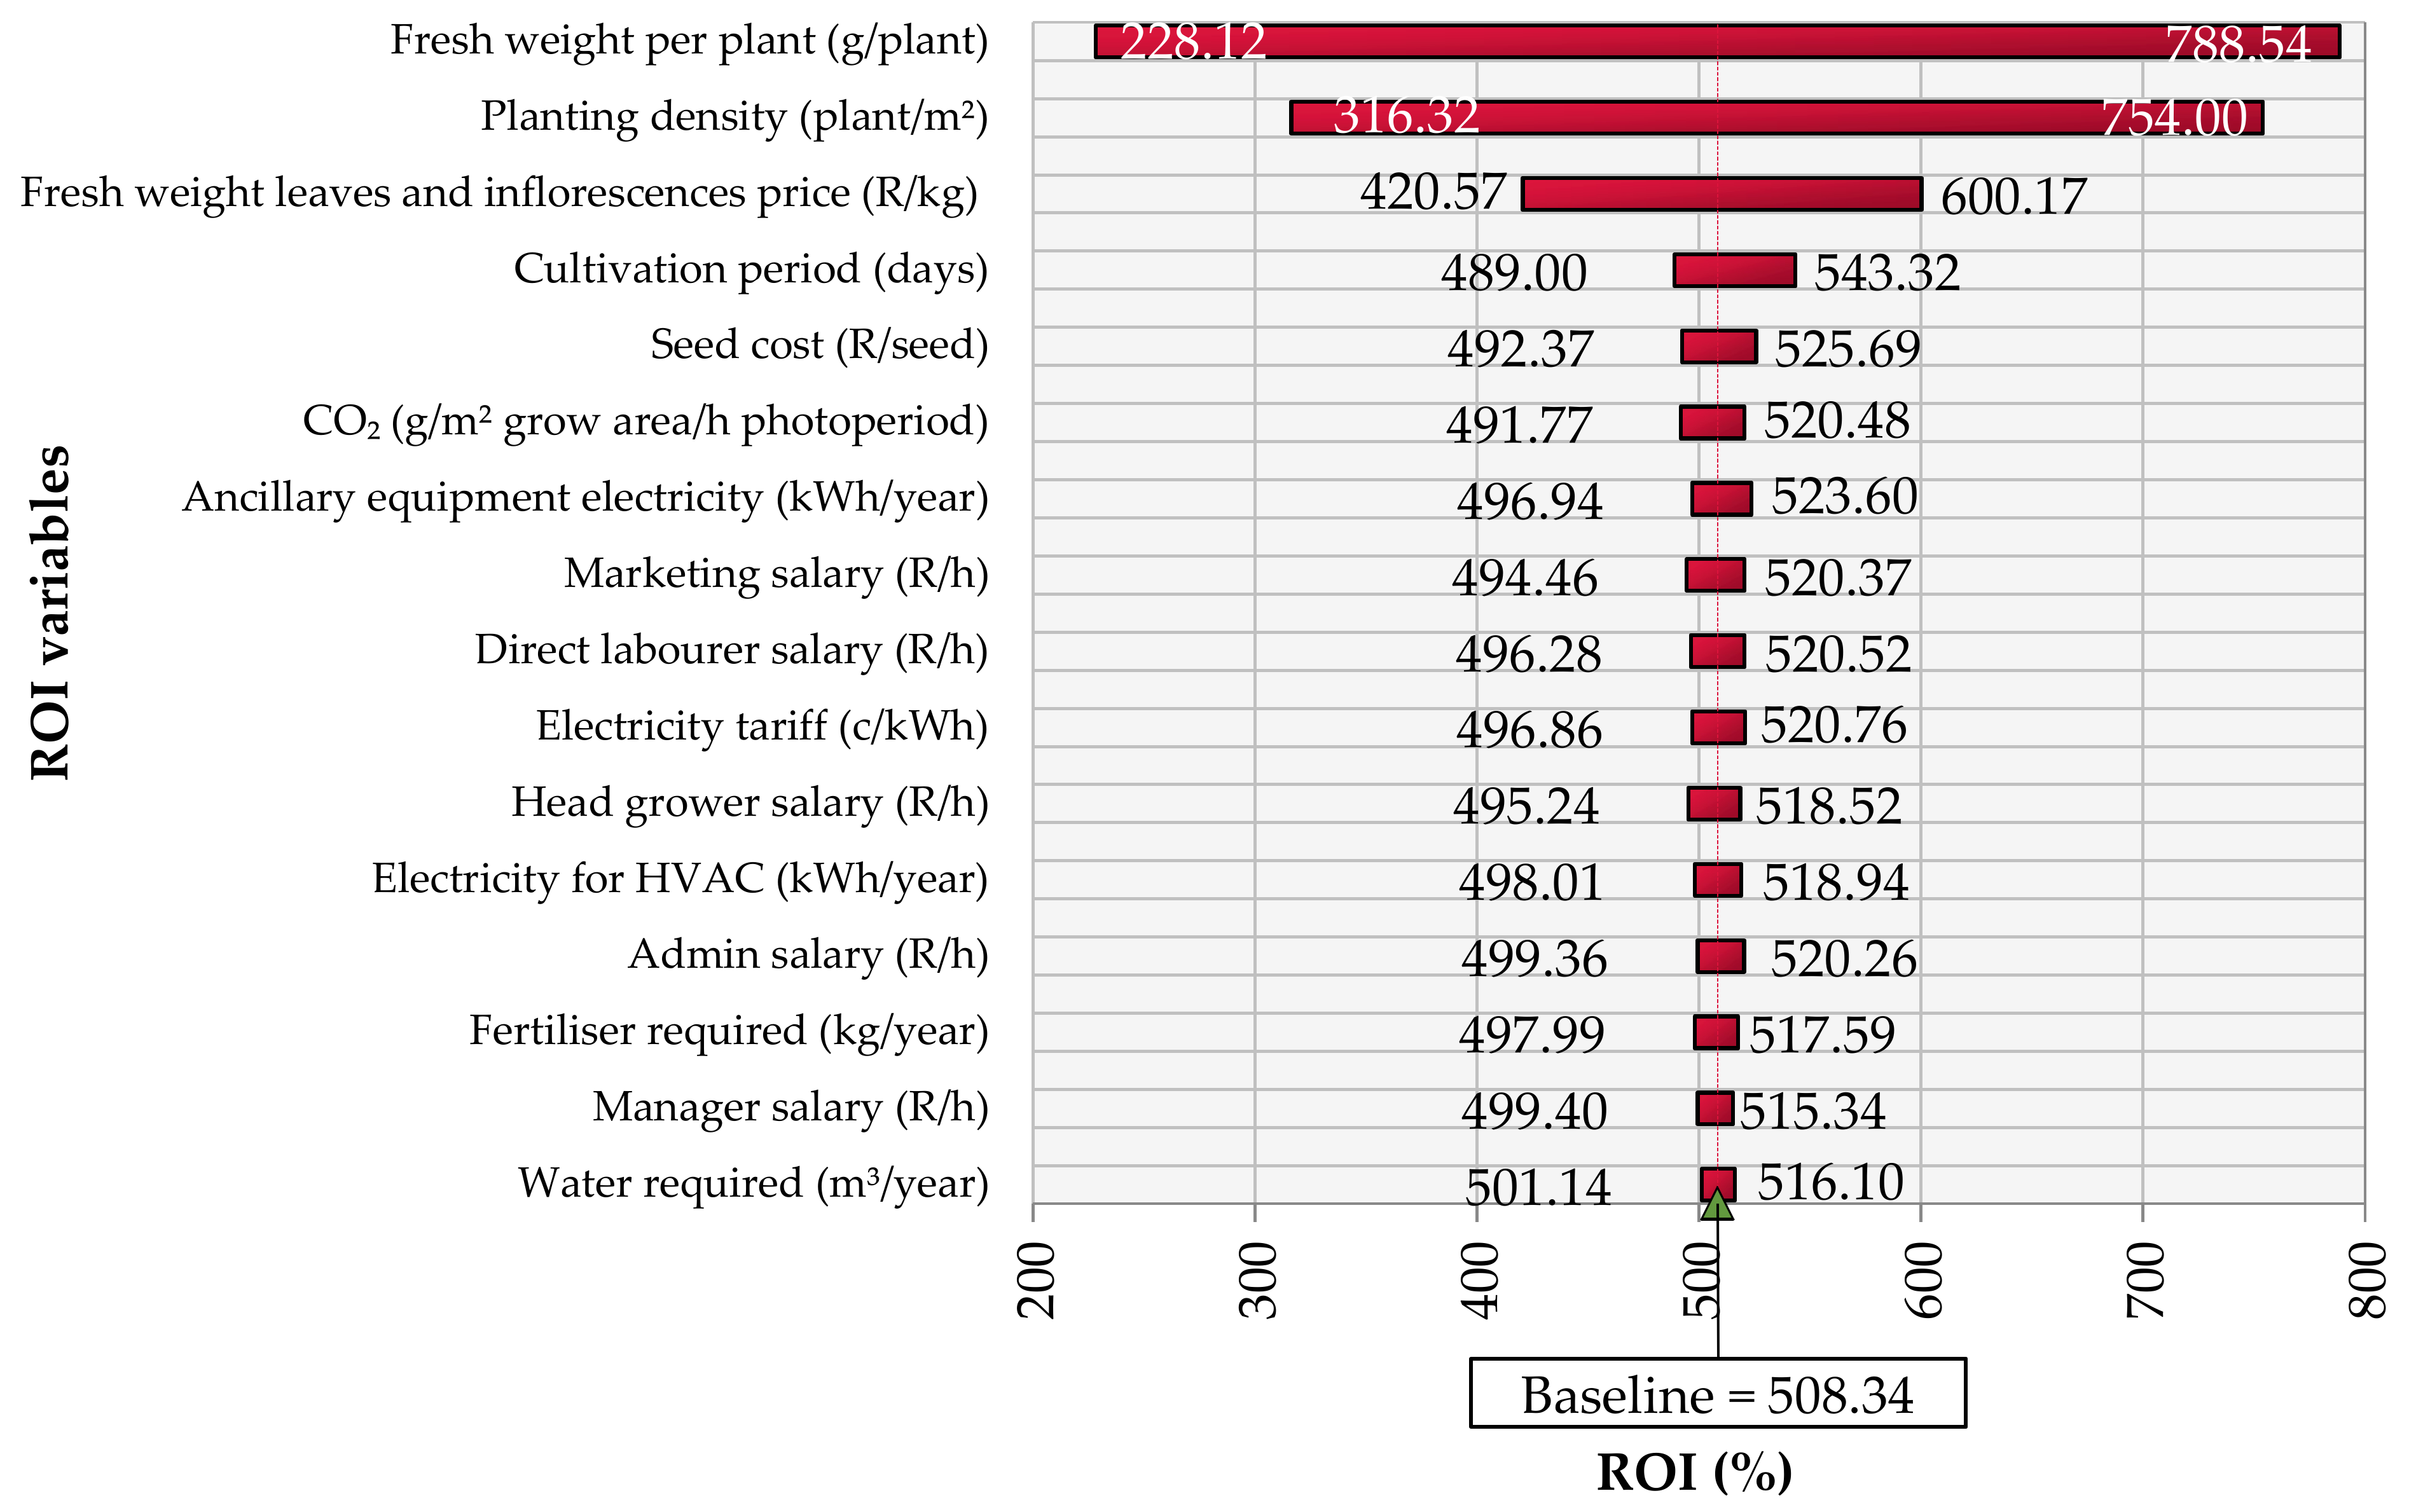
The ROI was also mostly influenced by cannabis fresh weight yields, planting density, and market prices, as shown in Figure 10. The financial impact of cannabis yields and planting densities further motivated the use of plant factory infrastructure. Research into plant factory design and optimised environmental control can directly influence biomass yields and increase planting densities to increase the profitability of CC even further.
As cannabis biomass was typically sold directly to the end-user market, there were not many downstream processing steps which had to be mitigated with the annual R31,597,483–R199,523,749 capital buffer. Uncertainties included more conventional cultivation issues, such as drying, storage [106], yield variability, and harvest loss through contamination. Uncertainties more specific to cannabis cultivation included country-specific legislation regarding allowable levels of psychoactive tetrahydrocannabinol (THC) for the legal cultivation of cannabis. Research into the medicinal value of secondary metabolites in cannabis was still ongoing and limited its marketability [67,93]. Therefore, the profitability of CC was significantly dependent on local perception towards cannabis cultivation and government legislation concerning its cultivation.

5. Discussion

This section elaborates on the economic feasibility of the plant factory scenarios which were evaluated. The results of the plant factory scenarios were discussed in terms of the crop and product selection for each of the scenarios to highlight the economic impact which these variables had on the plant factory business case.

5.1. Tomato-Based Plant Factory Scenarios

The tomato-based plant factory scenarios both showed economic feasibility, with TF achieving an average ROI of 11% and TM an average ROI of at least 37% in Table 13. The profitability of TF was conditional on selling edible tomatoes directly to consumers at a premium price, while TM had to sell miraculin at an appropriate price to be competitive against sugar alternatives. Although TM had higher revenues and a more favourable payback period than TF, it also carried more risk and uncertainty. The food market of TF was more developed than the biopharmaceutical/bio-based product market which TM had to enter. The successful accumulation of miraculin was also still a topic of research [107] and brought along marketability issues due to the lesser-known nature of miraculin. This was also seen in LM, which was unable to accumulate miraculin in sufficient quantities using lettuce as a host plant [75].

5.2. Lettuce-Based Plant Factory Scenarios

The baseline food market lettuce scenario, LF, showed an average ROI of 31% when it was able to ask its hydroponic food premium price. The need for a high retail price was illustrated with the R40–101/kg lettuce cultivation cost in Table 13. Comparison with LF showed that the installed PV panels and brewers’ spent grain as growth media in LRI had a marginal impact on the economic indexes. Despite this, an argument can still be made for greater self-sufficiency when it comes to the power demands of plant factories. The risk mitigation of independent power generation was not reflected in the economic indexes. Similarly, the larger economic impact and environmental benefits of valorising spent grains can also extend beyond the plant factory.

5.3. Tobacco and Cannabis Plant Factory Scenarios

The low revenue potential of TC and TPHB illustrated the importance of selecting appropriate crops and value-added compounds for plant factory cultivation. Although tobacco was one of the few crops which were able to accumulate artemisinin [59], the accumulation levels and market value of the anti-malarial drug did not motivate the use of a plant factory for its accumulation in TC. Similarly, the accumulation of PHB in TPHB also did not reach profitability when considering the R9,325,878–R11,383,441 annual cost of cultivation within the plant factory. The potential of using tobacco as a host plant was reaffirmed in TT and TTD which accumulated HBV antibodies and achieved ROIs of 93% and 101%, respectively, and showed the economic potential of leveraging the environmental control in plant factory infrastructure within the biopharmaceutical industry. The TTD scenario also showed increased revenues, compared to TT, due to the dwarfing of the tobacco plants in the plant factory. Lastly, the cannabis cultivation in CC resulted in an average ROI of 508%. Despite this value, the economic viability of cannabis cultivation remains dependent on country-specific legislation which could prohibit the market from expanding. The value of cannabis plants was also reflected in its elevated cultivation costs of R16,702,559–R28,286,586 per year, which meant that harvest losses through contamination or legislation would result in significant financial losses for the plant factory.

5.4. Economic Feasibility of Plant Factory Scenarios

The economic modelling of the developed plant factory scenarios in this paper illustrated the economic feasibility of plant factories, within the constraints and limitations of this paper. The plant factory scenarios showed that the largest cost driver was electricity demand, which was primarily associated with artificial lighting requirements. This result is similar to the existing plant factory modelling literature [8,14] and the novel plant factory scenarios in this paper were unable to change this cost constraint. Scenario LRI investigated the use of PV panels to reduce electricity demand, but it was concluded that the cost mitigation remained marginal if the plant factory footprint was not expanded to facilitate additional energy generation [7]. Alternatively, a smaller cost driver, fertiliser demand, was reduced significantly in LRI by substituting industrial by-products as fertiliser material [16,21,80]. This illustrates the economic benefit of reducing plant factory expenses where possible, even if it is not the main cost driver.
The effectiveness of the economic model in this paper was evaluated using Scenario TF and Scenario LF, which cultivated edible tomatoes and lettuce, respectively. Edible biomass has shown profitability in the existing literature of plant factories [7,8]. These scenarios also had the least amount of uncertainty associated with the economic model results as the omitted costs primarily included packaging, storage, and transportation of the biomass to markets. The remaining plant factory scenarios had higher levels of uncertainty, as the end-user markets were not the food market.
Scenario TM and Scenario LM both accumulated miraculin as the value-added compound to be sold in the biopharmaceutical market. The economic indexes for Scenario LM were not favourable, and this was attributed to the low levels of miraculin accumulation [75]. The miraculin accumulation in tomatoes was significantly higher [74] and resulted in favourable economic indexes for Scenario TM. This highlights the importance of selecting appropriate host plants when accumulating value-added compounds within plant factories. Despite the results of Scenario TM, certain limitations still apply. The economic model did not consider the costs of transforming the host plants to allow miraculin accumulation. Furthermore, downstream extraction and purification efficiencies were not included in the economic modelling [101,102]. The reported capital for uncertainty must account for these omissions, and future studies can include the upstream and downstream considerations to provide a more comprehensive assessment of the economic feasibility of accumulating miraculin in transgenic host plants within plant factories. At the time of writing this paper, miraculin accumulation was still being researched [107] and has not reached large scale market adoption. This contributes to the economic uncertainty of Scenario TM.
The tobacco-based scenarios were assessed due to the reported effectiveness of using tobacco as a multipurpose crop and host plant for the accumulation of value-added products [51,59,60,61,62,63,64,65,77]. Scenario TC and Scenario TPHB were found to be uneconomical within a plant factory environment. Scenario TC was modelled using tobacco market values [108], biofuel conversion yields [63,65,77], and reported artemisinin accumulation levels [59]. Despite the variety of potential products which were evaluated, Scenario TC did not reach profitability. This was attributed to the insufficient accumulation levels of value-added compounds and low biofuel prices [94]. Furthermore, downstream considerations also limited the economic feasibility of cultivating biofuel feedstocks in plant factories. Taking biomethane production as an example, it was found that large-scale biomethane production facilities were most profitable [4]. This would require plant factories to have large cultivation capacities and to be located close to biomethane facilities to improve the economic feasibility of supplying biomethane feedstocks through plant factories. The profitability of biomethane production facilities also improves when using waste streams as feedstocks, although this requires adequate amounts of feedstocks to be sourced from industries which generate the required feedstocks as waste material [4]. This also means that plant factories will not be economically viable while producing biomethane feedstocks as primary products. As with many biofuel conversion processes, value-added compounds are required to improve the economic feasibility of biofuel production [51]. In the case of this paper, no profitable plant factory scenario was found which simultaneously produced biofuel feedstocks and value-added compounds. The low profitability of biofuel conversion could not motivate the use of plant factory infrastructure to cultivate biomass feedstocks.
Similarly, Scenario TPHB did not reach profitability, although the accumulation levels of PHB in transgenic tobacco plants was second only to Arabidopsis [109]. Despite the larger size of tobacco plants and the reported accumulation levels [60,110], profitability was not achieved in Scenario TPHB. This was especially true when considering PHB pricing to be equivalent to polypropylene prices [111]. This was relevant, as PHB shares properties similar to polypropylene and can be considered as an alternative product [76]. The bacterial fermentation process of obtaining PHB has also been evaluated previously by the application of LCA to estimate the environmental impact of producing the biopolymer [112]. From the assessment, it was concluded that PHB production had a significant environmental impact. This was attributed to the low PHB yields which were obtained through bacterial fermentation, and the significant amount of raw material which was needed for the process [112]. The LCA found that an improved PHB yield would have the most beneficial impact on the environmental assessment, as this would reduce feedstock demands for PHB production. The research concluded that the PHB biopolymer required improved production processes to become economically viable. Despite the reported need for an improved PHB production method, the PHB accumulation levels in the transgenic tobacco host plants in this paper were insufficient to allow Scenario TPHB to reach profitability in plant factories. This indicates that additional work will be required to improve PHB production levels, whether the method is bacterial fermentation or transgenic accumulation in host plants.
The effectiveness of using tobacco as a host plant was demonstrated in Scenario TT and Scenario TTD. Both scenarios showed economic feasibility in plant factories by accumulating HBV antibodies at reported levels [62]. Scenario TTD also demonstrated the robustness of tobacco as a host plant by illustrating the improved economic indexes, relative to Scenario TT, after the tobacco plants were dwarfed. The dwarfing allowed more tobacco to be cultivated in the same growing space and did not influence the HBV antibody accumulation levels [62]. Scenario TTD demonstrates the economic benefit of identifying an appropriate plant factory crop and pairing it with high-value products. The profitability of Scenario TTD must still be considered in the context of omitted expenses and economic model assumptions. The costs associated with the host plant transformation were not included in the economic model. This included the dwarfing and transformation which allowed for HBV antibody accumulation in the host plants. Furthermore, downstream extraction and purification costs were also not included. The authors are aware that these costs must be considered in future research, and that the profitability of Scenario TT and Scenario TTD would decrease because of it.
Lastly, Scenario CC showed the highest return on investment of all the developed plant factory scenarios. This was attributed to the high-value nature of cannabis seeds and plants [96,113,114]. The economic feasibility of Scenario CC is dependent on country-specific regulations and legislation regarding the cultivation and consumption of cannabis. The legality of cannabis varies significantly between countries and limits the market potential of Scenario CC, but an investigation into country-specific legislation regarding cannabis cultivation was beyond the scope of this paper.
The authors are aware that comments made regarding the economic feasibility of plant factory scenarios, which extend beyond the food market, are in the context and within the limitations of the economic model in this paper. The most significant limitations are the omission of upstream and downstream processing steps, which will influence the final economic indexes of plant factory scenarios. These omissions are considered as work for future research into the economic modelling of plant factory scenarios.

5.5. Implications and Limitations

This paper was used to explore plant factory scenarios which produced crops and value-added compounds for multiple markets within the biorefining industry. These scenarios were evaluated for economic feasibility and provided a range of crops and value-added compounds which showed favourable economic conditions through cultivation within the plant factory system, particularly when considering the TM, TT, and TTD scenarios, which accumulated biopharmaceutical products within plants grown in the plant factories. This paper explored crop and product selections for plant factories which have not been evaluated previously for economic feasibility and, as such, contributes towards the body of knowledge for expanding the market potential of plant factories.
As this paper is aimed at expanding the range of applications of plant factory structures, it required some novel approaches to be taken in terms of defining the plant factory system boundary and exploring its applications beyond that of food production. Some of the most significant scientific contributions to the existing body of knowledge included the following:
  • Exploring how the plant factory system boundary can be conceptualised to show dependencies within the greater economy;
  • Contributing to the debate around the use of plant factories by providing a new perspective to the applicability of the plant factory concept within the greater biorefining industry.
The practical contributions, for practitioners of plant factory cultivation, are a novel plant factory system boundary which can be used in the assessment of new or existing plant factory projects and an expansion of the crop and product selection process for plant factories which considers crop value in terms of value-added compound accumulation levels and pricing in markets other than the food market. It is envisioned that the combination of scientific and practical contributions can be used to help in the design and implementation of plant factory projects of practitioners that wish to expand beyond the food market.
Throughout this research, several deficiencies were found in the literature and due to the constraints of this paper. These deficiencies and constraints are listed and presented as recommendations for future research:
  • The initial review of the plant factory literature in Section 2 alluded to the fact that crop yield data were not easily available for crops grown in plant factories. Directly comparable results of crop yields and cultivation conditions under varying degrees of CEA were even more scarce. This paper had to use best-available crop data to populate the economic model, which approximated the crop growth rates under specific cultivation conditions. Future research can include the standardised cultivation of various crops to draw a clear correlation between crop growth performance and the level of environmental control provided by CEA structures.
  • The economic feasibility analysis of this paper considered the costs associated with operating plant factories within the defined scenarios. The revenue potential of these scenarios was based on the revenue potential of the final products which would be produced within the cultivated biomass in each plant factory. This paper calculated capital for uncertainty to put the economic indexes of each scenario in the context of the omitted expenses of the economic model. Future research can include the expansion of the economic feasibility analysis to include the downstream processing steps which were omitted from the analysis. This will lead to a more detailed techno-economic analysis which includes the extraction and purification costs of value-added compounds from host plants.
  • The economic feasibility analysis also only considered monocultures within a specific scenario. Future research can include the investigation of contract farming within plant factories and the simultaneous cultivation of different crops to produce a variety of products for multiple markets.

6. Conclusions

This paper was explorative in nature while aiming to expand the economic potential of plant factories beyond the food market. Novel plant factory scenarios with crop and value-added product combinations were investigated for economic feasibility. The novel scenarios required a plant factory system boundary which was able to describe the scenarios and an economic model which was able to illustrate the economic potential of the proposed plant factory markets. The appropriateness of the plant factory system boundary and economic model which were used in this paper was illustrated by showing economic feasibility of well-defined plant factory scenarios which serviced the food market.
Based on the scenarios which were investigated, multiple combinations of crops and value-added compounds showed favourable economic conditions in plant factories, and it was concluded that the biopharmaceutical industry was well positioned to leverage the environmental control and insulation of plant factories to produce high-value biopharmaceutical products. This paper contributed towards the body of knowledge of plant factories by exploring its application to markets within the biorefining industry. This was achieved by identifying and proposing novel plant factory scenarios and by evaluating the economic feasibility of plant factories within markets other than the food market. At the time of writing this paper, the majority of the economic literature related to plant factories was in the context of producing edible biomass for the food market.

Supplementary Materials

The following supporting information can be downloaded at: https://www.mdpi.com/article/10.3390/su15021324/s1. Additional information can be found in the Supplementary Materials document, and includes ancillary information, such as the assumptions and technical specification which were used to perform the economic feasibility analyses. This information is shown in Table S1: Plant factory design and operational considerations; Table S2: Supply chain considerations as part of a plant factory system boundary; Table S3: Biorefining market considerations for plant factory projects; Table S4: Economic model assumptions; Table S5: General information used in the plant factory model; Table S6: The plant factory footprint (1000 m2) components equated to typical structure construction costs in South Africa; Table S7: Plant factory cost estimates and calculated cost per grow level; Table S8: Fertigation system cost calculations; Table S9: Monitor and control cost calculations; Table S10: Salary and position breakdowns; Table S11: LED light system specifications and electricity use; Table S12: Electricity pricing structure; Table S13: HVAC calculations for plant factory scenarios; Table S14: Water consumption and fertiliser data for plant factory scenarios; Table S15: Growth media and seed demand for plant factory scenarios; Table S16: CO2 supplement for plant factory scenarios; Table S17: Plant factory dimension descriptions for each scenario; Table S18: Miraculin cost estimates based on miracle berry prices and sucrose equivalency; Table S19: Tomato-based plant factory yields and market values; Table S20: Lettuce-based plant factory yields and market values; Table S21: Tobacco-based plant factory yields and market values; Table S22: Cannabis-based plant factory yields and market values; Figure S1: The sensitivity of cost of goods sold (COGS) values for the tomato—food (TF) plant factory scenario; Figure S2: The sensitivity of cost of goods sold (COGS) values for the tomato—miraculin (TM) plant factory scenario; Figure S3: The sensitivity of cost of goods sold (COGS) values for the lettuce—food (LF) plant factory scenario; Figure S4: Probability density distributions of the cost of goods sold (COGS) for the tobacco—conventional (TC), tobacco—PHB (TPHB), tobacco—transgenic (TT), and tobacco—transgenic—dwarf (TTD) plant factory scenarios; Figure S5: The sensitivity of cost of goods sold (COGS) values for the tobacco—conventional (TC) plant factory scenario; Figure S6: The sensitivity of cost of goods sold (COGS) values for the tobacco—PHB (TPHB) plant factory scenario; Figure S7: The sensitivity of cost of goods sold (COGS) values for the tobacco—transgenic (TT) plant factory scenario; Figure S8: The sensitivity of cost of goods sold (COGS) values for the tobacco—transgenic—dwarf (TTD) plant factory scenario; Figure S9: The sensitivity of cost of goods sold (COGS) values for the cannabis—conventional (CC) plant factory scenario; Figure S10: Probability density distribution of the return on investment (ROI) for the lettuce—food (LF) scenario based on hydroponic pricing; Figure S11: The sensitivity of return on investment (ROI) for the lettuce—food (LF) plant factory scenario; Figure S12: Probability density distribution of the return on investment (ROI) for cannabis—conventional (CC) scenario based on hydroponic pricing.

Author Contributions

Conceptualisation, H.P. and L.L.; methodology, H.P.; software, L.L.; data curation, H.P.; writing—original draft preparation, H.P.; writing—review and editing, H.P. and L.L.; visualisation, H.P.; supervision, L.L. All authors have read and agreed to the published version of the manuscript.

Funding

This research received no external funding.

Institutional Review Board Statement

Not applicable.

Informed Consent Statement

Not applicable.

Data Availability Statement

Data used to populate the economic model in this paper are reported in the main text and in the Supplementary Materials document.

Conflicts of Interest

The authors declare no conflict of interest.

References

  1. Kuswardhani, N.; Soni, P.; Shivakoti, G.P. Comparative Energy Input–Output and Financial Analyses of Greenhouse and Open Field Vegetables Production in West Java, Indonesia. Energy 2013, 53, 83–92. [Google Scholar] [CrossRef]
  2. Kalantari, F.; Tahir, O.M.; Joni, R.A.; Fatemi, E. Opportunities and Challenges in Sustainability of Vertical Farming: A Review. J. Landsc. Ecol. 2018, 11, 35–60. [Google Scholar] [CrossRef] [Green Version]
  3. Muller, A.; Ferré, M.; Engel, S.; Gattinger, A.; Holzkämper, A.; Huber, R.; Müller, M.; Six, J. Can Soil-Less Crop Production Be a Sustainable Option for Soil Conservation and Future Agriculture? Land Use Policy 2017, 69, 102–105. [Google Scholar] [CrossRef]
  4. D’Adamo, I.; Gastaldi, M.; Morone, P.; Rosa, P.; Sassanelli, C.; Settembre-Blundo, D.; Shen, Y. Bioeconomy of Sustainability: Drivers, Opportunities and Policy Implications. Sustainability 2021, 14, 200. [Google Scholar] [CrossRef]
  5. Engler, N.; Krarti, M. Review of Energy Efficiency in Controlled Environment Agriculture. Renew. Sustain. Energy Rev. 2021, 141, 110786. [Google Scholar] [CrossRef]
  6. Goodman, W.; Minner, J. Will the Urban Agricultural Revolution Be Vertical and Soilless? A Case Study of Controlled Environment Agriculture in New York City. Land Use Policy 2019, 83, 160–173. [Google Scholar] [CrossRef]
  7. Zeidler, C.; Schubert, D.; Vrakking, V. Vertical Farm 2.0: Designing an Economically Feasible Vertical Farm-A Combined European Endeavor for Sustainable Urban Agriculture. Available online: https://www.researchgate.net/publication/321427717 (accessed on 11 October 2020).
  8. Li, L.; Li, X.; Chong, C.; Wang, C.-H.; Wang, X. A Decision Support Framework for the Design and Operation of Sustainable Urban Farming Systems. J. Clean. Prod. 2020, 268, 121928. [Google Scholar] [CrossRef]
  9. Hu, M.-C.; Chen, Y.-H.; Huang, L.-C. A Sustainable Vegetable Supply Chain Using Plant Factories in Taiwanese Markets: A Nash–Cournot Model. Int. J. Prod. Econ. 2014, 152, 49–56. [Google Scholar] [CrossRef]
  10. De Oliveira, F.J.B.; Ferson, S.; Dyer, R. A Collaborative Decision Support System Framework for Vertical Farming Business Developments. Int. J. Decis. Support Syst. Technol. 2021, 13, 34–66. [Google Scholar] [CrossRef]
  11. Shamshiri, R.R.; Kalantari, F.; Ting, K.C.; Thorp, K.R.; Hameed, I.A.; Weltzien, C.; Ahmad, D.; Mojgan Shad, Z. Advances in Greenhouse Automation and Controlled Environment Agriculture: A Transition to Plant Factories and Urban Agriculture. Int. J. Agric. Biol. Eng. 2018, 11, 1–22. [Google Scholar] [CrossRef]
  12. Kwon, S.-Y.; Ryu, S.-H.; Lim, J.-H. Design and Implementation of an Integrated Management System in a Plant Factory to Save Energy. Clust. Comput. 2014, 17, 727–740. [Google Scholar] [CrossRef]
  13. Halgamuge, M.N.; Bojovschi, A.; Fisher, P.M.J.; Le, T.C.; Adeloju, S.; Murphy, S. Internet of Things and Autonomous Control for Vertical Cultivation Walls towards Smart Food Growing: A Review. Urban For. Urban Green. 2021, 61, 127094. [Google Scholar] [CrossRef]
  14. Graamans, L.; Baeza, E.; van den Dobbelsteen, A.; Tsafaras, I.; Stanghellini, C. Plant Factories versus Greenhouses: Comparison of Resource Use Efficiency. Agric. Syst. 2018, 160, 31–43. [Google Scholar] [CrossRef]
  15. Graamans, L.; van den Dobbelsteen, A.; Meinen, E.; Stanghellini, C. Plant Factories; Crop Transpiration and Energy Balance. Agric. Syst. 2017, 153, 138–147. [Google Scholar] [CrossRef]
  16. Martin, M.; Poulikidou, S.; Molin, E. Exploring the Environmental Performance of Urban Symbiosis for Vertical Hydroponic Farming. Sustainability 2019, 11, 6724. [Google Scholar] [CrossRef] [Green Version]
  17. Martin, M.; Svensson, N.; Eklund, M. Who Gets the Benefits? An Approach for Assessing the Environmental Performance of Industrial Symbiosis. J. Clean. Prod. 2015, 98, 263–271. [Google Scholar] [CrossRef] [Green Version]
  18. de Oliveira, F.J.B.; Ferson, S.; Dyer, R.A.D.; Thomas, J.M.H.; Myers, P.D.; Gray, N.G. How High Is High Enough? Assessing Financial Risk for Vertical Farms Using Imprecise Probability. Sustainability 2022, 14, 5676. [Google Scholar] [CrossRef]
  19. Benke, K.; Tomkins, B. Future Food-Production Systems: Vertical Farming and Controlled-Environment Agriculture. Sustain. Sci. Pract. Policy 2017, 13, 13–26. [Google Scholar] [CrossRef] [Green Version]
  20. Orsini, F.; Pennisi, G.; Zulfiqar, F.; Gianquinto, G. Sustainable Use of Resources in Plant Factories with Artificial Lighting (PFALs). Eur. J. Hortic. Sci. 2020, 85, 297–309. [Google Scholar] [CrossRef]
  21. Martin, M.; Weidner, T.; Gullström, C. Estimating the Potential of Building Integration and Regional Synergies to Improve the Environmental Performance of Urban Vertical Farming. Front. Sustain. Food Syst. 2022, 6, 1–18. [Google Scholar] [CrossRef]
  22. Thomson, A.; Price, G.W.; Arnold, P.; Dixon, M.; Graham, T. Review of the Potential for Recycling CO2 from Organic Waste Composting into Plant Production under Controlled Environment Agriculture. J. Clean. Prod. 2022, 333, 130051. [Google Scholar] [CrossRef]
  23. Benis, K.; Ferrão, P. Commercial Farming within the Urban Built Environment—Taking Stock of an Evolving Field in Northern Countries. Glob. Food Sec. 2018, 17, 30–37. [Google Scholar] [CrossRef]
  24. Santiteerakul, S.; Sopadang, A.; Tippayawong, K.Y.; Tamvimol, K. The Role of Smart Technology in Sustainable Agriculture: A Case Study of Wangree Plant Factory. Sustainability 2020, 12, 4640. [Google Scholar] [CrossRef]
  25. Martin, M.; Molin, E. Environmental Assessment of an Urban Vertical Hydroponic Farming System in Sweden. Sustainability 2019, 11, 4124. [Google Scholar] [CrossRef] [Green Version]
  26. Srai, J.S.; Tsolakis, N.; Kumar, M.; Bam, W. Circular Supply Chains and Renewable Chemical Feedstocks: A Network Configuration Analysis Framework. Prod. Plan. Control 2018, 29, 464–482. [Google Scholar] [CrossRef]
  27. De Jong, E.; Higson, A.; Walsh, P.; Wellisch, M. Task 42 Biobased Chemicals—Value Added Products from Biorefineries. 2011. Available online: https://www.wur.nl/en/show/IEA-Bioenergy-Task-42-Biorefining-Sustainable-processing-of-biomass-into-Biobased-Products-and-Bioenergy.htm (accessed on 11 October 2020).
  28. Niu, G.; Masabni, J. Plant Production in Controlled Environments. Horticulturae 2018, 4, 28. [Google Scholar] [CrossRef] [Green Version]
  29. Iddio, E.; Wang, L.; Thomas, Y.; McMorrow, G.; Denzer, A. Energy Efficient Operation and Modeling for Greenhouses: A Literature Review. Renew. Sustain. Energy Rev. 2020, 117, 109480. [Google Scholar] [CrossRef]
  30. Kozai, T. Smart Plant Factory; Kozai, T., Ed.; Springer: Singapore, 2018; ISBN 978-981-13-1064-5. [Google Scholar]
  31. Allardyce, C.S.; Fankhauser, C.; Zakeeruddin, S.M.; Grätzel, M.; Dyson, P.J. The Influence of Greenhouse-Integrated Photovoltaics on Crop Production. Sol. Energy 2017, 155, 517–522. [Google Scholar] [CrossRef]
  32. Gruda, N.; Bisbis, M.; Tanny, J. Influence of Climate Change on Protected Cultivation: Impacts and Sustainable Adaptation Strategies—A Review. J. Clean. Prod. 2019, 225, 481–495. [Google Scholar] [CrossRef]
  33. Khoshnevisan, B.; Shariati, H.M.; Rafiee, S.; Mousazadeh, H. Comparison of Energy Consumption and GHG Emissions of Open Field and Greenhouse Strawberry Production. Renew. Sustain. Energy Rev. 2014, 29, 316–324. [Google Scholar] [CrossRef]
  34. Bartzas, G.; Zaharaki, D.; Komnitsas, K. Life Cycle Assessment of Open Field and Greenhouse Cultivation of Lettuce and Barley. Inf. Process. Agric. 2015, 2, 191–207. [Google Scholar] [CrossRef] [Green Version]
  35. Scott, N.R.; Rutzke, C.J.; Albright, L.D. Energy Conversion Options for Energy-Efficient Controlled Environment Agriculture. HortScience 2005, 40, 287–292. [Google Scholar] [CrossRef] [Green Version]
  36. Tsolakis, N.; Bam, W.; Srai, J.S.; Kumar, M. Renewable Chemical Feedstock Supply Network Design: The Case of Terpenes. J. Clean. Prod. 2019, 222, 802–822. [Google Scholar] [CrossRef]
  37. Miret, C.; Chazara, P.; Montastruc, L.; Negny, S.; Domenech, S. Design of Bioethanol Green Supply Chain: Comparison between First and Second Generation Biomass Concerning Economic, Environmental and Social Criteria. Comput. Chem. Eng. 2016, 85, 16–35. [Google Scholar] [CrossRef] [Green Version]
  38. Giarola, S.; Bezzo, F.; Shah, N. A Risk Management Approach to the Economic and Environmental Strategic Design of Ethanol Supply Chains. Biomass Bioenergy 2013, 58, 31–51. [Google Scholar] [CrossRef]
  39. Zhang, F.; Johnson, D.M.; Johnson, M.A. Development of a Simulation Model of Biomass Supply Chain for Biofuel Production. Renew. Energy 2012, 44, 380–391. [Google Scholar] [CrossRef]
  40. Perkis, D.F.; Tyner, W.E. Developing a Cellulosic Aviation Biofuel Industry in Indiana: A Market and Logistics Analysis. Energy 2018, 142, 793–802. [Google Scholar] [CrossRef]
  41. Flodén, J.; Williamsson, J. Business Models for Sustainable Biofuel Transport: The Potential for Intermodal Transport. J. Clean. Prod. 2016, 113, 426–437. [Google Scholar] [CrossRef]
  42. Ahlgren, S.; Bernesson, S.; Nordberg, Å.; Hansson, P.A. Nitrogen Fertiliser Production Based on Biogas-Energy Input, Environmental Impact and Land Use. Bioresour. Technol. 2010, 101, 7181–7184. [Google Scholar] [CrossRef] [PubMed]
  43. Moon, K.-B.; Park, J.-S.; Park, Y.-I.; Song, I.-J.; Lee, H.-J.; Cho, H.S.; Jeon, J.-H.; Kim, H.-S. Development of Systems for the Production of Plant-Derived Biopharmaceuticals. Plants 2019, 9, 30. [Google Scholar] [CrossRef]
  44. Wirz, H.; Sauer-Budge, A.F.; Briggs, J.; Sharpe, A.; Shu, S.; Sharon, A. Automated Production of Plant-Based Vaccines and Pharmaceuticals. J. Lab. Autom. 2012, 17, 449–457. [Google Scholar] [CrossRef] [PubMed]
  45. Gilbert, P.; Alexander, S.; Thornley, P.; Brammer, J. Assessing Economically Viable Carbon Reductions for the Production of Ammonia from Biomass Gasification. J. Clean. Prod. 2014, 64, 581–589. [Google Scholar] [CrossRef]
  46. Doherty, W.O.S.; Mousavioun, P.; Fellows, C.M. Value-Adding to Cellulosic Ethanol: Lignin Polymers. Ind. Crops Prod. 2011, 33, 259–276. [Google Scholar] [CrossRef] [Green Version]
  47. Cai, C.M.; Zhang, T.; Kumar, R.; Wyman, C.E. Integrated Furfural Production as a Renewable Fuel and Chemical Platform from Lignocellulosic Biomass. J. Chem. Technol. Biotechnol. 2014, 89, 2–10. [Google Scholar] [CrossRef]
  48. Rout, P.K.; Nannaware, A.D.; Prakash, O.; Kalra, A.; Rajasekharan, R. Synthesis of Hydroxymethylfurfural from Cellulose Using Green Processes: A Promising Biochemical and Biofuel Feedstock. Chem. Eng. Sci. 2016, 142, 318–346. [Google Scholar] [CrossRef]
  49. Rosales-Calderon, O.; Arantes, V. A Review on Commercial-Scale High-Value Products That Can Be Produced alongside Cellulosic Ethanol. Biotechnol. Biofuels 2019, 12, 240. [Google Scholar] [CrossRef] [Green Version]
  50. Putro, J.N.; Soetaredjo, F.E.; Lin, S.-Y.; Ju, Y.-H.; Ismadji, S. Pretreatment and Conversion of Lignocellulose Biomass into Valuable Chemicals. RSC Adv. 2016, 6, 46834–46852. [Google Scholar] [CrossRef]
  51. Yang, M.; Baral, N.R.; Simmons, B.A.; Mortimer, J.C.; Shih, P.M.; Scown, C.D. Accumulation of High-Value Bioproducts in Planta Can Improve the Economics of Advanced Biofuels. Proc. Natl. Acad. Sci. USA 2020, 117, 8639–8648. [Google Scholar] [CrossRef] [Green Version]
  52. Swart, W.J. The Economic Feasibility of Commercial Biodiesel Production in South Africa including Sensitivity Analyses of Important Production and Related Parameters; Stellenbosch University: Stellenbosch, South Africa, 2012. [Google Scholar]
  53. Weidner, T.; Yang, A.; Hamm, M.W. Energy Optimisation of Plant Factories and Greenhouses for Different Climatic Conditions. Energy Convers. Manag. 2021, 243, 114336. [Google Scholar] [CrossRef]
  54. Xydis, G.A.; Liaros, S.; Avgoustaki, D.D. Small Scale Plant Factories with Artificial Lighting and Wind Energy Microgeneration: A Multiple Revenue Stream Approach. J. Clean. Prod. 2020, 255, 120227. [Google Scholar] [CrossRef]
  55. Hwang, H.; An, S.; Pham, M.D.; Cui, M.; Chun, C. The Combined Conditions of Photoperiod, Light Intensity, and Air Temperature Control the Growth and Development of Tomato and Red Pepper Seedlings in a Closed Transplant Production System. Sustainability 2020, 12, 9939. [Google Scholar] [CrossRef]
  56. Hiwasa-Tanase, K.; Hirai, T.; Kato, K.; Duhita, N.; Ezura, H. From Miracle Fruit to Transgenic Tomato: Mass Production of the Taste-Modifying Protein Miraculin in Transgenic Plants. Plant Cell Rep. 2012, 31, 513–525. [Google Scholar] [CrossRef] [PubMed]
  57. Hiwasa-Tanase, K.; Ezura, H. Molecular Breeding to Create Optimized Crops: From Genetic Manipulation to Potential Applications in Plant Factories. Front. Plant Sci. 2016, 7, 1–7. [Google Scholar] [CrossRef] [PubMed] [Green Version]
  58. Shiina, T.; Hosokawa, D.; Roy, P.; Nakamura, N.; Thammawong, M.; Orikasa, T. Life Cycle Inventory Analysis of Leafy Vegetables Grown in Two Types of Plant Factories. Acta Hortic. 2011, 919, 115–122. [Google Scholar] [CrossRef]
  59. Malhotra, K.; Subramaniyan, M.; Rawat, K.; Kalamuddin, M.; Qureshi, M.I.; Malhotra, P.; Mohmmed, A.; Cornish, K.; Daniell, H.; Kumar, S. Compartmentalized Metabolic Engineering for Artemisinin Biosynthesis and Effective Malaria Treatment by Oral Delivery of Plant Cells. Mol. Plant 2016, 9, 1464–1477. [Google Scholar] [CrossRef] [Green Version]
  60. Bohmert-Tatarev, K.; McAvoy, S.; Daughtry, S.; Peoples, O.P.; Snell, K.D. High Levels of Bioplastic Are Produced in Fertile Transplastomic Tobacco Plants Engineered with a Synthetic Operon for the Production of Polyhydroxybutyrate. Plant Physiol. 2011, 155, 1690–1708. [Google Scholar] [CrossRef] [Green Version]
  61. Shanmugaraj, B.; Bulaon, C.J.I.; Phoolcharoen, W. Plant Molecular Farming: A Viable Platform for Recombinant Biopharmaceutical Production. Plants 2020, 9, 842. [Google Scholar] [CrossRef]
  62. Nagatoshi, Y.; Ikeda, M.; Kishi, H.; Hiratsu, K.; Muraguchi, A.; Ohme-Takagi, M. Induction of a Dwarf Phenotype with IBH1 May Enable Increased Production of Plant-Made Pharmaceuticals in Plant Factory Conditions. Plant Biotechnol. J. 2016, 14, 887–894. [Google Scholar] [CrossRef]
  63. Meher, K.K.; Panchwagh, A.M.; Rangrass, S.; Gollakota, K.G. Biomethanation of Tobacco Waste. Environ. Pollut. 1995, 90, 199–202. [Google Scholar] [CrossRef]
  64. Grisan, S.; Polizzotto, R.; Raiola, P.; Cristiani, S.; Ventura, F.; di Lucia, F.; Zuin, M.; Tommasini, S.; Morbidelli, R.; Damiani, F.; et al. Alternative Use of Tobacco as a Sustainable Crop for Seed Oil, Biofuel, and Biomass. Agron. Sustain. Dev. 2016, 36, 55. [Google Scholar] [CrossRef]
  65. Carvalho, F.S.; Fornasier, F.; Leitão, J.O.M.; Moraes, J.A.R.; Schneider, R.C.S. Life Cycle Assessment of Biodiesel Production from Solaris Seed Tobacco. J. Clean. Prod. 2019, 230, 1085–1095. [Google Scholar] [CrossRef]
  66. Vanhove, W.; Van Damme, P.; Meert, N. Factors Determining Yield and Quality of Illicit Indoor Cannabis (Cannabis spp.) Production. Forensic Sci. Int. 2011, 212, 158–163. [Google Scholar] [CrossRef] [PubMed]
  67. Andre, C.M.; Hausman, J.-F.; Guerriero, G. Cannabis Sativa: The Plant of the Thousand and One Molecules. Front. Plant Sci. 2016, 7, 1–17. [Google Scholar] [CrossRef] [PubMed] [Green Version]
  68. Touliatos, D.; Dodd, I.C.; McAinsh, M. Vertical Farming Increases Lettuce Yield per Unit Area Compared to Conventional Horizontal Hydroponics. Food Energy Secur. 2016, 5, 184–191. [Google Scholar] [CrossRef] [PubMed] [Green Version]
  69. Twyman, R.M.; Stoger, E.; Schillberg, S.; Christou, P.; Fischer, R. Molecular Farming in Plants: Host Systems and Expression Technology. Trends Biotechnol. 2003, 21, 570–578. [Google Scholar] [CrossRef]
  70. Huebbers, J.W.; Buyel, J.F. On the Verge of the Market—Plant Factories for the Automated and Standardized Production of Biopharmaceuticals. Biotechnol. Adv. 2021, 46, 107681. [Google Scholar] [CrossRef]
  71. Mir-Artigues, P.; Twyman, R.M.; Alvarez, D.; Cerda Bennasser, P.; Balcells, M.; Christou, P.; Capell, T. A Simplified Techno-economic Model for the Molecular Pharming of Antibodies. Biotechnol. Bioeng. 2019, 116, 2526–2539. [Google Scholar] [CrossRef]
  72. Antibodies Hepatitis B Virus Antibody. Available online: https://www.antibodies-online.com/antibody/5579718/anti-Hepatitis+B+Virus+HBV+antibody/ (accessed on 7 October 2022).
  73. Antibodies Hepatitis B Virus Antibody. Available online: https://www.antibodies-online.com/antibody/3027643/anti-Hepatitis+B+Virus+HBV+antibody/ (accessed on 7 October 2022).
  74. Hirai, T.; Kurokawa, N.; Duhita, N.; Hiwasa-Tanase, K.; Kato, K.; Kato, K.; Ezura, H. The HSP Terminator of Arabidopsis Thaliana Induces a High Level of Miraculin Accumulation in Transgenic Tomatoes. J. Agric. Food Chem. 2011, 59, 9942–9949. [Google Scholar] [CrossRef]
  75. Sun, H.-J.; Cui, M.; Ma, B.; Ezura, H. Functional Expression of the Taste-Modifying Protein, Miraculin, in Transgenic Lettuce. FEBS Lett. 2006, 580, 620–626. [Google Scholar] [CrossRef] [Green Version]
  76. McAdam, B.; Brennan Fournet, M.; McDonald, P.; Mojicevic, M. Production of Polyhydroxybutyrate (PHB) and Factors Impacting Its Chemical and Mechanical Characteristics. Polymers 2020, 12, 2908. [Google Scholar] [CrossRef]
  77. Fatica, A.; Di Lucia, F.; Marino, S.; Alvino, A.; Zuin, M.; De Feijter, H.; Brandt, B.; Tommasini, S.; Fantuz, F.; Salimei, E. Study on Analytical Characteristics of Nicotiana Tabacum L., Cv. Solaris Biomass for Potential Uses in Nutrition and Biomethane Production. Sci. Rep. 2019, 9, 16828. [Google Scholar] [CrossRef] [PubMed] [Green Version]
  78. Matassa, S.; Esposito, G.; Pirozzi, F.; Papirio, S. Exploring the Biomethane Potential of Different Industrial Hemp (Cannabis Sativa L.) Biomass Residues. Energies 2020, 13, 3361. [Google Scholar] [CrossRef]
  79. Anctil, A.; Lee, E.; Lunt, R.R. Net Energy and Cost Benefit of Transparent Organic Solar Cells in Building-Integrated Applications. Appl. Energy 2020, 261, 114429. [Google Scholar] [CrossRef]
  80. Riera-Vila, I.; Anderson, N.O.; Hodge, C.F.; Rogers, M. Anaerobically-Digested Brewery Wastewater as a Nutrient Solution for Substrate-Based Food Production. Horticulturae 2019, 5, 43. [Google Scholar] [CrossRef] [Green Version]
  81. Amigun, B.; Petrie, D.; Gorgens, J. Economic Risk Assessment of Advanced Process Technologies for Bioethanol Production in South Africa: Monte Carlo Analysis. Renew. Energy 2011, 36, 3178–3186. [Google Scholar] [CrossRef]
  82. Kim, J.; Realff, M.J.; Lee, J.H. Optimal Design and Global Sensitivity Analysis of Biomass Supply Chain Networks for Biofuels under Uncertainty. Comput. Chem. Eng. 2011, 35, 1738–1751. [Google Scholar] [CrossRef]
  83. Souza, S.V.; Gimenes, R.M.T.; Binotto, E. Economic Viability for Deploying Hydroponic System in Emerging Countries: A Differentiated Risk Adjustment Proposal. Land Use Policy 2019, 83, 357–369. [Google Scholar] [CrossRef]
  84. Resurreccion, E.P.; Roostaei, J.; Martin, M.J.; Maglinao, R.L.; Zhang, Y.; Kumar, S. The Case for Camelina-Derived Aviation Biofuel: Sustainability Underpinnings from a Holistic Assessment Approach. Ind. Crops Prod. 2021, 170, 113777. [Google Scholar] [CrossRef]
  85. Hao, X.; Guo, X.; Zheng, J.; Celeste, L.; Kholsa, S.; Chen, X. Response of Greenhouse Tomato to Different Vertical Spectra of LED Lighting under Overhead High Pressure Sodium and Plasma Lighting. Acta Hortic. 2017, 1170, 1003–1110. [Google Scholar] [CrossRef]
  86. Kato, K.; Maruyama, S.; Hirai, T.; Hiwasa-Tanase, K.; Mizoguchi, T.; Goto, E.; Ezura, H. A Trial of Production of the Plant-Derived High-Value Protein in a Plant Factory. Plant Signal. Behav. 2011, 6, 1172–1179. [Google Scholar] [CrossRef] [PubMed]
  87. Li, L.; Tong, Y.; Lu, J.; Li, Y.; Yang, Q. Lettuce Growth, Nutritional Quality, and Energy Use Efficiency as Affected by Red–Blue Light Combined with Different Monochromatic Wavelengths. HortScience 2020, 55, 613–620. [Google Scholar] [CrossRef] [Green Version]
  88. Chowdhury, S.P.; Dietel, K.; Rändler, M.; Schmid, M.; Junge, H.; Borriss, R.; Hartmann, A.; Grosch, R. Effects of Bacillus Amyloliquefaciens FZB42 on Lettuce Growth and Health under Pathogen Pressure and Its Impact on the Rhizosphere Bacterial Community. PLoS One 2013, 8, e68818. [Google Scholar] [CrossRef] [PubMed] [Green Version]
  89. Yamori, W.; Evans, J.R.; Von Caemmerer, S. Effects of Growth and Measurement Light Intensities on Temperature Dependence of CO(2) Assimilation Rate in Tobacco Leaves. Plant. Cell Environ. 2010, 33, 332–343. [Google Scholar] [CrossRef] [PubMed]
  90. Fu, X.; Ye, L.; Kang, L.; Ge, F. Elevated CO2 Shifts the Focus of Tobacco Plant Defences from Cucumber Mosaic Virus to the Green Peach Aphid. Plant. Cell Environ. 2010, 33, 2056–2064. [Google Scholar] [CrossRef] [PubMed] [Green Version]
  91. Lee, M.; Boyd, R.A.; Ort, D.R. The Photosynthetic Response of C 3 and C 4 Bioenergy Grass Species to Fluctuating Light. GCB Bioenergy 2022, 14, 37–53. [Google Scholar] [CrossRef]
  92. McMurtrey, J.E. Tobacco. Available online: https://www.britannica.com/plant/common-tobacco (accessed on 11 February 2022).
  93. Naim-Feil, E.; Pembleton, L.W.; Spooner, L.E.; Malthouse, A.L.; Miner, A.; Quinn, M.; Polotnianka, R.M.; Baillie, R.C.; Spangenberg, G.C.; Cogan, N.O.I. The Characterization of Key Physiological Traits of Medicinal Cannabis (Cannabis Sativa L.) as a Tool for Precision Breeding. BMC Plant Biol. 2021, 21, 294. [Google Scholar] [CrossRef] [PubMed]
  94. Moscariello, C.; Matassa, S.; Esposito, G.; Papirio, S. From Residue to Resource: The Multifaceted Environmental and Bioeconomy Potential of Industrial Hemp (Cannabis Sativa L.). Resour. Conserv. Recycl. 2021, 175, 105864. [Google Scholar] [CrossRef]
  95. SolarAdvice Solar Panels. Available online: https://solaradvice.co.za/shop/solar-power/solar-panels (accessed on 14 October 2022).
  96. WeedSeedsExpress Cannabis Seeds Price List. Available online: https://weedseedsexpress.com/price-list-cannabis-seeds (accessed on 26 September 2022).
  97. Shao, Y.; Heath, T.; Zhu, Y. Developing an Economic Estimation System for Vertical Farms. Int. J. Agric. Environ. Inf. Syst. 2016, 7, 26–51. [Google Scholar] [CrossRef]
  98. Kato, K.; Yoshida, R.; Kikuzaki, A.; Hirai, T.; Kuroda, H.; Hiwasa-Tanase, K.; Takane, K.; Ezura, H.; Mizoguchi, T. Molecular Breeding of Tomato Lines for Mass Production of Miraculin in a Plant Factory. J. Agric. Food Chem. 2010, 58, 9505–9510. [Google Scholar] [CrossRef]
  99. Abcam Recombinant Miraculin Protein (His Tag) (Ab235869). Available online: https://www.abcam.com/recombinant-miraculin-protein-his-tag-ab235869.html (accessed on 27 August 2022).
  100. BioCrick Miraculin, Recombinant Protein Catalog# BCP20013. Available online: https://www.biocrick.com/Miraculin-Recombinant-Protein--BCP20013.html (accessed on 27 August 2022).
  101. Duhita, N.; Hiwasa-Tanase, K.; Yoshida, S.; Ezura, H. Single-Step Purification of Native Miraculin Using Immobilized Metal-Affinity Chromatography. J. Agric. Food Chem. 2009, 57, 5148–5151. [Google Scholar] [CrossRef]
  102. Duhita, N.; Hiwasa-Tanase, K.; Yoshida, S.; Ezura, H. A Simple Method for Purifying Undenatured Miraculin from Transgenic Tomato Fruit. Plant Biotechnol. 2011, 28, 281–286. [Google Scholar] [CrossRef] [Green Version]
  103. Lopez-Arenas, T.; González-Contreras, M.; Anaya-Reza, O.; Sales-Cruz, M. Analysis of the Fermentation Strategy and Its Impact on the Economics of the Production Process of PHB (Polyhydroxybutyrate). Comput. Chem. Eng. 2017, 107, 140–150. [Google Scholar] [CrossRef]
  104. LeBlanc, Z.; Waterhouse, P.; Bally, J. Plant-Based Vaccines: The Way Ahead? Viruses 2020, 13, 5. [Google Scholar] [CrossRef] [PubMed]
  105. Dubey, K.K.; Luke, G.A.; Knox, C.; Kumar, P.; Pletschke, B.I.; Singh, P.K.; Shukla, P. Vaccine and Antibody Production in Plants: Developments and Computational Tools. Brief. Funct. Genom. 2018, 17, 295–307. [Google Scholar] [CrossRef] [Green Version]
  106. Milay, L.; Berman, P.; Shapira, A.; Guberman, O.; Meiri, D. Metabolic Profiling of Cannabis Secondary Metabolites for Evaluation of Optimal Postharvest Storage Conditions. Front. Plant Sci. 2020, 11, 1–15. [Google Scholar] [CrossRef]
  107. Hiwasa-Tanase, K.; Ohmura, S.; Kitazawa, N.; Ono, A.; Suzuki, T.; Ezura, H. Improvement of Recombinant Miraculin Production in Transgenic Tomato by Crossbreeding-Based Genetic Background Modification. Transgenic Res. 2022, 31, 567–578. [Google Scholar] [CrossRef]
  108. FAO. FAOSTAT. Available online: https://www.fao.org/faostat/en/#data/PP (accessed on 24 October 2021).
  109. Bohmert, K.; Balbo, I.; Kopka, J.; Mittendorf, V.; Nawrath, C.; Poirier, Y.; Tischendorf, G.; Trethewey, R.N.; Willmitzer, L. Transgenic Arabidopsis Plants Can Accumulate Polyhydroxybutyrate to up to 4% of Their Fresh Weight. Planta 2000, 211, 841–845. [Google Scholar] [CrossRef]
  110. Dobrogojski, J.; Spychalski, M.; Luciński, R.; Borek, S. Transgenic Plants as a Source of Polyhydroxyalkanoates. Acta Physiol. Plant. 2018, 40, 162. [Google Scholar] [CrossRef] [Green Version]
  111. Statista Price of Polypropylene Worldwide from 2017 to 2022. Available online: https://www.statista.com/statistics/1171084/price-polypropylene-forecast-globally/ (accessed on 28 August 2022).
  112. Nitkiewicz, T.; Wojnarowska, M.; Sołtysik, M.; Kaczmarski, A.; Witko, T.; Ingrao, C.; Guzik, M. How Sustainable Are Biopolymers? Findings from a Life Cycle Assessment of Polyhydroxyalkanoate Production from Rapeseed-Oil Derivatives. Sci. Total Environ. 2020, 749, 141279. [Google Scholar] [CrossRef]
  113. Cannabis Benchmarks U.S. Cannabis Spot Index. Available online: https://www.cannabisbenchmarks.com/reports/u-s-cannabis-spot-index-august-26-2022/ (accessed on 26 August 2022).
  114. Cannabis Benchmarks Canada Cannabis Spot Index. Available online: https://www.cannabisbenchmarks.com/reports/canada-cannabis-spot-index-august-26-2022/ (accessed on 26 August 2022).
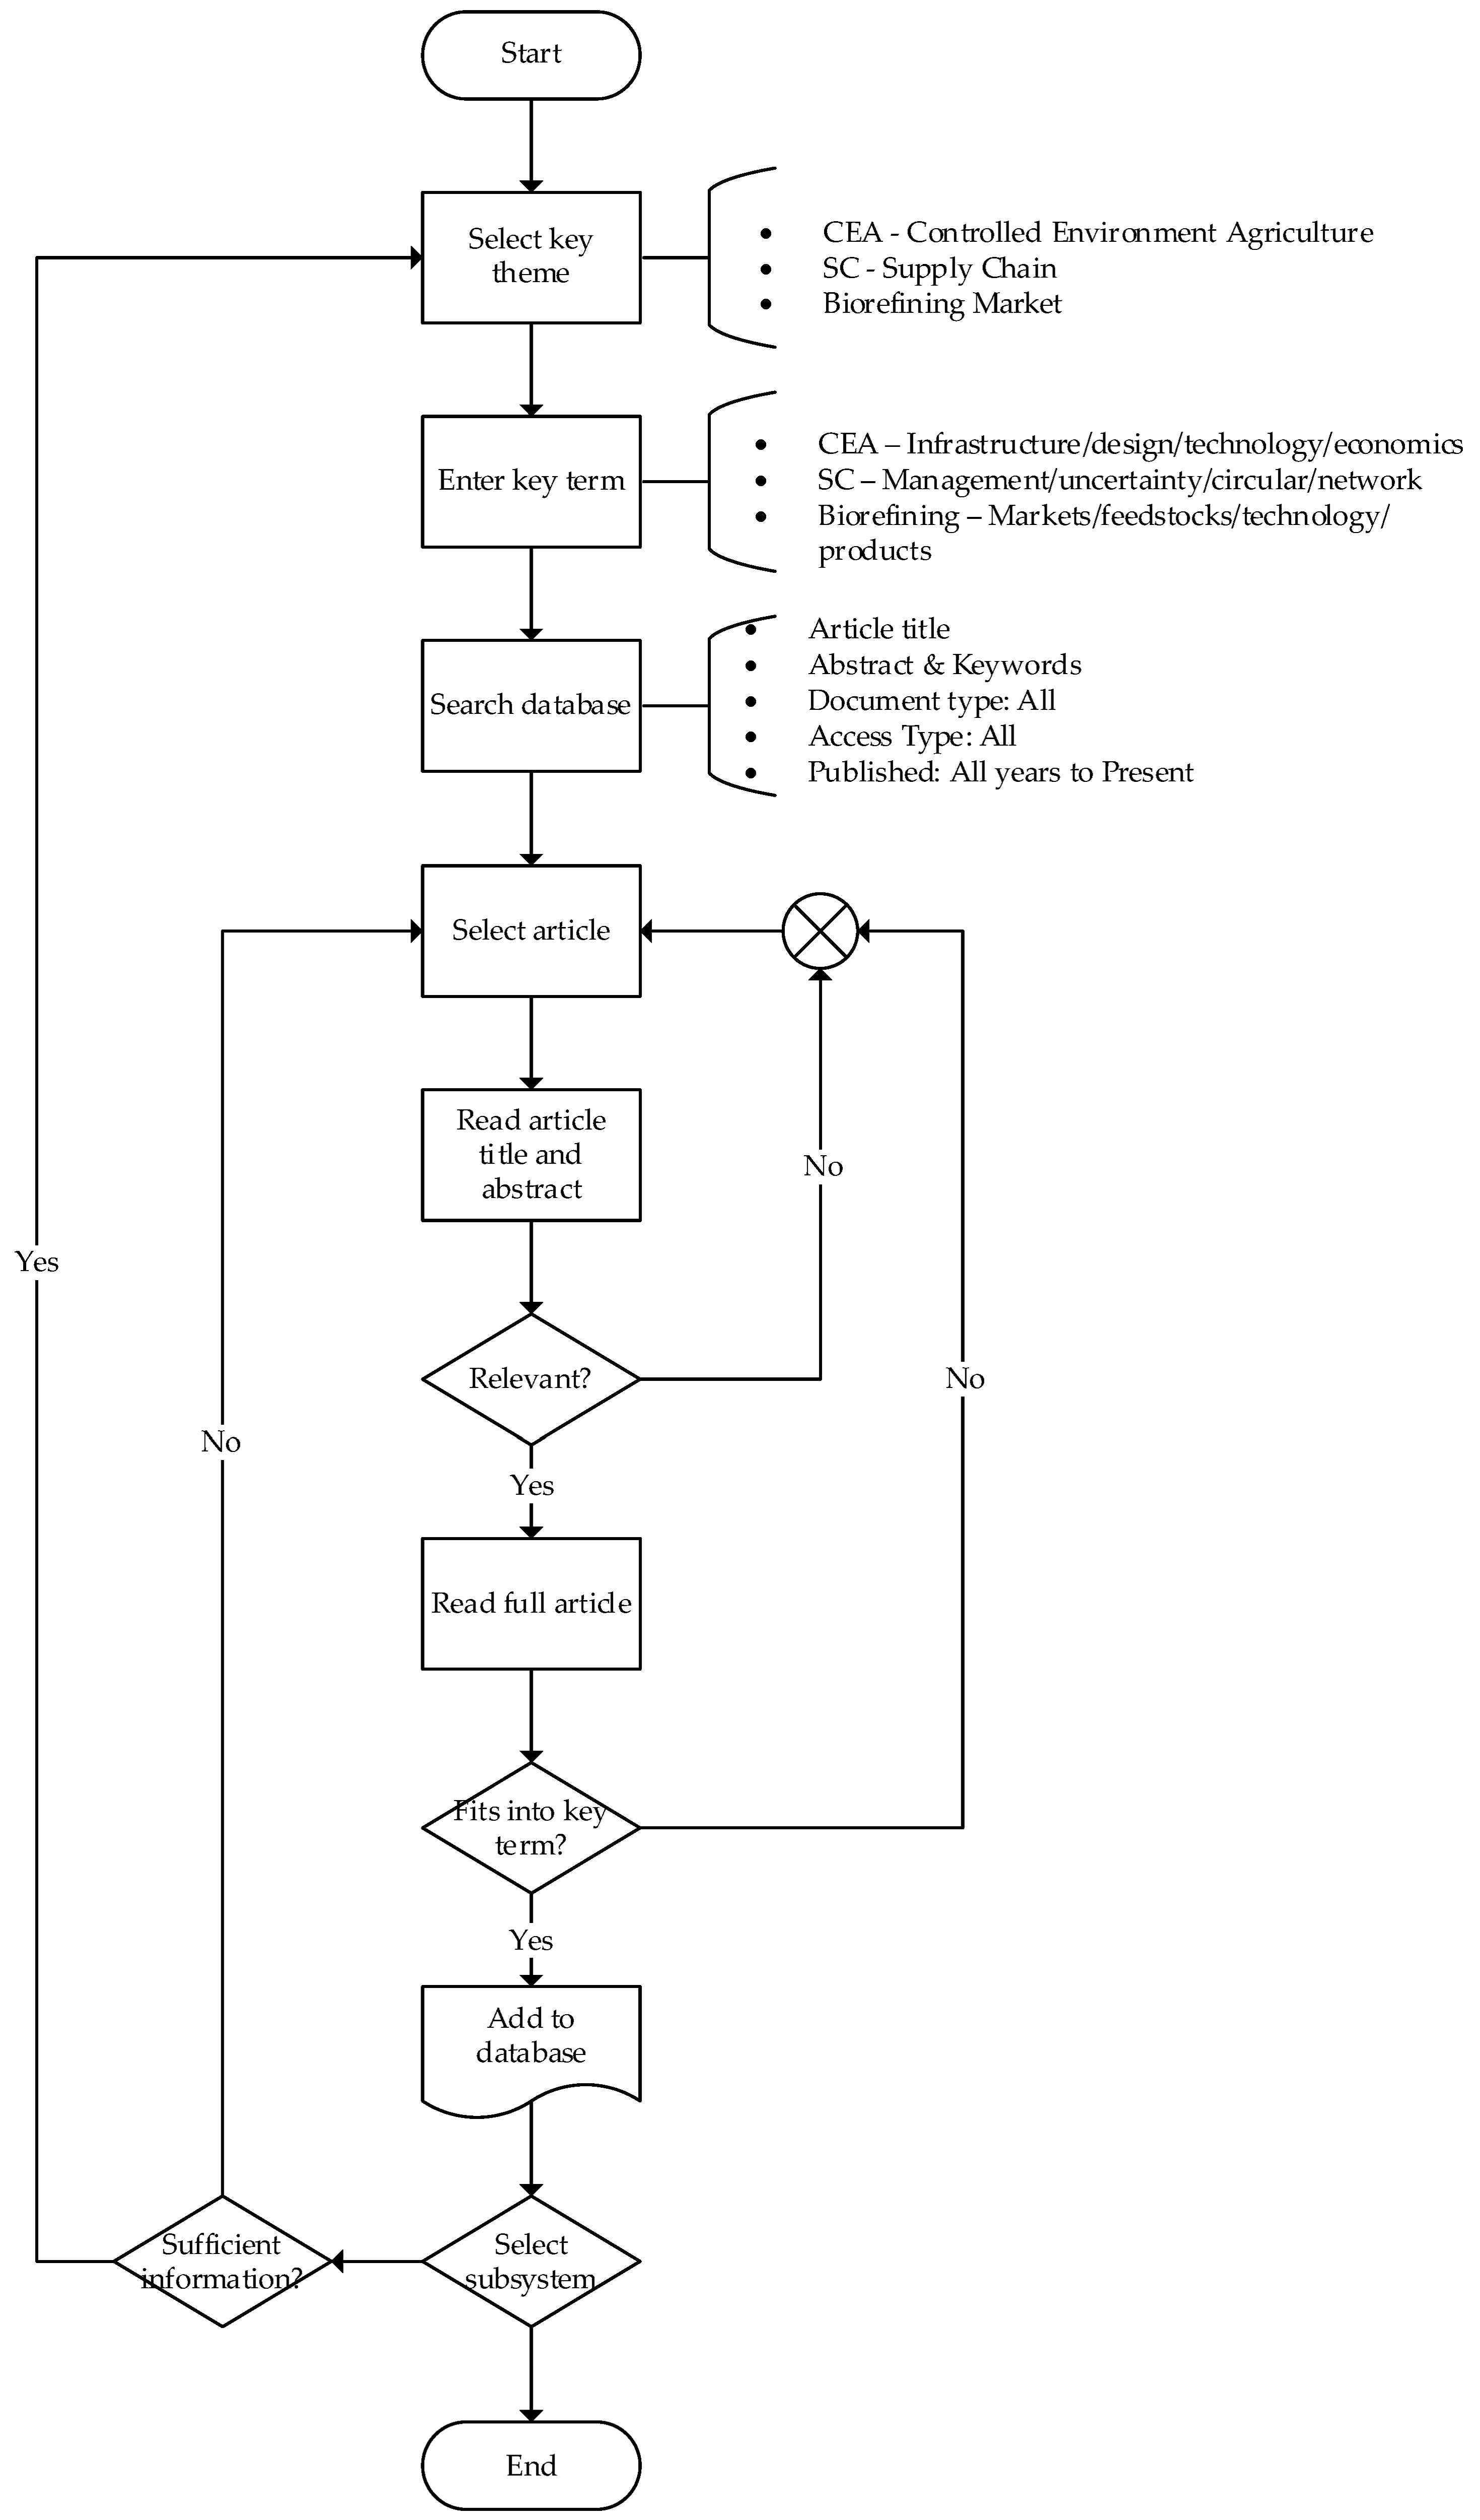
Figure 1. Literature search algorithm used to expand on the key research themes of plant factory system boundaries.
Sustainability 15 01324 g001
Figure 2. Correlating plant factory system considerations to CAPEX, OPEX, and revenue calculations.
Sustainability 15 01324 g002
Figure 3. Plant factory system boundary for evaluating the economic feasibility of plant factory scenarios by calculating the cost of biomass cultivation and revenue potential of the produced products.
Sustainability 15 01324 g003
Figure 4. Probability density distribution of the return on investment (ROI) for the tomato–food (TF) scenario based on hydroponic pricing.
Sustainability 15 01324 g004
Figure 5. The sensitivity of return on investment (ROI) for the tomato–food (TF) plant factory scenario.
Sustainability 15 01324 g005
Figure 6. Probability density distribution of the return on investment (ROI) for the tomato–miraculin (TM) scenario based on sugar equivalent pricing.
Sustainability 15 01324 g006
Figure 7. The sensitivity of return on investment (ROI) for the tomato–miraculin (TM) plant factory scenario.
Sustainability 15 01324 g007
Figure 8. Return on investment (ROI) for the tobacco–transgenic–dwarf (TTD) scenario.
Sustainability 15 01324 g008
Figure 9. The sensitivity of return on investment (ROI) for the tobacco–transgenic–dwarf (TTD) plant factory scenario.
Sustainability 15 01324 g009
Figure 10. The sensitivity of return on investment (ROI) for the cannabis–conventional (CC) plant factory scenario.
Sustainability 15 01324 g010
Table 1. Literature review of existing plant factory knowledge.
Article TypeObjectiveSelected CropsReferences
Economic
modelling
Design of an economically feasible modular vertical farmLettuce and tomatoes[7]
Assessing financial risk of vertical farms using imprecise probabilityLettuce[18]
Development of a decision support framework to help design and operate urban farming systemsLeafy greens[8]
Development of a vegetable supply chain in the urban environment using plant factoriesLeafy greens[9]
Resource/
technology
reviews
Quantify and compare resource requirements of greenhouses and plant factoriesLettuce[14]
Review of technology options available to greenhouses and plant factoriesLettuce and tomatoes[11]
Review of Internet of Things (IoT) solutions to monitor edible crop growth in vertical farmsEdible biomass, mostly leafy greens[13]
Review of differences in energy efficiencies between plant factory technology solutionsEdible biomass[5]
Review of controlled environment agriculture case studies in terms of challenges and opportunitiesLeafy greens[19]
Review of the resource use efficiencies within plant factoriesLeafy greens, highlights lack of larger crop growth data[20]
Plant factory
integration
Evaluating the industrial symbiosis of plant factories with surrounding industriesLeafy greens and herbs[21]
Evaluating the industrial symbiosis of plant factories with surrounding industries based on environmental impact measurementsLeafy greens and herbs[16]
Evaluating the integration of plant factories with on-site composting infrastructureLettuce[22]
Plant factory
assessments
Assessing the environmental, economic and social impacts of urban agricultureEdible biomass[23]
Assessing the role of IoT technology within a plant factory case studyLettuce[24]
Assessing the environmental impact of the constituent elements which make up a plant factory structure and businessEdible biomass[25]
Table 2. Main research themes identified based on the literature review.
Key Research ThemesReferences
CEA/Plant factory design and operation[1,2,8,11,28,29,30,31,32,33,34]
Supply chain under uncertainty[9,26,27,35,36,37,38,39,40,41]
Biorefining markets[27,42,43,44,45,46,47,48,49,50,51,52]
Table 3. Plant factory footprint breakdown.
Plant Factory ComponentSpace Breakdown (%)References
Germination and nursery15[54]
Growth phase bottom layer60[18,53]
Harvest, packaging, and storage15[30]
Walkways, offices, and ancillary spaces10Assumed
Total100-
Table 4. Descriptions of scenarios being evaluated for economic viability using Monte Carlo simulations.
ScenarioPlant Factory
Structure
MarketProducts
Tomato—food (TF)High-wireFoodEdible tomatoes
Tomato—miraculin (TM)Vertical farm
(five levels)
Food/
biopharmaceutical
Miraculin accumulated in
tomatoes
Lettuce—food (LF)Vertical farm
(five levels)
FoodEdible lettuce
Lettuce—miraculin (LM)Vertical farm
(five levels)
Food/
biopharmaceutical
Miraculin accumulated in lettuce
Lettuce—renewable—
integrated (LRI)
Vertical farm
(five levels)
FoodEdible lettuce, with solar panels and alternative fertiliser considered
Tobacco—conventional (TC)Vertical farm
(five levels)
Biopharmaceutical/
bio-based products
Tobacco biomass, accumulated artemisinin, biodiesel, and biomethane
Tobacco—PHB (TPHB)Vertical farm
(five levels)
Bio-based productsPolyhydroxybutyrate (PHB)
polymer accumulated in tobacco
Tobacco—transgenic (TT)Vertical farm
(five levels)
BiopharmaceuticalHepatitis B virus (HBV)
antibodies accumulated in
tobacco
Tobacco—transgenic—dwarf (TTD)Vertical farm
(five levels)
BiopharmaceuticalHBV antibodies accumulated in dwarf tobacco
Cannabis—conventional (CC)Vertical farm
(three levels)
Medicinal/recreationalValue in cannabidiol (CBD) content
Table 5. Literature review of economic modelling techniques.
Modelling MethodObjectiveReferences
Monte CarloEconomic risk assessment of biofuel technologies[81]
Monte CarloBiomass supply chain development for biofuel production[82]
Monte Carlo and System DynamicsReview of greenhouse modelling techniques[29]
Monte CarloAssessing economic viability of hydroponic cultivation in emerging markets[83]
Probability bound analysisAssessing financial risk of vertical farms using imprecise probability[18]
Monte CarloLife cycle assessment (LCA) of biodiesel production from tobacco seeds[65]
Monte CarloSustainability assessment of bio-based aviation fuel[84]
Table 6. Cultivation conditions for the plant factory scenarios.
Growing AreaPlanting DensityBiomass Yield per PlantPPFDAverage
Temperature
CO2
Concentration
PhotoperiodCultivation Period
(m2)(Plant/m2)(g Fresh Weight/Plant)(µmol/m2/s)(°C)(ppm)(h)(Days)
Scenario
TF10202.5–2.820,320–30,48060022.510001290–110
TM272027–44171–25040022.510001270–90
LF272032–6680–2002001710001630–42
LM272032–6680–2002001710001630–42
LRI272032–6680–2002001710001630–42
TC27203.6–4.8~170027527.575013100–130
TPHB272032–4467–10127527.57501390–110
TT272026–3943–5927527.57501374–84
TTD272036–5335–4427527.57501374–84
CC163210–3083–373500269501670–80
Table 7. Photovoltaic (PV) panel system description.
QuantityUnit Price (R)Total Component Price (R)Depreciation Cost per Year (R/Year)
Panel
(455 W rating)
50033341,666,925-
Inverter (8 kW)2243,413955,075-
Installation--428,000-
Total CAPEX 3,050,000122,000
Table 8. Total CAPEX results for the plant factory scenarios.
ScenariosCost (R)Lifespan (Years)Depreciation per Year (%)Depreciation Cost per Year (R/Year)
Construction
StructureTF6,745,000303.33224,833
TM
LF, LM, LRI
TC, TPHB, TT, TTD
CC
Equipment
Plant factory moduleTF3,430,353254137,214
TM17,151,765254686,071
LF, LM, LRI17,151,76520,201,765 a254686,071808,071 a
TC, TPHB, TT, TTD17,151,765254686,071
CC10,291,059254441,642
Lift and transport carTF100,000156.676667
TM
LF, LM, LRI
TC, TPHB, TT, TTD
CC
Fertigation systemTF328,720101032,872
TM
LF, LM, LRI
TC, TPHB, TT, TTD
CC
Monitor and control systemTF997,577101099,758
TM2,497,8011010249,780
LF, LM, LRI2,497,8011010249,780
TC, TPHB, TT, TTD2,497,8011010249,780
CC1,546,7391010154,674
HVAC systemTF836,595101083,660
TM
LF, LM, LRI
TC, TPHB, TT, TTD
CC511,105101051,110
Total CAPEXTF12,438,245--585,003
TM27,659,880--1,283,882
LF, LM, LRI27,659,88030,709,880 a--1,283,8821,405,882 a
TC, TPHB, TT, TTD27,659,880--1,283,882
CC19,522,622--881,799
a The CAPEX results of the lettuce—renewable—integration (LRI) scenario which included rooftop solar panel installations.
Table 9. Total OPEX results for the tomato-based plant factory scenarios.
Scenarios
OPEX componentUnitTFTM
Fixed cost
Indirect labourR/year1,499,273–1,820,2791,499,904–1,819,928
Variable (COGS) cost
Direct labourR/year44,831–102,25467,267–153,381
ElectricityR/year2,493,606–3,474,3074,990,472–7,031,889
WaterR/year27,762–56,66174,026–151,092
FertiliserR/year85,232–249,538227,221–665,379
Grow mediaR/year28,556–41,144190,344–331,501
SeedsR/year1,081–1,559938,925–1,629,663
CO2R/year190,498–260,537507,981–694,757
Total COGSR/year3,026,155–4,033,1577,649,327–9,904,036
Table 10. Total OPEX results for the lettuce-based plant factory scenarios.
Scenarios
OPEX componentUnitLFLMLRI
Fixed cost
Indirect labourR/year1,496,505–1,821,113
Variable (COGS) cost
Direct labourR/year67,263–153,384
Grid electricityR/year3,969,748–5,569,2693,509,923–4,955,137
WaterR/year61,100–114,189
FertiliserR/year184,864–502,663
Grow mediaR/year522,790–1,064,52771,693–136,903
SeedsR/year59,815–120,663
CO2R/year677,290–926,297
Total COGSR/year6,059,818–7,815,1845,596,623–7,207,506 (panels)
5,454,366–7,112,600 (grains)
4,990,546–6,499,481 (combined)
Table 11. Total OPEX results for the tobacco-based plant factory scenarios.
Scenarios
OPEX componentUnitTCTPHBTTTTD
Fixed cost
Indirect labourR/year1,498,525–1,825,671
Variable
(COGS) cost
Direct labourR/year67,257–153,381
ElectricityR/year4,452,982–6,392,575
WaterR/year69,922–163,230
FertiliserR/year219,298–719,451
Grow mediaR/year16,655–26,054173,400–268,689185,156–294,406253,819–399,207
SeedsR/year32,634–50,817340,188–526,262361,714–573,686497,917–784,409
CO2R/year550,339–752,628
Total COGSR/year5,816,197–7,840,1086,393,465–8,434,9536,435,846–8,488,6246,692,149–8,737,868
Table 12. Total OPEX results for the cannabis-based plant factory scenario.
Scenario
OPEX componentUnitCC
Fixed cost
Indirect labourR/year1,498,023–1,822,495
Variable (COGS) cost
Direct labourR/year44,828–102,261
ElectricityR/year4,664,240–6,433,889
WaterR/year72,977–98,105
FertiliserR/year216,546–427,402
Grow mediaR/year222,168–557,353
SeedsR/year7,572,613–18,710,626
CO2R/year406,384–555,778
Total COGSR/year14,152,192–25,731,525
Table 13. Summarised economic indexes of all the plant factory scenarios.
Scenarios
UnitTFTMLFLMLRITCTPHBTTTTDCC
RevenueR/year1,010,876–1,635,218 (producer price)
4,195,270–10,599,920
(hydroponic price)
3,204,000,000–7,066,000,000
(miracle berry)
14,652,953–31,506,451 (sugar equivalent)
729,257–1,996,895
(producer price)
10,945,263–28,962,000
(hydroponic price)
1,081,285–3,011,150 (sugar equivalent)729,257–1,996,895 (producer price)
10,945,263–28,962,000 (hydroponic price)
2,235,798–3,329,928
(producer price)
19,982–36,106 (methane)
4314–6521
(biodiesel)
26,086–120,392 (artemisinin)
12,564–19,870 (polypropylene price)
49,878–86,110 (PHB price)
25,231,351–48,806,539
(HBV antibody)
27,519,590–51,613,595
(HBV antibody)
50,999,614–225,340,789
Cost of
Cultivation a
R/year


R/kg/year
5,247,052–6,308,527


35–53
10,596,485–12,867,671


108–184
8,988,2645–10,783,088


40–101
8,988,2645–10,783,088


N/A
8,643,900–10,298,222 (panels)
8,389,501–10,065,881 (grains)
8,042,543–9,582,324 (combined)

38–97 (panels)
37–96 (grains)
35–91 (combined)
8,743,519–10,795,692


147–203
9,325,878–11,383,441


N/A
9,371,340–11,435,940


N/A
9,620,235–11,701,874


N/A
16,702,559–28,286,586


455–1,480
(whole plant)
1,516–4,935
(leaves and inflorescences)
ROI%−36 (producer price)
11 (hydroponic price)
17,600 (miracle berry)
37 (sugar equivalent)
−31 (producer price)
31 (hydroponic price)
−2929 (panels)
33 (grains)
31 (combined)
N/AN/A93101508
Payback
Period b
years9 (hydroponic price)0.006 (miracle berry)
3 (sugar equivalent)
3.23 (hydroponic price)N/A3.45 (panels)
3.03 (grains)
3.23 (combined)
N/AN/A1.11.00.20
Capital for
uncertainty
R/year−1,624,654–4,871,751 (hydroponic price)3,031,137–19,655,509 (sugar equivalent)1,194,202–18,899,854
(hydroponic price)
N/A1,633,439–19,341,092 (panels)
1,738,310–19,692,730 (grains)
2,160,251–20,086,477 (combined)
N/AN/A14,870,937–38,352,67516,888,055–41,009,50831,597,483–199,523,749
Note—a Cost of cultivation was also calculated based on total saleable biomass being produced each year. b The tabulated values are the mean values obtained during Monte Carlo simulations. Here, N/A refers to values which were not calculated as the corresponding plant factory scenarios were omitted from further analysis due to poor economic indexes.
Disclaimer/Publisher’s Note: The statements, opinions and data contained in all publications are solely those of the individual author(s) and contributor(s) and not of MDPI and/or the editor(s). MDPI and/or the editor(s) disclaim responsibility for any injury to people or property resulting from any ideas, methods, instructions or products referred to in the content.