Abstract
The dual-credit policy has increased the complexity of the automotive supply chain. This study constructs a game model and uses reverse induction to explore the impact of the dual-credit policy on production and cooperative R&D. The results show that compared with no dual-credit policy, the dual-credit policy may not be able to promote improvement of the fuel economy, the development of the new energy vehicle (NEV) industry, and cooperative research and development (R&D). The policy effects are related to other parameters. Meanwhile, increasing control of the dual-credit policy can suppress the scale of fuel vehicles (FVs), but has little effect on the level of fuel economy improvement. Additionally, the impact on the intensity of NEV production and cooperative R&D needs to be discussed within a specific threshold. Manufacturers can obtain policy dividends by adjusting their operational strategies. The government can quantify the effect of policies through production supervision and flexibly adjust the intensity of regulation, to build a green and win–win automotive supply chain.
1. Introduction
China has been the world’s largest producer and seller of automobiles for 12 consecutive years [1]. The China Automobile Association expects total vehicle sales in China to reach 27.5 million units in 2022. However, the market share of NEVs was only 21.6% in the first half of 2022. FVs are a major source of greenhouse gas emissions [2,3], causing a huge negative impact on the ecosystem. Almost all FVs run on fossil fuels, and China’s dependence on crude oil imports has reached 72%, far above the safety line [4,5]. Considering the threats to ecological and energy security, NEVs have become an ideal alternative to FVs [6,7]. The NEV market is small, and the technical level required is the key reason for this. Based on the high R&D costs and technical barriers of NEVs, cooperative R&D has become an important strategy for automotive supply chains, to reduce costs and increase efficiency, such as the joint R&D strategy adopted by Toyota and BMW.
The Chinese government has been vigorously promoting the development of the NEV industry. In 2009, China issued the NEV subsidy policy. Although NEV production and sales exceeded 1.2 million units in 2018, driven by the subsidy policy, the following problems exist: First, long-term subsidies put enormous financial pressure on governments [8]. Second, manufacturers falsify and exaggerate NEV production to obtain subsidies [9]. Third, the subsidy policy promotes the increase in the production of NEVs, but neglects the improvement in technical level of FVs and NEVs [10]. As a result, China has entered a post-subsidy era [11], and the Chinese government proposed the dual-credit policy in 2017 [12].
The dual-credit policy mainly affects the automotive supply chain through corporate average fuel consumption (CAFC) credits and NEV credits. On the one hand, it regulates manufacturers to improve their level of fuel economy; on the other hand, it encourages FV manufacturers to transform into NEV manufacturers. The dual-credit policy aggravates the heterogeneity and instability, which is mainly reflected in the heterogeneity of fuel consumption levels and the instability of control intensity. Manufacturers must rationalize their production and cooperative R&D strategies according to the dual-credit policy. This study mainly answers the following questions: (1) What are the optimal production and cooperative R&D strategies for manufacturers with and without the dual-credit policy? (2) What is the impact of the dual-credit policy on the optimal production and cooperative R&D strategies? (3) What regulatory measures should the government take to promote the healthy development of the automobile market?
This study considers the impact of the dual-credit policy on the production and cooperative R&D decisions of the automotive supply chain. The main contributions of this study are as follows: (1) This study explores the optimal production strategy, based on the actual market environment. The optimal solutions with and without the dual-credit policy are compared, to explore the effects of this policy’s implementation and to provide guidance for manufacturers to formulate and adjust their production strategies. (2) This study identifies and analyzes the optimal cooperative R&D strategy among manufacturers, and provides guidance to promote the cooperative model of cost-sharing and technology-sharing. (3) This study explores the impact of the dual-credit policy on the production and cooperative R&D decisions of the automotive supply chain, and provides a reference for the government to improve the automotive market structure and promote manufacturer cooperation.
The remainder of this study is organized as follows: Section 2 provides a review of the relevant literature. Section 3 introduces the model. Section 4 explores the optimal solutions. In Section 5, the optimal solutions are discussed and analyzed. In Section 6, numerical simulations are carried out. Section 7 summarizes the study.
2. Literature Review
This study is related to two streams of literature: (1) the dual-credit policy, and (2) the technological R&D of NEVs.
2.1. The Dual-Credit Policy
Since the implementation of the dual-credit policy, some scholars have carried out research on it. Zhao et al. and Chen et al. constructed a top-down framework, to evaluate the impact of government regulation on the development of the NEV industry under the dual-credit policy [13,14]. Li et al. built a closed supply chain studied the optimal production [15]. Cheng et al. constructed a supply chain including a FV manufacturer and a NEV manufacturer, to study the optimal production strategies under stable and unstable credit markets [16]. Li et al. simulated the decisions of NEV manufacturers under different scenarios and compared the optimal production decision under the dual-credit policy and subsidy policy [8]. Luo et al. studied the impact of the dual-credit policy on the production and fuel economy of FVs, and explored the impact of the dual-credit policy on manufacturer’s decisions [17]. Li et al. constructed a closed supply chain, to explore the impact of credit acquisition approaches on production decisions [18]. Yu et al. constructed a supply chain consisting of a FV–NEV manufacturer and a retailer, and explored the impact of the dual-credit policy on production and pricing [19]. Zhou et al. constructed a secondary supply chain, to explore the impact of the dual-credit policy on production decisions under different production strategies [20]. Ou et al. quantified the impact of the dual-credit policy on consumer choice and industry profit, to analyze the impact of the subsidy policy on the development of the automotive industry [21]. Li et al. established a multi-stage credit market dynamic equilibrium model, to explore the impact on NEV production and profits under different market scenarios [22]. Zhao et al. explained the promoting effect of the dual-credit policy on the production of NEVs from the perspective of the environment [23]. Li et al., based on the credit market equilibrium theory, analyzed the influence of the dual-credit policy on the decision-making of NEVs and found that the dual-credit policy can accelerate the elimination of NEVs with a low technology content [24]. The existing research has mainly studied the optimal decision under the dual-credit policy but has not considered the fuel consumption level of FVs, and has ignored the dynamics and controllability of fuel consumption levels. At the same time, most of the existing research built a secondary supply chain that includes one NEV manufacturer and one retailer, or a multi-manufacturer chain that includes both a NEV manufacturer and a FV manufacturer, but most manufacturers, in reality, are composite manufacturers, in the transition stage from the production of FVs to the production of NEVs, or are dominant NEV manufacturers.
2.2. Technological R&D
Some scholars have carried out research on promoting the technological R&D of NEVs. There are many factors affecting technology R&D, including market demand [25], technology basis [26], and government regulation [27]. Ma et al. explored the optimal production decisions of NEVs, considering vertical cooperation between members of the supply chain [4]. Majumdar conducted research on zero-point policies and suggested that a zero-credit policy could drive innovation and increase R&D investment [28]. Li et al., Raj et al., and Yang and Chen focused on emission reduction and benefits, and suggested that revenue sharing could promote revenue improvement more than cooperative R&D [29,30,31]. NEV credits have become a tradable market resource and a new source of revenue for manufacturers [12]. Manufacturers have ample motivation to improve their technological level by strengthening technological R&D. Zhou et al. explored the impact of the dual-credit policy on green technology investment under different production strategies [20]. Li et al. analyzed and compared the impact of the dual-credit policy and subsidy policy on the production and decision-making regarding FVs and NEVs from the perspective of cross-chain cooperation [22]. Zheng et al. used a three-stage game model to analyze the impact of dual-credit price on the R&D investment of NEV manufacturers [32]. Gu et al. studied the role of government subsidies in promoting the technological R&D into NEV under the condition of imperfect information [33]. The existing research on technological R&D mostly considered cooperative R&D between vertical supply chains, and few literature works have considered horizontal cooperative R&D between composite FV–NEV manufacturers and dominant NEV manufacturers in the transition period. At the same time, a small number of literature works have studied a cooperative R&D strategy under the dual-credit policy but did not explore the impact of the dual-credit policy on the cooperative R&D strategy.
2.3. Summary
The positioning of this study is shown in Table 1. There are relatively few literature works on cooperative R&D under the dual-credit policy, most of which only discussed the influence of the dual-credit policy on manufacturers’ decision-making or the improvement of the profits between the upstream and downstream members of the supply chain through cooperative contracts. Based on the actual situation, cooperative R&D between manufacturers under the dual-credit policy will be discussed. At the same time, manufacturers are classified according to their fuel consumption level, and it is of research significance to discuss the optimal decision under different situations. This study constructs an automotive supply chain including composite manufacturers and dominant manufacturers that only produce NEVs. Based on the difference in fuel consumption level, the R&D decisions about horizontal cooperation under the dual-credit policy are discussed. The main innovations are as follows: (1) This study studies an automotive supply chain consisting of a dominant manufacturer that only produces NEVs and a composite manufacturer that produces both NEVs and FVs, which is in line with the real situation. Most of the existing studies only focused on NEVs manufacturers or composites manufacturers. (2) This study explores the optimal production and cooperative R&D decisions of the automotive supply chain in the context of heterogeneous fuel consumption. Most of the existing research assumed that the FVs were in the high fuel consumption state, ignoring the controllability of fuel economy. (3) This study explores the impact of the dual-credit policy on the production and cooperative R&D decisions. Existing studies mostly assumed that the dual-credit policy can promote the production of the automotive supply chain, ignoring the research on cooperative R&D decisions and the negative impacts of the dual-credit policy.

Table 1.
The positioning of this study.
3. The Model
3.1. Model Description
The dual-credit policy consists of NEV credits and CAFC credits, and Figure 1 shows the procedure. When the difference between the CAFC standard set by the government and the actual value is less than 0, FVs are in the state of high fuel consumption and will generate negative CAFC credits. When the difference between the CAFC standard and the actual value is greater than 0, FVs are in the state of low fuel consumption and positive CAFC credits will be generated. When the difference between the CAFC standard and the actual value is 0, FVs are in the state of equilibrium fuel consumption, and the CAFC credit value is 0. The government requires manufacturers to produce a certain percentage of NEVs. If the manufacturer does not meet this target, negative NEV credits will be generated. If the production quantity exceeds the standard, positive NEV credits will be generated. Automakers must have a total credit greater than or equal to 0 [1]. Positive CAFC credits cannot be traded on the credits market, but NEV credits can.
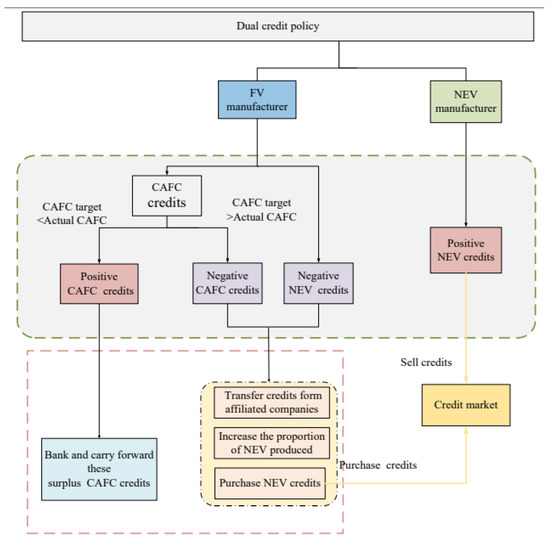
Figure 1.
Procedure of the dual-credit policy.
We constructed an automotive supply chain consisting of one NEV manufacturer and one FV–NEV manufacturer, as shown in Figure 2. This study explored the optimal production and R&D decisions of the automotive supply chain, with and without the dual-credit policy. The parameters and meanings of the model are shown in Table 2.
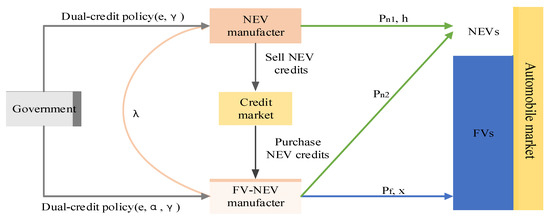
Figure 2.
Automotive supply chain model.
Table 2.
Summary of notations.
In the following, the subscripts M1 and M2 indicate NEV manufacturers and FV–NEV manufacturers, respectively. The subscripts n1, n2, and f indicate NEVs produced by NEV manufacturers, NEVs produced by FV–NEV manufacturers, and FVs produced by FV–NEV manufacturers, respectively. The superscripts N, DH, DE, and DL indicate no dual-credit policy, high fuel consumption NEVs under the dual-credit policy, equilibrium fuel consumption NEVs under the dual-credit policy, and low fuel consumption NEVs under the dual-credit policy, respectively.
Hypothesis 1.
The production cost of NEVs and FVs produced by the FV–NEV manufacturer is and , respectively. The NEV manufacturer producing only NEVs has an advantage in production efficiency, assuming that the production cost of NEVs produced by NEV manufacturer is , [16].
Hypothesis 2.
The production of NEVs produced by NEV manufacturers is . The production of NEVs and FVs produced by F–-NEV manufacturers are
and
. The production of NEVs is affected by the market price, driving range, and market competition. The production of FVs is affected by market price and fuel economy.
denotes the price cross-influence coefficient between NEVs.
denotes consumer sensitivity to vehicle price. In order to simplify the calculation, let
and
[34].
Hypothesis 3.
The cost function of FV–NEV manufacturers to improve the level of fuel economy improvement is [1]. The cost function of a NEV manufacturer to improve the driving is [35].
Hypothesis 4.
The technical bottleneck of NEVs is mainly reflected in the insufficient driving range, so this study mainly studies the cooperative R&D of driving range [36]. The dominant NEV manufacturer specializing in the production of NEVs has a high technical foundation for R&D. The composite FV–NEV manufacturer has a weak technical foundation for R&D, and the same R&D results have to pay for higher R&D costs [37].
Hypothesis 5.
In the case of cooperative R&D, the cost sharing ratio of the FV–NEV manufacturer is ,. Cooperative R&D refers to the FV–NEV manufacturer’s share of the R&D cost of the NEV manufacturer, and the NEV manufacturer provides technology sharing to the FV–NEV manufacturer [4].
Hypothesis 6.
This study ignores the profits generated by positive CAFC credits. Positive CAFC credits cannot be traded on the credits market [1,22] and generate very low profits.
Hypothesis 7.
The CAFC credits can be expressed as [20]. Manufacturers can improve fuel economy to reduce actual fuel consumption, thereby reducing negative CAFC credits [17].
Hypothesis 8.
The NEV credits can be expressed as . The production of FVs by manufacturers produces negative NEV credits
. Manufacturers obtain positive NEV credits when producing NEVs, and the credit value is positively correlated with the driving range of NEVs. Therefore, the credits obtained by manufacturers through the production of NEV are expressed as
[1,20].
Hypothesis 9.
In order to ensure the existence of an optimal solution, the following conditions should be met ,,, and .
3.2. The Game Model
In the no policy scenario, the automobile supply chain is not constrained by the dual-credit policy, and the profit and cost brought by the credit are not considered. The profit function of NEV manufacturer and FV–NEV manufacturer are as follows:
In the dual-credit policy scenario, the profit and cost brought by the credit are considered. The profit function of NEV manufacturer and FV–NEV manufacturer are as follows:
The game sequence between the NEV manufacturer and FV–NEV manufacturer is shown in Figure 3. In the first stage, the FV–NEV manufacturer determines the cost sharing ratio. In the second stage, the NEV manufacturer determines the driving range of NEVs, and the FV–NEV manufacturer determines the production, pricing, and fuel economy improvement level of FVs. The NEV manufacturer and FV–NEV manufacturer jointly determine the production and pricing of NEVs.
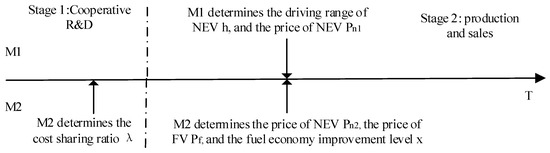
Figure 3.
Game sequence.
4. Equilibrium
4.1. Decision without a Dual-Credit System
In the no policy scenario, the optimal fuel economy improvement level, driving range, vehicle price, and cooperative R&D cost sharing coefficient can be calculated as follows:
4.2. Decision with a Dual-Credit System
4.2.1. FVs Are in the High Fuel Consumption State
FVs cannot meet the CAFC standard set by the government, that is , and will generate negative CAFC credits. Manufacturers must purchase positive NEV credits to offset negative credits, and the scope of , the fuel economy improvement level, driving range, vehicle price, and cooperative R&D cost sharing coefficient can be calculated as follows:
4.2.2. FVs Are in the Equilibrium Fuel Consumption State
FVs just meet the CAFC standard set by the government, that is ; the CAFC credit generated is 0, scope of , and the fuel economy improvement level, driving range, vehicle price, and cooperative R&D cost sharing coefficient can be calculated as follows:
4.2.3. FVs Are in the Low Fuel Consumption State
FVs meet the CAFC standard set by the government, that is , and generate positive CAFC credits, scope of , the fuel economy improvement level, driving range, vehicle price, and cooperative R&D cost sharing coefficient can be calculated as follows:
5. Analysis of Optimal Decisions and Policy Effects
This section, on the one hand, compares the optimal production and cooperative R&D decisions; on the other hand, the impact of key parameters on the production and cooperative R&D is analyzed.
5.1. Optimal Result Comparison
Proposition 1.
Compared with the no policy scenario, the effect of the dual-credit policy on the fuel economy improvement level is as follows:
- If , then
- If , then
- If , then
Proposition 1 reflects the relationship between the optimal fuel economy improvement level, with and without the dual-credit policy. When FVs are in the high fuel consumption state, is less than a certain threshold, which will lead to the ineffectiveness of the dual-credit policy and even inhibit an increase fuel economy improvement level. When FVs are in the equilibrium fuel consumption state, is less than a certain threshold, which will promote the improvement of fuel economy. In real life, is always greater than 0, so the dual-credit policy will inhibit the improvement of fuel economy of low fuel consumption FVs. It is worth warning that the dual-credit policy does not necessarily promote energy conservation and emission reductions, and the government should adjust the parameters according to the actual situation.
Proposition 2.
Compared with the no policy scenario, the effect of the dual-credit policy on the optimal price of FVs is as follows:
- Let , if , then ; if or , then ; Let , if , then ; if or , then
- If , then
- If , then
where .
Proposition 2 reflects the relationship between the FVs price with and without the dual-credit policy. When FVs are in the high fuel consumption state, the relationship between the FVs price is not only related to , but also related to and . When FVs are in the equilibrium fuel consumption state, if is less than , the dual-credit policy will promote the lower price of FVs. When FVs are in a low fuel consumption state, and if is less than , the dual-credit policy will promote a lower price of FVs.
Proposition 3.
Compared with the no policy scenario, the effect of the implementation of the dual-credit policy on the driving range of NEVs is as follows:
.
Proposition 3 reflects that the dual-credit policy always encourages the NEV market to increase R&D to improve driving range. The difference in the fuel consumption state of FVs has no impact on the driving range of NEVs.
Proposition 4.
Compared with the no policy scenario, the effect of the implementation of the dual-credit policy on the optimal price of NEVs is as follows:
If
, then
and
Proposition 4 reflects the fact that the dual-credit policy will promote a higher price of NEVs when is less than a specific threshold . At this point, manufacturers are more willing to increase their R&D, due to the lower costs incurred, leading to higher prices.
Proposition 5.
Compared with the no policy scenario, the effect of the implementation of the dual-credit policy on the cost-sharing coefficient of cooperative R&D is as follows:
If
, then .
Proposition 5 reflects that when is below the threshold , the dual-credit policy can encourage the FV–NEV manufacturers to bear more R&D cooperative costs, at which time the NEV manufacturer will increase R&D and share better R&D results with the FV–NEV manufacturer.
5.2. The Impact of the Dual-Credit Policy on Production and R&D Decisions
Proposition 6.
We calculated the different production strategies of FV in three cases when increases. All are shown in Table 3.
Table 3.
The effects of on decisions.
A higher indicates a looser CAFC target set by the government. Table 3 shows that an increased has different effects on the decisions in different cases. When FVs are in the high fuel consumption state, the production and fuel economy improvement level increase when increases. Changes in can lead to opposite effects on pricing. When , the manufacturer should raise the price of FV; the reverse is also true. When FVs are in the equilibrium fuel consumption state, the price, production, and fuel economy improvement level decreases with increasing . When FVs are in the low fuel consumption state, the change of has no effect on these decisions.
Proposition 7.
We calculated the different production strategies of FV in three cases when
increases. All are shown in Table 4.
Table 4.
The effects of on decisions.
A higher indicates that the government is pushing the transition from FV manufacturers to NEV manufacturers more strongly. Table 4 shows that an increased has different effects on the pricing decisions in different cases. With FVs in the high fuel consumption state, when , the manufacturer should raise the price of FVs; the reverse is also true. When FVs are in the equilibrium fuel consumption state, the price increases with increasing . With FVs in the low fuel consumption state, when , the manufacturer should raise the price of FVs; the reverse is also true. No matter the fuel consumption state, an increase of will promote a decline in the production of FVs. When FVs are in the equilibrium fuel consumption state, the increase of has no effect on fuel economy, and the rest of the cases will lead to a decrease in the level of fuel economy improvement.
Proposition 8.
The effects of positive NEV credit generated by an NEV on decision-making:
- increases with the increase of
- If , and decrease with the increase of ; If , and increase with the increase of
- If , decreases with the increase of ; If , increase with the increase of .
Proposition 8 shows that the increase of will promote the improvement of the NEV’s driving range, and the government can stimulate manufacturers to increase the driving range by increasing the positive NEV credit generated by an NEV. We can see that when the cost factor of increasing the driving range of NEVs is low, the manufacturer can obtain more credit profit by increasing R&D investment, which will promote the reduction of prices. When the cost factor of increasing the driving range of NEVs is high, the R&D input generates a higher production cost, and the manufacturer needs to raise the price to ensure a profit, which is consistent with reality. When the market share of NEVs is low, the increase of cannot promote an increase of the cost sharing ratio between the FV–NEV manufacturer and NEV manufacturer. Only when , the increase of can promote an increase in the cost sharing ratio between the FV–NEV manufacturer and NEV manufacturer. When the market share is low, the market profit brought by the increase of is low, which cannot offset the high cost of cooperative R&D.
6. Numerical Simulation
In order to display the research results more intuitively, we used a numerical simulation to supplement the demonstration. This section mainly explores the optimal production and R&D decisions of the automotive supply chain. Combining previous literature reports [4,8,17] and data [38,39,40,41,42], the parameter settings in this paper are shown in Table 5.
Table 5.
Value for each parameter.
In this model, the potential market size of vehicles is denoted as . The proportion of NEVs in the total market size of the automobile market is relatively low, due to the high cost and poor driving range, so we assumed is 0.4. Consumers are sensitive to fuel economy and driving range, and for every 1 L decrease in fuel consumption, demand will increase by 5000 units, and for every 1 km increase in driving range, demand will increase by 500 units [8,17]. We assumed the NEVs had a range of around 600 km [4]. The cost coefficients of fuel economy improvement and driving range improvement are large, and were assumed to be and . Combined with the market research report, it was assumed that the unit average production cost of FV was 80,000 CNY, and the unit average production cost of NEV was higher, due to the short development time and high technical difficulty. The FV–NEV manufacturer focused on the production of FVs in the early stages and had a weak production layout for NEVs, whose unit average production cost of each NEV was 120,000 CNY. Due to advanced technology and greater production experience, the unit average production cost of the NEV manufacturer was 0.6 times of that of FV–NEV manufacturer. In 2021, the positive credits generated by the automotive supply chain were three times more than negative credits [31], and the market relationship of supply exceeding demand caused the trading price of credits to fall below 1000 CNY/credit. Great Wall Motor forecasts that the trading price of credit will be 500–800 CNY/credit. Let the credit trading price be at 650 CNY/credit [17]. The MIIT stipulates that each NEV with a 1 km mileage increase will obtain 0.0056 credits [41]. MIIT issued a document clarifying the requirement for the proportion requirements for NEV production from 2021 to 2023, which were 14%, 16%, and 18%, respectively [38]. We took 16%, to simulate the 2022 scenario. Currently, the difference between the CAFC standard and the actual CAFC of most FVs is negative [39,40,42], and we took −2.5L/100 km in this study.
6.1. The Impact of the Difference between the CAFC Standard and the Actual Value on the Production Decision for FVs
When is in different ranges, the a FVs are in different fuel consumption states. As shown in Figure 4a–c, when FVs are in the high fuel consumption state, the increase of reduces the pressure on FV–NEV manufacturers, and FV–NEV manufacturers vigorously produce FVs. At this point, FV–NEV manufacturers increase their fuel economy improvement level, which can reduce the cost of credits. Lower credit costs drive manufacturers to lower pricing. When FVs are in the equilibrium fuel consumption state, the fuel economy improvement level, pricing, and production are reduced as the intensity of government regulation decreases. At this time, FV–NEV manufacturers lack an incentive to improve fuel economy levels. When FVs are the in low fuel consumption state, does not have any impact on the manufacturers’ decisions. It is worth noting that the implementation of the dual-credit policy does not necessarily promote an improvement of fuel economy, when FVs are in low fuel consumption state, the dual-credit policy may inhibit the motivation of manufacturers to improve the fuel economy.
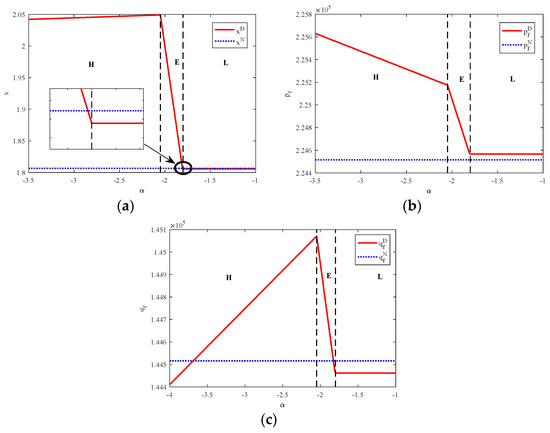
Figure 4.
The impact of on the optimal decisions of FV manufacturers: (a) the impact of on the optimal improvements in fuel economy; (b) the impact of on the optimal price; (c) the impact of on the optimal production.
6.2. The Impact of Proportion Requirements for NEV Production Set by the Government on the Production Decisions of FVs
As can be seen from Figure 5a, the fuel economy improvement level under the dual-credit policy was much higher than that under no policy. Under the dual-credit policy, when increases, the FV–NEV manufacturer spent more resources on the production of NEVs, and the fuel economy improvement level gradually weakened. As can be seen from Figure 5b, under the dual-credit policy, the increase in may compress the production of FVs, but the impact on the pricing of FVs is minimal. The pricing of FVs under the dual-credit policy is always lower than that under no policy, mainly because the cost of credits is reduced by improving the fuel economy improvement level under the dual-credit policy, which in turn promotes the reduction of prices and an increase in production.
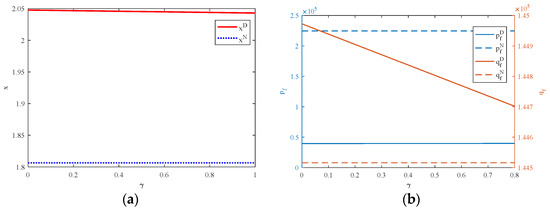
Figure 5.
The impact of on the optimal decisions of FV manufacturers: (a) the impact of on the optimal improvements in fuel economy; (b) the impact of on the optimal prices and production.
6.3. The Impact of Positive NEV Credit Generated by an NEV on the Production Decisions of NEVs and R&D
As shown in Figure 6a, the driving range under the dual-credit policy was much higher than that under no policy. The higher the , the more motivation the NEV manufacturer had to improve the driving range. The effect of the dual-credit policy on the pricing and production of the NEV manufacturer and the FV–NEV manufacturer was almost the same, as shown in Figure 6b,c. The pricing of NEVs decreased with the increase of . Contrary to pricing, the production of NEVs increased with the increase of . The dual-credit policy promoted the reduction of NEV pricing and the increase of production. As shown in Figure 6d, the implementation of the dual-credit policy promoted the increase of the cost sharing ratio of cooperative R&D costs, and the increase of also encouraged the NEV manufacturer and FV–NEV manufacturer to agree a win–win cooperation model through technology sharing and cost-sharing.
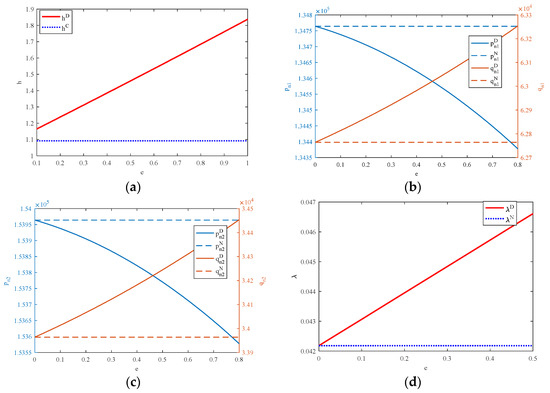
Figure 6.
The impact of on the optimal decisions of FV manufacturers: (a) the impact of on the optimal driving range; (b) the impact of on the optimal price and production; (c) the impact of on the optimal price and production; (d) the impact of on the optimal cost sharing ratio.
7. Conclusions
This study explored a general analytical framework for the production and cooperative R&D strategies of an automotive supply chain. The optimal decision for manufacturers under different policy backgrounds and scenarios was analyzed and determined. Under a heterogeneous and unstable market environment, an automobile supply chain can be built in line with the real situation, which can provide decision support for manufacturers, to improve their profits and expand their market. This study can draw the following conclusions:
This study compared and analyzed the optimal production strategies and found that the dual-credit policy can promote the improvement of driving range. Meanwhile, it was found that the quantitative relationship between optimal solutions with and without the dual-credit policy was related to the threshold of specific parameters. Luo et al. drew similar conclusions about the improvement level of fuel economy, but they did not consider the impact of the dual-credit policy on the decision-making of NEV manufacturers [17]. Zhou et al. found that the dual-credit policy always increased the pricing of NEVs and FVs, because the influence of different fuel consumption levels on decision-making was not considered [20]. This provides a new perspective for the government to promote the dual-point policy. The government can quantify the effect of the policy through supervision of the production process of manufacturers, so as to optimize the effect of the policy implementation. Manufacturers can also flexibly adjust their production strategies according to the policy intensity, so as to obtain policy dividends.
The relationship of the cooperative R&D intensity with and without the dual-credit policy is related to the R&D cost coefficient. The positive NEV credit generated by an NEV will have an impact on cooperative R&D decisions. Ma et al. found that R&D cost-sharing contracts between upstream and downstream enterprises in the FV supply chain can promote supply chain coordination, but they ignored the fact that cooperative R&D between NEV manufacturers can improve supply chain coordination [4]. Zhou et al. found that the dual-credit policy can promote manufacturers to increase investments in green technology, but the impact of the dual-credit policy on cooperative R&D among manufacturers was not considered [20]. In order to promote the formation of a win–win cooperation pattern, the government should carefully control the policy intensity or R&D cost coefficient, and strengthen the incentive of manufacturers for cooperative R&D.
This study comprehensively analyzed the impact of the key parameters of the dual-credit policy on decisions: (a) An increase of CAFC targets set by the government will inhibit production and the motivation to improve the fuel economy of high fuel consumption vehicles, while the impact on equilibrium fuel consumption vehicles will be opposite. There is no effect on the FVs in the low fuel consumption state. This confirms some of the conclusions made by Ma et al. [4] and Luo et al. [17]. (b) An increase in the proportion requirements for NEV production set by the government will discourage the production of FVs and discourage manufacturers who produced high fuel consumption and low fuel consumption FVs from improving the level of fuel economy. Yu et al. also found that an increase in the production ratio of NEVs would inhibit the output of FVs, but they did not study the improvement of fuel economy [19]. (c) An increase in the positive NEV credit generated by a NEV will promote the improvement of the driving range of NEVs. Yu et al. and Zhou et al. found that the credit value generated by NEVs has an impact on pricing, but they did no research the driving range of NEVs [19,20]. Sometimes the implementation effect of the dual-credit policy is not determined by the strength of the regulation, and the relationship between the two is related to the relevant threshold range. Therefore, the government should flexibly control the intensity of control according to the actual local situation and build a green economy automotive supply chain.
There are limitations to our study. First, we did not consider the impact of canceling government subsidies on manufacturers’ decisions. At present, China has completely canceled government subsidies, so it is of practical significance to study the impact of canceling government subsidies on the automobile supply chain. Second, we did not consider the technological spillover among manufacturers, which will affect the enthusiasm of manufacturers toward cooperative R&D, and thus affect the development level of the automobile industry. In the future, we will study the impact of government subsidy cancellation and technology spillover on the automobile supply chain under the dual-credit policy and draw more meaningful conclusions and suggestions.
Author Contributions
Conceptualization, X.Z. and L.D.; methodology, L.D.; software, L.D.; validation, X.Z. and L.D.; formal analysis, X.Z.; investigation, X.Z.; resources, L.D.; data curation, L.D.; writing—original draft preparation, L.D.; writing—review and editing, L.D.; visualization, L.D.; supervision, L.D.; project administration, L.D.; funding acquisition, L.D. All authors have read and agreed to the published version of the manuscript.
Funding
This research was funded by the major Project of Philosophy and Social Science Research in Colleges and Universities in Jiangsu Province (No. 2021SJZDA131) and the Postgraduate Research & Practice Innovation Program of Jiangsu Province (No. KYCX21_1039).
Institutional Review Board Statement
Not applicable.
Informed Consent Statement
Not applicable.
Data Availability Statement
The data used to support the findings of this study are included within the article.
Acknowledgments
This paper received administrative and technical support from the China Institute of Manufacturing Development. Meanwhile, the authors would like to thank the anonymous reviewers for their valuable comments and suggestions to improve the quality of the paper.
Conflicts of Interest
The authors declare that they have no conflict of interest.
References
- Zhu, X.; Ding, L.; Zhu, H.; Guo, Y. The dual-credit policy model, a production strategy decision-making algorithm and application to Chinese automakers. Neural Comput. Appl. 2022, 1–15. [Google Scholar] [CrossRef]
- Fang, K.; Tang, Y.; Zhang, Q.; Song, J.; Wen, Q.; Sun, H.; Ji, C.; Xu, A. Will China peak its energy-related carbon emissions by 2030? Lessons from 30 Chinese provinces. Appl. Energy 2019, 255, 113852. [Google Scholar] [CrossRef]
- He, H.; Li, S.; Wang, S.; Zhao, J.; Zhang, C.; Ma, F. Interaction mechanism between dual-credit pricing and automobile manufacturers’ electrification decisions. Transp. Res. Part D Transp. Environ. 2022, 109, 103390. [Google Scholar] [CrossRef]
- Ma, H.; Lou, G.; Fan, T.; Chan, H.K.; Chung, S.H. Conventional automotive supply chains under China’s dual-credit policy: Fuel economy, production and coordination. Energy Policy 2021, 151, 112166. [Google Scholar] [CrossRef]
- Shen, Y.; Ahlers, A.L. Local environmental governance innovation in China: Staging ‘triangular dialogues’ for industrial air pollution control. J. Chin. Gov. 2018, 3, 351–369. [Google Scholar] [CrossRef]
- Chen, Z.; Fan, Z.; Zhao, X. Toward supply side incentive: The impact of government schemes on a vehicle manufacturer’s adoption of electric vehicles. Int. Trans. Oper. Res. 2022, 29, 3565–3591. [Google Scholar] [CrossRef]
- Yang, D.X.; Yang, L.; Chen, X.L.; Wang, C.; Nie, P.Y. Research on credit pricing mechanism in dual-credit policy: Is the government in charge or is the market in charge? Environ. Dev. Sustain. 2022, 1–21. [Google Scholar] [CrossRef]
- Li, Y.; Zhang, Q.; Liu, B.; McLellan, B.; Gao, Y.; Tang, Y. Substitution effect of New-Energy Vehicle Credit Program and Corporate Average Fuel Consumption Regulation for Green-car Subsidy. Energy 2018, 152, 223–236. [Google Scholar] [CrossRef]
- Ye, R.K.; Gao, Z.F.; Fang, K.; Liu, K.L.; Chen, J.W. Moving from subsidy stimulation to endogenous development: A system dynamics analysis of China’s NEVs in the post-subsidy era. Technol. Forecast. Soc. Chang. 2021, 168, 120757. [Google Scholar] [CrossRef]
- Li, J.; Ku, Y.; Liu, C.; Zhou, Y. Dual credit policy: Promoting new energy vehicles with battery recycling in a competitive environment? J. Clean. Prod. 2019, 243, 118456. [Google Scholar] [CrossRef]
- He, H.; Li, S.; Wang, S.; Chen, Z.; Zhang, J.; Zhao, J.; Ma, F. Electrification decisions of traditional automakers under the dual-credit policy regime. Transp. Res. Part D Transp. Environ. 2021, 98, 102956. [Google Scholar] [CrossRef]
- MIIT (Ministry of Industry and Information Technology). Ministry of Industry and Information Technology: Measures for the Parallel Administration of the Average Fuel Consumption and New Energy Vehicle Credits of Passenger Vehicle Enterprises. Available online: http://www.gov.cn/xinwen/2017-09/28/content_5228217.htm (accessed on 28 September 2017).
- Zhao, F.; Chen, K.; Hao, H.; Wang, S.; Liu, Z. Technology development for electric vehicles under new energy vehicle credit regulation in China: Scenarios through 2030. Clean Technol. Environ. Policy 2019, 21, 275–289. [Google Scholar] [CrossRef]
- Chen, K.; Zhao, F.; Hao, H.; Liu, Z. Synergistic Impacts of China’s Subsidy Policy and New Energy Vehicle Credit Regulation on the Technological Development of Battery Electric Vehicles. Energies 2018, 11, 3193. [Google Scholar] [CrossRef]
- Li, Y.; Zhang, Q.; Tang, Y.; Mclellan, B.; Ye, H.; Shimoda, H.; Ishihara, K. Dynamic optimization management of the dual-credit policy for passenger vehicles. J. Clean. Prod. 2019, 249, 119384. [Google Scholar] [CrossRef]
- Cheng, Y.; Fan, T. Production coopetition strategies for an FV automaker and a competitive NEV automaker under the du-al-credit policy. Omega 2021, 103, 102391. [Google Scholar] [CrossRef]
- Lou, G.; Ma, H.; Fan, T.; Chan, H.K. Impact of the dual-credit policy on improvements in fuel economy and the production of internal combustion engine vehicles. Resour. Conserv. Recycl. 2020, 156, 104712. [Google Scholar] [CrossRef]
- Li, J.; Ku, Y.; Li, L.; Liu, C.; Deng, X. Optimal channel strategy for obtaining new energy vehicle credits under dual credit policy: Purchase, self-produce, or both? J. Clean. Prod. 2022, 342, 130852. [Google Scholar] [CrossRef]
- Yu, Y.; Zhou, D.; Zha, D.; Wang, Q.; Zhu, Q. Optimal production and pricing strategies in auto supply chain when dual credit policy is substituted for subsidy policy. Energy 2021, 226, 120369. [Google Scholar] [CrossRef]
- Zhou, D.; Yu, Y.; Wang, Q.; Zha, D. Effects of a generalized dual-credit system on green technology investments and pricing decisions in a supply chain. J. Environ. Manag. 2019, 247, 269–280. [Google Scholar] [CrossRef]
- Ou, S.; Lin, Z.; Qi, L.; Li, J.; He, X.; Przesmitzki, S. The dual-credit policy: Quantifying the policy impact on plug-in electric vehicle sales and industry profits in China. Energy Policy 2018, 121, 597–610. [Google Scholar] [CrossRef]
- Li, J.; Ku, Y.; Yu, Y.; Liu, C.; Zhou, Y. Optimizing production of new energy vehicles with across-chain cooperation under China’s dual credit policy. Energy 2020, 194, 116832. [Google Scholar] [CrossRef]
- Zhao, F.; Liu, F.; Liu, Z.; Hao, H. The correlated impacts of fuel consumption improvements and vehicle electrification on vehicle greenhouse gas emissions in China. J. Clean. Prod. 2018, 207, 702–716. [Google Scholar] [CrossRef]
- Li, Y.; Zhang, Q.; Li, H.; Tang, Y.; Liu, B. The impact of dual-credit scheme on the development of the new energy vehicle industry. Energy Procedia 2019, 158, 4311–4317. [Google Scholar] [CrossRef]
- Liu, C.; Gao, X.; Ma, W.; Chen, X. Research on regional differences and influencing factors of green technology innovation efficiency of China’s high-tech industry. J. Comput. Appl. Math. 2019, 369, 112597. [Google Scholar] [CrossRef]
- Kong, D.Y.; Ma, S.J.; Tang, W.C.; Xue, Y.X. The policy effect on automobile industry considering the relationship between technology, market and production: The dual-credit policy as an example. Transp. Lett. 2022, 1–15. [Google Scholar] [CrossRef]
- Jin, W.; Zhang, H.Q.; Liu, S.S.; Zhang, H.B. Technological innovation, environmental regulation, and green total factor efficiency of industrial water resources. J. Clean. Prod. 2019, 211, 61–69. [Google Scholar] [CrossRef]
- Majumdar, S.R. A Prospect Theory Analysis of California’s Initiatives in Implementation of its Zero Emission Vehicles (ZEV) Mandate (1). Rev. Policy Res. 2005, 22, 157–169. [Google Scholar] [CrossRef]
- Li, T.; Zhang, R.; Zhao, S.; Liu, B. Low carbon strategy analysis under revenue-sharing and cost-sharing contracts. J. Clean. Prod. 2018, 212, 1462–1477. [Google Scholar] [CrossRef]
- Raj, A.; Biswas, I.; Srivastava, S.K. Designing supply contracts for the sustainable supply chain using game theory. J. Clean. Prod. 2018, 185, 275–284. [Google Scholar] [CrossRef]
- Yang, H.; Chen, W. Retailer-driven carbon emission abatement with consumer environmental awareness and carbon tax: Revenue-sharing versus Cost-sharing. Omega 2018, 78, 179–191. [Google Scholar] [CrossRef]
- Zheng, J.; Zhao, H.; Li, Z. A research on new energy vehicle industry R&D subsidy under the policy of “double credits”. Sci. Res. Manag. 2019, 40, 126. [Google Scholar]
- Gu, X.; Ieromonachou, P.; Zhou, L. Subsidising an electric vehicle supply chain with imperfect information. Int. J. Prod. Econ. 2019, 211, 82–97. [Google Scholar] [CrossRef]
- Panda, S.; Modak, N.M.; Cárdenas-Barrón, L.E. Does extended warranty depict competitive advantage to a retailer in a retail-e-tail channel supply chain. Comput. Ind. Eng. 2020, 149, 106770. [Google Scholar]
- Dumortier, J.; Siddiki, S.; Carley, S.; Cisney, J.; Krause, R.M.; Lane, B.W.; Rupp, J.A.; Graham, J.D. Effects of providing total cost of ownership information on consumers’ intent to purchase a hybrid or plug-in electric vehicle. Transp. Res. Part A Policy Pract. 2015, 72, 71–86. [Google Scholar] [CrossRef]
- Zhu, L.; Wang, P.; Zhang, Q. Indirect network effects in China’s electric vehicle diffusion under phasing out subsidies. Appl. Energy 2019, 251, 113350. [Google Scholar] [CrossRef]
- Wang, Z.; Zhang, J.; Zhao, H. The Selection of Green Technology Innovations under Dual-Credit Policy. Sustainability 2020, 12, 6343. [Google Scholar] [CrossRef]
- MIIT (Ministry of Industry and Information Technology). The Decision on Amending the Measures for Parallel Management of Average Fuel Consumption and New Energy Vehicle Credits of Passenger Vehicle Enterprises 2020. Available online: http://www.gov.cn/zhengce/zhengceku/2020-06/22/content_5521144.htm (accessed on 22 June 2020).
- MIIT (Ministry of Industry and Information Technology). Announcement on the Corporate Average Fuel Consumption and New Energy Vehicles Credits of Passenger Vehicle Companies in 2019. 2020. Available online: https://www.miit.gov.cn/xwdt/gxdt/sjdt/art/2020/art_de5c8433fad54cd89c7ae2be2aa5e76c.html (accessed on 22 June 2020).
- MIIT (Ministry of Industry and Information Technology). Announcement of Average Fuel Consumption and New Energy Vehicle Credits of Chinese Passenger Vehicle Enterprises in 2020. 2021. Available online: https://www.miit.gov.cn/jgsj/zbys/wjfb/art/2021/art_69ba8336123a4a3ba96a20771c494c08.html (accessed on 15 July 2021).
- MIIT (Ministry of Industry and Information Technology). Announcement on the Final Audit of the Settlement of Subsidy Funds for the Promotion and Application of New Energy Vehicles in 2019–2020 and the Advance Allocation of Subsidy Funds in 2019–2021. 2022. Available online: https://www.miit.gov.cn/zwgk/wjgs/art/2022/art_329ea7b7a3ac4d1db5ad0dfc38640a4d.html (accessed on 2 March 2022).
- MIIT (Ministry of Industry and Information Technology). Announcement of Average Fuel Consumption and New Energy Vehicle Credits of Chinese Passenger Vehicle Enterprises in 2021. Available online: https://www.miit.gov.cn/jgsj/zbys/gzdt/art/2022/art_bcc0cbe706304c89953489e20e318688.html (accessed on 8 April 2022).
Disclaimer/Publisher’s Note: The statements, opinions and data contained in all publications are solely those of the individual author(s) and contributor(s) and not of MDPI and/or the editor(s). MDPI and/or the editor(s) disclaim responsibility for any injury to people or property resulting from any ideas, methods, instructions or products referred to in the content. |
© 2023 by the authors. Licensee MDPI, Basel, Switzerland. This article is an open access article distributed under the terms and conditions of the Creative Commons Attribution (CC BY) license (https://creativecommons.org/licenses/by/4.0/).