Abstract
The COVID-19 pandemic has had an unprecedented impact on the transportation sector, with changes expected to last for a long time. Following the reopening phases, increased use of private vehicles and continued avoidance of exposure to the infectious virus in public transportation exacerbated urban traffic and environmental problems. The paper aims to evaluate the impact of travel demand management strategies during the COVID-19 pandemic in Tehran, Iran. That city provided a unique case study because of its high COVID-19 contagion and death rates, traffic congestion, and lack of government restriction plans, which are common in developing countries. Four scenarios combining various travel demand management strategies were considered during the pandemic. The findings highlight the importance of considering the tradeoffs between different performance measures when selecting a suitable travel demand management strategy. Depending on the goals that decision-makers have set, the strategies may not be additive. While teleworking, e-learning, and rescheduling working hours all help reduce traffic congestion, the pricing strategy contributes significantly to meeting environmental and health goals. The findings also highlight the nonlinear pattern of change associated with each strategy.
1. Introduction
COVID-19 has had an unprecedented impact on people’s lives worldwide. It has claimed millions of lives and overburdened hospitals, and new variants continue to pose threats to healthcare systems. Transportation systems, like many other systems, have experienced changes such as different travel behavior and mode preferences, new policies, and new infrastructure planning [1,2]. During COVID-19 and its lockdown periods, travel demand plunged by 40 to 90% around the world from Sydney, Australia, to London, UK, Phoenix, USA, and Pune, India [3,4]. In addition to the overall reduced demand, preferences for travel modes and patterns also changed [5,6,7,8]. The high risk of virus exposure caused people to cancel their recreational trips or not use mass transport [9,10].
Social distancing, according to public health experts, is one of the most effective tools for containing the spread of COVID-19. Because of its protective effect, local and federal governments mandated social distancing via school closures, reduced of mass transport systems and telecommuting capacity, and more restricted stay-at-home orders. Traveler behavior also changed because of the perceived risk of contracting the virus. As a result, the pandemic has had a significant impact on both travel decisions and modes of transportation [11]. For instance, Zhang et al. indicated that the local travel numbers for Hong Kong’s Metro Transport Railway were reduced by 43–59% on weekdays and weekends [12].
As people realized that COVID-19 is an airborne disease, they tended to avoid public transport to reduce their risk of exposure to the SARS-CoV-2 virus [13] during lockdowns and afterward. As a result, private cars, bicycles, walking, telecommuting, and online shopping/school have replaced public transport trips [14,15,16,17,18]. Even after a year into the pandemic, twenty metropolitan areas in the US faced a 40–80% reduction in public transport trips [19]. Besides concerns of contracting the virus from close contact on mass transport, stay-at-home and lockdown orders and changes in public transport service levels have resulted in a 75% decrease in public transport numbers [20].
The impacts will not be limited to the short-term; long-term impacts will continue to affect transportation systems. Similar to current patterns, Salon et al. [21] reported that public transport trips will decline by 40% in post-pandemic times. Half of that reduction will mainly derive from changes in trip frequencies, like trips being replaced by telecommuting, and the remainder from trips shifting to other modes, mostly private cars. The changes will also extend to deeper layers of travel behavior. As an example, 18% of non-car owners in Boston, US, have decided to purchase a car for fear of using public transport with its higher risk of contracting the virus. Using observation and survey data and from a modelling perspective, Wang et al. [22] showed that New York City will face a 142% increase in car trips compared to pre-pandemic levels. In contrast, public transport numbers will only reach 73% of pre-COVID levels. A reduction in public transport trips will eventually shrink the quantity and quality of mass transport systems. However, that creates equity concern for the low-income population, who will rely more on them, though it may present opportunities to promote other transport modes such as bike sharing, which are more sustainable and do not increase the risk of exposure to the virus [23]. Other studies have indicated that public transport is also being replaced by private cars in developing countries. However, other travel patterns, like remote shopping, did not occur as much during the pandemic because of their weak e-commerce infrastructure [24,25].
The aim is to evaluate travel demand strategies that can mitigate the effects of COVID-19 (focusing on the first waves, started in January 2020) on the transportation sector and align systems toward more sustainable transportation goals. It is critical to develop policies that will allow transport systems to adapt to new changes in travel behavior. Despite all the challenges the pandemic has brought to transport systems, there is a unique opportunity to shape a more sustainable future for them [15,26]. For example, positive attitudes toward telecommuting can help reduce portions of commuter trips that did not appear to be replaceable previously. Both demand- and supply-side strategies should be considered to mitigate congestion and the environmental impacts of the shift toward increased private car usage. Regulations like reducing the carbon intensity of the transportation sector, as well as demand-side strategies like reducing travel demand, pricing, and telecommuting, can help mitigate the effects of COVID-19. The window of opportunity to reshape transportation systems is supported as the public support government decisions for allocating funding to public transportation [16]. During COVID-19, Tehran, Iran, was chosen as a testbed to study the effect of urban travel demand management (TDM) strategies. Iran faced peaks of COVID-19 no later than a month after the first case was reported in February 2020 and thus ranked among the top ten countries for rates of contagion and death. Tehran, as the capital, has also experienced congested traffic and negative health outcomes resulting from vehicle emissions exposure.
As a result, it is critical to quantify the observed changes in travel patterns in Tehran without a strict stay-at-home order and investigate the factors driving these patterns. While financial support backed more restrictive plans in developed countries, resulting in more predictable travel patterns, loose restrictions combined with limited access to vaccines send contradictory signals to people in developing countries. As a result, the effects of chaotic events like pandemics on travel patterns in developing countries are more unpredictable. The findings could help in planning for the long-term impact of COVID-19 as well as similar unexpected cases in the future. Furthermore, because developing countries are already struggling to meet emission reduction targets, it is critical to examine climate change actions and justice concerns through the lens of a developing country.
The remainder of this paper is organized as follows. Section 2 describes the study area, while Section 3 presents the methodology, which includes TDM strategies, TDM scenarios, and their implications for traffic and emissions, followed by a discussion in Section 5. The paper concludes with a summary of its findings and future research directions.
2. Study Area
Tehran, the capital of Iran, with a population of more than 8.8 million, is the second most populated metropolitan in the Middle East [27], with a very dense population of 11,800 residents per square kilometer and an average of 1.68 people per room in homes [28]. It has 18.3 million vehicle trips per day, an increase of 23% during the past decade [29]. Despite seven subway and ten Bus Rapid Transit lines, the private vehicle is the first mode chosen for urban trips (50%), with 21% choosing public transportation, 18% taxi (jitneys), 7% motorcycle, and 4% other modes [30].
Increasing car usage, subsidized gasoline, and other car-friendly policies have led to severe traffic congestion and air pollution [29,31,32]. Traffic-related emissions are one of the most significant sources of air pollution in Tehran, the 12th most polluted city among the world’s 26 megacities in terms of ambient particulate matter less than 10 μm, including matter at PM2.5 and PM10 [33,34]. To relieve traffic congestion and reduce transportation pollution, congestion pricing (CP), one of the most effective TDM strategies [27,35,36], has been implemented for private vehicles in Tehran (Figure 1). The type of congestion pricing in Tehran is zone-based, which involves setting surcharges for a specific congested area. Users are charged for either driving within or in/out of that area.
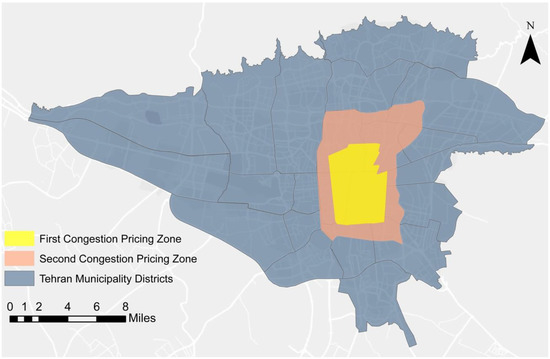
Figure 1.
Study area and congestion pricing zones.
As indicated in Figure 1, the CP scheme consists of two rings, which impose additional fees on drivers entering them. The charge is composed of a base toll multiplied by various coefficients based on the vehicle emission type (A technical inspection certificate is assigned to each vehicle regarding the level of its carbon monoxide emission), residential location, travel area (first ring, second ring, or outer area), and travel time (peak and off-peak). For instance, a vehicle with premium certificates for carbon monoxide emissions (e.g., hybrid) that passes through the rings during off-peak would pay much less. The charging time is from 6:30 to 19:00 and there’s a discount for drivers with pre-charged toll accounts. Due to its congested traffic conditions, the base toll for the first (inner) ring is about twice higher, while vehicles can enter the second (outer) ring for up to 20 days per season for free. Exemptions are made for weekends, holidays, and motorcycles, buses, and taxis.
3. Methods
Figure 2 illustrates the framework developed for this study for modeling TDM scenarios using the multimodal transportation planning system. The TDM strategies considered during the pandemic were defined first, followed by their potential impact on travel patterns. Different sources, such as survey data and policy regulations, were employed to explain a strategy’s impact on travel patterns. Next, mixed TDM scenarios were proposed, and variant interactions of the strategies were tested by the bilingual Multimodal Transportation Planning Software known as Multimodal Equilibrium (EMME/2). For instance, Scenario 1 included teleworking and e-learning, and Scenario 2 consisted of teleworking, e-learning, and changing the CP scheme. Each scenario impacted different steps of the transportation plan, such as trip generation or mode choice. As a case in point, trip work was affected by teleworking since some employees work remotely, so their routine trips were removed from the applied demand on the network. In this step, the pre-estimated Origin Destination (OD) matrices for 650 travel analysis zones were changed to reflect the scenario impacts by trip purpose and mode (including private vehicle, public transport, taxi, etc.). The updated OD matrices were assigned to the network during the morning peak hour. The comparative analysis of traffic, emissions, and energy impacts of each scenario was evaluated for the case study by employing different measures.
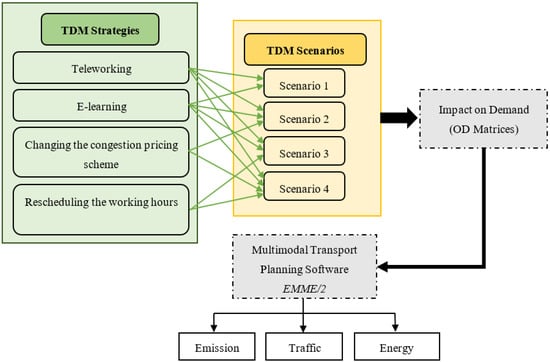
Figure 2.
Framework of Analysis of TDM Strategies during the COVID-19 Pandemic.
3.1. TDM Strategies
The current study considers the four TDM strategies implemented during the COVID-19 pandemic below.
3.1.1. Teleworking
Teleworking (sometimes called telecommuting) is a method of organizing and working from home by using information and technology rather than traveling to a workplace [37]. Teleworking, as a TDM strategy, reduces trip generation and contributes to reduced traffic congestion, vehicle miles traveled and traffic-related air pollution [38,39]. While teleworking may lead to better autonomy, job satisfaction, and a reduction in work-family conflict, it can harm professional relationships [40]. Due to the COVID-19 pandemic, teleworking is now more than just a research topic [41]. It is likely to persist to some extent, given its acceptance and preference among employees and employers [42,43]. It is expected to control the further spread of the virus by decreasing commuting trips by personal vehicles and public transport [39].
Because of widespread COVID-19, Tehran, like cities worldwide, used teleworking during the pandemic. Teleworking was implemented by requiring a certain percentage of employees, based on their job type, to work from home. The target groups’ percentage was adjusted based on the number of positive cases in the city. However, due to the economic crisis and lacking technology infrastructure, it was not feasible to ask a large percentage of employees to work remotely. A survey of 500 individuals who work as managers or decision-makers was conducted to evaluate the potential of teleworking based on the current infrastructure [44]. Overall, the results suggested that teleworking for 10–20% of employees might be feasible in the current situation. Additionally, analysis of the traffic camera records for the CP rings showed a reduction of 15–25% of traffic volumes entered them, which could be attributed to teleworking [45]. Based on these statistics, this study considered the scenario of 20% of employees teleworking. Indeed, to simulate the policy impact, a coefficient of 0.8 was applied to the components of the OD matrices of Tehran work trips.
3.1.2. E-Learning
Education was one of the sectors significantly affected by the COVID-19 pandemic. To curb the spread of COVID-19, many governments decided to temporarily close educational institutions [46], including the one for this study. Hence, e-learning, referring to the design, development and delivery of educational materials by the internet and other virtual technologies, became more common [47]. In order to take account of the e-learning scenario, education trip OD matrices were removed from the network assignment.
3.1.3. Changing the Congestion Pricing Scheme
In order to control the spread of virus, some changes were applied to the CP scheme. The charging time for both CP zones (Figure 1) was shortened. Before the pandemic, private vehicles paid fees for commuting throughout the pricing zones between 6:30 and 17:00 whereas the new policy imposes fees between 8:30 and 14:00. Consequently, some people who used to commute by public transport might now prefer to use their own passenger vehicle. Perhaps they would not be charged anymore (as they entered the pricing zones before the charging time started and left it after it ended) or wanted to avoid the crowding in public transport.
A comprehensive analysis was conducted of users’ travel behavior in response to these changing CP schemes [44]. This paper used the results of its previous analysis, which included a questionnaire design, net-based and paper-based surveys, and an analysis of 1500 respondent travel patterns. According to the data collected, changing the CP scheme increased the use of private vehicles by 25% and decreased the use of public transport and taxis by 18% and 7%, respectively. These modifications were made to the OD matrices of each mode before assigning matrices to the private and public networks.
3.1.4. Rescheduling Working Hours
Rescheduling working hours is a TDM strategy focused on departure time and aims to control and manage travel demand throughout the day or for a specific period, such as the morning peak. Because of the congested traffic conditions in Tehran during morning peak periods, which worsened during the COVID-19 pandemic, decision-makers considered rescheduling working hours by shifting the start-time for some employees earlier by 0.5 to 1 h to reduce the morning peak traffic volume. Because there was a modal shift from public transportation to private vehicles to avoid crowding and reduce the risk of infection, this strategy should have alleviated traffic congestion. According to an analysis of traffic camera records, it reduced the morning peak traffic by 3%, which was used in the simulation’s related scenario [44,45].
3.2. TDM Mixed Scenarios
In order to simulate the traffic and emission impacts of TDM strategies, specific scenarios were defined and implemented in the EMME/2 software (Table 1). The frequency of policies implemented by the authorities during the study was used to select strategies within each scenario. Teleworking and e-learning, for example, have been considered since the beginning of the pandemic and are still among the executive policies. Descriptions of each scenario follow Table 1.

Table 1.
TDM scenarios during the COVID-19 pandemic for the case of Tehran.
TDM1: The combination of teleworking and e-learning was considered for this scenario. In this regard, 20% of work trips and all education trips were removed from the base demand. In the simulation, a coefficient of 0.8 was applied to the components of the work trip OD matrices while the OD matrices of education trips are not applied to the networks.
TDM2: The combination of teleworking, e-learning, and changing the CP scheme was considered for this scenario. Besides the previous changes, some modifications were made to the use of private vehicles, public transport, and taxis. Work trip OD matrices were multiplied by 0.8, and education trip OD matrices were removed before mode choice. After determining the OD matrices for each mode, a 25% increase was applied to the private vehicle matrices, an 18% decrease to public transport matrices, and a 7% decrease to the taxi matrices to represent the effect of changing the CP scheme. Next, these modified matrices were assigned to the networks.
TDM3: The combination of teleworking, e-learning, and rescheduling working hours was considered for this scenario. The education trip OD matrices were removed again. Since shifting the working hours reduced the traffic by 3%, a 0.8–3% coefficient was applied to the components of the work trip OD matrices to show the simultaneous effect of teleworking and rescheduling working hours.
TDM4: This scenario considers the four strategies together. Indeed, to simulate TDM 4, the education trips matrices were removed; 23% of work trips were removed; in the mode choice process, +25%, −18%, and −7% changes were applied to the OD matrices for private vehicles, public transport, and taxis, respectively.
3.3. Travel Demand Forecasting Model (EMME/2: Equilibre Multimodal/Multimodal Equilibrium)
In this paper, EMME/2, a multi-mode urban transportation forecasting system, was used to evaluate the TDM policies. This system was calibrated and used to model Tehran’s long-range transportation plans [48]. The demand prediction process included steps such as trip generation, trip distribution, mode choice forecasting, and freight transportation. The outcome was travel demand in the form of a PCE (passenger-car-equivalent) and public transport vehicles assigned to the auto and public transport networks. EMME/2 combined the aggregate demand model with equilibrium type road assignment and transit assignment methods [49]. The results of simulating TDM scenarios could then be presented in the form of different network measures such as average PCE speed, total travel time, total distance traveled, and delay. The emission impacts of the scenarios during the pandemic were then analyzed by integrating network measures with air pollution models (fuel consumption and vehicle emissions). The emission and fuel consumption factors were assigned to links based on their speed and road type, and the final emission inventory or fuel consumption was calculated by multiplying emission factors by the Vehicle Kilometer Traveled (VKT) on each link.
4. Results
This section discusses the TDM scenario results by first analyzing traffic conditions, then emissions and energy impacts.
4.1. Traffic Impact
To investigate traffic conditions in the TDM scenarios, various measures were chosen like the average speed, total travel time, delay (as a percentage of total travel time), VKT, and the percentage of the network area whose volume over capacity ratio (V/C) was greater than one. Table 2 indicates the network measures for the TDM scenarios and the base scenario of do-nothing. Note that all scenarios were run for the morning peak period (7:00–9:00) because of the software’s limitation. The values in the base scenario (e.g., a 55% delay) also indicated the need for transportation policies to alleviate Tehran’s traffic congestion. Overall, the results revealed the positive impacts of all the TDM scenarios on transportation network performance compared to the base scenario.
Table 2.
TDM scenarios impact on traffic conditions in the morning peak period.
Figure 3 better compares the effect of different scenarios on traffic network measures. For simplification, a change’s direction was ignored. Only the positive effects explicitly highlighting an increase in average speed or reducing other measures, like travel time, were noted. According to the results, TDM1 and TDM3 resulted in improved network performance by the elimination of educational trips (e-learning) and changes in the OD matrices of work trips (teleworking), which resulted in reduced morning peak trips and traffic volumes. TDM1 and TDM3 boosted average speed by 27% and 29%, respectively. Furthermore, their total travel times were reduced by 38% and 40%, respectively. TDM3 had more impact by rescheduling working hours, which caused employees to shift their departure times before the morning peak.
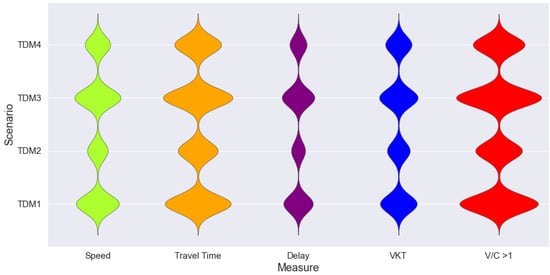
Figure 3.
Comparison of positive impacts of TDM scenarios on traffic network measures.
TDM4 and TDM2 were less effective but, with a distinction, could be considered equivalent to TDM3 and TDM1. That distinction refers to the increased use of private vehicles resulting from the changed CP schemes. Because TDM4 and TDM2 increased the use of private vehicles, their positive impacts trailed those of the other two scenarios. As a result, their percentage of positive impact on average speed was 16% and 13%, respectively. These scenarios also had a lower overall impact on travel time (27 and 23%). Furthermore, the percentage of network area having V/C > 1 varied the most among the different traffic measures, from 28% for TDM2 to 51% for TDM3. The shortest range also belonged to delay, which was reduced by 9 to 21% in various TDM scenarios.
4.2. Emission Impact
The different TDM scenarios impacted emissions on the transportation network’s performance. The amount of traffic-related air pollutants (CO, HC, and NOx) per kilometer was assumed to be a function of vehicle technology, fuel type, and vehicle speed [48]. These functions were defined for each vehicle type and entered into the software’s traffic assignment model, which then estimated the total emission inventory for each scenario based on emission rates and traffic volumes by vehicle type (Table 3). According to the results, implementing the proposed scenarios had significant environmental consequences. For example, combining teleworking and e-learning (TDM1) reduced CO emissions from 480,068 kg to 326,235 kg. In the case of HC, implementing TDM3 and TDM4 reduced emissions by 19,690 kg and 13,542 kg, respectively.
Table 3.
TDM scenario impacts on emissions in the morning peak period.
Figure 4 indicates the percentage of the TDM scenarios’ positive impacts on Tehran’s traffic emissions. When emission reductions were considered positively, the positive value in the figure corresponds to a scenario’s reduction. In the same way that traffic measures had a larger positive impact than TDM2 and TDM4, TDM1 and TDM3 had a larger positive impact than TDM2 and TDM4. According to the results, TDM3 had the most significant impact, reducing traffic emissions of CO, HC, and NOx by 34, 35, and 18%, respectively. Furthermore, the variation in the range of changes could have referred to the assumed emission rates for the various vehicle types. The findings showed that demand changes caused by the scenarios that reduced private car traffic volumes had more impact on CO and HC than NOx.
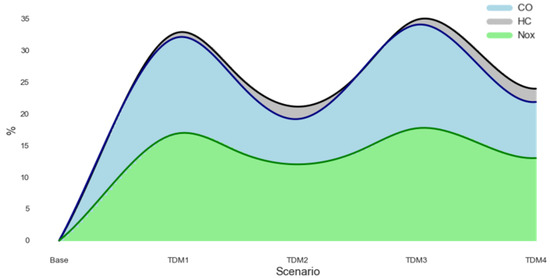
Figure 4.
The percentage of positive impacts on traffic emissions for the TDM scenarios.
4.3. Energy Impact
TDM scenarios could also be evaluated from an energy standpoint, in addition to their effects on traffic and emissions. Among several possible factors, fuel consumption was chosen for that analysis. Fuel consumption was assumed to be proportional to vehicle type and speed. In this regard, the average speed of each link was computed in the traffic assignment step, followed by the fuel consumption per roadway kilometer for each vehicle type. The total fuel consumption was calculated by multiplying the calculated rates by traffic volumes (by vehicle type) and the length of the link. Table 4 shows the fuel consumption by gas and gas oil for each TDM scenario.
Table 4.
TDM scenario impacts on energy in the morning peak period.
The percentage of reduction of fuel consumption for each scenario is shown in Figure 5. As expected, scenarios that result in higher average speed and lower VKT reduced fuel consumption (TDM1 and TDM3) more. Furthermore, the range of reduction was not significantly different for each fuel type. In addition to financial savings, reducing fuel consumption may prevent damage to the ecosystem and health.
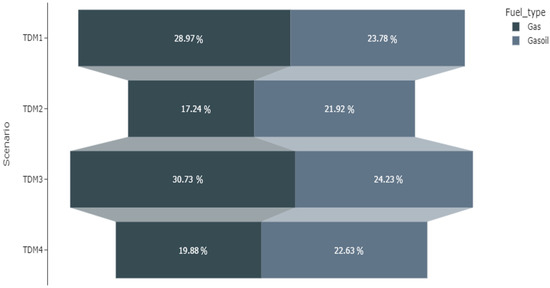
Figure 5.
The percentage of positive impacts of TDM scenarios on fuel consumption.
5. Discussion
Based on the scenarios that changed traffic, emission, and energy conditions, TDM3 appeared to perform best, followed by TDM1 and the other remaining scenarios. Even though the percentage of positive impacts varied for each measure, the order was the same due to the interdependence of traffic and emission variables. It was also critical to understand why one scenario performed better and whether improving traffic and emission conditions sufficed to implement improvement during the pandemic.
Teleworking and e-learning were implemented by changing the OD matrices directly for specific trip purposes. That resulted in a particular base improvement in traffic conditions, as shown by TDM1, and would also have been the case in the other scenarios. The interaction of these policies, together with rescheduling working hours, increased benefits for the traffic by excluding more trips from the morning peak period (TDM3). Regardless of these policies, however, relaxing the CP scheme negatively impacted traffic conditions as it encouraged some users to switch from public transportation to private cars, which were safer during the pandemic. In this way, relaxing CP decreased the positive effects of the other policies.
It should be noted that the effects of transportation demand management strategies during pandemics may differ from those during normal times [50]. In most cases, the emphasis was on managing private vehicles with strategies aimed at reducing that mode’s use, particularly single-occupancy vehicles. However, during pandemics like COVID-19, the goal was not only to manage travel demand but also to reduce the risk of COVID-19 exposure on public transport. Due to the nature of the virus, being in a crowd, especially in indoor spaces such as public transport, increased the risk of infection significantly [51,52]. Therefore, relieving the traffic conditions and reducing transportation health consequences were not the only target of the TDM strategies. To increase public health, authorities had to pay attention to virus transmission in transportation systems.
Figure 6 summarizes the findings of this study. The TDM scenarios, including their mixed strategies, are depicted on the x-axis, and on the y-axis are the improvement in traffic and emission measures for the simulations. As previously stated, changing CP schemes significantly increased the risk of spreading COVID-19, whereas shifting to private vehicles and managing public transport crowding reduced its transition and improved public health. As a result, decision-maker priorities directly influenced their strategy selection. Based on Figure 6, if traffic and emission measures are the primary criteria to improve, the mixed scenarios of teleworking, e-learning, and rescheduling working hours indicate an optimal scenario, while taking the pandemic crisis into account would change the story. CP imposes the usual time/cost constraints in this case, implying that more users will use the public transport system and face spreading COVID-19. Changing the CP scheme, on the other hand, reduces the risk of infection while also reducing the positive traffic impacts, as shown by moving from the left to the right side of the figure.
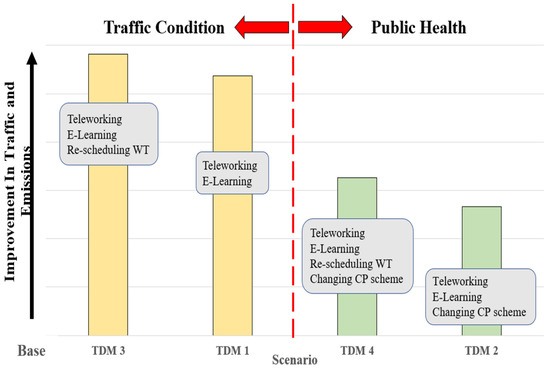
Figure 6.
Impacts of TDM strategies on traffic and emission conditions and public health during the pandemic.
Decision-makers can use the impact of each scenario on traffic, emissions, and energy, as well as the number of COVID-19 patients, to identify the appropriate actions. While it is important to balance the tradeoffs between different performance measures in normal condition, it becomes vital under emergency conditions like a global pandemic. The fact that transit agencies are struggling to survive across the world, make the changes vital to resume the goal of sustainable transportation. This is also true about disruptive technologies such as autonomous vehicles that may increase driving mode shares and deteriorates several performance measures such as delay and travel time. TDM strategies discussed here and the suggested tradeoff mechanism can help to keep the balance between different goals under such conditions.
6. Conclusions
COVID-19 has had an unprecedented impact on transportation systems in various ways. Some changes are expected to last long after the pandemic is over. While early in the pandemic, travel activities were reduced due to lockdown orders, later, after the reopening phases, traffic congestion resurfaced again. Cities with congestion and air pollution issues are now facing a new challenge. People tend to rely more on private vehicles and avoid exposure to the virus on public transport. This new travel pattern could negatively affect climate change goals and further exacerbate traffic congestion and public health [22].
A framework was developed to evaluate relevant travel demand strategies for various metrics such as traffic, emissions, and energy impacts. The findings highlight the importance of considering the tradeoffs between different performance measures when selecting a suitable set of TDM strategies. The strategies may not be additive for the goals decision-makers have set for their plans. While teleworking, e-learning, and rescheduling working hours helped to reduce traffic congestion, the pricing strategy contributed significantly to meeting environmental and health goals. The findings also highlighted the nonlinear pattern of change associated with each TDM strategy.
The study also has limitations. For starters, our analysis only covers one case study. People did behave differently in other parts of the world. For instance, people’s reaction to COVID was poles apart in developed versus developing countries. Our goal was to provide a framework and apply that to a developing country which was less studied in the existing literature. EMME/2 has only been organized to evaluate transportation projects during morning peak hours. For example, policies like rescheduling working hours aim to shift some trips from peak to off-peak periods. As a result, the effect of shifted demand on off-peak hours should be studied outside the model. Secondly, in modeling the TDM strategies for this study, simplifying assumptions were made. Teleworking, for example, necessitates specialized infrastructure that may not be readily available in some developing countries. Consequently, a rough estimate of 20% teleworking should be regarded as an optimistic scenario. Another extension of this study would involve the use of other data sources to control the change in demand in response to policies. Using public transport usage data, for example, would help to improve the accuracy of any modal shift during the pandemic.
Author Contributions
Conceptualization, A.B., A.R.M. and M.H.; methodology, A.B., A.R.M. and M.H.; software, A.B. and M.T.; writing—review and editing, A.B., M.T., A.R.M., O.G. and M.H.; supervision, A.R.M. and O.G.; All authors have read and agreed to the published version of the manuscript.
Funding
This research received no external funding.
Institutional Review Board Statement
Not applicable.
Informed Consent Statement
Not applicable.
Data Availability Statement
Not applicable.
Acknowledgments
We would like to thank Tehran Traffic and Transportation Organization for providing accessibility to Tehran Transportation Planning Models System. The data is collected by the consortium of Amirkabir University of Technology (Tehran Polytechnic) and Tarbiat Modares University. Also, we would like to thank the reviewers for taking the necessary time and effort to review the manuscript. We sincerely appreciate all their valuable comments and suggestions, which helped us in improving the quality of the manuscript.
Conflicts of Interest
The authors declare no conflict of interest.
References
- Patil, G.R.; Dhore, R.; Bhavathrathan, B.K.; Pawar, D.S.; Sahu, P.; Mulani, A. Consumer responses towards essential purchases during COVID-19 pan-India lockdown. Res. Transp. Bus. Manag. 2022, 43, 100768. [Google Scholar] [CrossRef]
- Bauer, M.; Bauer, K. Analysis of the Impact of the COVID-19 Pandemic on the Future of Public Transport: Example of Warsaw. Sustainability 2022, 14, 7268. [Google Scholar] [CrossRef]
- Praharaj, S.; King, D.; Pettit, C.; Wentz, E. Using Aggregated Mobility Data to Measure the Effect of COVID-19 Policies on Mobility Changes in Sydney, London, Phoenix, and Pune. Findings 2020. [Google Scholar] [CrossRef]
- Shemer, L.; Shayanfar, E.; Avner, J.; Miquel, R.; Mishra, S.; Radovic, M. COVID-19 Impacts on Mobility and Travel Demand. Case Stud. Transp. Policy 2022, 10, 2519–2529. [Google Scholar] [CrossRef]
- Grechi, D.; Ceron, M. COVID-19 lightening the load factor in railway transport: Performance analysis in the north-west area of Milan. Res. Transp. Bus. Manag. 2022, 43, 100739. [Google Scholar] [CrossRef]
- Loo, B.P.Y.; Huang, Z. Spatio-temporal variations of traffic congestion under work from home (WFH) arrangements: Lessons learned from COVID-19. Cities 2022, 124, 103610. [Google Scholar] [CrossRef]
- Das, S.; Boruah, A.; Banerjee, A.; Raoniar, R.; Nama, S.; Maurya, A.K. Impact of COVID-19: A radical modal shift from public to private transport mode. Transp. Policy 2021, 109, 1–11. [Google Scholar] [CrossRef]
- Pawar, D.S.; Yadav, A.K.; Choudhary, P.; Velaga, N.R. Modelling work- and non-work-based trip patterns during transition to lockdown period of COVID-19 pandemic in India. Travel Behav. Soc. 2021, 24, 46–56. [Google Scholar] [CrossRef]
- Szczepanek, W.K.; Kruszyna, M. The Impact of COVID-19 on the Choice of Transport Means in Journeys to Work Based on the Selected Example from Poland. Sustainability 2022, 14, 7619. [Google Scholar] [CrossRef]
- Li, Y. Common Sharing or Public Sharing: A Study on the Choice Behavior of Urban Citizens in Public Travel. Sustainability 2022, 14, 9459. [Google Scholar] [CrossRef]
- Javid, M.A.; Ali, N.; Campisi, T.; Tesoriere, G.; Chaiyasarn, K. Influence of Social Constraints, Mobility Incentives, and Restrictions on Commuters’ Behavioral Intentions and Moral Obligation towards the Metro-Bus Service in Lahore. Sustainability 2022, 14, 2654. [Google Scholar] [CrossRef]
- Zhang, N.; Jia, W.; Wang, P.; Dung, C.H.; Zhao, P.; Leung, K.; Su, B.; Cheng, R.; Li, Y. Changes in local travel behaviour before and during the COVID-19 pandemic in Hong Kong. Cities 2021, 112, 103139. [Google Scholar] [CrossRef]
- Shen, J. Measuring the impact of mitigation measures on infection risk of COVID-19 in Hong Kong since February 2020. Cities 2021, 114, 103192. [Google Scholar] [CrossRef] [PubMed]
- Bhaduri, E.; Manoj, B.S.; Wadud, Z.; Goswami, A.K.; Choudhury, C.F. Modelling the effects of COVID-19 on travel mode choice behaviour in India. Transp. Res. Interdiscip. Perspect. 2020, 8, 100273. [Google Scholar] [CrossRef]
- Griffiths, S.; Furszyfer Del Rio, D.; Sovacool, B. Policy mixes to achieve sustainable mobility after the COVID-19 crisis. Renew. Sustain. Energy Rev. 2021, 143, 110919. [Google Scholar] [CrossRef]
- Habib, M.A.; Anik, M.A.H. Impacts of COVID-19 on Transport Modes and Mobility Behavior: Analysis of Public Discourse in Twitter. Transp. Res. Rec. J. Transp. Res. Board 2021, 03611981211029926. [Google Scholar] [CrossRef]
- Ecke, L.; Magdolen, M.; Chlond, B.; Vortisch, P. How the COVID-19 pandemic changes daily commuting routines—Insights from the German Mobility Panel. Case Stud. Transp. Policy 2022, 10, 2175–2182. [Google Scholar] [CrossRef] [PubMed]
- Teixeira, J.F.; Silva, C.; Moura e Sá, F. The strengths and weaknesses of bike sharing as an alternative mode during disruptive public health crisis: A qualitative analysis on the users’ motivations during COVID-19. Transp. Policy 2022, 129, 24–37. [Google Scholar] [CrossRef] [PubMed]
- Qi, Y.; Liu, J.; Tao, T.; Zhao, Q. Impacts of COVID-19 on public transit ridership. Int. J. Transp. Sci. Technol. 2021, in press. [Google Scholar] [CrossRef]
- Parker, M.E.G.; Li, M.; Bouzaghrane, M.A.; Obeid, H.; Hayes, D.; Frick, K.T.; Rodríguez, D.A.; Sengupta, R.; Walker, J.; Chatman, D.G. Public transit use in the United States in the era of COVID-19: Transit riders’ travel behavior in the COVID-19 impact and recovery period. Transp. Policy 2021, 111, 53–62. [Google Scholar] [CrossRef]
- Salon, D.; Conway, M.W.; da Silva, D.C.; Chauhan, R.S.; Derrible, S.; Mohammadian, A.; Khoeini, S.; Parker, N.; Mirtich, L.; Shamshiripour, A.; et al. The potential stickiness of pandemic-induced behavior changes in the United States. Proc. Natl. Acad. Sci. USA 2021, 118, e2106499118. [Google Scholar] [CrossRef] [PubMed]
- Wang, D.; He, B.Y.; Gao, J.; Chow, J.Y.J.; Ozbay, K.; Iyer, S. Impact of COVID-19 behavioral inertia on reopening strategies for New York City transit. Int. J. Transp. Sci. Technol. 2021, 10, 197–211. [Google Scholar] [CrossRef]
- Basu, R.; Ferreira, J. Sustainable mobility in auto-dominated Metro Boston: Challenges and opportunities post-COVID-19. Transp. Policy 2021, 103, 197–210. [Google Scholar] [CrossRef] [PubMed]
- Paul, T.; Chakraborty, R.; Anwari, N. Impact of COVID-19 on daily travel behaviour: A literature review. Transp. Saf. Environ. 2022, 4, tdac013. [Google Scholar] [CrossRef]
- Zhang, J.; Hayashi, Y.; Frank, L.D. COVID-19 and transport: Findings from a world-wide expert survey. Transp. Policy 2021, 103, 68–85. [Google Scholar] [CrossRef]
- Sunio, V.; Mateo-Babiano, I. Pandemics as ‘windows of opportunity’: Transitioning towards more sustainable and resilient transport systems. Transp. Policy 2022, 116, 175–187. [Google Scholar] [CrossRef]
- Habibian, M.; Rezaei, A. Accounting for systematic heterogeneity across car commuters in response to multiple TDM policies: Case study of Tehran. Transportation 2017, 44, 681–700. [Google Scholar] [CrossRef]
- World Population Review No Title. Available online: Worldpopulationreview.com/world-cities/tehran-population (accessed on 15 December 2021).
- Soltanpour, A.; Mesbah, M.; Habibian, M. Customer satisfaction in urban rail: A study on transferability of structural equation models. Public Transp. 2020, 12, 123–146. [Google Scholar] [CrossRef]
- Transportation and Traffic Organization of Tehran Municipality. Tehran’s Urban Transportation Information and Statics; 2020. Available online: https://traffic.tehran.ir/ (accessed on 25 July 2022).
- Lesteven, G.; Samadzad, M. Ride-hailing, a new mode to commute? Evidence from Tehran, Iran. Travel Behav. Soc. 2021, 22, 175–185. [Google Scholar] [CrossRef]
- Akbari, F.; Mahpour, A.; Ahadi, M.R. Evaluation of Energy Consumption and CO2 Emission Reduction Policies for Urban Transport with System Dynamics Approach. Environ. Model. Assess. 2020, 25, 505–520. [Google Scholar] [CrossRef]
- Heger, M.; Sarraf, M. Air Pollution in Tehran: Health Costs, Sources, and Policies; World Bank: Washington, DC, USA, 2018. [Google Scholar]
- Mahoutchi Saeid, K.; Esfahanian, V.; Ahmadi Kia, H.; Ohadi, A.; Hojjat, Y.; Khazini, L.; Taleei, M.; Rashidi, Y.; Ramezanian, N.; Soleimani, M.; et al. Emissions of Air Pollutants, Management Report; University of Tehran Press: Tehran, Iran, 2021; ISBN 978-964-03-0246-0. [Google Scholar]
- Baghestani, A.; Tayarani, M.; Allahviranloo, M.; Oliver Gao, H. Cordon pricing, daily activity pattern, and exposure to traffic-related air pollution: A case study of New York City. Atmosphere 2021, 12, 1458. [Google Scholar] [CrossRef]
- Baghestani, A.; Tayarani, M.; Allahviranloo, M.; Nadafianshahamabadi, R.; Kucheva, Y.; Mamdoohi, A.R.; Oliver Gao, H. New York City cordon pricing and its’ impacts on disparity, transit accessibility, air quality, and health. Case Stud. Transp. Policy 2022, 10, 485–499. [Google Scholar] [CrossRef]
- He, S.Y.; Hu, L. Telecommuting, income, and out-of-home activities. Travel Behav. Soc. 2015, 2, 131–147. [Google Scholar] [CrossRef]
- Mokhtarian, P.L.; Collantes, G.O.; Gertz, C. Telecommuting, residential location, and commute-distance traveled: Evidence from State of California employees. Environ. Plan. A 2004, 36, 1877–1897. [Google Scholar] [CrossRef]
- Olde Kalter, M.J.; Geurs, K.T.; Wismans, L. Post COVID-19 teleworking and car use intentions. Evidence from large scale GPS-tracking and survey data in the Netherlands. Transp. Res. Interdiscip. Perspect. 2021, 12, 100498. [Google Scholar] [CrossRef]
- Goulias, K.G.; Su, R.; Mcbride, E.C. Revisiting the Impact of Teleworking on Activity-Travel Behavior Using Recent Data and Sequence-Based Analytical Techniques; Report No. PSR-19-15; Pacific Southwest Region University Transportation Center (UTC): Long Beach, CA, USA, 2020.
- Ton, D.; Arendsen, K.; de Bruyn, M.; Severens, V.; van Hagen, M.; van Oort, N.; Duives, D. Teleworking during COVID-19 in the Netherlands: Understanding behaviour, attitudes, and future intentions of train travellers. Transp. Res. Part A Policy Pract. 2022, 159, 55–73. [Google Scholar] [CrossRef]
- Angell, C.; Potoglou, D. An insight into the impacts of COVID-19 on work-related travel behaviours in the Cardiff Capital Region and following the UK’s first national lockdown. Cities 2022, 124, 103602. [Google Scholar] [CrossRef]
- Beck, M.J.; Hensher, D.A. Insights into the impact of COVID-19 on household travel and activities in Australia—The early days under restrictions. Transp. Policy 2020, 96, 76–93. [Google Scholar] [CrossRef]
- Consortium of Amirkabir University of Technology and Tarbiat Modares University. Travel Behavior Analysis during the COVID-19, Tehran Travel Demand Management Research Studies, Final Questionnaire Report; Tehran Traffic and Transportation Organization: Tehran, Iran, 2021. [Google Scholar]
- Consortium of Amirkabir University of Technology and Tarbiat Modares University. Traffic Volume Changes during the COVID-19 Using Traffic Camera Records, Tehran Travel Demand Management Research Studies, Final Report; Tehran Traffic and Transportation Organization: Tehran, Iran, 2021. [Google Scholar]
- Cherkasova, M.; Sirotkin, V.; Kostyukov, A. E-learning for transportation professionals (post graduate program) during the COVID-19 pandemic. Transp. Res. Procedia 2022, 63, 254–263. [Google Scholar] [CrossRef]
- Adedoyin, O.B.; Soykan, E. Covid-19 pandemic and online learning: The challenges and opportunities. Interact. Learn. Environ. 2020, 1–13. [Google Scholar] [CrossRef]
- TCTTS. Tehran Mid-Range Transportation and Traffic Studies; Tehran Traffic Control Company: Tehran, Iran, 2000. [Google Scholar]
- Dueker, K.; Rao, R.L.; Cotugno, A.; Lawson, K.; Walker, R. The Impact of EMME/2 on Urban Transportation Planning: A Portland Case Study; Center for Urban Studies Publications and Reports. 78; Portland State University: Portland, OR, USA, 1985. [Google Scholar]
- Zhang, Z.; Fu, D.; Liu, F.; Wang, J.; Xiao, K.; Wolshon, B. COVID-19, Traffic Demand, and Activity Restriction in China: A National Assessment. Travel Behav. Soc. 2022, 31, 10–23. [Google Scholar] [CrossRef] [PubMed]
- Luo, K.; Lei, Z.; Hai, Z.; Xiao, S.; Rui, J.; Yang, H.; Jing, X.; Wang, H.; Xie, Z.; Luo, P.; et al. Transmission of SARS-CoV-2 in public transportation vehicles: A case study in Hunan Province, China. Open Forum Infect. Dis. 2020, 7, ofaa430. [Google Scholar] [CrossRef] [PubMed]
- Shabani, A.; Shabani, A.; Ahmadinejad, B.; Salmasnia, A. Measuring the customer satisfaction of public transportation in Tehran during the COVID-19 pandemic using MCDM techniques. Case Stud. Transp. Policy 2022, 10, 1520–1530. [Google Scholar] [CrossRef] [PubMed]
Disclaimer/Publisher’s Note: The statements, opinions and data contained in all publications are solely those of the individual author(s) and contributor(s) and not of MDPI and/or the editor(s). MDPI and/or the editor(s) disclaim responsibility for any injury to people or property resulting from any ideas, methods, instructions or products referred to in the content. |
© 2023 by the authors. Licensee MDPI, Basel, Switzerland. This article is an open access article distributed under the terms and conditions of the Creative Commons Attribution (CC BY) license (https://creativecommons.org/licenses/by/4.0/).