Article

Soil Salinity Weakening and Soil Quality Enhancement after Long-Term Reclamation of Different Croplands in the Yellow River Delta

1
Shandong Yucheng Agro-Ecosystem National Observation and Research Station, Institute of Geographic Sciences and Natural Resources Research, Chinese Academy of Sciences, Beijing 100101, China
2
College of Resources and Environment, University of Chinese Academy of Sciences, Beijing 100049, China
3
State Key Laboratory of Earth Surface Processes and Resource Ecology, Faculty of Geographical Science, Beijing Normal University, Beijing 100875, China
4
Chinese Research Academy of Environmental Sciences, Beijing 100012, China
5
College of Urban and Environmental Sciences, Peking University, Beijing 100871, China
6
Department of Civil & Environmental Engineering, College of Engineering, Florida A&M University—Florida State University, Tallahassee, FL 32310, USA
*
Authors to whom correspondence should be addressed.
Sustainability 2023, 15(2), 1173; https://doi.org/10.3390/su15021173
Submission received: 25 November 2022 / Revised: 5 January 2023 / Accepted: 6 January 2023 / Published: 8 January 2023
(This article belongs to the Section Soil Conservation and Sustainability)

Abstract

:
Saline soils are of great concern globally. Selecting the Yellow River Delta as a model site, the influence of reclamation on soil salinity and saline soil quality was investigated. Soil quality index (SQI) was applied to statistically analyze 210 soil profile samples collected at seven depth layers in 30 sampling sites among native saline soils and three croplands (peanut, cotton, and wheat) in May 2020. After reclamation, the soil salt content (SSC) reduced from 4.52 g/kg to 1.44 g/kg after reclamation, with the degree of soil salinity reducing from severe to slight. The nitrate nitrogen (NO3-N) contents of peanut, cotton, and wheat croplands were 1.90, 2.02, and 4.29 times higher and the available phosphorus (AP) contents were 5.43, 3.57, and 8.77 mg/kg higher than that of the saline soils, respectively, while the soil ammonium nitrogen (NH4+-N) and available potassium (AK) contents were decreased. The NO3-N, AN, and AP contents of the three croplands showed a significant surface aggregation at depth of 0–30 cm. SQI increased by 0.10, 0.09, and 0.02 after the reclamation with the enhancement effect of wheat and cotton was more pronounced. It was discovered that reclamation notably improved the soil quality as a result of crop growth and field management of fertilization and irrigation.

1. Introduction

Soil salinity is one of the main types of soil degradation, which is attributed to the combined effects of natural processes and human activities. Currently, it is a serious global threat to agricultural production and sustainable development, affecting more than 100 countries worldwide [1]. Saline soils cover 833 million hectares globally, occupying 8.7% of the earth’s surface area. Of irrigated soils on the continents, 20–50% are saline soils, and more than 1.5 billion people worldwide face major challenges to food security [2,3]. The causes of soil salinity include poor human management, improper fertilization, deforestation, soil erosion, sea level rising, saltwater intrusion, etc. Global climate change also intensifies soil salinity with significant negative impacts on the agriculture and local economy. For instance, damming of the Mississippi River prevents sediment supply and coastal resource development activities, especially oil and gas extraction, result in groundwater level decline and seawater intrusion, leading to increased soil salinity of farmlands [4,5]. In the Nile Delta of Egypt, the coastline constantly changes and seawater erosion results in high soil saline content [6,7]. The Mekong Delta in Vietnam has been invaded by the natural backwash of seawater in the southern region due to improper human development, and the high soil saline content has seriously affected local households and the good production [8,9]. With the construction of gates and dams in India, flooding in the rainy season, and flow in the dry season have caused increased seawater intrusion and reduction of agricultural irrigation [10,11]. With the increase in global food demand and the continuous decrease of available arable land, reclamation of salinized land becomes important globally.
The Yellow River Delta, as one of the major estuarine deltas in China, serves as an excellent example of saline soil reclamation. The Yellow River Delta is an alluvial plain formed by the sediment carried by the Yellow River into the Bohai Sea and deposited at the estuary of the sea [12,13,14]. Large areas of the Yellow River Delta are low-quality saline soils with low nutrient contents. The Yellow River Delta is significantly affected by seawater intrusion and extreme weather events induced by global climate change. Since the area is highly mineralized with shallow water, table salts are easily enriched on the soil surface, resulting in large and widely distributed saline soils in the region [15,16,17]. Soil salinity leads to poor soil physical and chemical properties, low nutrients, decreased freshwater resources, and eventually poor crop yields. In recent years, resulting from the influence of climate change and intensified farming, soil salinity in the Yellow River Delta has become an increasingly prominent problem of wide concern to local and state governments, and is also believed to be the primary factor limiting local land development and utilization as well as sustainable agricultural development and food security [18,19]. The reclamation of saline soils in this region has become more difficult because of the relatively high soil salinity in the offshore areas and the different degrees of salinity in different locations. It is crucial to develop salinized saline soil rationally to improve soil conditions, increase crop yield, enhance sustainable use, and optimize the management of saline soil resources. Reclamation and planting of salt-tolerant crops can not only raise ground cover and effectively inhibit soil reversion to salt, but also significantly ameliorate soil nutrient content and soil structure and promote agricultural production and sustainable development [20,21,22].
Soil quality, as an inherent property of soil, is a comprehensive reflection of soil’s physicochemical properties and plays an important role in maintaining soil productivity and promoting plant and animal health within the ecosystem [23,24]. Soil physical and chemical property characteristics are also an indicator of soil quality, which reflect the stability of the ecosystem. Therefore, the selection of appropriate evaluation methods is important for the accurate evaluation of soil quality [25]. At present, although there is no unified standard for soil quality evaluation, soil quality is typically analyzed using principal component analysis, cluster analysis, gray correlation analysis, fuzzy comprehensive evaluation, and the comprehensive index method. Soil quality index (SQI), a combination of physical, chemical, and biological indicators, has been widely and successfully applied in many studies at various scales and locations to assess soil quality visually and accurately. SQI can be used to fully consider measured soil indicators, which are framed through principal component analysis with both ascending and descending functions to determine the weight of each indicator in a unified system and calculate the index through scoring equations to compare the final values and soil quality [26].
The global deltas are facing the problems of land degradation and soil quality deterioration. The Yellow River Delta, as an important land resource in China, serves as an excellent example, which has undergone changes in soil salinity and soil quality after long-term reclamation. Previous studies assessing the effects of reclamation on soil salinity degree and nutrients by positioning observation or remote sensing, and most of the results are only based on visual characteristics of multiple indicators, so that few studies have used SQI to carry out such assessment and the comprehensive analysis of the overall characteristics of soil quality is still limited [27]. This study thus seeks to advance an understanding in this regard using the Yellow River Delta of China as a case study. Therefore, this study selected four land use types of reclaimed croplands in the Yellow River Delta and explored the influences of different land use types on physical and chemical soil properties at different depth layers to provide a reference for field management and the sustainable development of land productivity in saline soils. It was hypothesized that different land use types had different reclamation effects on soil reclamation. It was further hypothesized that the reclamation results varied with soil depth. The specific objectives of this research were: (1) to compare the distinct characteristics in soil physical and chemical properties at different soil depths of four land use types, (2) to analyze the influence of the reclamation on soil salt content and nutrients, and (3) to evaluate the soil quality of four land use types using SQI and identify the influence of reclamation to native saline soils.

2. Materials and Methods

2.1. Study Area

The Yellow River Delta is located in northeast Shandong Province, China, which has a warm temperate continental monsoon climate with cold winters and hot summers, an average annual temperature of 12.8 °C, interannual variable precipitation (average annual precipitation of 555.9 mm), and elevated evaporation (average annual potential evaporation of 2049 mm) [28]. The native water table depth of this region is shallow. The mineralization of the region is above 5 g/L and the soil texture is mainly slit and fine clay. The soil type is influenced by the sediment of the Yellow River and mostly is formed as coastal tidal soil. Most of the natural vegetation comprises salt-tolerant species, mainly Phragmites communis, Suaeda heteroptera Kitog, Imperata cylindrica, etc. and the artificial vegetation comprises mainly Black Locust, Fraxinus chinensis, Populus L., etc. The saline land has been reclaimed for more than 50 years in the Yellow River Delta, which is now suitable for wheat, corn, cotton, sorghum, rice, and other crops after tillage improvement [13]. In addition to being rainfed, the irrigation relies on water from the Yellow River with an annual average annual irrigation amount of about 2250 m3/hm2 [29]. The fertilization contains nitrogen, phosphorus, and potassium compound fertilizers as well as organic fertilizers.

2.2. Soil Collection

Based on the current land use of the Yellow River Delta and field surveys, soil samples were collected in May 2020 throughout Dongying City, Shandong Province, China. A total of 210 soil samples were collected at 7 depth layers of 0–5 cm, 5–10 cm, 10–20 cm, 20–40 cm, 40–60 cm, 60–80 cm, and 80–100 cm in 30 sampling sites of different land use types in the Yellow River Delta (Figure 1). Based on the main crop types and planting areas in spring, we selected winter wheat (a major food crop), cotton, and peanuts (major cash crops) as model crops with widely distributed native saline soils as reference background values. In total, 9 saline soils, 11 wheat, 6 cotton, and 4 peanut sample plots were selected from randomly distributed standard farmlands throughout Dongying City.
Soil water content (SWC), pH, electrical conductivity (EC), sand content, slit content, clay content, ammonium nitrogen (NH4+-N), nitrate nitrogen (NO3-N), available nitrogen (AN), available phosphorous (AP), and available potassium (AK) were analyzed and determined. SWC was determined using the drying method in an oven at 105 °C for 24 h to constant weight; pH and EC were determined by portable water quality analyzer (HACH, USA) according to the soil to water ratio (1:5) leaching; sand, slit, and clay content was determined using the pipetting method; NH4+-N and NO3-N were determined using potassium chloride immersion–UV spectrophotometry; AN was determined by the alkaline diffusion absorption method; AP was determined using the sodium bicarbonate immersion–molybdenum antimony anti-colorimetric method; and AK was determined by ammonium acetate immersion–flame photometry [30].
Soil salt content (SSC) was converted from the empirical relationship in Equation (1) between SSC (g/kg) and EC (dS/m) established by a related study in the Yellow River Delta [19]:
SSC = 2.18 × EC + 0.727, R2 = 0.9387
Sodium adsorption ration (SAR) was based on the determination of Na+, Ca2+, and Mg2+ and calculated according to Equation (2) [31]:
SAR (m/mol)0.5 = Na+/[(Ca2+ + Mg2+)/2]0.5

2.3. Data Analysis

ArcGIS 10.2 was used to map the distribution of the study area and sampling locations, and Excel 2019 software was used to organize the data. Pearson correlation analysis was performed using SPSS 23.0 to explore the correlation between physical and chemical properties of soils and to discern the significance of differences between different land use types. Origin 2021 software was used for graphical plotting, and the vertical distribution characteristics of soil samples were categorized and analyzed by principal component analysis. One-way ANOVA was used to analyze the variability for significance, and the least significant difference (LSD) multiple comparison method was used to analyze the variability between different soil types with 95% reliability.

2.4. Soil Quality Assessment

Soil quality was evaluated using the soil quality index (SQI), which was not simply additive but weighted additive when compared to other methods. In detail, SQI was constructed through downscaling and quantifying the different kinds of soil indicators putting each indicator in the same reference system for weighted calculation by principal component analysis (PCA) with ascending and descending functions, and calculating the quantitative results by weighted average [32,33]. SQI combines a variety of soil information to provide an intuitive and accurate assessment of soil quality.
(1)
Calculation of affiliation value
The affiliation value was determined by the affiliation function to which the evaluation index belonged. The affiliation function includes an ascending affiliation function and a descending affiliation function, which mainly depends on the positive and negative effects of soil physicochemical indicators of soil quality. The ascending type, which is applicable to soil chemical and biological properties, is used in the evaluation of soil nutrient indicators with more being better. The descending type, which is applicable to soil physical property, is used in the evaluation of soil salt indexes with less being better.
The ascending membership function formula is:
F ( x ) = {               1.0                                   ( x b ) 0.9 ( x a ) b a + 0.1           ( a < x < b )               0.1                                   ( x a )
The descending membership function formula is:
F ( x ) = {               1.0                                   ( x a ) 0.9 ( b x ) b a + 0.1           ( a < x < b )               0.1                                   ( x b )
where F(x) is the affiliation degree of soil indicators, x is the measured average value of a soil indicator, and a and b are the lower and upper thresholds of the actual measured indicators, respectively.
(2)
Calculation of index weights
The common factor variance of each soil evaluation index was obtained using principal component analysis (PCA), and the weight of each index was the percentage of the common factor variance of each index to the total common factor variance.
(3)
Calculating the soil quality evaluation score
Among the three methods used to estimate SQI, (i) simple additive SQI (SQI-1), (ii) weighted additive SQI (SQI-2), and (iii) statistically modeled SQI (SQI-3) based on PCA, the weighted additive SQI was used for soil quality evaluation:
SQI = ∑ni = ∑ WiNi
where Wi represents the weight value of the i th indicator, Ni represents the affiliation degree of the i th indicator, and n represents the number of evaluation indicators.

3. Results

3.1. General Soil Physical and Chemical Properties of Different Land Use Types

As shown in Table 1, the SWC of saline soil in the Yellow River Delta was 26.88%, which was significantly higher (p < 0.05) than that of the three croplands of peanut (19.28%), cotton (24.32%), and wheat (22.14%). The average pH of the three croplands was 8.49 (P > 0.05), slightly higher than that of the saline soil (8.44). The SSC of the saline soil reached 4.52 ± 0.91 g/kg, suggesting the soil was heavily salinized, while SSC of peanut, cotton, and wheat ranged from 1.44 to 1.91 g/kg, indicating that the soil was slightly salinized with a two to three times reduction in salinity degree [34,35]. The SAR of saline soil was significantly higher than that of the three croplands by more than four times (p < 0.05). Compared with saline soil, the sand content of peanut, cotton, and wheat significantly increased by 28.20%, 15.86%, and 8.25%, respectively, while the slit content decreased by 19.04%, 13.84%, and 7.52% and clay content decreased by 9.16%, 2.02%, and 0.74%, respectively. The NH4+-N of the three croplands was lower than that of saline soil with peanut (1.53 mg/kg) < cotton (1.85 mg/kg) < wheat (2.05 mg/kg), but NO3-N was significantly higher than that of saline soil (p < 0.05) (1.90, 2.02, and 4.29 times higher than that of saline soil, respectively). The AN of wheat was 41.89 mg/kg, which was slightly higher than the other three types. The AP of peanut, cotton, and wheat was higher than that of saline soil by 5.43, 3.57, and 8.77 mg/kg, respectively, but the AK content was significantly lower than that of saline soil (p < 0.05) with peanut (99.82 mg/kg) < cotton (134.25 mg/kg) < wheat (158.63 mg/kg).
Except for NO3-N, the analysis results of soil nutrient in this study were within the range of the historical statistical results of the Yellow River Delta. Compared with the statistical results of other typical deltas in China, the NH4+-N and AK contents of the Yellow River Delta were lower than those of the Yangtze River Delta and the Pearl River Delta, and higher than those of the Liao River Delta; the NO3-N content was higher than those of other deltas; the AN and AP contents were lower than those of other deltas (Table 2). In general, both historical and measured data of soil nutrients in the Yellow River Delta showed moderate levels in China.
According to the soil nutrient grading standards of the second soil census of China [35] (Table 3), soil nutrient of four land use types in the Yellow River Delta showed a significantly different grade. The AN of all four soils was at level V. Soil AP of the three croplands were at level III, while saline soil was at level V. Soil AK of peanut, cotton, wheat, and saline soil were at Level IV, III, II, and I, respectively. In general, the soil AN and AP contents in the Yellow River Delta were low, and AK was relatively abundant.

3.2. Vertical Distribution of Soil Physical and Chemical Properties in Different Land Use Types

The SWC, pH, and SAR of the four land use types increased steadily with depth downward with slight significance; in particular, the SWC and SAR of the saline soil were higher than that of the three croplands at each depth layer, while the pH showed the opposite. The vertical distribution of the other six soil properties is shown in Figure 2. The SSC of saline soil gradually decreased with depth downward, with the highest content of 6.19 g/kg in the surface layer. The coefficient of variation in the vertical profile was 0.20, indicating medium variation. The vertical variation of the SSC of the three croplands followed the same trend, with a small fluctuation range and low variability in the vertical profile. The SSC at all depth levels was significantly lower (i.e., 1/4–1/2 of that of saline soil, especially for peanut and cotton at 0–30cm depth) compared to that in saline soil (p < 0.05). The NH4+-N content of the four types gradually reduced at the 0–30 cm depth and then displayed an increasing trend up to 100 cm, with a variation coefficient along the vertical profile of less than 0.20. The NH4+-N content of the surface layer of the three croplands tended to be consistent and was significantly lower than that of saline soil (p < 0.05), while at the 100 cm depth, the NH4+-N content showed the following trend: peanut < cotton < wheat < saline soil. The NO3-N content of three croplands increased and then decreased with depth, and the surface layer showed a significant accumulation in the depth range of 20 cm, while the NO3-N content of saline soil gradually decreased from 0 to 30 cm in depth and stabilized below 30 cm. The NO3-N content of peanut and cotton had similar trends, all around 200 mg/kg, which was significantly lower than that of wheat (p < 0.05). The vertical profile of soil AN of all four types tended to decrease gradually with increasing depth, and the content of AN in wheat was higher than the other three types from 0 to the 30 cm depth with the content below the 30 cm depth around 20 mg/kg. The soil AP content of the three croplands was significantly lower than that of saline soil at all depths (p < 0.05), with peanut < cotton < wheat, and gradually decreased with the depth. The AK content of the surface layer was significantly higher than that of the deep layer.
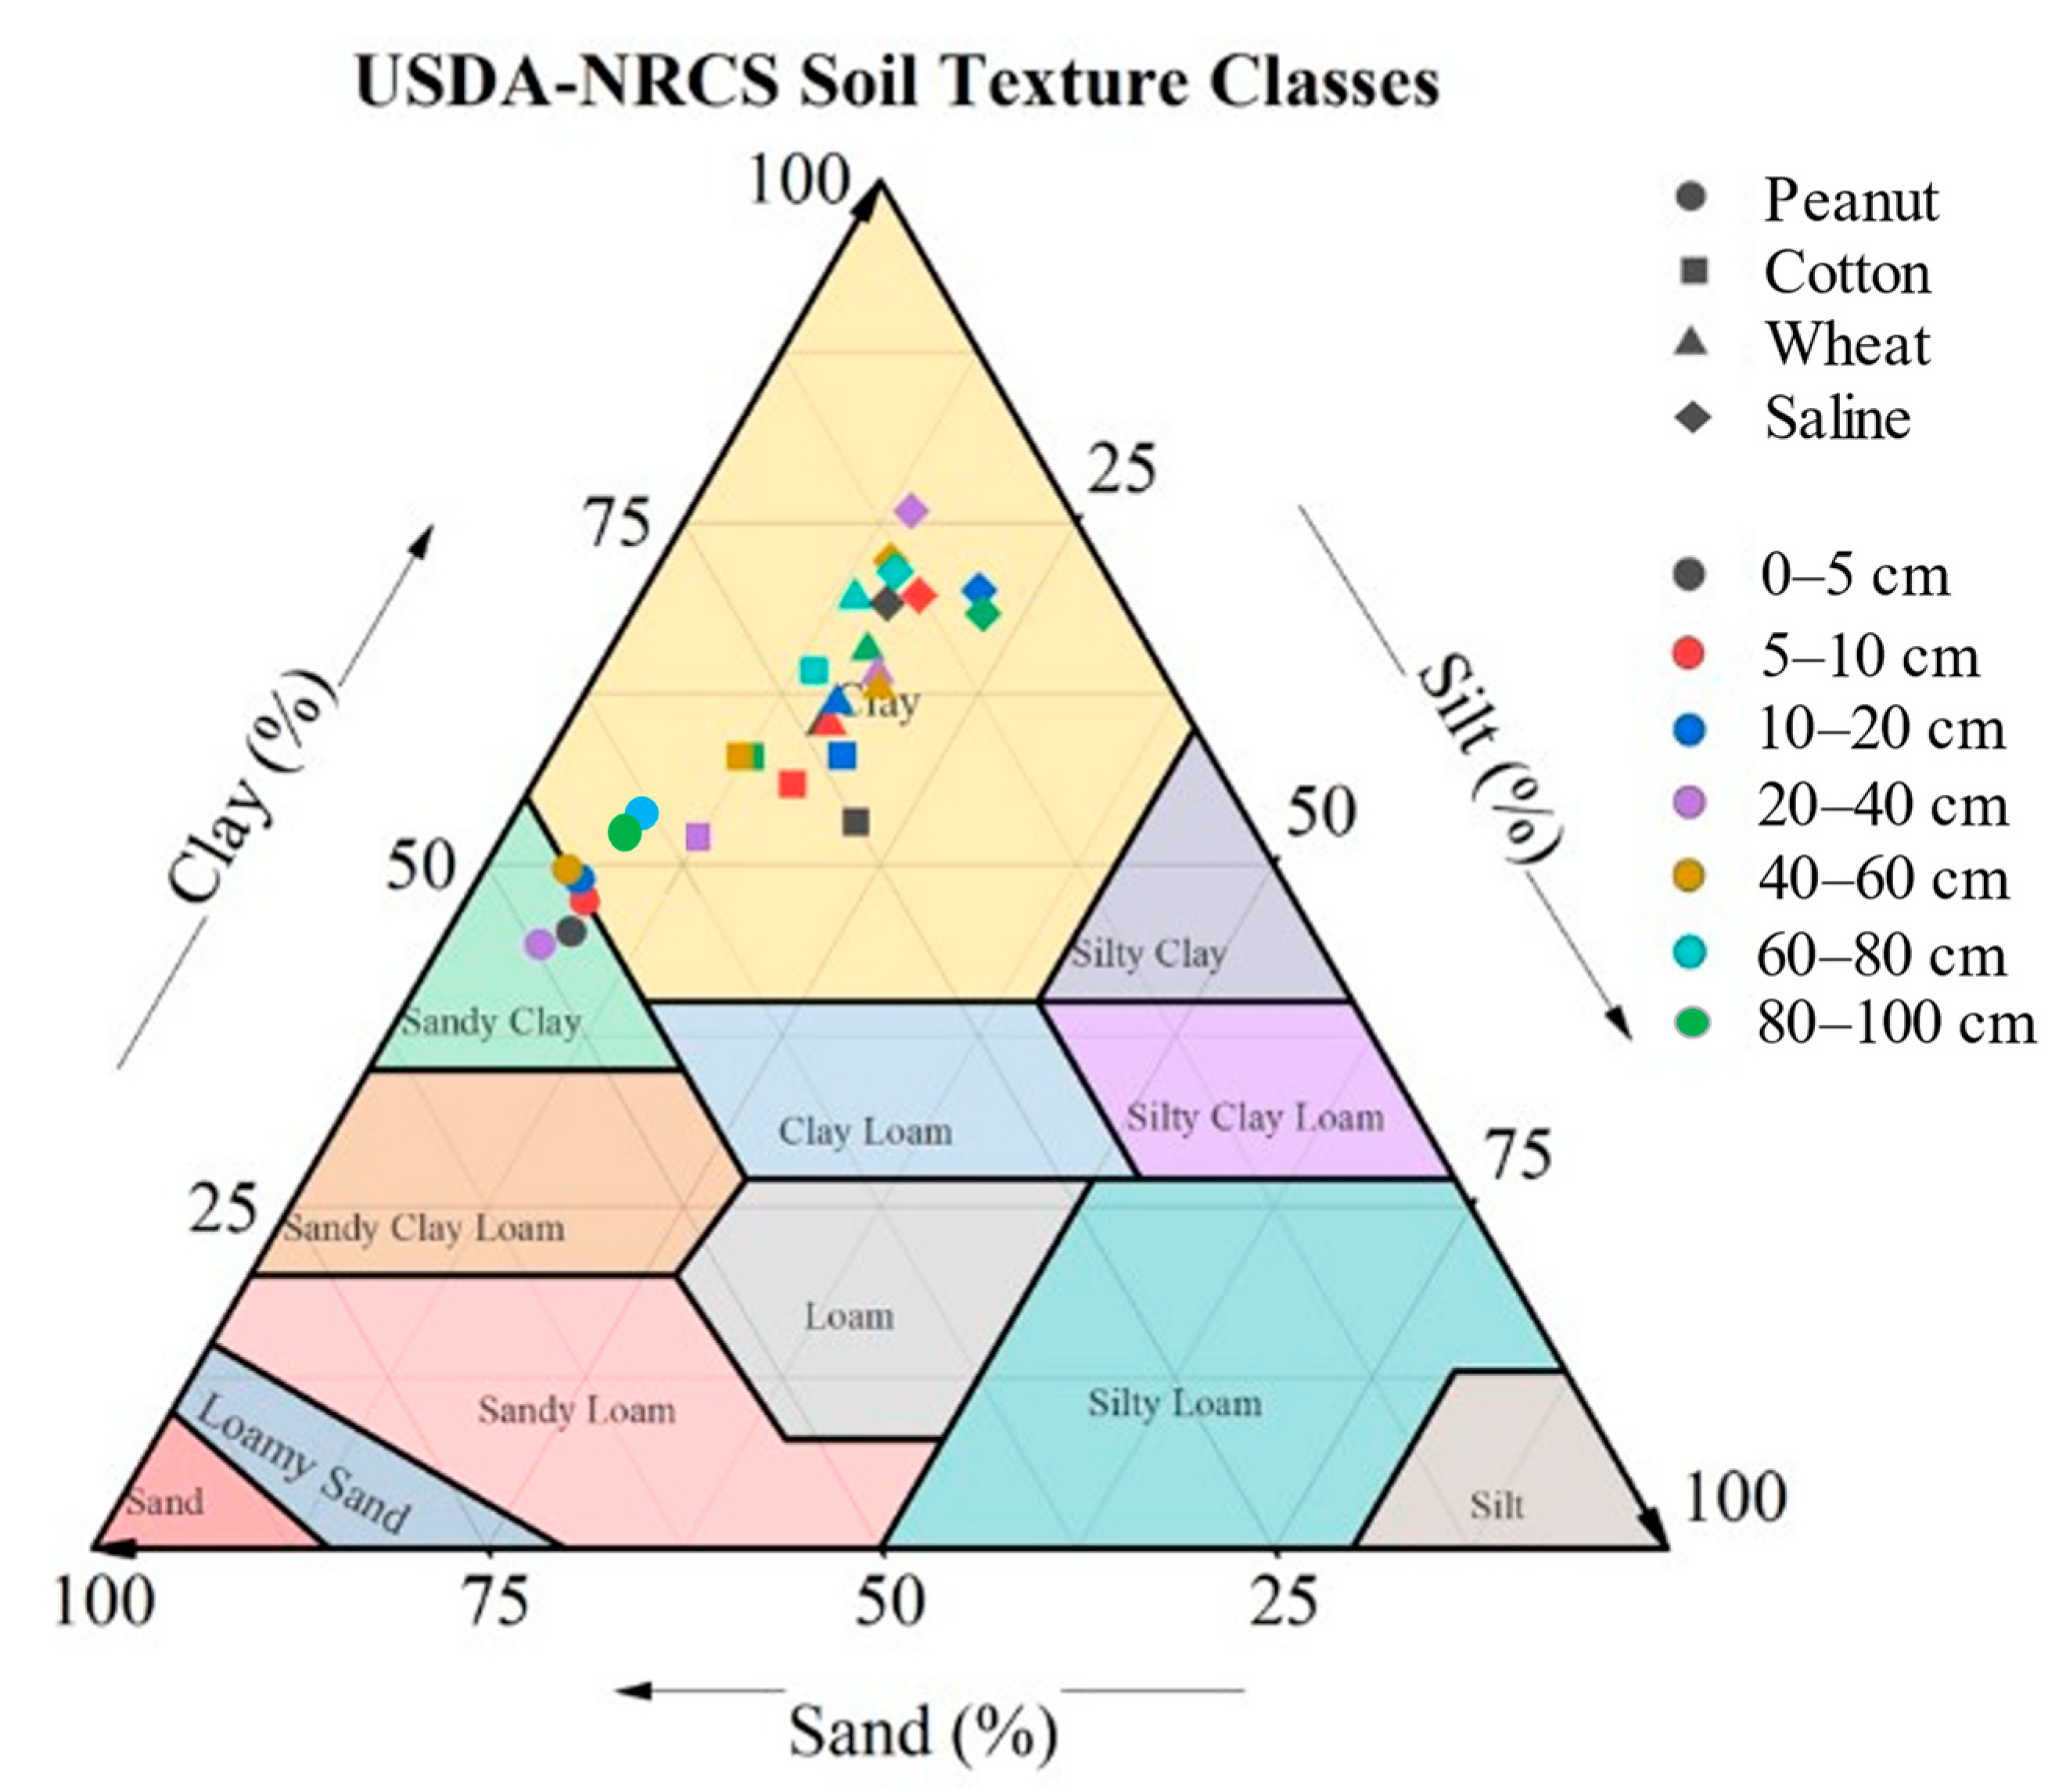
The vertical distribution of the soil texture of different land use is shown in Figure 3. Soils of peanut above the depth of 60 cm are sandy clay, while soil below 60 cm is clay. Soils of cotton, wheat, and saline soil at each layer are clay. The slit and clay content of the four land use types slightly increased with lowering depth; while the sand content gradually decreased, the sand content of cotton in particular was significantly higher than other land use types at each depth layer (p < 0.05).

3.3. Soil Quality Index for Different Land Use Types

Soil physical and chemical property indicators of the four land use types at seven depth layers were analyzed to principal component analysis (PCA), and the result is shown in Table 4. The first principal component (PC1) contributed 47.76% to the total variance, with the sand content, SAR, SSC, and NH4+-N contributing the most, and soil physical properties being the main influencing factors; the second principal component (PC2) contributed 30.24% to the total variance, with AN, SWC, AP, and pH contributing the most, and soil chemical properties being the main influencing factors; and the third principal component (PC3) contributed 9.05% to the total variance, with NO3-N, clay content and SSC contributing the most. In general, the cumulative contribution of the three principal components reached 87.04%, indicating that the first three principal components can represent 87.04% information of all soil physical and chemical indicators. Therefore, the rest components were insignificant and ignored. The eigenvalues of the first three principal components are greater than 1, showing excellent representation.
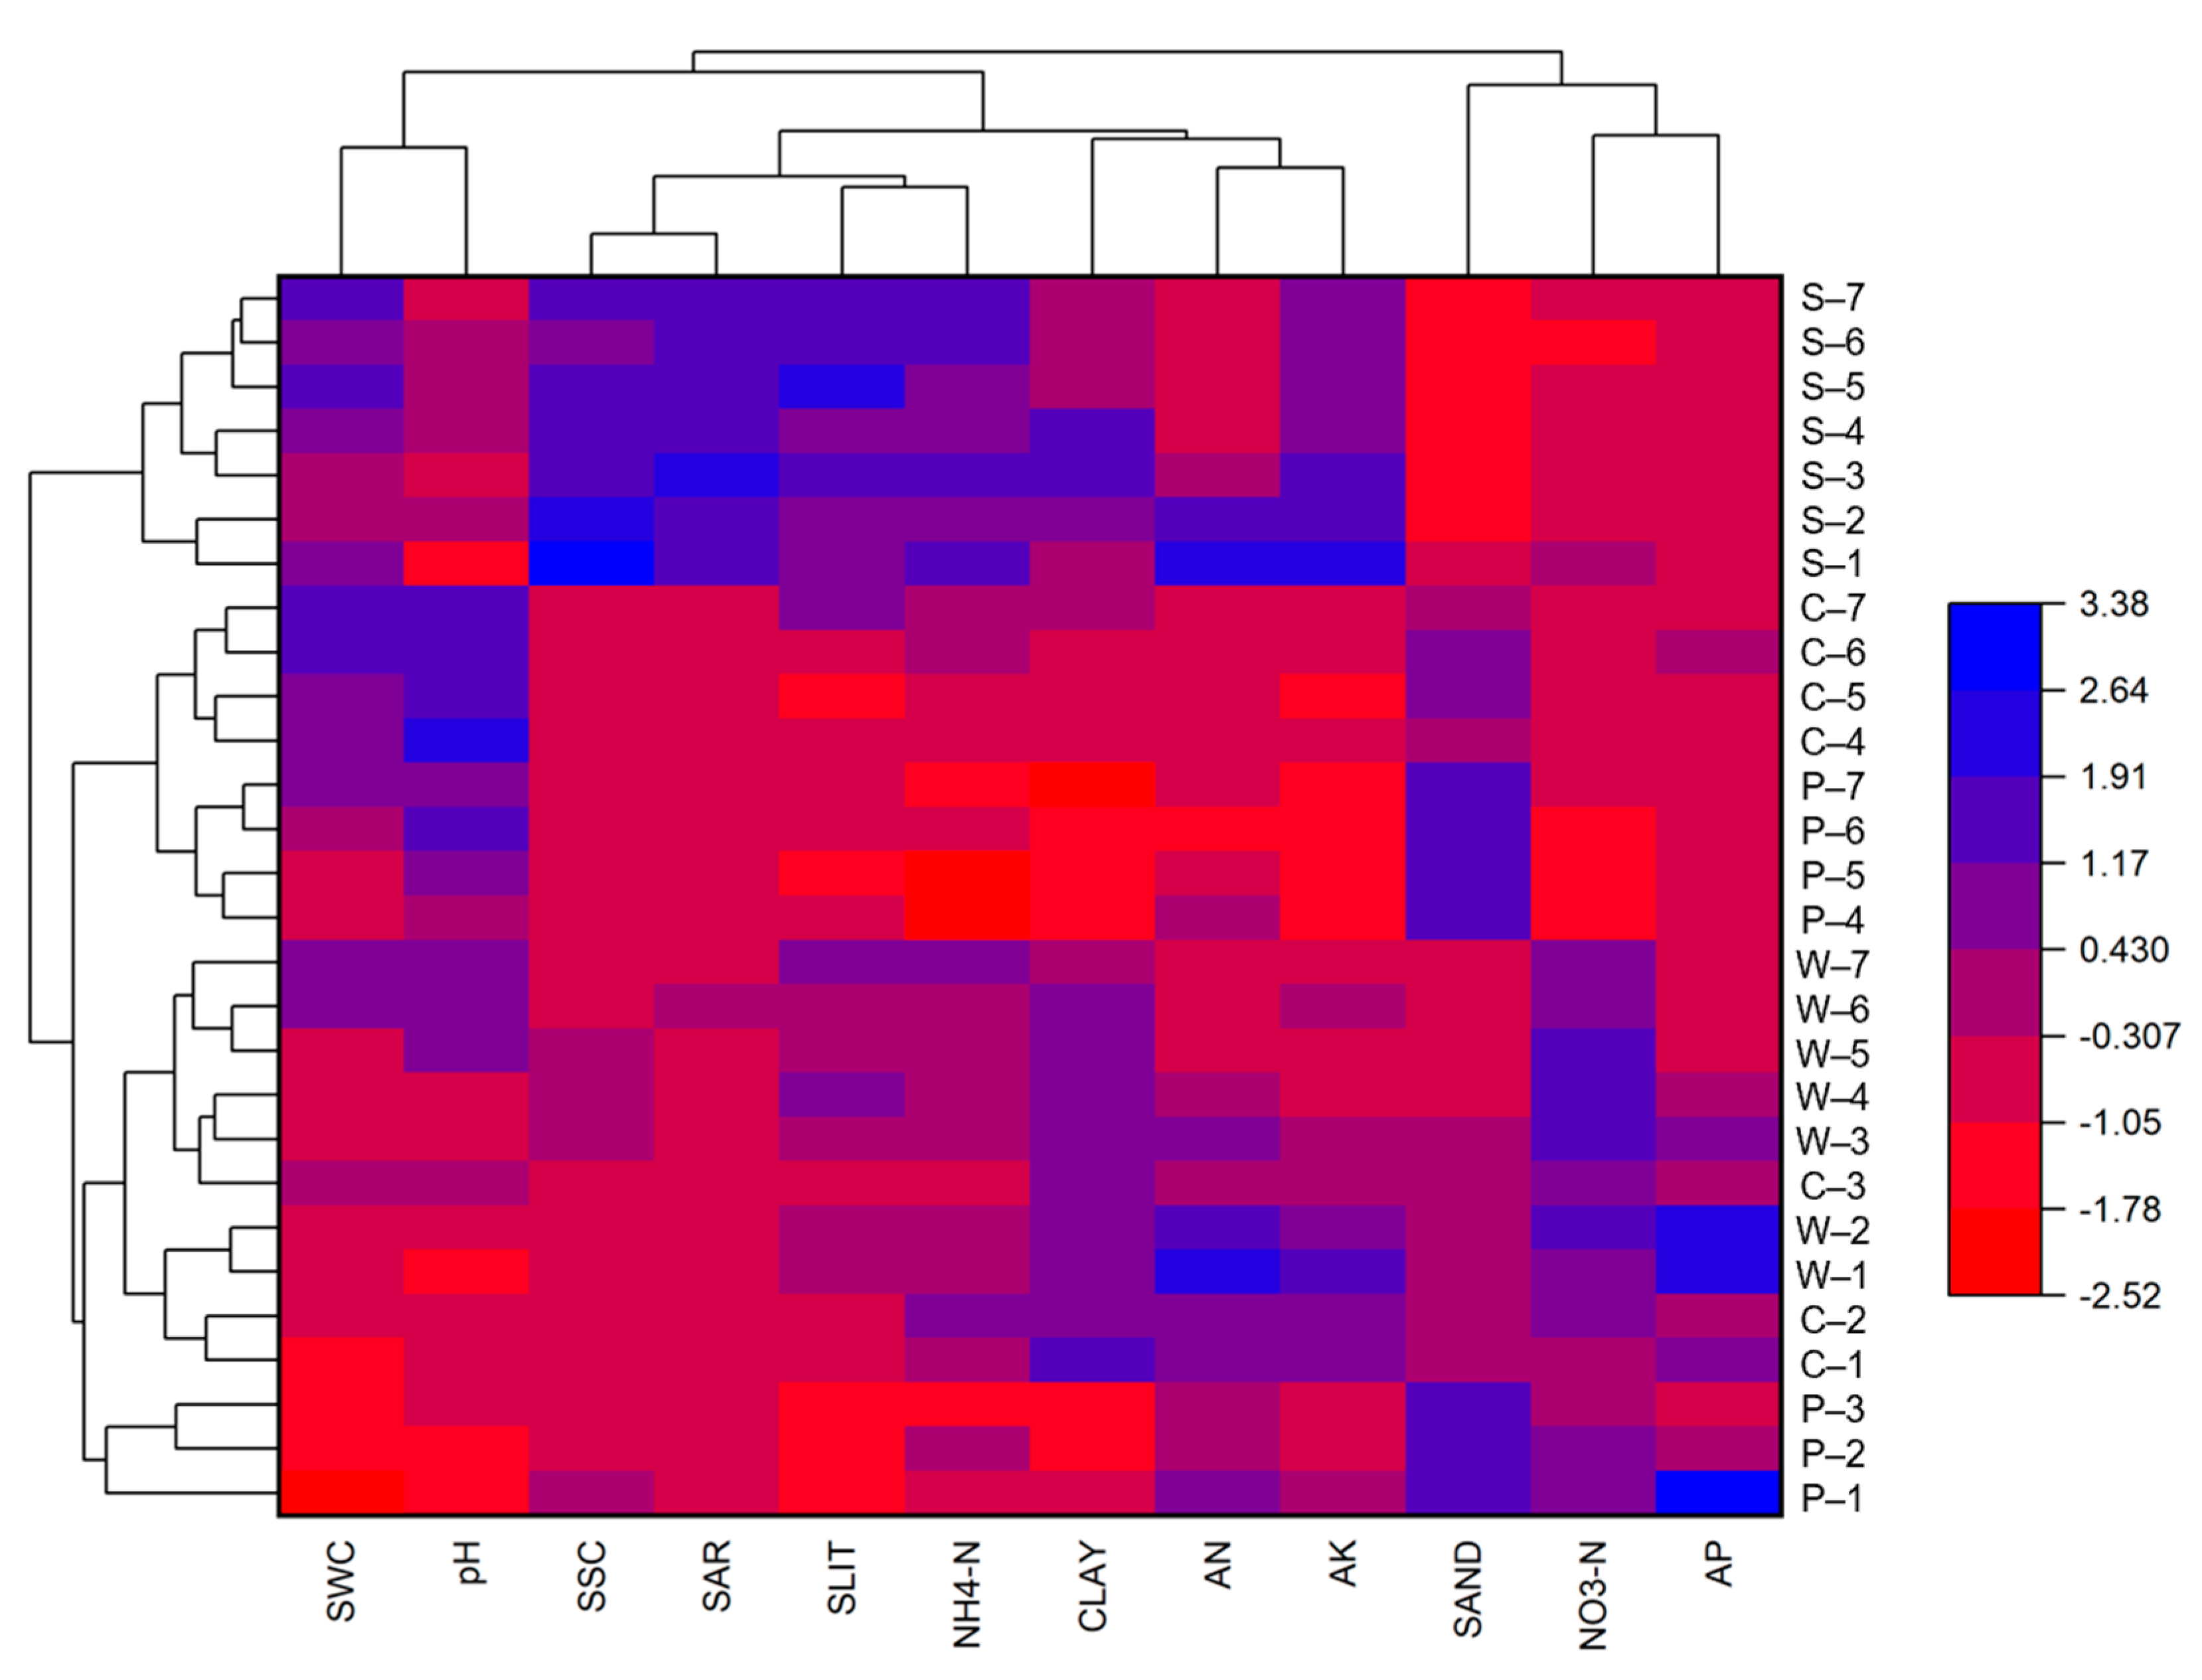
The heat map visually reflects the sparsity and frequency of the data with progressive blue–red band changes as well as the variation of soil physical and chemical indicators [42]. The soil property indicators of the four land use types at seven different depth layers were clustered for heat map analysis, as shown in Figure 4. The clustering results were divided into four categories: category I was saline soil of seven depth layers with an overall high content of SWC, SSC, SAR, NH4+-N, and AK; category II was the soil of peanut and cotton below the depth of 20 cm, which had high SWC, pH, and sand content; category III was the soil of peanut above the depth of 20 cm depth with high sand content, AN, and AP; and category IV was the soil of cotton above 20 cm depth and the soil of wheat of seven depth layers, which had high clay content and NO3-N. There was a clear difference between the indicators of saline soil and the three croplands and the depth of 20cm was an important turning point in the vertical distribution.
According to the affiliation and weights calculated from PCA, the soil quality index (SQI) of different land use types was calculated in a way of soil quality evaluation systems and classified into different soil quality levels [32] with the following results: cotton (0.56) and wheat (0.55) had a SQI of Level IV and high soil quality and peanut (0.48) and saline soil (0.46) had a SQI of Level III and medium soil quality (Table 5). In general, the soil quality of the Yellow River Delta was in the medium to high level, and the soil quality of the three croplands was significantly higher than that of saline soil, the cotton and wheat cropland soils in particular.

4. Discussion

4.1. Reclamation Weakens Salinity

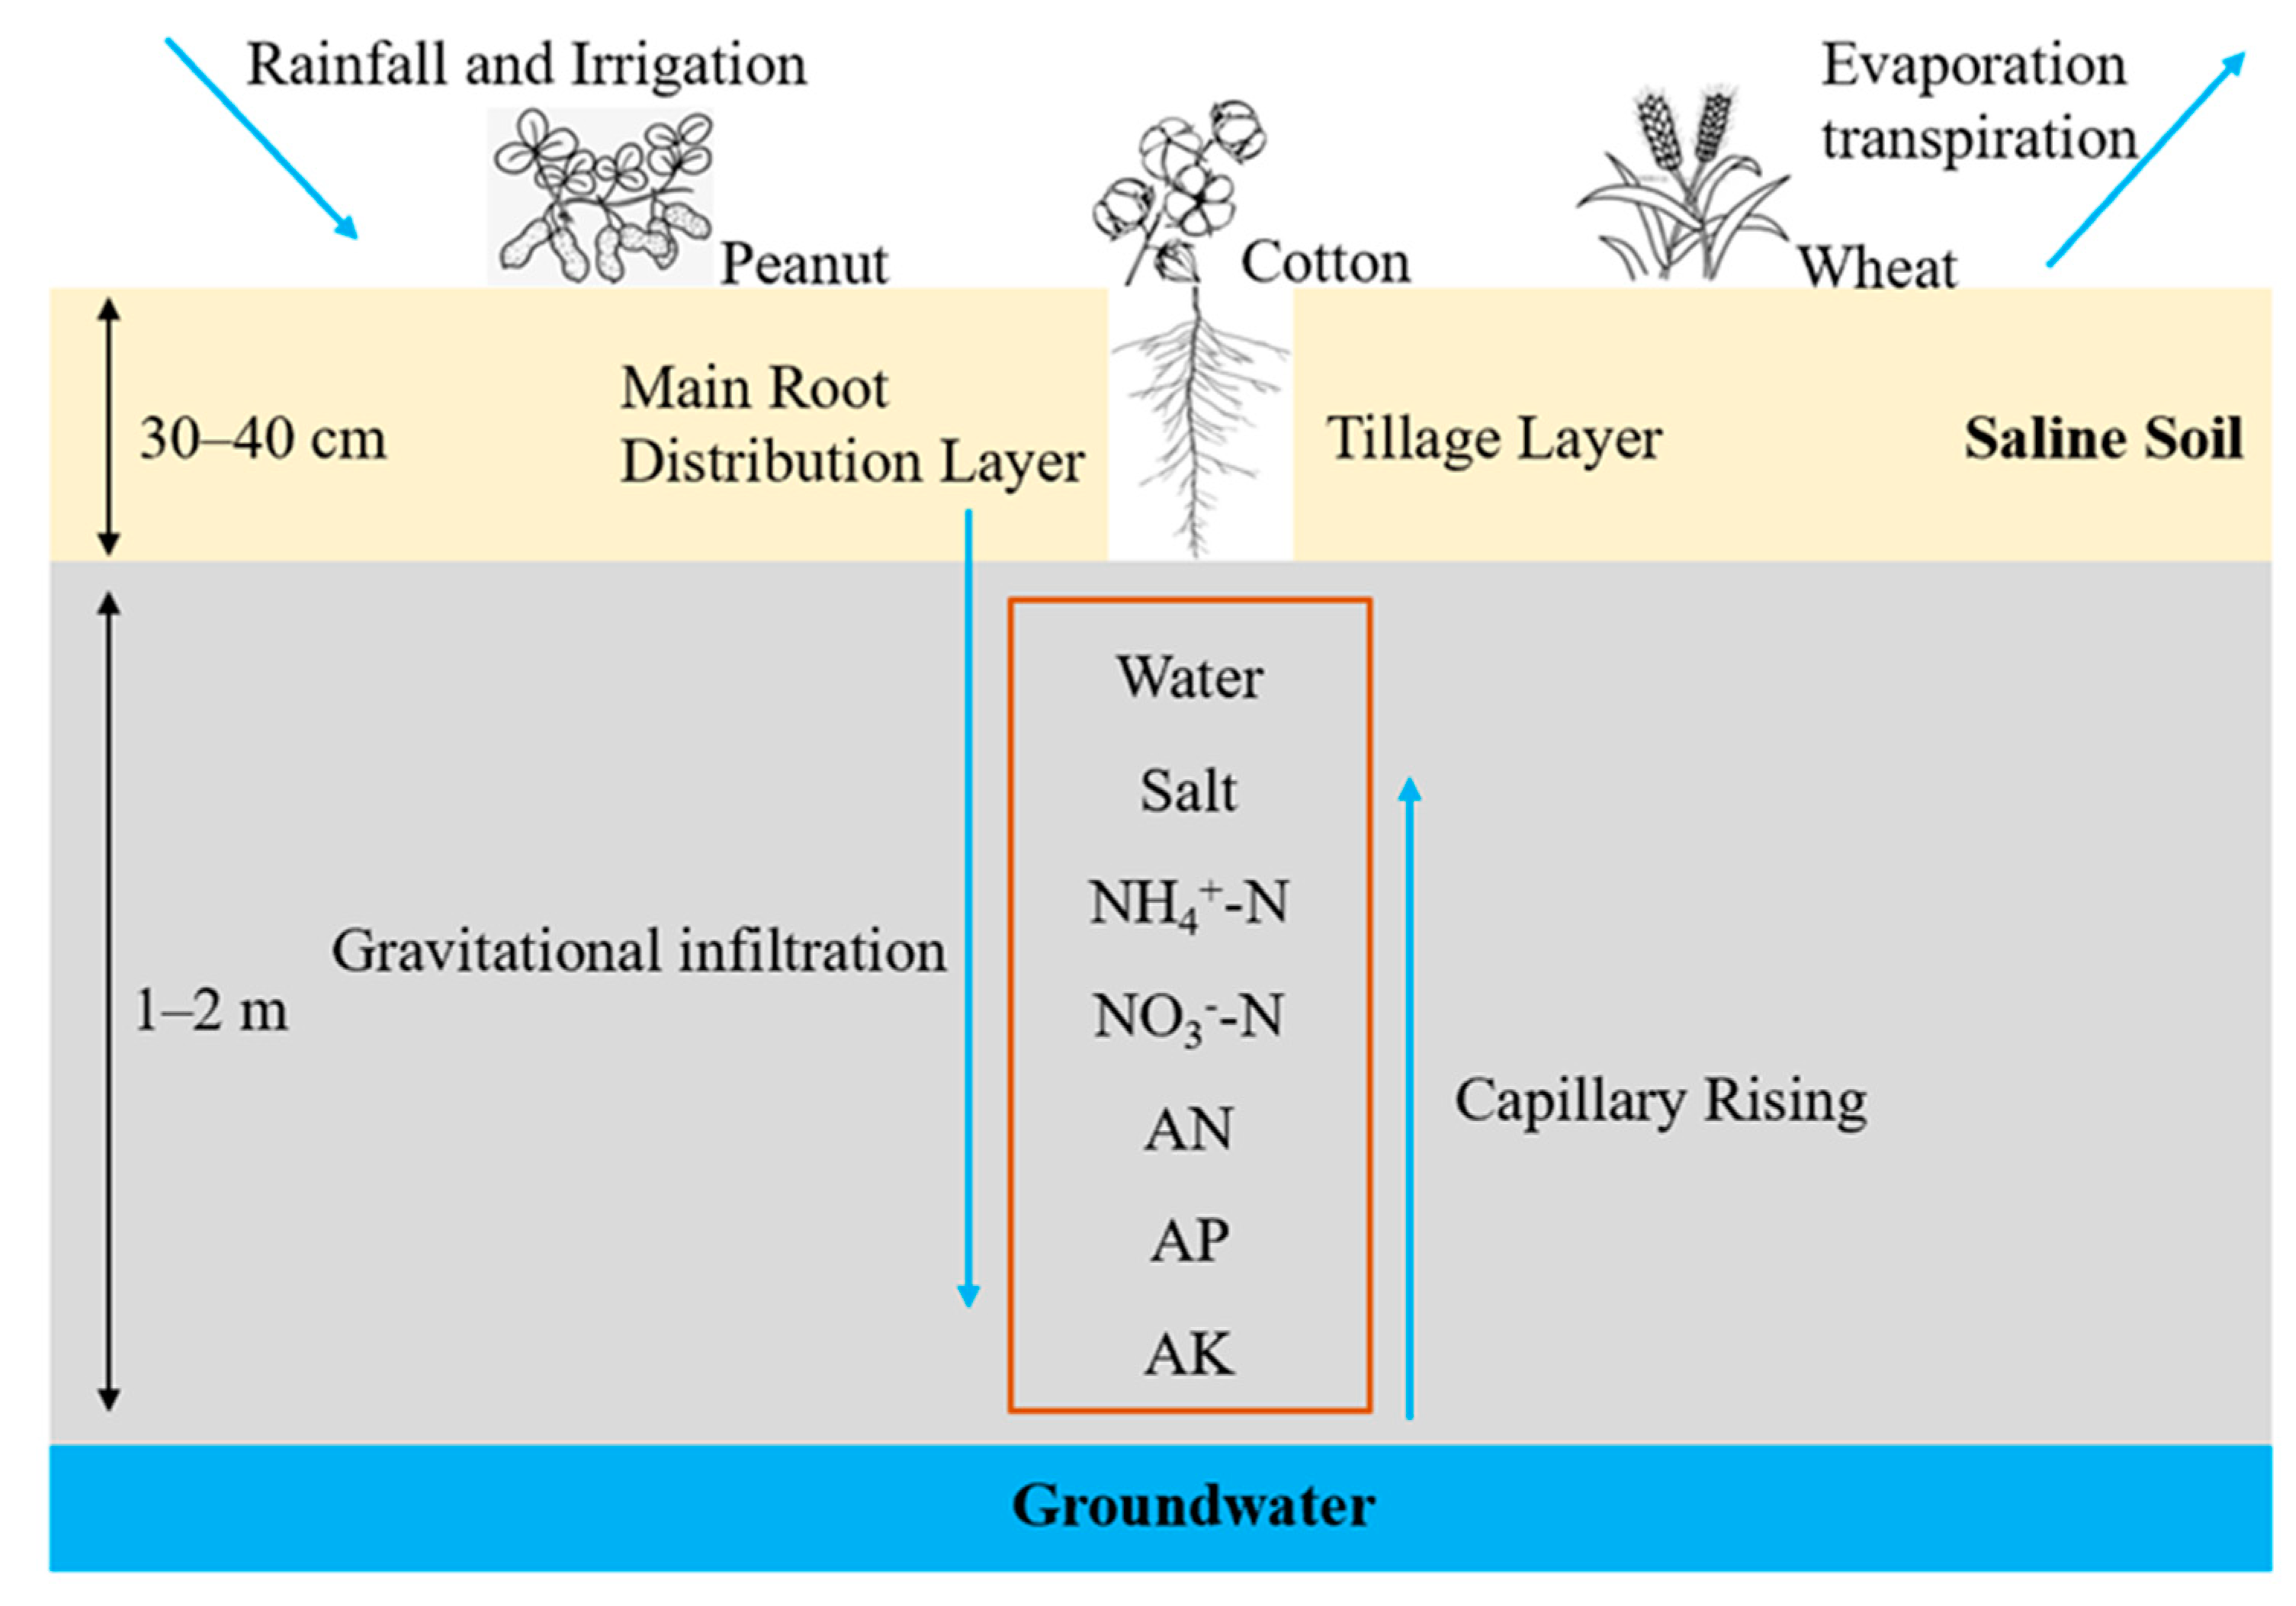
Due to its special sea location and climatic conditions, soil salinity is ubiquitous in the Yellow River Delta, with saline soils expanding every year [43]. Native saline soils have been cultivated through long-term reclamation and soil salinity has been weakened by crop growth as a result of agricultural practices such as fertilization and tillage (Figure 5) [13]. In this study, we found that the water and salt content of the croplands in the Yellow River Delta were significantly reduced due to a series of field tillage and management practices, which had a strong inhibitory and ameliorative effect on soil salinity [3]. The SSC of saline soil was 4.52 ± 0.91g/kg, with 6.19g/kg in the surface soil (Table 1). After long-term reclamation of peanut, cotton, wheat, and other crop growth, the SSC was significantly reduced by 2–3 times, and the soil salinity degree decreased from severely to slightly. The SSC at all depth was significantly lower than that of saline soil with the salt reduction ratio reaching more than 40% above the depth of 30 cm (Figure 2).
The SSC in the surface layer of saline soil showed obvious surface accumulation, as found in most studies [44,45]. The seawater infiltration accumulated a large amount of salts and soluble ions in the lower soil layer. Salts and soluble ions reached higher layers with the capillary effect, leading to increased SSC and SAR (Figure 2). Root uptake and soil structures also affected water and salt transport in the soil [46]. In this study, native saline soil was reclaimed to croplands by growing saline-tolerant vegetation, which led to increased croplands, decreased soil erosion, and reduced salt leaching and soil accumulation. Overall, the reclamation processes weakened the salt accumulation and significantly reduced the surface SSC and SAR [16]. The water movement carried salts downward with the root system and gravitational infiltration. Thus, the distribution range of crop roots directly also affected the vertical distribution of soil water salts. The depth of 20 cm was found to be the turning point in this study, which was determined as the root and tillage layer. Above the root distribution range, SWC and pH were significantly reduced by crop growth and field practices. The deeper layer soils were less disturbed, and water and salt accumulated downward continuously, resulting in a gradual increase with lowering depth. Such results have also been found in previous studies [31,43].
SSC was significantly positively correlated with slit and clay content and negatively correlated with sand content (Figure 6). Although the native saline soil was rarely disturbed by human activities, it was affected by seawater intrusion and high silt and clay contents led to low porosity and poor permeability [47]. The surface soil of the three croplands was disturbed by crop growth and tillage, leading to increased sand contents for peanut, cotton, and wheat (increased by 28.20%, 15.86%, and 8.25%) and decreased slit contents (decreased by 19.04%, 13.84%, and 7.52%) and clay contents (decreased by 9.16%, 2.02%, and 0.74%) (Table 1). In particular, the soil pore space significantly increased in the sandy soil of peanut, which had poor water retention capabilities and more evaporation rates, blocking the original capillary water transport paths and inhibiting the migration of salts to deeper soils.

4.2. Reclamation Enhances Soil Nutrient

Nitrogen, phosphorus, and potassium are the three essential nutrients for plant growth and important indicators of soil fertility. These nutrients are easily leached, absorbed and utilized by plant growth, and transformed in the soil (Figure 5) [48]. After the native saline soil was reclaimed to peanut, cotton, and wheat croplands, the soil’s available nutrients showed different characteristics due to long-term accumulation. The decomposition rate of the available nutrients was low, and the nutrients gradually accumulated, leading to an increase in NO3-N, AN, and AP contents, a relative decrease in NH4+-N and AK contents, and an increase in soil nutrient contents.
The soil ammonium nitrogen (NH4+-N) content of the croplands was significantly lower than that of saline soil with peanut < cotton < wheat, showing a trend of decreasing and then increasing with downward depth (Figure 2). The soil’s NH4+-N content was significantly and positively correlated with water content (Figure 6). NH4+-N is easily adsorbed to the soil, and the higher the content of clay and slit particles is, the stronger the adsorption power is [49]. Previous studies have shown that under the conditions of alkaline soil, high water, clay, and slit content, NH4+ in soil solution is easily converted to NH3 by combining with OH, resulting in ammonia volatilization. Because of the overall high water content at all depth levels in the saline soil of the Yellow River Delta, the small porosity and poor permeability of soil, and the free state of NH4+ could only be maintained under alkaline conditions [50,51]. The long-term cultivation of crops on arable lands improved soil structure and promoted nitrogen utilization. The overall NH4+ content of peanut croplands was lower than that of saline soil, and the sandy soil was looser in the top 10 cm of the three croplands; thus, the ammonium volatilization was greater for peanut croplands. It was concluded that if the middle depth was reduced to variable levels by the root distribution of different crops, NH4+ would gradually increase with downward depth due to long-term accumulation and less external disturbance.
Soil nitrate nitrogen (NO3-N) content was significantly higher in the three croplands than that of the saline soil (Table 1) and soil NO3-N content was overall higher above the 30 cm depth than that in the deep soil (Figure 2), which is consistent with most studies [52,53]. Soil NO3-N was highly leachable and susceptible to various factors such as nitrogen application, irrigation, precipitation, and temperature. The soil NO3-N content was positively correlated with soil nitrogen content (Figure 6). SWC and salt contents were high in saline soil, which inhibited nitrification of soil nitrogen. At the same time, NO3-N was easily leached and migrated with water to the deeper layers, which promoted anaerobic respiration. Thus, high salt contents enhanced soil denitrification [54], leading to the reduction of NO3-N content. Long period reclamation, such as nitrogen fertilizer application reduced salt content and salt tolerance of crops, resulted in high soil NO3-N content in all three croplands, especially in wheat [13]. When soil NO3-N was applied greater than the crop’s needs, NO3-N was transported deeper into the soil with water and accumulated in the surface soil [55]. Therefore, the NO3-N content in the surface soil gradually increased, showing an obvious phenomenon of surface accumulation. With the increase of soil depth, the surface soil nitrogen was absorbed by the surface root system in large quantities, which made the NO3-N content of the deep soil gradually decrease. Moreover, the three croplands had different growth cycles and slightly different in root distribution ranges, with the root system of wheat reaching 40 cm and peanut cotton only 20 cm. Therefore, the depth at which the turnaround occurred was different, and the soil NO3-N content of wheat was higher at all depths.
Available nitrogen (AN), including inorganic nitrogen and organic nitrogen with simple structures that can be directly absorbed and used by crops, was positively correlated with soil nutrient content due to fertilization (Figure 6). The AN content was not stable and was susceptible to change with soil water and heat conditions and biological activities, which reflects the current nitrogen supply capacity [56,57]. The difference in AN content between the four types was not significant, and the content of peanut and cotton was slightly lower than that of wheat and saline soil (Table 1). The uptake and utilization efficiency of AN in the soil differed among different land use types, and anthropogenic nitrogen applications kept supplying soil AN content. Nitrogen was also returned to the soil after crop residual decomposition, which affected soil nitrogen content [58]. As a legume, peanut had a significant nitrogen-fixing effect. Cotton absorbed more nitrogen during the early stage of growth cycles [59], while wheat basically no longer absorbed nitrogen from the soil at the growth cycles towards the end. Therefore, late stage fertilization contributed to the soil AN content.
The soil phosphorus content was more variable than the nitrogen content. The soil’s available phosphorous (AP) was the highest in wheat, followed by peanut and cotton with the lowest in saline soil (Table 1). AP content in the surface soil was significantly higher than that in deeper layers (Figure 2). Based on the demand for crop yields, compound fertilizer was applied artificially. Because of the small diffusion coefficient of phosphorus and poor mobility [60], crops could only absorb phosphorus from the interroot soil. Thus, the utilization rate of phosphorus was extremely low. Consequently, the residual amount of AP differed depending on crop growth. In addition, irrigation and fertilization exacerbated soil acidification, which in turn promoted the release of AP [61]. Surface soils of the four land use types were affected by anthropogenic fertilization and crop root uptake and utilization, while deeper layers were less disturbed and showed accumulation.
The soil’s available potassium (AK) content of the three croplands was significantly lower than that of the saline soil (Table 1), which was negatively correlated with SWC due to crop uptake (Figure 6). In the Yellow River Delta, influenced by the shallow water table and seawater infiltration, the soil Na+ and K+ ion content was high, and the soil had sufficient potassium [62], which continuously accumulated within the root of 0–30 cm. However, for different crop species with different land use intensities and tillage practices, the soil AK content of the three crops was slightly reduced compared with that of the saline soil. The AK content of the three croplands followed: wheat > cotton > peanut. Wheat was a long-term cultivated crop with AK accumulated in the soil all year round. On the contrary, peanut and cotton had a relatively short cultivation period and less soil residues.

4.3. Reclamation Promotes Soil Quality

The SQI significantly increased by 0.10, 0.09, and 0.02 after reclaiming the saline soil into cultivated croplands by planting peanut, cotton and wheat in the Yellow River Delta (p < 0.05). The soil quality was significantly improved by reclamation, which was evidenced by the data shown in Table 5. The effect of different land use types on the soil physical and chemical properties of saline soil in the Yellow River Delta varied significantly and was reflected by different physical and chemical indicators of the soil. After being cultivated for a long period, the crops formed stable cultivation patterns and showed strong water, soil, and fertilizer retention function [42]. Among the studied land use types, the effect was more pronounced for wheat and cotton.
Soil nutrients in reclaimed croplands were mainly regulated through the balance of input and output processes of field management (i.e., irrigation, fertilization, straw return, etc.), rainfall, microbial action, decomposition, transformation of plant and animal residues, etc. [63]. Soil carbon and nitrogen mineralization rate in salinized saline soil was low and soil fertility was generally deficient. During reclamation, humus from the decomposition of salinity-tolerant plants and root secretions provided soil nutrients [46]. Even though almost all crops grown on farming lands were harvested with a small portion of residuals remaining in the soil or supplied as straw return, tillage accelerated the decomposition and transformation to promote soil nutrient cycling [64]. The efficiency of soil nutrient utilization and accumulation varied greatly among crops. With ongoing reclamation and farming management became stable, the soil structure started to improve and crop productivity and soil biomass started to increase, leading to rebound soil fertility.
The influence of reclamation on the nutrient content and soil quality in the Yellow River Delta was significant and the effect of wheat on reducing soil salinity and improving soil quality was more obvious with human interferences after reclamation. On the contrary, the effect of peanut and cotton at the layer of 30–40 cm depth was more obvious due to the limitation of the root distribution [65,66]. The effect of the deeper soil physical and chemical properties was worth verifying. Therefore, long-term sampling of cultivated croplands should be strengthened in the future to fully illustrate the influence of reclamation on the improvement of native saline soil in the Yellow River Delta.

5. Conclusions

Reclamation of saline soil was effectively manifested in the Yellow River Delta by crop growth and field management practices of fertilization and irrigation for a long period, which may serve as an example for other locations that experience the same situations globally. In this study, the SSC was reduced from 4.52 g/kg to 1.44 g/kg after reclamation with a significant two to three times reduction in salinity degree. The NH4+-N and AK of peanut, cotton and wheat cropland soils were found lower than those of saline soil, but the NO3-N were 1.90, 2.02, and 4.29 times higher, AP were 5.43, 3.57, and 8.77 mg/kg higher, and AN were slightly higher than those of saline soil, respectively. The NO3-N, AN, and AP of the three croplands were significantly higher (p < 0.05) than those of saline soil at the depth of 0–30 cm, and gradually decreased with downward depth, showing significant accumulation. The NH4+-N and AK at each depth were lower than those in the saline soil. Soil quality index (SQI) of cotton (0.56), wheat (0.55), and peanut (0.48) was increased by 0.10, 0.09, and 0.02 after reclamation of saline soil (0.46). It was evidenced that reclamation significantly promoted the soil quality of native saline soil in the Yellow River Delta with the enhancement effect of wheat and cotton more pronounced. This research provided technical support for subsequent field management and sustainable development of food production for regions such as the Yellow River Delta.

Author Contributions

Conceptualization, S.L., F.L., and Q.Z.; methodology, S.L. and Z.L.; software, S.L. and C.T.; formal analysis, S.L. and Y.Q.; investigation, S.L., Z.L., and K.D.; writing—original draft preparation, S.L. and F.L.; writing—review and editing, F.L., H.C., G.C., and X.L.; supervision, S.L., Q.Z., and F.L. All authors have read and agreed to the published version of the manuscript.

Funding

This research was funded by the National Natural Science Foundation of China (No. U2006212, U1906219, 42007155, U1803244).

Data Availability Statement

Not applicable.

Acknowledgments

We would like to thank colleagues at Shandong Yucheng Agro-ecosystem National Observation Research Station for experimental support and constructive advice on this manuscript.

Conflicts of Interest

The authors declare no conflict of interest.

References

  1. Gao, Y.; Shao, G.; Wu, S.; Xiaojun, W.; Lu, J.; Cui, J. Changes in soil salinity under treated wastewater irrigation: A meta-analysis. Agric. Water Manag. 2021, 255, 106986. [Google Scholar] [CrossRef]
  2. Abdulameer, A.; Thabit, J.M.; Kanoua, W.; Wiche, O.; Merkel, B. Possible Sources of Salinity in the Upper Dibdibba Aquifer, Basrah, Iraq. Water 2021, 13, 578. [Google Scholar] [CrossRef]
  3. Ansari, M.; Jabbari, I.; Sargordi, F. The effect of water resources on spatial and temporal change of soil salinity in Izdkhast playa, Fars Province, Iran. Environ. Monit. Assess. 2023, 195, 63. [Google Scholar] [CrossRef]
  4. Hiatt, M.; Snedden, G.; Day, J.W.; Rohli, R.V.; Nyman, J.A.; Lane, R.; Sharp, L.A. Drivers and impacts of water level fluctuations in the Mississippi River delta: Implications for delta restoration. Estuar. Coast. Shelf Sci. 2019, 224, 117–137. [Google Scholar] [CrossRef]
  5. Wilson, C.G.; Papanicolaou, A.N.; Abban, B.K.B.; Freudenberg, V.B.; Ghaneeizad, S.M.; Giannopoulos, C.P.; Hilafu, H.T. Comparing spatial and temporal variability of the system Water Use Efficiency in a Lower Mississippi River watershed. J. Hydrol. Reg. Stud. 2022, 42, 101141. [Google Scholar] [CrossRef]
  6. Badawy, W.M.; Duliu, O.G.; El Samman, H.; El-Taher, A.; Frontasyeva, M.V. A review of major and trace elements in Nile River and Western Red Sea sediments: An approach of geochemistry, pollution, and associated hazards. Appl. Radiat. Isot. 2021, 170, 109595. [Google Scholar] [CrossRef]
  7. Gashaw, T.; Bantider, A.; Zeleke, G.; Alamirew, T.; Jemberu, W.; Worqlul, A.W.; Dile, Y.T.; Bewket, W.; Meshesha, D.T.; Adem, A.A.; et al. Evaluating InVEST model for estimating soil loss and sediment export in data scarce regions of the Abbay (Upper Blue Nile) Basin: Implications for land managers. Environ. Chall. 2021, 5, 100381. [Google Scholar] [CrossRef]
  8. Muoi, L.V.; Srilert, C.; Dang Tri, V.P.; Pham Van, T. Spatial and temporal variabilities of surface water and sediment pollution at the main tidal-influenced river in Ca Mau Peninsular, Vietnamese Mekong Delta. J. Hydrol. Reg. Stud. 2022, 41, 101082. [Google Scholar] [CrossRef]
  9. Wang, S.; Zhang, L.; She, D.; Wang, G.; Zhang, Q. Future projections of flooding characteristics in the Lancang-Mekong River Basin under climate change. J. Hydrol. 2021, 602, 126778. [Google Scholar] [CrossRef]
  10. Rahman, M.M.; Haque, A.; Nicholls, R.J.; Darby, S.E.; Urmi, M.T.; Dustegir, M.M.; Dunn, F.E.; Tahsin, A.; Razzaque, S.; Horsburgh, K.; et al. Sustainability of the coastal zone of the Ganges-Brahmaputra-Meghna delta under climatic and anthropogenic stresses. Sci. Total Environ. 2022, 829, 154547. [Google Scholar] [CrossRef]
  11. Mainuddin, M.; Kirby, J.M. Impact of flood inundation and water management on water and salt balance of the polders and islands in the Ganges delta. Ocean Coast. Manag. 2021, 210, 105740. [Google Scholar] [CrossRef]
  12. Zhang, F.; Jin, G.; Liu, G. Evaluation of virtual water trade in the Yellow River Delta, China. Sci. Total Environ. 2021, 784, 147285. [Google Scholar] [CrossRef] [PubMed]
  13. Zhu, W.; Yang, J.; Yao, R.; Wang, X.; Xie, W.; Li, P. Nitrate leaching and NH3 volatilization during soil reclamation in the Yellow River Delta, China. Environ. Pollut. 2021, 286, 117330. [Google Scholar] [CrossRef] [PubMed]
  14. Han, Y.; Zhao, Y.; Zhang, Y.; Wang, X.; Wu, L.; Ding, P.; Jin, L. Monitoring and Analysis of Land Subsidence in Modern Yellow River Delta Using SBAS-InSAR Technology. IOP Conf. Ser. Earth Environ. Sci. 2021, 643, 012166. [Google Scholar] [CrossRef]
  15. Zhang, C.; Gong, Z.; Qiu, H.; Zhang, Y.; Zhou, D. Mapping typical salt-marsh species in the Yellow River Delta wetland supported by temporal-spatial-spectral multidimensional features. Sci. Total Environ. 2021, 783, 147061. [Google Scholar] [CrossRef] [PubMed]
  16. Zhang, Z.; Song, Y.; Zhang, H.; Li, X.; Niu, B. Spatiotemporal dynamics of soil salinity in the Yellow River Delta under the impacts of hydrology and climate. Ying Yong Sheng Tai Xue Bao = J. Appl. Ecol. 2021, 32, 1393–1405. [Google Scholar]
  17. Liu, Z.; Feng, S.; Zhang, D.; Han, Y.; Cao, R. Effects of precipitation, irrigation, and exploitation on groundwater geochemical evolution in the people’s victory canal irrigation area, China. Appl. Water Sci. 2023, 13, 1. [Google Scholar] [CrossRef]
  18. Zhao, H.; Lin, Y.; Delang, C.O.; Ma, Y.; Zhou, J.; He, H. Contribution of soil erosion to the evolution of the plateau-plain-delta system in the Yellow River basin over the past 10,000 years. Palaeogeogr. Palaeoclimatol. Palaeoecol. 2022, 601, 111133. [Google Scholar] [CrossRef]
  19. Wang, Q.; Jin, H.; Yuan, Z.; Yang, C. Synergetic variations of active layer soil water and salt in a permafrost-affected meadow in the headwater area of the Yellow River, northeastern Qinghai–Tibet plateau. Int. Soil Water Conserv. Res. 2022, 10, 284–292. [Google Scholar] [CrossRef]
  20. Yang, H.; Sun, J.; Xia, J.; Fu, Z.; Cheng, S.; Li, T.; Shao, P.; Dong, K.; Ma, J.; Feng, L. Distribution and Assessment of Cr, Pb, Ni and Cd in Topsoil of the Modern Yellow River Delta, China. Wetlands 2021, 41, 26. [Google Scholar] [CrossRef]
  21. Guo, Y.; Wang, X.; Li, X.; Xu, M.; Li, Y.; Zheng, H.; Luo, Y.; Smith, P. Impacts of land use and salinization on soil inorganic and organic carbon in the middle-lower Yellow River Delta. Pedosphere 2021, 31, 839–848. [Google Scholar] [CrossRef]
  22. Liu, Y.; Liu, J.; Xia, X.; Bi, H.; Huang, H.; Ding, R.; Zhao, L. Land subsidence of the Yellow River Delta in China driven by river sediment compaction. Sci. Total Environ. 2021, 750, 142165. [Google Scholar] [CrossRef]
  23. Wu, Y.; Zhang, Y.; Dai, L.; Xie, L.; Zhao, S.; Liu, Y.; Zhang, Z. Hydrological connectivity improves soil nutrients and root architecture at the soil profile scale in a wetland ecosystem. Sci. Total Environ. 2021, 762, 143162. [Google Scholar] [CrossRef] [PubMed]
  24. Ahmed, W.; Wu, Y.; Kidwai, S.; Li, X.; Zhang, G.; Zhang, J. Spatial and temporal variations of nutrients and chlorophyll a in the Indus River and its deltaic creeks and coastal waters (Northwest Indian Ocean, Pakistan). J. Mar. Syst. 2021, 218, 103525. [Google Scholar] [CrossRef]
  25. Guo, L.; Sun, Z.; Ouyang, Z.; Han, D.; Li, F. A comparison of soil quality evaluation methods for Fluvisol along the lower Yellow River. Catena 2017, 152, 135–143. [Google Scholar] [CrossRef]
  26. Mahajan, G.; Das, B.; Morajkar, S.; Desai, A.; Murgaokar, D.; Kulkarni, R.; Sale, R.; Patel, K. Soil quality assessment of coastal salt-affected acid soils of India. Environ. Sci. Pollut. Res. 2020, 27, 26221–26238. [Google Scholar] [CrossRef]
  27. Ahmed, Z.; Ambinakudige, S. Does land use change, waterlogging, and salinity impact on sustainability of agriculture and food security? Evidence from southwestern coastal region of Bangladesh. Environ. Monit. Assess. 2023, 195, 74. [Google Scholar] [CrossRef] [PubMed]
  28. Liu, Q.; Li, F.; Zhang, Q.; Li, J.; Zhang, Y.; Tu, C.; Ouyang, Z. Impact of water diversion on the hydrogeochemical characterization of surface water and groundwater in the Yellow River Delta. Appl. Geochem. 2014, 48, 83–92. [Google Scholar] [CrossRef]
  29. Zhang, X.; Yang, Y.; Zheng, Z. Analysis of Temporal Evolution Characteristics of Annual Precipitation in the Yellow River Delta. Nat. Environ. Pollut. Technol. 2021, 20, 177–184. [Google Scholar] [CrossRef]
  30. Liu, Y.; Zhang, Y.; Xie, L.; Zhao, S.; Dai, L.; Zhang, Z. Effect of soil characteristics on preferential flow of Phragmites australis community in Yellow River delta. Ecol. Indic. 2021, 125, 107486. [Google Scholar] [CrossRef]
  31. Zhang, X.; Zhang, Z.; Wang, W.; Fang, W.-T.; Chiang, Y.-T.; Liu, X.; Ju, H. Vegetation successions of coastal wetlands in southern Laizhou Bay, Bohai Sea, northern China, influenced by the changes in relative surface elevation and soil salinity. J. Environ. Manag. 2021, 293, 112964. [Google Scholar] [CrossRef]
  32. Yang, H.; Xia, J.; Cui, Q.; Liu, J.; Wei, S.; Feng, L.; Dong, K. Effects of different Tamarix chinensis-grass patterns on the soil quality of coastal saline soil in the Yellow River Delta, China. Sci. Total Environ. 2021, 772, 145501. [Google Scholar] [CrossRef] [PubMed]
  33. Paul, G.C.; Saha, S.; Ghosh, K.G. Assessing the soil quality of Bansloi river basin, eastern India using soil-quality indices (SQIs) and Random Forest machine learning technique. Ecol. Indic. 2020, 118, 106804. [Google Scholar] [CrossRef]
  34. Zhang, Z.; Sun, D.; Tang, Y.; Zhu, R.; Li, X.; Gruda, N.; Dong, J.; Duan, Z. Plastic shed soil salinity in China: Current status and next steps. J. Clean. Prod. 2021, 296, 126453. [Google Scholar] [CrossRef]
  35. Zhai, J.; Anderson, J.T.; Yan, G.; Cong, L.; Wu, Y.; Dai, L.; Liu, J.; Zhang, Z. Decomposition and nutrient dynamics responses of plant litter to interactive effects of flooding and salinity in Yellow River Delta wetland in northeastern China. Ecol. Indic. 2021, 120, 106943. [Google Scholar] [CrossRef]
  36. Zhao, Y.; Xu, X.; Darilek, J.L.; Huang, B.; Sun, W.; Shi, X. Spatial variability assessment of soil nutrients in an intense agricultural area, a case study of Rugao County in Yangtze River Delta Region, China. Environ. Geol. 2009, 57, 1089–1102. [Google Scholar] [CrossRef]
  37. Cao, L.; Wu, D.; Liu, P.; Hu, W.; Xu, L.; Sun, Y.; Wu, Q.; Tian, K.; Huang, B.; Yoon, S.J.; et al. Occurrence, distribution and affecting factors of microplastics in agricultural soils along the lower reaches of Yangtze River, China. Sci. Total. Environ. 2021, 794, 148694. [Google Scholar] [CrossRef]
  38. Ma, L.; Lin, H.; Xie, X.; Dai, M.; Zhang, Y. Major role of ammonia-oxidizing bacteria in N2O production in the Pearl River estuary. Biogeosciences 2019, 16, 4765–4781. [Google Scholar] [CrossRef] [Green Version]
  39. Zhang, H.; Kariman, K.; Zhu, L.; Liu, Y.; Chen, J.; Li, D. Spatial distribution of carbon, nitrogen and sulfur in surface soil across the Pearl River Delta area, South China. Geoderma Reg. 2021, 25, e00390. [Google Scholar] [CrossRef]
  40. Wan, S.; Mou, X.; Liu, X. Effects of Reclamation on Soil Carbon and Nitrogen in Coastal Wetlands of Liaohe River Delta, China. Chin. Geogr. Sci. 2018, 28, 443–455. [Google Scholar] [CrossRef] [Green Version]
  41. Wang, H.; Chang, H.; Walker, T.R.; Wang, Y.; Wu, H.; Luo, Q.; Wang, X.; Zhao, Y. Characterization and risk assessment of metals in surface sediments and riparian zone soils of Liaohe River, China. Appl. Geochem. 2021, 134, 105104. [Google Scholar] [CrossRef]
  42. Nigatu, Z.M.; Fan, D.; You, W.; Melesse, A.M.; Pu, L.; Yang, X.; Wan, X.; Jiang, Z. Crop production response to soil moisture and groundwater depletion in the Nile Basin based on multi-source data. Sci. Total. Environ. 2022, 825, 154007. [Google Scholar] [CrossRef] [PubMed]
  43. Liu, L.; Wu, Y.; Yin, M.; Ma, X.; Yu, X.; Guo, X.; Du, N.; Eller, F.; Guo, W. Soil salinity, not plant genotype or geographical distance, shapes soil microbial community of a reed wetland at a fine scale in the Yellow River Delta. Sci. Total. Environ. 2023, 856, 159136. [Google Scholar] [CrossRef] [PubMed]
  44. Yang, X.; Li, J.; Zheng, Y.; Li, H.; Qiu, R. Salinity elevates Cd bioaccumulation of sea rice cultured under co-exposure of cadmium and salt. J. Environ. Sci. 2023, 126, 602–611. [Google Scholar] [CrossRef] [PubMed]
  45. Wang, L.; Qin, L.; Sun, X.; Zhao, S.; Yu, L.; Chen, S.; Wang, M. Salt stress-induced changes in soil metabolites promote cadmium transport into wheat tissues. J. Environ. Sci. 2023, 127, 577–588. [Google Scholar] [CrossRef] [PubMed]
  46. Guo, Z.; Qin, Y.; Lv, J.; Wang, X.; Dong, H.; Dong, X.; Zhang, T.; Du, N.; Piao, F. Luffa rootstock enhances salt tolerance and improves yield and quality of grafted cucumber plants by reducing sodium transport to the shoot. Environ. Pollut. 2023, 316, 120521. [Google Scholar] [CrossRef] [PubMed]
  47. Guo, X.; Du, S.; Guo, H.; Min, W. Long-term saline water drip irrigation alters soil physicochemical properties, bacterial community structure, and nitrogen transformations in cotton. Appl. Soil Ecol. 2023, 182, 104719. [Google Scholar] [CrossRef]
  48. Meng, L.; Qu, F.; Bi, X.; Xia, J.; Li, Y.; Wang, X.; Yu, J. Elemental stoichiometry (C, N, P) of soil in the Yellow River Delta nature reserve: Understanding N and P status of soil in the coastal estuary. Sci. Total Environ. 2021, 751, 141737. [Google Scholar] [CrossRef]
  49. Paul, P.L.C.; Bell, R.W.; Barrett-Lennard, E.G.; Kabir, E. Straw mulch and irrigation affect solute potential and sunflower yield in a heavy textured soil in the Ganges Delta. Agric. Water Manag. 2020, 239, 106211. [Google Scholar] [CrossRef]
  50. Zijun, Z.; Ge, L.; Huang, Y.; Liu, Y.; Wang, S. Coupled relationships among anammox, denitrification, and dissimilatory nitrate reduction to ammonium along salinity gradients in a Chinese estuarine wetland. J. Environ. Sci. 2021, 106, 39–46. [Google Scholar]
  51. Zhang, Y.; Zhang, F.; Abalos, D.; Luo, Y.; Hui, D.; Hungate, B.A.; García-Palacios, P.; Kuzyakov, Y.; Olesen, J.E.; Jørgensen, U.; et al. Stimulation of ammonia oxidizer and denitrifier abundances by nitrogen loading: Poor predictability for increased soil N2O emission. Glob. Chang. Biol. 2022, 28, 2158–2168. [Google Scholar] [CrossRef]
  52. Sabzzadeh, I.; Alimohammadi, S. Spatiotemporal Simulation of Nitrate, Phosphate, and Salinity in the Unsaturated Zone for an Irrigation District West of Iran Using SWAP-ANIMO Model. J. Hydrol. Eng. 2023, 28, 04022037. [Google Scholar] [CrossRef]
  53. Ramzan, M.; Sarwar, N.; Ali, L.; Saba, R.; Alahmadi, T.A.; Datta, R. Nitrogen enriched chemically produced carbon supplementary impacts on maize growth under saline soil conditions. J. King Saud Univ.Sci. 2023, 35, 102292. [Google Scholar] [CrossRef]
  54. Li, C.; Feng, H.; Luo, X.; Li, Y.; Wang, N.; Wu, W.; Zhang, T.; Dong, Q.; Siddique, K.H. Limited irrigation and fertilization in sand-layered soil increases nitrogen use efficiency and economic benefits under film mulched ridge-furrow irrigation in arid areas. Agric. Water Manag. 2022, 262, 107406. [Google Scholar] [CrossRef]
  55. Wu, Y.; Gu, Y.; Kang, W.; Yu, H.; Chen, S.; Quan, X.; Lu, N. Construction of microchannel charcoal cathodes with spatial-constraint capability for enhancing reduction of NO3¯ in high-salinity water. Chem. Eng. J. 2023, 452, 139126. [Google Scholar] [CrossRef]
  56. Wang, Q.; Zhang, H.; Li, F.; Gu, C.; Qiao, Y.; Huang, S. Assessment of calibration methods for nitrogen estimation in wet and dry soil samples with different wavelength ranges using near-infrared spectroscopy. Comput. Electron. Agric. 2021, 186, 106181. [Google Scholar] [CrossRef]
  57. Chen, S.; Gao, D.; Zhang, J.; Zheng, Y.; Li, X.; Dong, H.; Yin, G.; Han, P.; Liang, X.; Liu, M.; et al. Gross nitrogen transformations in intertidal sediments of the Yangtze Estuary: Distribution patterns and environmental controls. Geoderma 2023, 429, 116233. [Google Scholar] [CrossRef]
  58. Yang, D.; Song, L.; Jin, G. The soil C:N:P stoichiometry is more sensitive than the leaf C:N:P stoichiometry to nitrogen addition: A four-year nitrogen addition experiment in a Pinus koraiensis plantation. Plant Soil 2019, 442, 183–198. [Google Scholar] [CrossRef]
  59. Elsiddig, A.M.I.; Zhou, G.; Zhu, G.; Nimir, N.E.A.; Suliman, M.S.E.; Ibrahim, M.E.H.; Ali, A.Y.A. Nitrogen fertilizer promoting salt tolerance of two sorghum varieties under different salt compositions. Chil. J. Agric. Res. 2023, 83, 3–13. [Google Scholar] [CrossRef]
  60. Miao, J.; Li, X.; Wang, X. Effects of biochar on nitrogen and phosphorus retention in the coastal wetland soil of the Yellow River Delta, China. E3S Web Conf. 2021, 251, 02028. [Google Scholar] [CrossRef]
  61. Qu, F.; Meng, L.; Xia, J.; Huang, H.; Zhan, C.; Li, Y. Soil phosphorus fractions and distributions in estuarine wetlands with different climax vegetation covers in the Yellow River Delta. Ecol. Indic. 2021, 125, 107497. [Google Scholar] [CrossRef]
  62. Rady, M.M.; Mossa, A.-T.H.; Youssof, A.M.; Osman, A.S.; Ahmed, S.M.; Mohamed, I.A. Exploring the reinforcing effect of nano-potassium on the antioxidant defense system reflecting the increased yield and quality of salt-stressed squash plants. Sci. Hortic. 2023, 308, 111609. [Google Scholar] [CrossRef]
  63. Li, Y.; Wu, H.; Wang, J.; Cui, L.; Tian, D.; Wang, J.; Zhang, X.; Yan, L.; Yan, Z.; Zhang, K.; et al. Plant biomass and soil organic carbon are main factors influencing dry-season ecosystem carbon rates in the coastal zone of the Yellow River Delta. PLoS ONE 2019, 14, e0210768. [Google Scholar] [CrossRef] [PubMed] [Green Version]
  64. Liang, X.; Yuan, G.; Feng, L.; Bi, D.; Wei, J. Soil properties and the growth of wheat (Triticum aestivum L.) and maize (Zea mays L.) in response to reed (phragmites communis) biochar use in a salt-affected soil in the Yellow River Delta. Agric. Ecosyst. Environ. 2020, 303, 107124. [Google Scholar] [CrossRef]
  65. Su, X.; Lu, C.; Li, M.; Wang, Y.; Wang, N. Using 222Rn temporal and spatial distributions to estimate the groundwater discharge rate and associated nutrient fluxes into high salinity lakes in Badain Jaran Desert, Northwest China. Sci. Total. Environ. 2023, 857, 159359. [Google Scholar] [CrossRef]
  66. Lian, J.; Cheng, L.; Zhai, X.; Wu, R.; Huang, X.; Chen, D.; Pan, J.; Shohag, M.; Xin, X.; Ren, X.; et al. Zinc glycerolate (Glyzinc): A novel foliar fertilizer for zinc biofortification and cadmium reduction in wheat (Triticum aestivum L.). Food Chem. 2023, 402, 134290. [Google Scholar] [CrossRef]
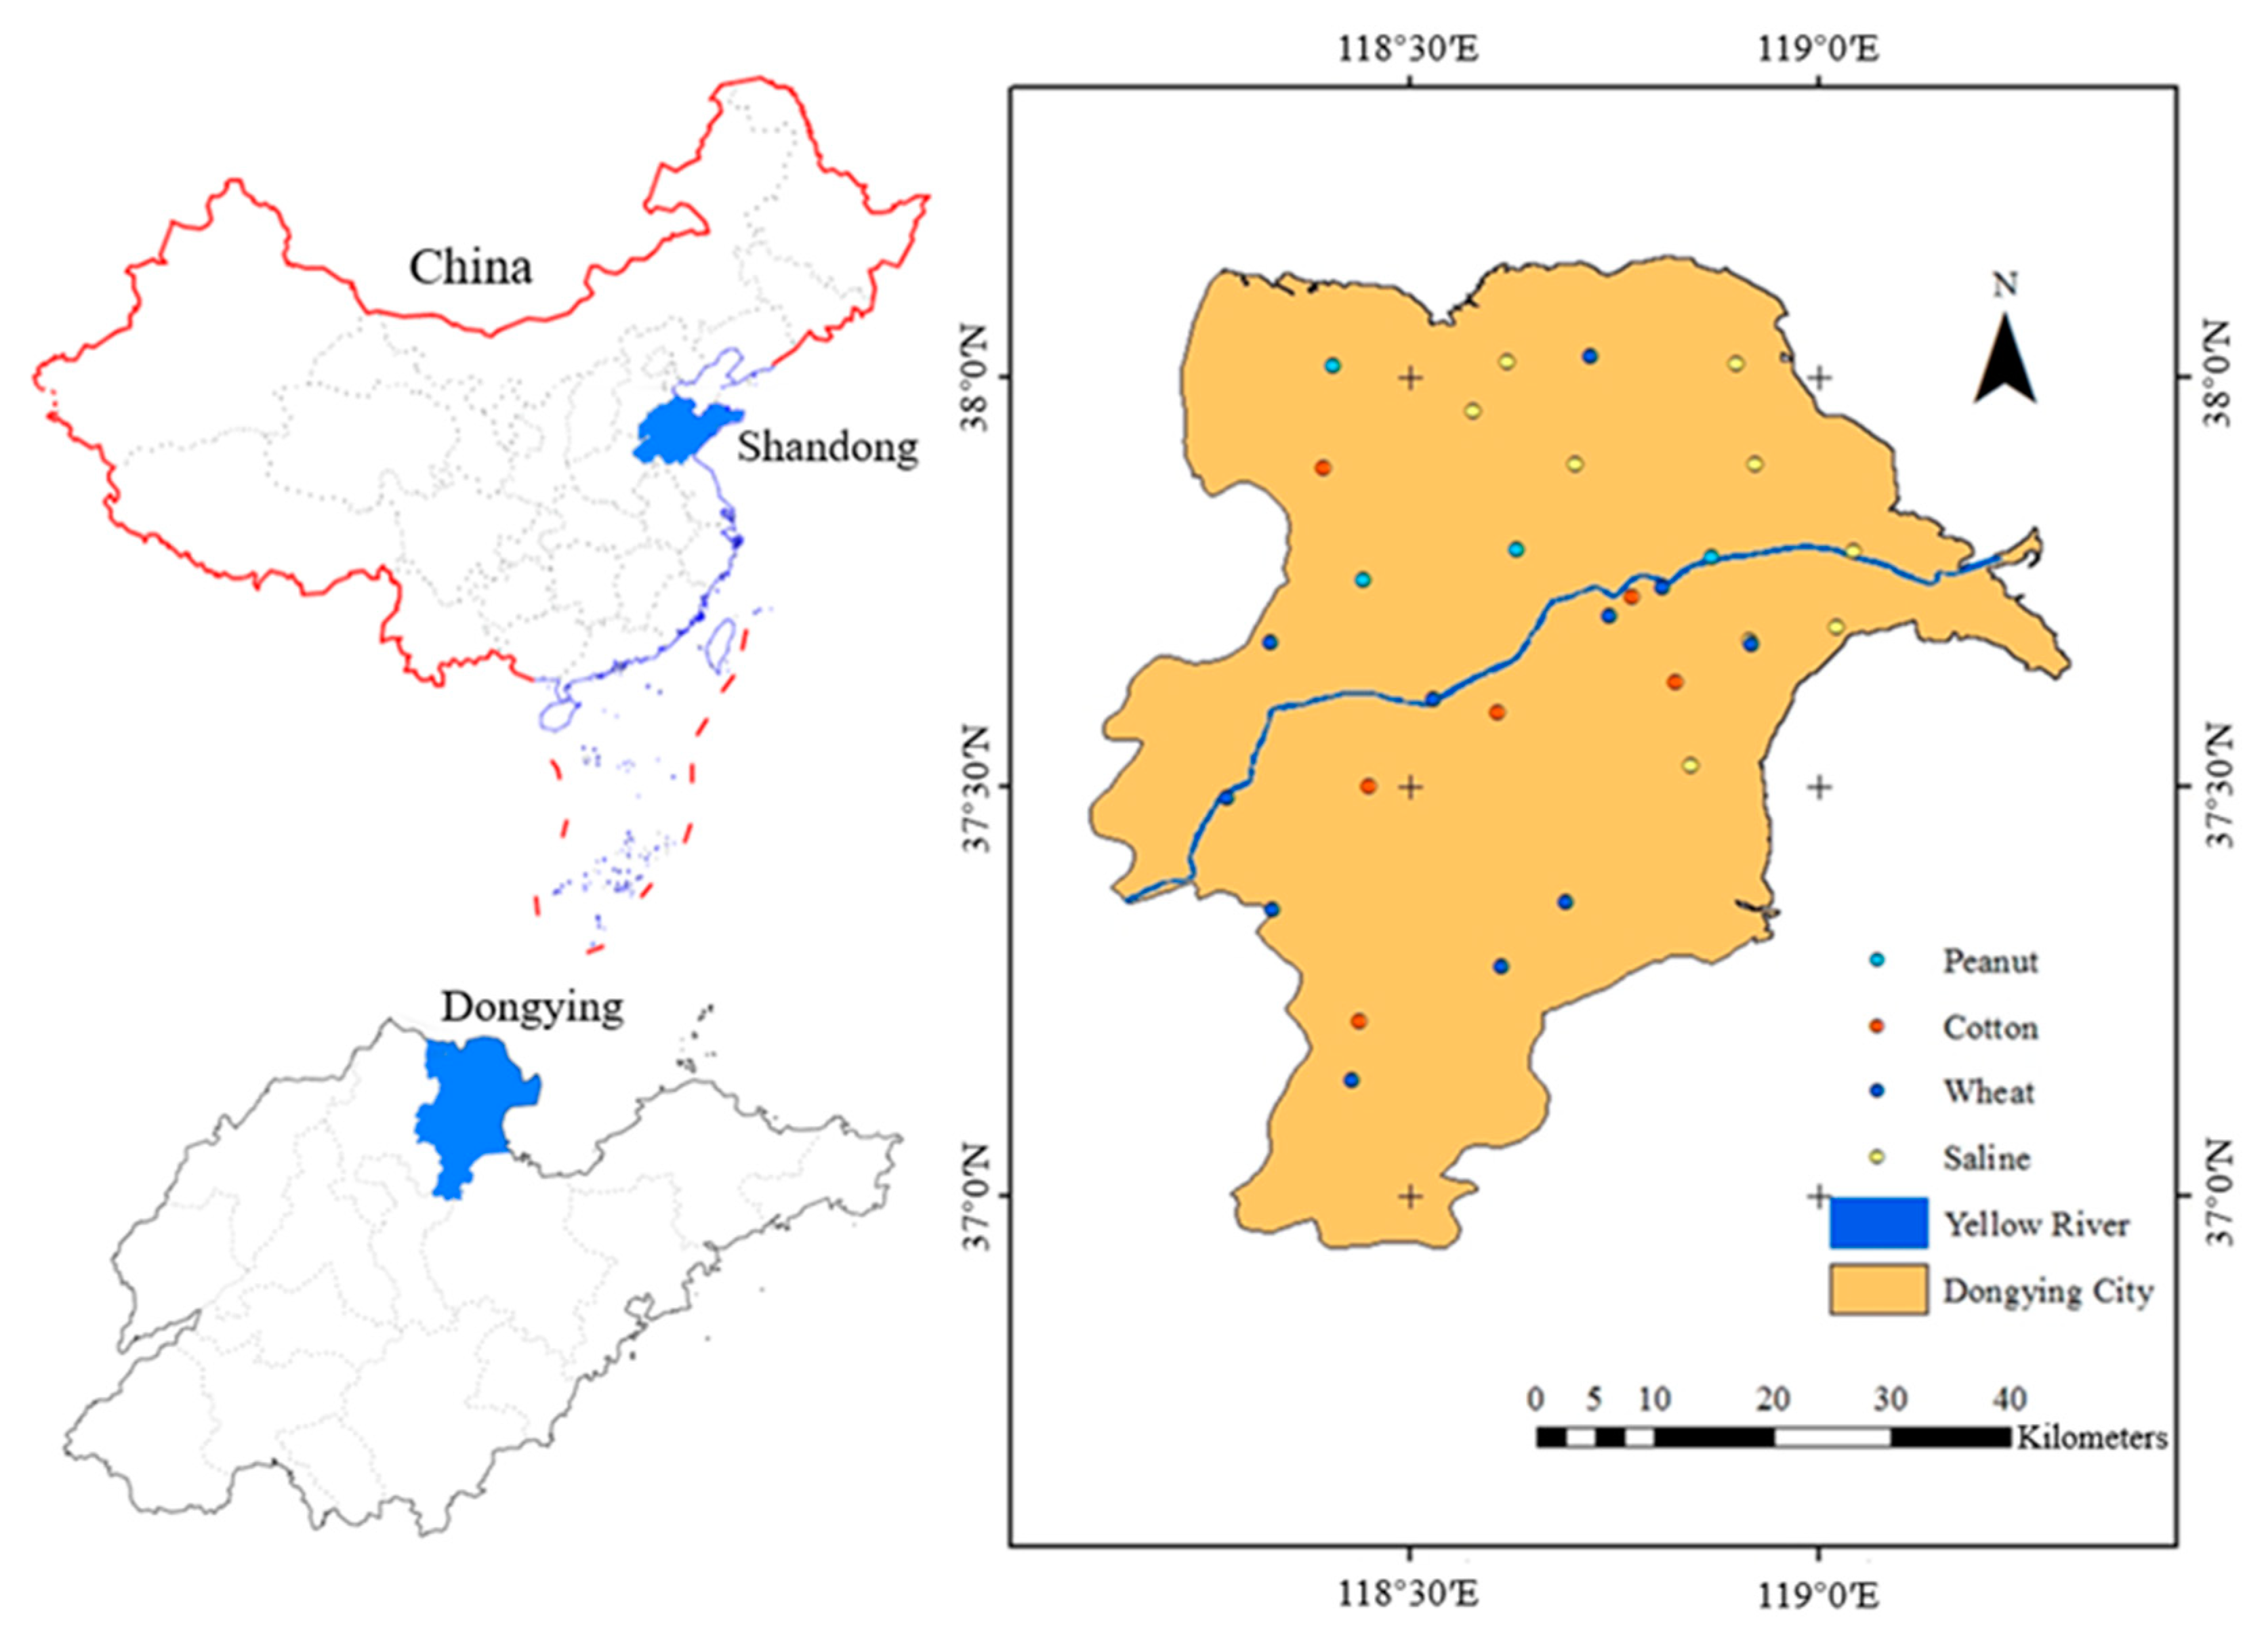
Figure 1. Distribution of different land use types and sampling sites.
Sustainability 15 01173 g001
Figure 2. Vertical distribution of soil physicochemical properties for different land use types.
Sustainability 15 01173 g002
Figure 3. Vertical distribution of soil texture of different land use types.
Sustainability 15 01173 g003
Figure 4. Heat map of cluster analysis of different land use types. Note: P stands for peanut, C stands for cotton, W stands for wheat, and S stands for saline bare soil; the seven depths of 0–5 cm, 5–10 cm, 10–20 cm, 20–40 cm, 40–60 cm, 60–80 cm, and 80–100 cm are indicated by −1, –2, –3, –4, –5, –6, and –7, respectively.
Sustainability 15 01173 g004
Figure 5. Material transport and transformation in saline soils.
Sustainability 15 01173 g005
Figure 6. Correlation analysis of soil physical and chemical properties of different land use types. Note: * indicate significant correlation at the 0.05 levels.
Sustainability 15 01173 g006
Table 1. General soil physical and chemical properties of different land use types.
Soil PropertiesPeanut (n = 4)Cotton (n = 6)Wheat (n = 11)Saline (n = 9)
SWC (%)19.28 ± 4.94 c24.32 ± 4.43 ab22.14 ± 3.50 bc26.88 ± 2.26 a
pH8.46 ± 0.13 a8.55 ± 0.13 a8.46 ± 0.09 a8.44 ± 0.04 a
SSC (g/kg)1.44 ± 0.34 b1.69 ± 0.27 b1.91 ± 0.12 b4.52 ± 0.91 a
SAR9.12 ± 1.49 c14.63 ± 3.80 b18.57 ± 2.97 b75.34 ± 5.74 a
Sand (%)39.96 ± 1.53 a27.62 ± 4.61 b20.01 ± 2.73 c11.76 ± 2.39 d
Silt (%)51.92 ± 2.76 d57.13 ± 3.97 c63.45 ± 3.31 b70.97 ± 2.53 a
Clay (%)8.12 ± 1.55 b15.25 ± 3.71 a16.54 ± 1.52 a17.27 ± 3.31 a
NH4+-N (mg/kg)1.53 ± 0.32 c1.85 ± 0.19 b2.05 ± 0.15 b2.36 ± 0.12 a
NO3-N (mg/kg)308.92 ± 244.00 b328.47 ± 173.04 b697.19 ± 108.30 a162.39 ± 77.10 b
AN (mg/kg)30.87 ± 13.83 a34.53 ± 15.90 a41.89 ± 23.68 a39.73 ± 21.90 a
AP (mg/kg)14.35 ± 12.79 a12.49 ± 3.64 a17.70 ± 10.88 a8.92 ± 0.95 a
AK (mg/kg)99.82 ± 42.58 c134.25 ± 49.09 bc158.63 ± 40.26 b220.34 ± 30.58 a
Where n is the number of sample plots. Different letters within treatments indicate significant and similar letters are not significant at p < 0.05.
Table 2. Soil nutrients of main deltas worldwide.
River DeltaYellowYangtzePearlLiao
NH4+-N (mg/kg)4.2–42.335.94–29.3047.59–739.613.26–13.79
NO3-N (mg/kg)1.49–22.341.46–88.611.1–131312.07–30.34
AN (mg/kg)15–6499.74–175.913.7–221.315–105.24
AP (mg/kg)1.07–25.35.23–169.863.8–227.29.58–21.61
AK (mg/kg)37–92040.81–235.1030–54060–177
References[12,28][36,37][38,39][40,41]
Table 3. China’s second soil census nutrient classification standards.
CriteriaAN (mg/kg)AP (mg/kg)AK (mg/kg)
Level I>150>40>200
Level II120–15020–40150–200
Level III90–12010–20100–150
Level IV60–905–1050–100
Level V30–603–530–50
Level VI<30<3<30
Table 4. Eigenvalues and contribution rates of each principal component.
Principal Component NumberPC1PC2PC3
SWC0.18494−0.430570.12004
pH−0.12364−0.423960.28878
SSC0.37565−0.02078−0.35406
SAR0.37965−0.11142−0.30557
SAND−0.39090.05741−0.28888
SLIT0.37131−0.147570.15535
CLAY0.303040.117590.4314
NH4+-N0.373150.039710.14256
NO3-N−0.041830.375190.56797
AN0.127630.43845−0.1726
AP−0.056560.430080.02495
AK0.349680.25211−0.1282
Table 5. Soil quality index level.
SQI≤0.300.30–0.400.40–0.500.50–0.60>0.60
CriteriaLevel ILevel IILevel IIILevel IVLevel V
QualityVery lowLowMediumHighVery high
Disclaimer/Publisher’s Note: The statements, opinions and data contained in all publications are solely those of the individual author(s) and contributor(s) and not of MDPI and/or the editor(s). MDPI and/or the editor(s) disclaim responsibility for any injury to people or property resulting from any ideas, methods, instructions or products referred to in the content.