Abstract
In order to solve the problem of integrated heat dissipation in electronic chips under continuous high-intensity operation and thus ensure their stable and normal operation, a novel bionic vapor chamber with a composite structure of leaf vein grooves is proposed. Leaf veins produce effective nutrient transport; however, how the wick core of the leaf vein groove porous composite structure affects heat transfer and flow in the vapor chamber remains elusive. In this study, the effects of the groove parameters, including the central groove diameter (D), the ratio of the inner and outer circle diameter (γ), and the number of grooves (N), on the temperature, velocity, and pressure distribution of the bionic vapor chamber were investigated based on a simplified numerical model. The results show that the maximum temperature difference at the condensing surface was reduced by approximately 50% as compared to the conventional vapor chamber, implying better temperature homogeneity. In addition, the heat and mass transfer performance of the vapor chamber improved as parameter γ increased. Moreover, the effects of variations in parameters N and D on the performance of the vapor chamber were competitive, with larger values of parameters N and D enhancing the heat transfer performance of the vapor chamber, and smaller parameter values reducing the flow pressure drop of the liquid. This provides a reference for research on the optimization of bionic vapor chambers.
1. Introduction
As the degree of circuit integration increases, the high frequency and speed of electronic devices and the density and volume of integrated circuits tend to reduce the heat generation of electronic components per unit volume and the energy consumption of individual chips. Moreover, the compact structure of the devices makes it more difficult to dissipate heat, so there is an urgent need to solve the problem of efficient heat dissipation [1,2]. For example, the power density of high-performance server equipment chips can reach the order of 1 MW/m2, with phased-array radars and other devices even reaching 5–10 MW/m2 [3]. As the internal temperature of LED chips rises by 10 °C, LED luminous efficiency drops 2% to 3%; if an ultra-high chip temperature rise of 50 °C is observed, LED luminous efficiency drops by 15% [4]. Avionics equipment does not allow temperature fluctuations to exceed certain limits while meeting thermal requirements, otherwise the reliability of the entire system operation will be affected [5,6]. In the above-mentioned fields of heat dissipation, as compared with a microchannel heat sink [7], a vapor chamber has various unique advantages due to its high transfer capacity, small heat transfer temperature difference, high heat flow density, and high critical load [8].
To address the conflicting needs of large capillary action and high permeability/low flow resistance in vapor chambers, many studies have been carried out with the aim of optimizing the structure of vapor chambers with composite wick cores. Various wick core structures have been investigated, including sintered powder [9,10,11], sieves [12,13,14], foam [15,16], and micropillar arrays/microchannels/notches [17]. Hwang and Min et al. [9,10,11] prepared two types of vapor chambers with multiple dry channel structures. Their evaporative-end suction cores used a vapor chamber combined with multiple radial radiation return dry channel structures [9] or a support column-type array structure [10,11] in addition to a single-layer copper powder sintered structure. These two vapor chamber structures were experimentally tested to reduce the hydraulic resistance and thermal resistance of the evaporative suction core and increase its critical heat flow density. Zhou et al. [12] developed a new suction core structure, i.e., a spiral woven wire mesh (SWM) with a three-dimensional structure, for experiments on capillary rise rate and heat transfer performance. For this structure, Zhou et al. [13,14] constructed several vapor chambers with different weaving parameters and liquid-vapor channel occupancy ratios for cooling thin portable electronics. Somasundaram et al. [15] designed a flat heat pipe using copper foam as the liquid-absorbing core structure, and experimentally investigated the effects of parameters such as the presence or absence of a liquid-absorbing core support column, liquid-filling rate, and heat source power on the thermal response of the flat heat pipe. Ji et al. [16] studied a vapor chamber in which the surface of the suction core at the evaporating end was directly connected to the suction core at the condensing end by multiple strips of copper foam. The experimental results found that the vapor chamber could work normally at a heat flow density of 216 W/cm2 with a minimum thermal resistance of 0.09 K/W. Li et al. [17] compared a vapor chamber with parallel microgrooves on the shell surface and a sintered aluminum powder core structure and found that the heat transfer performance of the vapor chamber with sintered aluminum powder was better. Ju et al. [18] combined a columnar array structure, a radial dry channel structure, and a liquid supply structure with a double aperture porous structure and a thin evaporation layer to design an averaging plate with a hybrid wicking core structure. It was experimentally tested to obtain a hybrid wicking core structure with an ultimate heat flux of more than 350 W/cm2 and a peak heat transfer coefficient of more than 20 W/(cm2·K) for a heating area of 1 cm2. For the radially radiating composite groove-absorbing core structure homogeneous heat transfer plate, Deng et al. [19] designed a structure with uniform radial grooves at the evaporating end of the suction core that is in close contact with the sintered suction core at the condensing end. Experiments demonstrated its stable operation at high heat flow densities and an optimum thermal resistance of less than 0.15 °C/W. On the basis of this model, Wang et al. [20] numerically simulated the effect of the central groove diameter, the groove width, and the number of grooves of the suction core on the heat and mass transfer performance of the vapor chamber, revealing potential directions for optimizing the structure of the suction core. Liu et al. [21] performed experiments to compare two cases of homogeneous heat transfer plates in which the evaporating end of the suction core was closely connected to the condensing surface of the suction core. The results showed that the evaporating end of the suction core had more liquid supply channels and the critical heat flux increased when it was in close contact with the condensing end.
Inspired by the transpiration of plant leaves, scholars have conducted a large amount of research on the vapor chamber aspect of leaf vein bionic structures. Wang et al. [22] introduced the leaf vein feature into the composite absorbent core structure of vapor chambers and studied the composite structure by combining evaporative-end groove bionic leaf veins and screened copper foam. However, there is high contact thermal resistance at the intersection between the two different materials. Peng et al. [23,24] showed that the fractal structure of the plant veins on the surface of the condensate base plate with Y-shaped branches facilitates the passage of fluids and helps to improve permeability along the length and height of the microgrooves as compared to the conventional parallel structure. These leaf vein bionic absorption core structures are mainly limited to the outside of the metal tube (plate), inside the tube, and they are generally silicon-based. Thus, they are complicated to fabricate, have a low yield rate, exhibit poor antigravity performance, and are, not suitable for the cooling of electronic devices under working conditions. Wang et al. [25] investigated the mechanical properties of thin-walled tubes with imitation lotus leaf veins.
A lot of research has been focused on vapor chamber with composite wick core structures to improve the heat transfer performance. In particular, thermodynamic and mechanical improvements can be attained using leaf vein bionic structures. However, there is still very little knowledge about vapor chambers with leaf vein bionic groove composite structures, especially related to the influence of the structural parameters of such vapor chambers.
For this reason, we built and simulated a series of leaf vein bionic vapor chambers. In this paper, we propose a leaf vein bionic vapor chamber, i.e., the absorbent core has a leaf vein bionic groove porous composite structure as shown in Figure 1. The bionic vapor chamber leaf vein bionic groove structure proposed herein has a single porous structure (e.g., copper powder, copper foam, etc.), which provides a transverse converging artery for the liquid to return to the central evaporation zone with less hydraulic resistance and reduced contact thermal resistance. There is a much larger circular cavity in the center of the evaporating surface of the suction core, which facilitates the storage of working liquid and centralized heat removal from the evaporator. The evaporating surface of the wick core is in close contact with the condensing surface, which plays a certain supporting role. This paper investigates the effect of the groove parameters of this structure, including the diameter of the central recess (D), the ratio of the inner and outer circle diameters (γ), and the number of grooves (N), on the flow and heat transfer of the mass in the vapor chamber through computational fluid dynamics (CFD).
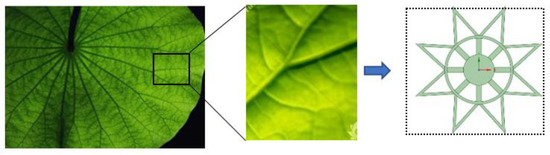
Figure 1.
Leaf vein bionic capillary flow structure.
2. Description of the Numerical Model
2.1. Geometric Model and Basic Parameters
The wick core structure can be divided into three areas: the liquid evaporation sink area (area ①), the vapor diffusion area (area ②), and the suction core area (area ③), which contains the support body and is where condensing liquid capillary reflux occurs. Area ① is larger than the other areas to facilitate the generation of vapor and the vapor core and is thinner to help reduce the evaporative thermal resistance. Area ② facilitates the rapid diffusion of vapor around the working liquid after vaporization and rapid condensation, which, in turn, alleviates the phenomenon of ground gas–liquid counterflow when the liquid boils. Area ③ provides a large capillary pressure for liquid reflux, which must withstand the pressure difference between the internal cavity and the external environment of the vapor chamber, and prevents the surface collapse of the vapor chamber in the vacuum diffusion welding process due to the high pressure and high temperature.
As shown in Figure 2, the bionic vapor chamber has a diameter and thickness of 84 mm and 6 mm, respectively, with a liquid-absorbing core made of metallic copper powder sintered on the inner surface of a 1.5 mm thick copper shell. The liquid evaporation sink area measures 10*2 mm, the total thickness of the evaporation surface suction core structure is 2.5 mm, and the thickness of the sintered copper powder layer in the evaporation sink area is 0.5 mm. The evaporation sink area is thinner in order to reduce the evaporation heat resistance. The sintered porous matrix has eight internal recesses, all spaced 22.5° apart from each other. The basic parameters of the bionic vapor chamber and their values are shown in Table 1. The groove parameters, including the central groove diameter (D), the ratio of the inner and outer circle diameters (γ), and the number of grooves (N), are given in Table 2.
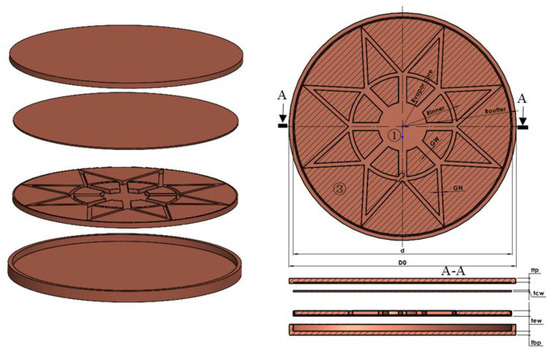
Figure 2.
Split diagram of the vapor chamber.

Table 1.
Basic vapor chamber parameters.
Table 2.
Groove parameter values.
2.2. Control Equations and Boundary Conditions
The following assumptions were adopted: (1) the vapor chamber is in a steady-state heat transfer process; (2) the fluid flow in the suction core/liquid and vapor zones is laminar; (3) the suction core is an isotropic porous medium and the mass is completely infiltrated by the suction core; (4) the effect of gravity is ignored; (5) the vapor chamber works normally and no “dry burning” occurs.
The boundary conditions of the numerical models are shown in Figure 3 and Table 3. The ambient environment () was 298.15 K and convective transfer coefficient () was 1200 W/(m2·K), according to the experimental setup in [20]. The solution to the governing equations was obtained using a commercial code (ANSYS FLUENT 2021 R1, ANSYS, Inc. Pittsburgh, PA, USA) and the temperature boundary condition on the interface between the vapor core and liquid/wick was obtained utilizing the fluent user-defined function.
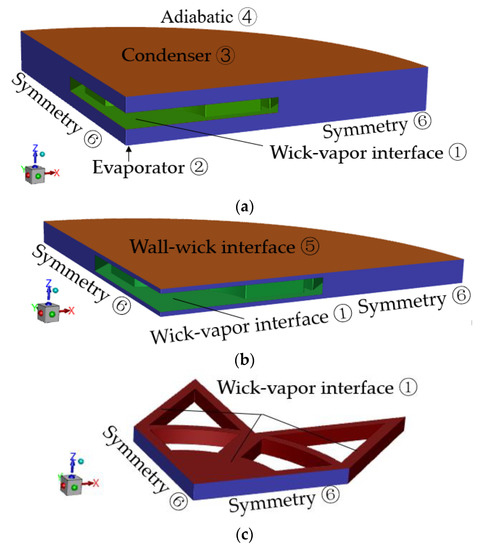
Figure 3.
A schematic of the domains used in the numerical models and boundary conditions. (a) Boundary conditions for heat transfer equations. (b) Boundary conditions for liquid flow equations. (c) Boundary conditions for vapor flow equations.
Table 3.
Table of boundary conditions.
The energy conservation equation for solid walls and capillary cores/liquids is as follows:
The continuity mass conservation equation and momentum conservation equation for the capillary core/liquid zone and vapor chamber are as follows:
where in Equation (3) represents the correction of the momentum equation based on the source term of the pressure in the capillary core/liquid zone, and ε and K represent the porosity and permeability of the wick structure, respectively.
The continuity mass conservation equation and momentum conservation equation for the vapor region are as follows:
Figure 4 shows the flowchart of the typical algorithm used in our numerical models. To the best of our knowledge, this is the first example of the decoupled method being used with two-phase flow equilibrium solvers, i.e., to decouple the thermodynamic solver and the flow solver [26]. The convergence index is as follows: (1) the relative error of the heat flow from the heating surface at the evaporation end and the heat flow from the condensation end within ±0.05%; (2) the residual value of the momentum equations with a continuity of less than 10−6.
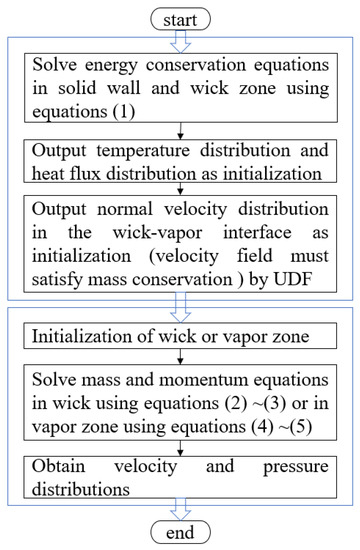
Figure 4.
A flowchart of the algorithm used in the numerical models.
3. Validation of the Numerical Model
3.1. Evaluation Indicators
3.1.1. Maximum Temperature Difference on the Condensing Surfaces ()
The maximum temperature difference on the condensing surfaces represents the maximum temperature difference across the condensing surfaces, and it is an important parameter to measure the temperature homogeneity of vapor chamber, which is calculated as follows:
and denote the maximum (K) and minimum (K) temperatures at the condensing surface, respectively.
3.1.2. The Total Thermal Resistance of the Vapor Chamber ()
The total thermal resistance of the vapor chamber is equal to the ratio of the temperature difference across the vapor chamber to the heat input, which is calculated as follows:
and denote the maximum temperature at the heat source (K) and the average temperature at the condensing surface (K), respectively, and denotes the area of the heat source (m2).
3.1.3. The Velocity Evaluation Parameters of the Vapor Chamber Include the Maximum Liquid Flow Velocity (Vl,max) and the Maximum Vapor Flow Velocity (Vv,max)
The maximum liquid flow velocity (Vl,max) and the maximum vapor flow velocity (Vv,max) represents the velocity distributions on wick and vapor of the vapor chamber respectively.
3.1.4. Total Pressure Drop of the Vapor Chamber ()
Total pressure drop of the vapor chamber is an important parameter to reflect the flow resistance of vapor chamber, which is calculated as follows:
and represent the maximum liquid flow pressure drop (Pa) and the maximum vapor flow pressure drop (Pa), respectively.
3.2. Numerical Model Validation
In order to verify the reliability of the numerical modelling approach for the bionic vapor chamber in this paper, the model was applied to the vapor chamber described by Koito [27] et al. to calculate the temperature field at different heat source heat flow densities. The calculated results were compared with literature values for verification. The vapor chamber shell material was copper, and the capillary core and support column were sintered copper powder structures with a porosity of 0.4.
The results of the comparison between the calculated values of the maximum temperature of the evaporating surface of the vapor chamber and the average temperature of the condensing surface for different heat flow densities of the heat source and the literature [27] values are shown in Figure 5. As can be seen from the graphs, the calculated results in this paper match well with the literature values, with a maximum relative error of less than 2% for the temperature values.
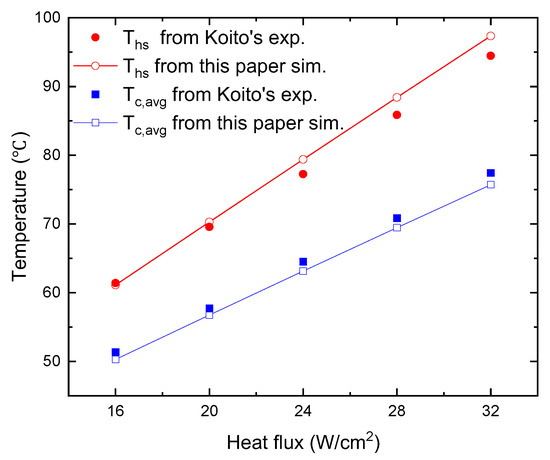
Figure 5.
The temperature values simulated (sim.) in this paper were compared with experimental (exp.) data in the literature [27].
3.3. Grid Independence Verification
An analysis of mesh independence was carried out to ensure that the number of elements was appropriate. Therefore, meshing was carried out for the bionic vapor chamber model N-08, as shown in Figure 6. The simulation results for three different sets of grid numbers (487,160, 543,720, and 763,866) with an input heat flow density of 8 × 10⁵ W/m2 are shown in Table 4. The deviations in the maximum temperature, the maximum liquid velocity, the maximum vapor velocity, the maximum liquid flow pressure drop, and the maximum vapor flow pressure drop were all less than 1%, so the simulation results can be considered to be independent of the number of grids.
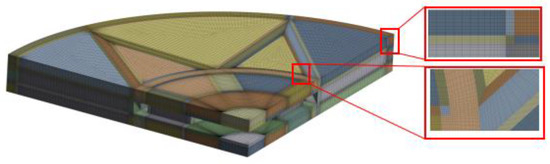
Figure 6.
Calculation domain grid diagram.
Table 4.
Grid independence test results.
3.4. Comparison of Performance with Conventional Vapor Chambers
In comparison with the heat transfer performance of conventional vapor chamber, the bionic vapor chamber has an N of 8 and γ of 0.5. The other main parameter values were the same as those of the conventional sintered radial absorbent core vapor chamber in the literature [28]: the overall thickness of the vapor chamber was 3 mm, the external diameter was 60 mm, and the central groove diameter was 15 × 1.1 mm. A comparison is shown in Figure 7. As can be seen from the graph, the thermal resistance of the bionic plate increased by no more than 5% under a thermal load of 20 to 200 W, but the maximum temperature difference at the condensing surface reduced by approximately 50%. For example, when the heating source power was 80 W, the maximum temperature difference value of the condensing surface reduced from 3.91 K to 1.97 K due to the bionic suction core design. This indicates that the bionic plate has better temperature homogenization performance than the conventional vapor chamber.
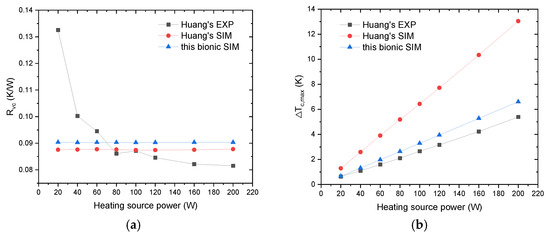
Figure 7.
Comparison of the performance of vapor chamber at different heating source powers. (a) thermal resistance; (b) maximum temperature difference between condensing surfaces.
4. Results and Discussion
There are many analytical or numerical methods with which to analyze the gas–liquid two-phase flow in a vapor chamber. Prasher et al. [29] proposed a simplified thermal resistance network model based on heat conduction to evaluate the heat transfer capability of heat pipes and vapor chambers in various configurations. Zuo et al. [30] analyzed the operation of heat pipes by building a thermal network consisting of various thermal elements, described the transient properties of heat pipes using first-order linear ordinary differential equations, and performed a thermal cycle analysis of the working mass. However, numerical methods are more reliable and accurate than analytical methods. Cao et al. [31] proposed a transient, two-dimensional, multiphase flow transient model based on cylindrical coordinates to directly solve mass and energy exchange across the liquid–vapor interface in a coupled manner. However, the use of direct coupling for solving detailed two-phase phenomena is relatively well established. Chen et al. [26] proposed a three-dimensional numerical model assuming that the evaporation and condensation of the work mass only occur at the interface of the vapor core/liquid zone–vapor zone. The mass, momentum, and energy equations are solved in a decoupled manner. The numerical method [26,31] is more reliable and accurate as compared to the analytical method [28,29]. However, the numerical method proposed by Chen et al. takes much less time as compared to the direct coupled solution numerical method [31] and so was used in this study. Moreover, its efficiency and effectiveness were verified in other studies [32,33]. The numerical simulations were processed using the ANSYS software on a Dell computer running Windows 10 (64-bit), which was equipped with 16 GB RAM and an Intel (R) Core (TM) i7-11700U processor with clock frequency 2.5 GHz.
The leaf vein distribution plays a decisive role in nutrient transport in leaves. However, the influence of parameters such as structure type, fractal grade, and fractal angle in the study of the structural parameters of leaf vein bionic vapor chambers remains to be elucidated [25,34]. For example, the experiments of Luo et al. [34] only investigated heat transfer performance and its effect on internal flow properties was not explored. Moreover, Wang et al. [25] carried out a study on the suction core, but not the whole vapor chamber. Thus, it is not clear which groove parameters with leaf vein characteristics have an effect on the vapor chamber. This gap in the research was the main motivation for this study.
4.1. Influence of Groove Parameters on Heat Transfer Performance
The temperature distribution at the center of the condensation end of the absorber core (Z = 4.25 mm) for a heat flow density of 8 × 10⁵ W/m2 with different groove parameters is shown in Figure 8. The temperature distribution in the absorbent core area of the bionic plate was similar for different groove parameters: the highest temperature was located near the center of the heat source (①) and the lowest temperature was located away from the heat source (③). The lowest temperature at the condensing surface increased with increasing N and γ, and the highest temperature at the condensing surface reversed. The lowest temperature at the condensing surface remained almost constant with increasing D, and the highest temperature at the condensing surface increased slightly.
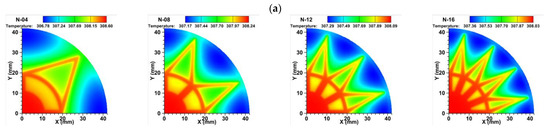
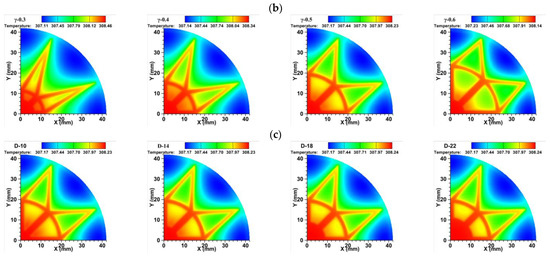
Figure 8.
Temperature distribution of vapor chamber with different groove parameters at the center section of the suction core at the condensing end (Z = 4.25 mm), q = 80 W/cm2: (a) ; (b) ; (c) .
The maximum temperature difference at the condensing surface is shown in Figure 9a–c, which decreased as N and γ increased, i.e., the homogeneity exhibited a better trend, and decreased as D increased, i.e., the homogeneity exhibited a slight downward trend. This is because when N and γ increased, region ① remained the same, and region ② increased and region ③ decreased accordingly, providing more flow channels for the diffusion of steam and enabling faster diffusion and condensation. When D increased, region ① increased, enabling faster generation of steam, and regions ② and ③ decreased accordingly, providing fewer channels for the diffusion of steam. The thermal resistance is shown in Figure 9d–f, decreasing as D, N, and γ increased. This is because the maximum temperature at the heat source decreased as D, N, and γ increased, and relatively little change was observed in the average temperature at the condensing surface with this. From a heat transfer point of view, it seems that the larger the groove parameters, the better the thermal performance of the bionic vapor chamber. However, if they are too large, the absorption core can disappear. Obviously, this was not the expected situation. The thermal performance of the bionic vapor chamber was shown to be more sensitive to changes in N and γ than to changes in D.
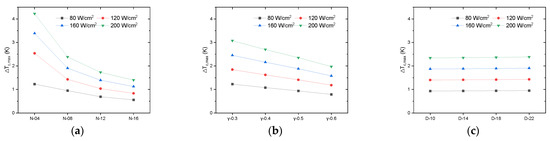
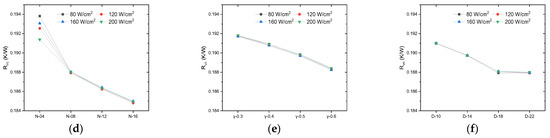
Figure 9.
Temperature difference and thermal resistance of vapor chambers for different groove parameters. (a) ∆Tc,max vs. (b) ∆Tc,max vs. (c) ∆Tc,max vs. (d) Rvc vs. (e) Rvc vs. (f) Rvc vs. .
4.2. Influence of Groove Parameters on Fluid Velocity
Figure 10 shows the velocity and flow path distribution of the liquid at the XY transverse section of the condensate surface suction core and at the YZ longitudinal section of the suction core for different groove parameters. In the central section of the condensate core (Z = 4.25 mm), the condensate flowed in two streams: one stream flowed from the center outwards and the other stream flowed from the periphery towards the center. Two condensate liquids converged in the liquid evaporation convergence area (region ①) and the support body and condensate liquid capillary reflux of the suction core area (region ③) at the junction of the concentrated convergence, and then at the junction of the longitudinal direction of flow, as shown in the figure at the longitudinal YZ cross-section (X = 5 mm), from the condensing surface suction core returned to the evaporating surface suction core. Then, the evaporating surface suction core liquid finally converged in the evaporating surface suction core in region ① and the junction of area ① and area ③, where the maximum velocity of the liquid (Vl,ma) occurred. The maximum velocity (Vc,l,max) of the liquid in the condensate core was not distributed at the junction of zone ① and zone ③, but at the inner ring with a diameter of CF from the perimeter to the center. This is because, although both are necessary for all liquid flow in this direction, the inner ring is thinner in comparison. As N increased, Vc,l,max gradually increased in small increments, showing a change from a relatively continuous to a dispersed distribution at Vc,l,max. Furthermore, as γ increased, Vc,l,max gradually decreased in large increments, exhibiting a change from inward to outward expansion and an increase in area at Vc,l,max. As D increased, the junction between regions ① and ③ shifted from inward to outward expansion. As D increased, the junction between region ① and region ③ shifted from inward to outward expansion, but Vc,l,max fluctuated around 0.59 ± 0.1 mm/s and remained almost constant.
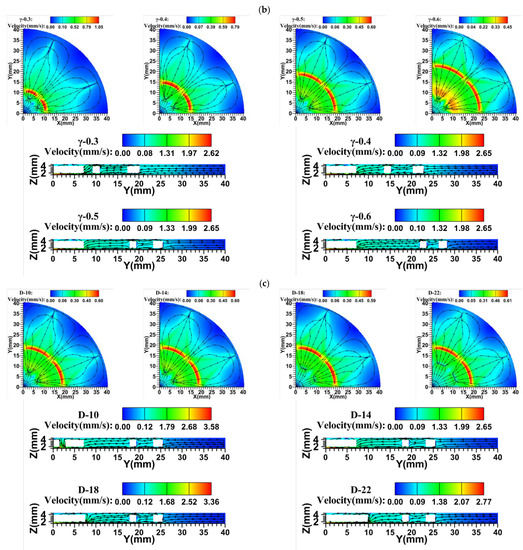
Figure 10.
Liquid velocity distribution in vapor chamber with different groove parameters at the center section of the suction core at the condensing end (Z = 4.25 mm), q = 80 W/cm2: (a) ; (b) ; (c) .
As shown in Figure 11, the liquid maximum velocity (Vl,max) increased as N and γ increased and decreased with increasing D. The liquid maximum velocity (Vl,max) was more sensitive to changes in N relative to γ. The increase in N and γ resulted in a smaller volume of the suction core area (region ③), which was located in the support body and the capillary reflux of condensed liquid. Furthermore, an increased competition for liquid during reflux was observed, hence an increase in the maximum liquid velocity (Vl,max). In addition, the increase in N made the section located at the junction of zone ① and zone ③ thinner, which is another reason for the increase in the maximum velocity of the liquid (Vl,max). As a result of the increase in D, although the volume of the suction core area was smaller (area ③), i.e., where the support body and the condensed liquid capillary return were located, the section of junction between area ① and area ③ was wider and less thin, resulting in less competition for the liquid during the return flow and, therefore, a decrease in the maximum liquid velocity (Vl,max).
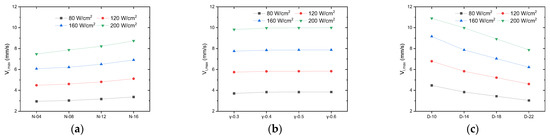
Figure 11.
Maximum liquid velocity of the vapor chamber for different groove parameters, q = 80 ~200 W/cm2. (a) Vl,max vs. (b) Vl,max vs. (c) Vl,max vs. .
4.3. Effect of Groove Parameters on Steam Velocity
Figure 12 shows the velocity and flow path distribution in the vapor zone at the XY transverse section (Z = 3 mm) and at the longitudinal YZ section (X = 0 mm) for different flute parameters. The vapor velocity distributions were very similar for the different flute parameters, with the liquid mass evaporating to a gaseous state in zone 1 in the presence of a heat source, and the vapor then diffusing outwards through zone 2 to the gas–liquid interface region. The vapor velocity was lower in zone 1, near the heat source, due to the different flow directions of the vapor. It then accelerated along each groove vapor diffusion zone to reach its maximum velocity, after which the vapor began to decelerate and reached the end of the vapor diffusion zone, where the vapor velocity gradually decreased to a minimum due to competition from the different flow directions and space constraints. A portion of the vapor flowed towards the upper condensate wick and the edge of the lateral condensate wick, while the other portion flowed towards the edge of the lower evaporative wick. As N and D increased, the maximum velocity shifted around the second half of the Y-groove structure’s confluent backbone. As γ increased, the position of the maximum velocity shifted from the diverging branch of the Y-groove structure to the confluent backbone.
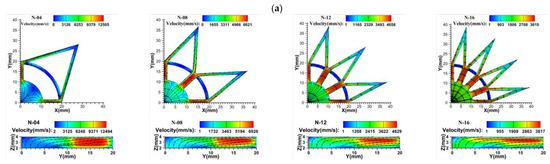
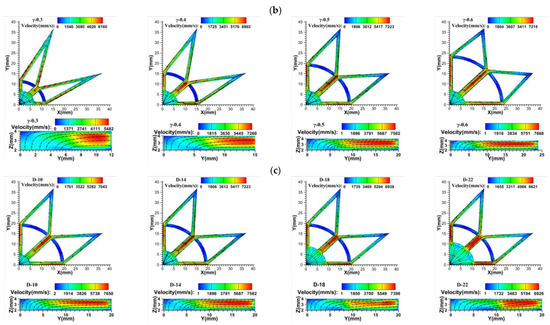
Figure 12.
Vapor velocity distribution of vapor chamber with different groove parameters at the central section of the steam zone (Z = 3 mm), q = 80 W/cm2: (a) ; (b) ; (c) .
As shown in Figure 13, the maximum vapor velocity (Vv,max) decreased as N and D increased. This is because as N and D increased, there was a common feature: the vapor velocity in the liquid evaporation sink area (region ①) decreased as shown in Figure 8a,c. As N increased, the vapor diffusion area (area ②) increased, and vapor diffused from the liquid evaporation sink area (area ①) to the surrounding area at a faster rate. As D increased, the volume of the liquid evaporation sink area (area ①) increased, and the volume of the concentrated vapor production area increased. As a result, the increase in both N and D weakened the vapor competition, leading to a decrease in the maximum vapor velocity (Vv,max). However, the steam velocity was more sensitive to an increase in N than to an increase in D. The maximum steam velocity (Vv,max) increased with increases. This was due to the fact that the larger the Y-groove structure, the longer the main steam channel, making the transition to steam diversion slower. This earlier diversion reduced the steam flow rate.
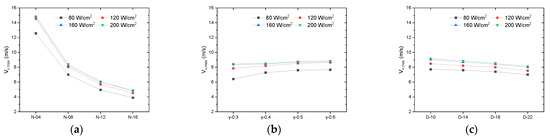
Figure 13.
Maximum steam velocity of the vapor chamber for different groove parameters, q = 80 ~200 W/cm2. (a) Vv,max vs. (b) Vv,max vs. (c) Vv,max vs. .
4.4. Influence of Groove Parameters on Pressure
Figure 14 shows the pressure distribution of the vapor chamber with an N of 8, a γ of 0.5, and a D of 14 mm.
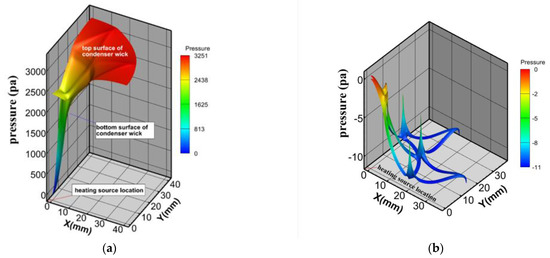
Figure 14.
Liquid and vapor pressure distribution diagram for a typical homogeneous heating plate, q = 80 W/cm2. (a) Liquid pressure distribution diagram; (b) vapor pressure distribution diagram.
In Figure 14a, it can be seen that the minimum liquid pressure in the area of the suction core occurred in the liquid evaporation sink area near the heat source (area ①). For the evaporative end suction core, the pressure gradient only decreased along the edge of the suction core towards the central region ①. At the condensing end, the pressure gradient divided into two parts: the first part decreasing from the edge of the condensing end towards the outer edge of zone ①, and the second part decreasing from the inner edge of zone ①. However, it is clear to see that the pressure drop inside the suction core outside zone ① was much greater than the pressure drop inside zone ①. These pressure distributions are consistent with the distribution of the liquid flow field and the flow lines in Figure 6, and the areas of higher flow velocity correspond to the areas of greater pressure variation. In Figure 14b, it can be seen that the minimum pressure in the vapor zone was located at the end of the Y-groove near the lateral suction core, while the maximum pressure occurred at the lower surface of the suction core at the condensing end, directly above the heat source. It can also be seen from the graph that there was a significant jump in pressure values for the vapor at the start of the main stem and at the diversion in the Y-groove area, which is attributed to the resistance created in the nongrooved area and the wall area of the evaporative end of the suction core. The pressure drop in the vapor zone was small as compared to the value of the liquid pressure drop. This shows that the liquid pressure drop dominated the total pressure drop.
Figure 15 shows that the of the vapor chamber for different groove parameters increased with N and D. In particular, D increased almost linearly and rapidly. This was due to the fact that the total volume of the suction core and the reflux area became smaller, which led to a higher pressure drop. As increased, gradually decreased in small increments. This was because, as increased, although the total volume of the suction core and the return area became smaller, the pressure drop increased, and the gradual decrease in Vc,l,max led to a corresponding decrease in the pressure drop. As compared to , was more sensitive to changes in N and D.
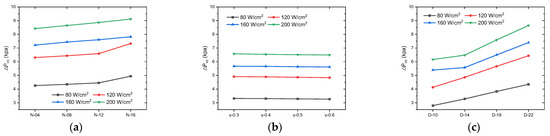
Figure 15.
Effect of different groove parameters on the total pressure drop across the vapor chamber, q = 80~200 W/cm2. (a) (b) (c) vs. Ds.
5. Conclusions
In this study, the effects of the groove parameters on the heat transfer characteristics and fluid flow properties of the vapor chamber were analyzed using CFD simulations, and the accuracy of the model was verified in conjunction with the literature. The groove parameters of the studied absorption cores include the number of groove (N), the ratio of the inner and outer circle diameters (γ), and the central groove diameter (D). The combined conclusions are as follows:
Firstly, as compared to the conventional vapor chamber, the maximum temperature difference at the condensing surface was reduced by approximately 50%, implying better temperature homogeneity.
Secondly, overall, the heat and mass transfer performance of the vapor chamber was better as parameter γ increased. Furthermore, variations in parameters N and D had competing effects on the performance of the vapor chamber, with larger parameter values improving the heat transfer performance of the vapor chamber, while smaller parameter values reducing the flow pressure drop of the liquid.
Thirdly, the thermal properties of the bionic vapor chamber were more sensitive to changes in N and γ than to changes in D. As compared to , was more sensitive to changes in N and D.
Fourthly, the maximum velocity of the liquid (Vl,max) increased with N and γ, and vice versa for D. The maximum vapor velocity (Vv,max) decreased as N and D increased and vice versa for γ.
Finally, we investigated integrated heat dissipation in electronic chips under continuous high-intensity operation, which ensures their stable operation. Herein, a novel bionic vapor chamber with a composite structure of leaf vein grooves is proposed. This field is of particular interest as a result of the wide range of potential applications, in medicine [35], chemistry [36], and micro- and nanofluidics [37,38], etc. Moreover, the results of this paper can provide a reference for the development of high-precision thermal dissipation modules for avionic components.
Author Contributions
Conceptualization, S.Z.; validation, H.C.; supervision, Y.L.; funding acquisition, Z.Z. All authors have read and agreed to the published version of the manuscript.
Funding
This research received no external funding.
Institutional Review Board Statement
Not applicable.
Informed Consent Statement
Not applicable.
Data Availability Statement
All data generated or analyzed during this study are included in this published article.
Conflicts of Interest
The authors declare no conflict of interest.
References
- Saber, H.H.; Hajiah, A.E.; Alshehri, S.A. Sustainable Self-Cooling Framework for Cooling Computer Chip Hotspots Using Thermoelectric Modules. Sustainability 2021, 13, 12522. [Google Scholar] [CrossRef]
- Zhang, Z.; Wang, X.; Yan, Y. A review of the state-of-the-art in electronic cooling. e-Prime 2021, 1, 100009. [Google Scholar] [CrossRef]
- Kandlikar, S.G.; Bapat, A.V. Evaluation of Jet Impingement, Spray and Microchannel Chip Cooling Options for High Heat Flux Removal. Heat Transf. Eng. 2007, 28, 911–923. [Google Scholar] [CrossRef]
- Li, J.; Zhang, X.; Zhou, C.; Zheng, J.; Ge, D.; Zhu, W. New Applications of an Automated System for High-Power LEDs. IEEE/ASME Trans. Mechatron. 2016, 21, 1035–1042. [Google Scholar] [CrossRef]
- Gandolfi, R.; Ribeiro, L.; Oliveira, J.; Paiva, K.; Mantelli, M. Passive Heat Exchange System for Aircraft Equipment Cooling Applications. In SAE Technical Paper Series; SAE: Detroit, MI, USA, 2015. [Google Scholar]
- Raj, C.R.; Suresh, S.; Singh, V.K.; Bhavsar, R.R.; C, M.V.; Vasudevan, S.; Archita, V. Experimental investigation on nanoalloy enhanced layered perovskite PCM tamped in a tapered triangular heat sink for satellite avionics thermal management. Int. J. Therm. Sci. 2021, 167, 107007. [Google Scholar] [CrossRef]
- Abo-Zahhad, E.M.; Ghenai, C.; Radwan, A.; Abdelrehim, O.; Salem, M.S.; Elmarghany, M.R.; Khater, A.; Shouman, M.A. A Micro-Metal Inserts Based Microchannel Heat Sink for Thermal Management of Densely Packed Semiconductor Systems. Sustainability 2022, 14, 14182. [Google Scholar] [CrossRef]
- Chen, Y.; Li, B.; Wang, X.; Yan, Y.; Wang, Y.; Qi, F. Investigation of heat transfer and thermal stresses of novel thermal management system integrated with vapour chamber for IGBT power module. Therm. Sci. Eng. Prog. 2019, 10, 73–81. [Google Scholar] [CrossRef]
- Hwang, G.S.; Fleming, E.; Carne, B.; Sharratt, S.; Nam, Y.; Dussinger, P.; Ju, Y.S.; Kaviany, M. Multi-artery heat-pipe spreader: Lateral liquid supply. Int. J. Heat Mass Transf. 2011, 54, 2334–2340. [Google Scholar] [CrossRef]
- Hwang, G.S.; Nam, Y.; Fleming, E.; Dussinger, P.; Ju, Y.S.; Kaviany, M. Multi-artery heat pipe spreader: Experiment. Int. J. Heat Mass Transf. 2010, 53, 2662–2669. [Google Scholar] [CrossRef]
- Min, D.H.; Hwang, G.S.; Kaviany, M. Multi-artery, heat-pipe spreader. Int. J. Heat Mass Transf. 2009, 52, 629–635. [Google Scholar] [CrossRef]
- Zhou, W.; Li, Y.; Chen, Z.; Deng, L.; Gan, Y. A novel ultra-thin flattened heat pipe with biporous spiral woven mesh wick for cooling electronic devices. Energy Convers. Manag. 2019, 180, 769–783. [Google Scholar] [CrossRef]
- Zhou, W.; Li, Y.; Chen, Z.; Deng, L.; Gan, Y. Ultra-thin flattened heat pipe with a novel band-shape spiral woven mesh wick for cooling smartphones. Int. J. Heat Mass Transf. 2020, 146, 118792. [Google Scholar] [CrossRef]
- Zhou, W.; Li, Y.; Chen, Z.; Deng, L.; Li, B. Experimental study on the heat transfer performance of ultra-thin flattened heat pipe with hybrid spiral woven mesh wick structure. Appl. Therm. Eng. 2020, 170, 115009. [Google Scholar] [CrossRef]
- Somasundaram, D.; Mani, A.; Kamaraj, M. Experimental investigation of thermal performance of metal foam wicked flat heat pipe. Exp. Therm. Fluid Sci. 2017, 82, 482–492. [Google Scholar] [CrossRef]
- Ji, X.; Xu, J.; Abanda, A.M. Copper foam based vapor chamber for high heat flux dissipation. Exp. Therm. Fluid Sci. 2012, 40, 93–102. [Google Scholar] [CrossRef]
- Chen, Y.-T.; Kang, S.-W.; Hung, Y.-H.; Huang, C.-H.; Chien, K.-C. Feasibility study of an aluminum vapor chamber with radial grooved and sintered powders wick structures. Appl. Therm. Eng. 2013, 51, 864–870. [Google Scholar] [CrossRef]
- Ju, Y.S.; Kaviany, M.; Nam, Y.; Sharratt, S.; Hwang, G.S.; Catton, I.; Fleming, E.; Dussinger, P. Planar vapor chamber with hybrid evaporator wicks for the thermal management of high-heat-flux and high-power optoelectronic devices. Int. J. Heat Mass Transf. 2013, 60, 163–169. [Google Scholar] [CrossRef]
- Deng, D.; Huang, Q.; Xie, Y.; Huang, X.; Chu, X. Thermal performance of composite porous vapor chambers with uniform radial grooves. Appl. Therm. Eng. 2017, 125, 1334–1344. [Google Scholar] [CrossRef]
- Wang, Q.-H.; Zhao, H.; Xu, Z.-J.; Li, J.-R.; Deng, D.-X. Numerical analysis on the thermal hydraulic performance of a composite porous vapor chamber with uniform radial grooves. Int. J. Heat Mass Transf. 2019, 142, 118458. [Google Scholar] [CrossRef]
- Liu, C.; Hu, D.; Li, Q.; Chen, X.; Zhang, Z.; Zhou, F. Vapor chamber with two-layer liquid supply evaporator wick for high-heat-flux devices. Appl. Therm. Eng. 2021, 190, 116803. [Google Scholar] [CrossRef]
- Weiwei, W.; Xinzhi, H.; Fuyun, Z.; Shuo, C.; Lei, W.; Yang, C.; Yueshuai, Z. The performance of vapor chamber based on leaf-vein-like structure for heat dissipation. Spacecr. Environ. Eng. 2021, 38, 138–147. [Google Scholar]
- Peng, Y.; Liu, W.; Liu, B.; Liu, J.; Huang, K.; Wang, L.; Chen, W. The performance of the novel vapor chamber based on the leaf vein system. Int. J. Heat Mass Transf. 2015, 86, 656–666. [Google Scholar] [CrossRef]
- Peng, Y.; Liu, W.; Wang, N.; Tian, Y.; Chen, X. A novel wick structure of vapor chamber based on the fractal architecture of leaf vein. Int. J. Heat Mass Transf. 2013, 63, 120–133. [Google Scholar] [CrossRef]
- Yonghui, W.; Qiang, H.; Hang, G. Research on crashworthiness of thin-walled tubes imitating lotus leaf vein. J. Jiangsu Univ. Sci. Technol. 2022, 1, 59–66. [Google Scholar]
- Chen, Y.S.; Chien, K.H.; Wang, C.C.; Hung, T.C.; Pei, B.S. A simplified transient three-dimensional model for estimating the thermal performance of the vapor chambers. Appl. Therm. Eng. 2006, 26, 2087–2094. [Google Scholar] [CrossRef]
- Koito, Y.; Imura, H.; Mochizuki, M.; Saito, Y.; Torii, S. Numerical analysis and experimental verification on thermal fluid phenomena in a vapor chamber. Appl. Therm. Eng. 2006, 26, 1669–1676. [Google Scholar] [CrossRef]
- Qingsong, H. Fabrication and Heat Transfer Performance of Vapor Chambers with Reentrant Porous Composite Wick. Master’s Thesis, Xiamen University, Xiamen, China, 2018. [Google Scholar]
- Prasher, R.S. A Simplified Conduction Based Modeling Scheme for Design Sensitivity Study of Thermal Solution Utilizing Heat Pipe and Vapor Chamber Technology. J. Electron. Packag. 2003, 125, 378–385. [Google Scholar] [CrossRef]
- Zuo, Z.J.; Faghri, A. A network thermodynamic analysis of the heat pipe. Int. J. Heat Mass Transf. 1998, 41, 1473–1484. [Google Scholar] [CrossRef]
- Cao, Y.; Faghri, A. Transient two-dimensional compressible analysis for high-temperature heat pipes with pulsed heat input. Numer. Heat Transf. Part A Appl. 1991, 18, 483–502. [Google Scholar] [CrossRef]
- Lu, L.; Xie, Y.; Zhang, F.; Liao, H.; Liu, X.; Tang, Y. Influence of a sintered central column on the thermal hydraulic performance of a vapor chamber: A numerical analysis. Appl. Therm. Eng. 2016, 103, 1176–1185. [Google Scholar] [CrossRef]
- Lu, L.; Liao, H.; Liu, X.; Tang, Y. Numerical analysis on thermal hydraulic performance of a flat plate heat pipe with wick column. Heat Mass Transf. 2015, 51, 1051–1059. [Google Scholar] [CrossRef]
- Luo, Y.; Liu, W.; Huang, G. Fabrication and experimental investigation of the bionic vapor chamber. Appl. Therm. Eng. 2020, 168, 114889. [Google Scholar] [CrossRef]
- Carminati, M.; Fiorini, C. Challenges for Microelectronics in Non-Invasive Medical Diagnostics. Sensors 2020, 20, 3636. [Google Scholar] [CrossRef] [PubMed]
- Kopp, M.U.; Luechinger, M.B.; Manz, A. Continuous Flow PCR on A Chip; Springer: Dordrecht, The Netherlands, 1998. [Google Scholar]
- Lim, A.E.; Lam, Y.C. Vertical Squeezing Route Taylor Flow with Angled Microchannel Junctions. Ind. Eng. Chem. Res. 2021, 60, 14307–14317. [Google Scholar] [CrossRef]
- An, E.L.; Lim, C.Y.; Lam, Y.C. Electroosmotic flow hysteresis for dissimilar ionic solutions. Biomicrofluidics 2015, 9, 024113. [Google Scholar]
Disclaimer/Publisher’s Note: The statements, opinions and data contained in all publications are solely those of the individual author(s) and contributor(s) and not of MDPI and/or the editor(s). MDPI and/or the editor(s) disclaim responsibility for any injury to people or property resulting from any ideas, methods, instructions or products referred to in the content. |
© 2023 by the authors. Licensee MDPI, Basel, Switzerland. This article is an open access article distributed under the terms and conditions of the Creative Commons Attribution (CC BY) license (https://creativecommons.org/licenses/by/4.0/).