Article

Improvement of Factory Transport Efficiency with Use of WiFi-Based Technique for Monitoring Industrial Vehicles

Faculty of Mechanical Engineering, Wroclaw University of Science and Technology, 50-370 Wroclaw, Poland
*
Author to whom correspondence should be addressed.
Sustainability 2023, 15(2), 1113; https://doi.org/10.3390/su15021113
Submission received: 3 November 2022 / Revised: 6 December 2022 / Accepted: 20 December 2022 / Published: 6 January 2023

Abstract

:
The in-factory transport influences production rate and quality, so it is characterized by the shortest displacement time and maximum utilization of available means of transport, accompanied by their lowest operating wear. In the paper, an improvement of factory transport management is suggested, employing the traffic analysis methods of industrial vehicles. The efficiency of internal logistics was analyzed with the use of the WiFi-based technique for monitoring industrial vehicles. In the research, the in-building location system Optimatik BI was used and implemented in a company manufacturing PVC profiles for the market of building materials and interior equipment. Stopping times of forklift trucks, their routes and covered distances were estimated. On this ground, factors of their effective use were calculated. Further, it was possible to analyze the traffic of the forklift trucks and to generate heat maps that, in turn, made it possible to identify problems and develop a suitable improvement plan. A mathematical model that allows for efficiency optimization by determining the best number of employees handling the transport was developed for one of the analyzed logistics tasks.

1. Introduction

The in-factory transport influences production rate and quality, so it should be characterized by possibly the shortest displacement time and maximum utilization of available means of transport, accompanied by their lowest operating wear. It should guarantee consistent safety and effective displacement of goods [1,2]. It is connected with the execution of all transport activities within the factory, begins at the moment of raw material admission and ends with the release of finished products. Most often, the means of factory transport are handcarts and motorized carts [3]. They are characterized by high flexibility, small occupied surface area and relatively low investment cost [4]. In most cases, factory transport requires precise organization adapted to the specificity of the manufacturing plant.
Effective use of the company resources (in this case, forklift trucks and their operators) directly influences the company’s financial condition, also deciding its position against competitors. An increase in efficiency, with no accompanying drop of quality, growth of labor utilization or costly investment in technique, is possible by identifying and eliminating losses. Therefore, it is necessary to monitor the efficiency of the production system in order to identify wastages and possible reserves. The research carried out on a sample of some Polish companies [5] showed that just 10% of them used lean manufacturing methods to eliminate needless transport. More, 18%, used the LM methods to reduce the squandering of the employees’ potential and 27% to minimize stock level. Most companies used the LM methods to reduce redundant traffic (41%) and shorten the time for awaiting material supply (49%).
This research work aims to evaluate the efficiency of internal logistics using WiFi-based techniques for monitoring industrial vehicles and develop a concept of improvement. The research was carried out on a selected manufacturing company via efficiency analysis of logistic processes followed by identification of the areas requiring improvements and sources of their reduced efficiency. From the company’s point of view, the practical purpose is to develop a proposal for improvements in factory transport to increase the utilization efficiency of industrial vehicles and their operators. An additional goal is to develop a mathematical model of an internal transport, that optimizes logistics processes. The application of the obtained model allows for better utilization of the resources (human, as well as forklift trucks) and leads to significant cost reduction. The research was executed with the use of the in-building location system Optimatik BI. The authors personally participated in the project. Figure 1 shows a model presenting the main stages of the system implementation.
The presented work includes:
Section 2: “Methods of traffic analysis”—characterization of traffic analysis methods, both traditional and computerized ones, as well as conclusions from literature studies;
Section 3: “Experimental work and used methods”—characterization of the used in-building location system and description of the case study—the analyzed manufacturing company and the examined logistic processes;
Section 4: “Results and discussion”—presentation of the research results, identification of the areas with reduced efficiency and sources of problems, development of a mathematical model of the logistics processes that supports the efficiency optimization, as well as presentation of the concept of improvements;
Section 5: “Conclusion”—summary of the work, presentation of conclusions from the carried out research work, a summary of the results in the context of the assumed purposes and further planned examinations.

2. Literature Review—Methods of Traffic Analysis

Among the traditional methods of traffic analysis, spaghetti diagrams and heat maps are distinguished. A spaghetti diagram displays movements of an object (vehicle, material, employee, etc.) in the observed system (plant, production area or part of a building) in the form of a line. The method is named after a tangle of lines representing the route of the watched object. It is used for watching the problems occurring in the processes where movements or transportation take place. It makes it possible to identify covered distances, numbers of movements, their overlapping and crossing, as well as their characteristic features. As a result, ineffective areas and movements can be identified and, in consequence, numbers of objects can be reduced and organizational changes of the work or the working space can be implemented [6,7].
Heat maps are used for graphic visualization of the information about numbers of locations or events in a set of data, as well as about the most important data areas. Numerical data are presented in different colors, where the most popular ones are blue, green and red (the lowest values are shown in dark blue and the highest values in bright red). Due to versatility, effectiveness and easiness of the presentation, heat maps make a popular tool used in many different fields, including factory transport, to imagine parking places of industrial vehicles [8,9].
Apart from the traditional methods, proprioceptive sensors (sensors of internal condition) are also applied for recording dynamic condition and measuring values (e.g., angular velocity or position of a wheel) from the level of the system [10,11]. Among proprioceptive sensors, distinguished are: inertia measurement units (IMU), inertial sensors (gyroscopes and magnetometers), encoders and positioning sensors (e.g., receivers of the Global Navigation Satellite System (GNSS)) [10]. An inertia measurement unit is a device calculating linear velocity, position and angular velocity with respect to the global reference system, usually by means of accelerometers, gyroscopes and magnetometers, with one for each of the orthogonal axes X, Y and Z. The main disadvantage of these types of devices is that they deliver information about the vehicle movement only, but its location requires another source of information, like the Global Positioning System (GPS). Encoders are electromechanical devices delivering data about position, direction and velocity in the control system from the vehicle mileage counter, for example, by fitting them to the vehicle’s wheels. The devices are relatively cheap and easy for implementing, but do not guarantee as high accuracy as other systems. Positioning sensors (e.g., GPS sensors) are receivers of the satellite system, acquiring information about geolocation and time, calculating the position on the trilateration principle. A condition of their operation is finding minimum four GPS satellites in undisturbed lines of view [12], which reduces their effectiveness in buildings (including production shops) [13].
In analysis of in-factory transport, IT systems are more and more often being used. Used are the techniques like BLE (Bluetooth Low Energy, beacon devices) [14,15,16], RFID (radio-frequency identification) [17,18,19,20] or RTLS (real-time locating systems) [21,22,23]. BLE is a technique using markers and beacon devices based on the Bluetooth standard, which makes it possible to obtain data about location through the cellular telephone network. RFID is a technique of automated identification that consists of recording digital data with use of radio waves. RTLS is a set of corporate class programs with a wide range of applications, including the possibility to localize mobile devices. In the comparative research carried out in [24], the BLE technique was determined as problematic in installation and relatively costly, and significant delays in data updating were found in RFID. RTLS requires installing the complete software. More and more often are WiFi-based techniques [25,26,27] being applied, supported by their feature of non-invasiveness, so there is no necessity to interfere in the infrastructure of a company or to use additional equipment (apart from the monitoring ones). These techniques are characterized by sufficiently high accuracy and relatively low cost [28]. Most papers in the transport improvement field with WiFi-based techniques have focused on public transport [28,29,30]. There is a lack of research that presents solutions for in-building monitoring, especially in production factories.
Optimization techniques are commonly used to improve efficiency and optimize production costs and logistics tasks. The proper assignment of tasks or the selection of the proper order of their execution may contribute to significant improvements in the company operation. Optimization tasks may be solved in an optimal way (when the problem complexity is small and exact algorithms are able to find a solution in an acceptable time) or an approximate way (consisting of finding a solution close to optimal, used in problems with high complexity). A lot of tasks in production and logistics may be solved optimally. In this case, mathematical models are created for the considered problems and ready-made tools (the so called ‘solvers’) are implemented to determine solutions.

3. Materials and Methods

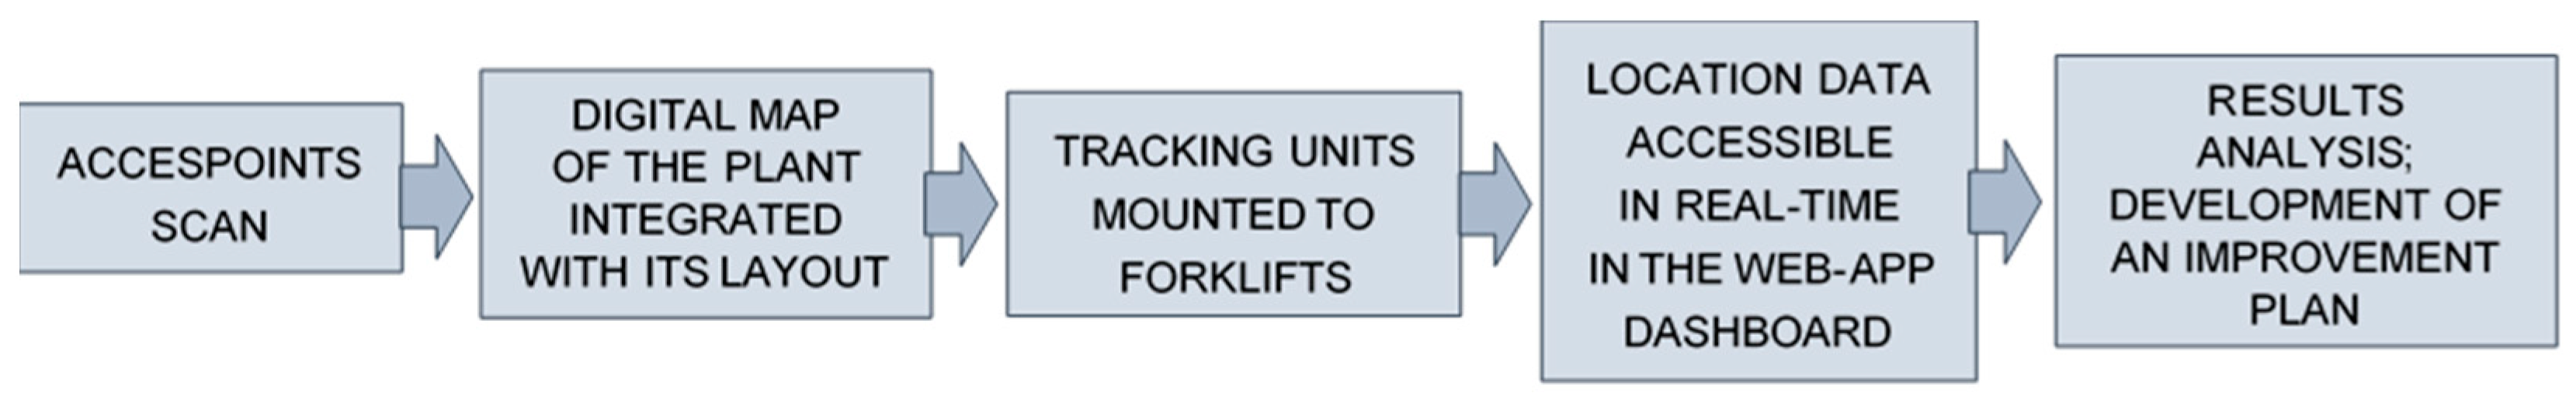
3.1. In-Building Location System

The research was carried out in collaboration with a Polish technological company delivering modern solutions for optimizing processes and vehicle fleets in intralogistics. Optimatik BI is a system of in-building location that makes it possible to obtain data about routes covered by vehicles (forklift type) and the operational efficiency of the fleet of industrial vehicles in a non-invasive way. The vehicle monitoring technique, based on investigating and analyzing changes in their location in the company, is an equivalent of the GPS system that cannot be used inside buildings because of interferences. In place of satellites, it uses all the neighboring devices emitting a wireless WiFi network. To improve accuracy of location, the monitoring devices are equipped with the IMU system, delivering information about accelerations acting on the vehicle and its employed rotational speed. When localizers are placed on each of the monitored vehicles, the system makes it possible to obtain, both in real mode and in historical mode, accurate data about the current locations of the vehicles and their covered routes. This information is currently made accessible through the website and by a dedicated mobile application.
The system is implemented in three steps. Firstly, a map of networks accessible in the building is prepared, with use of the workshop layout and a single localizer. When the device is displaced, its successive positions are recorded on the map. This way, a database is built of WiFi networks accessible in a given place, unambiguously identified by the MAC (media access control) address of the transmitter and the RSSI (received signal strength indication) value of each signal. Next, the built map is integrated with reality, necessary corrections are introduced and additional zones are created in order to obtain more precise information. The last step is an installation of the localizers on the vehicles to be monitored. On the grounds of the data acquired during building the map and their comparison with the current reading, the position of the moving vehicle equipped with monitoring devices is estimated. The data (accessible through a web browser or a mobile application) include:
distances covered by vehicles,
spaghetti diagrams for individual devices,
times and parking places for individual vehicles,
heat maps,
effective use factors of individual vehicles,
numbers of specific events (e.g., stoppages).
On the grounds of the obtained data, the company can do the following:
reduce the vehicle fleet with their maintained capacity,
increase productivity of the staff,
develop more efficient routs of vehicle displacement,
gain a basis for updating the layout,
increase effective use factors of the vehicles.
Usage of this kind in-building location system based on the WiFi technique is a phase in a company’s development towards Industry 4.0. The information acquired by the sensors makes it possible to build a database, regarded as the crucial aspect of effective forecasting that brings added value in the field of logistics [31,32].

3.2. Case Study

Examinations were executed on the example of a company defined as one of the most innovative manufacturers in the Polish furniture industry. The company offers a wide line of products with interchangeable modules and functions, stimulating development. All of its brands are based on the human touch idea.
The research examined the storage-related transport in the manufacturing of PVC profiles for the building materials and interior equipment market. This transport includes, first of all, transporting goods connected with their acceptance and release, as well as moving them in order to place them in warehouses and storehouses. For these tasks, five employees are assigned in each work shift. Each employee has a terminal equipped with a barcode scanner and a gas (LPG)-powered forklift at their disposal.
The analysis was carried out on the ground of the nearly one-month observation of the logistic process (in a period of time representative for the analyzed process, selected by the company). To that end, a monitoring device equipped with the Optimatik BI system was installed on each forklift truck. This made it possible to generate spaghetti diagrams and heat maps, as well as to read out stoppage times and effective use factors of the vehicles. Within the observation, three main logistic tasks of the operators were distinguished (Figure 2):
(1)
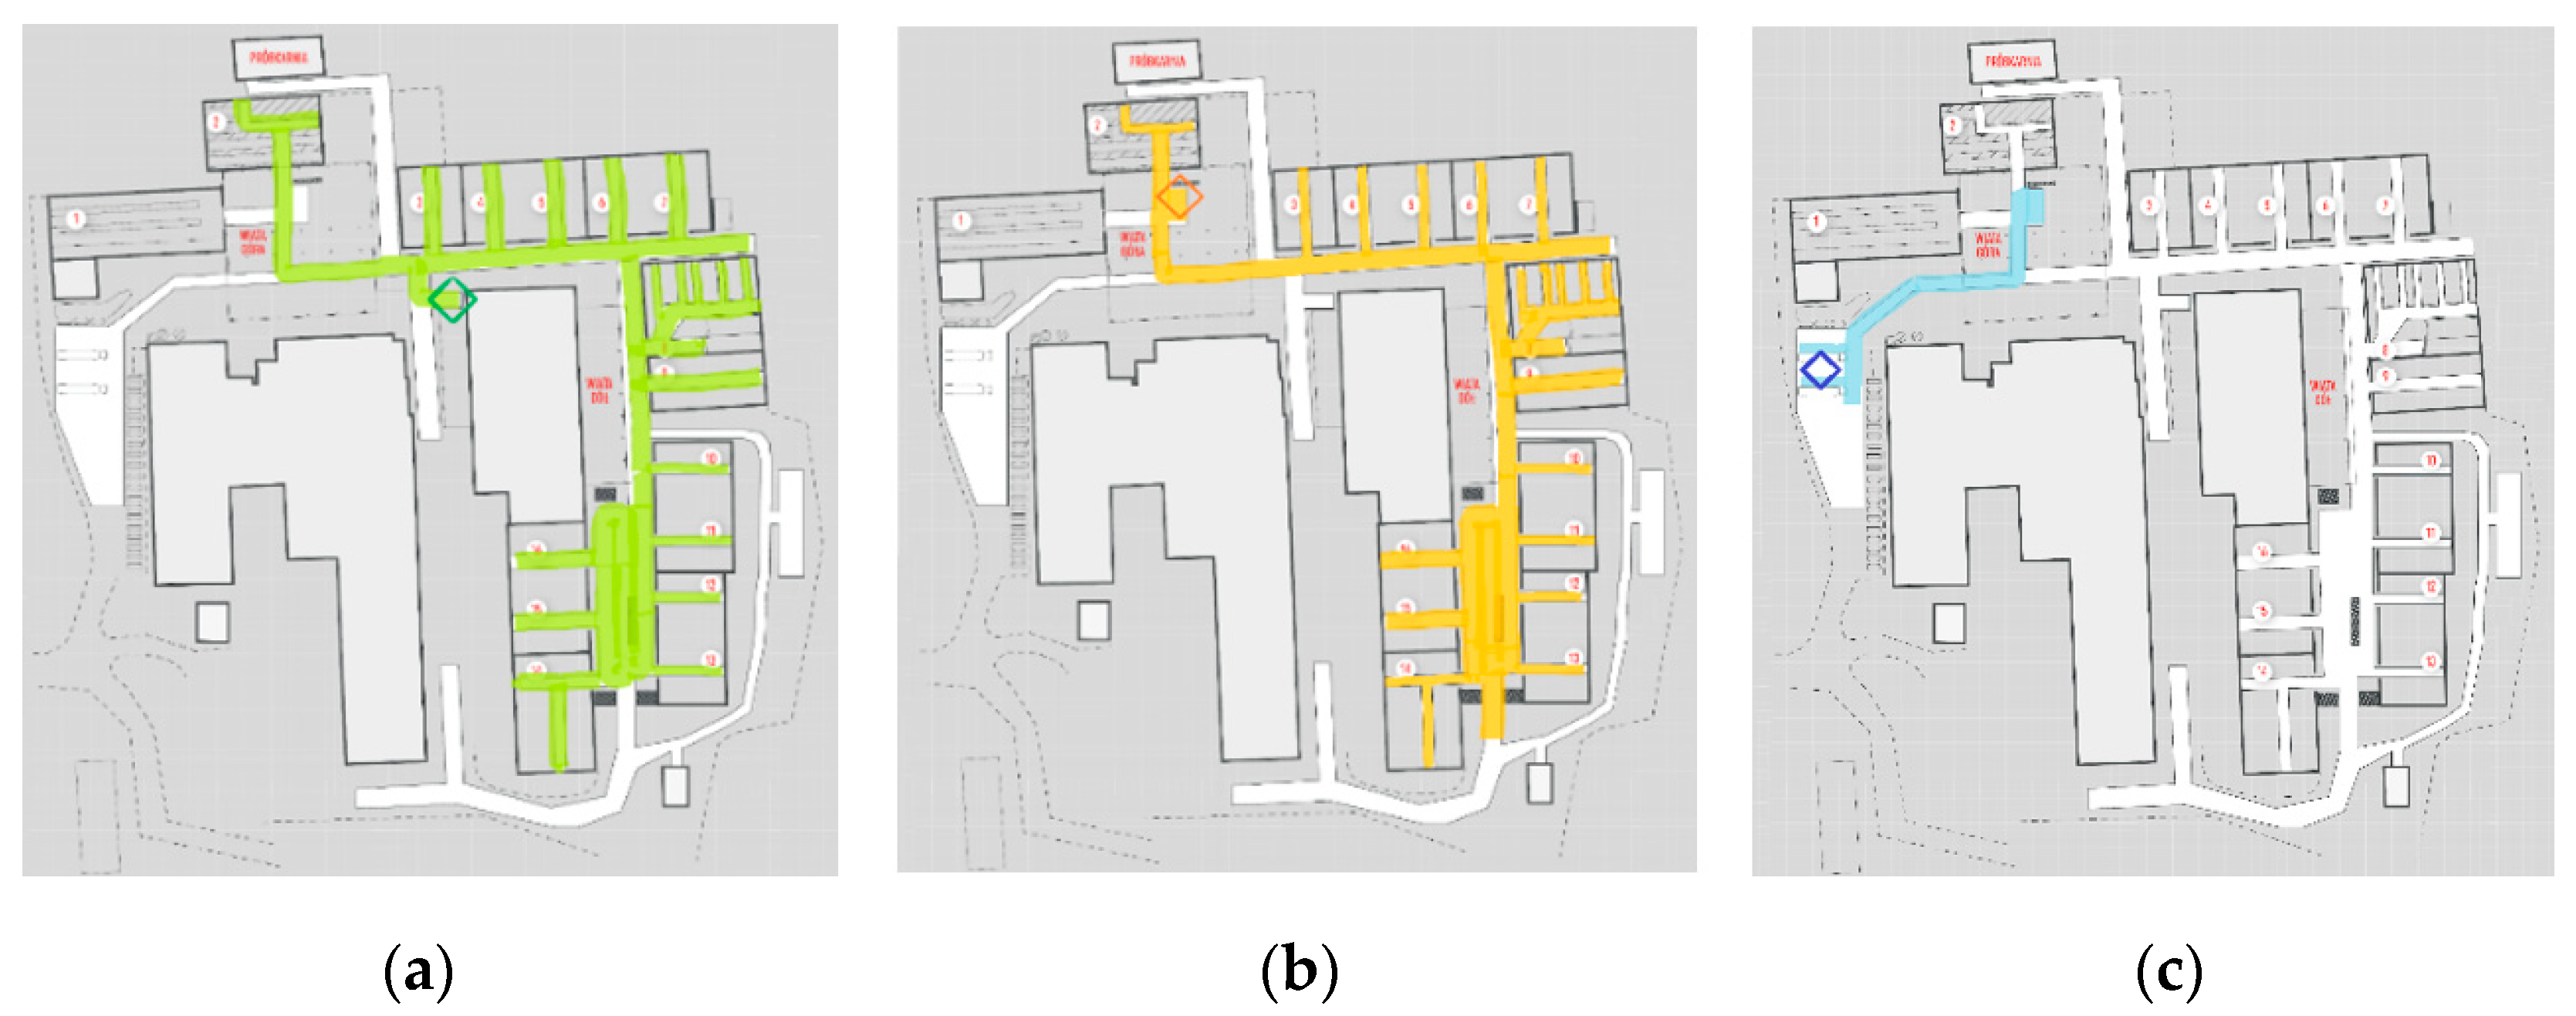
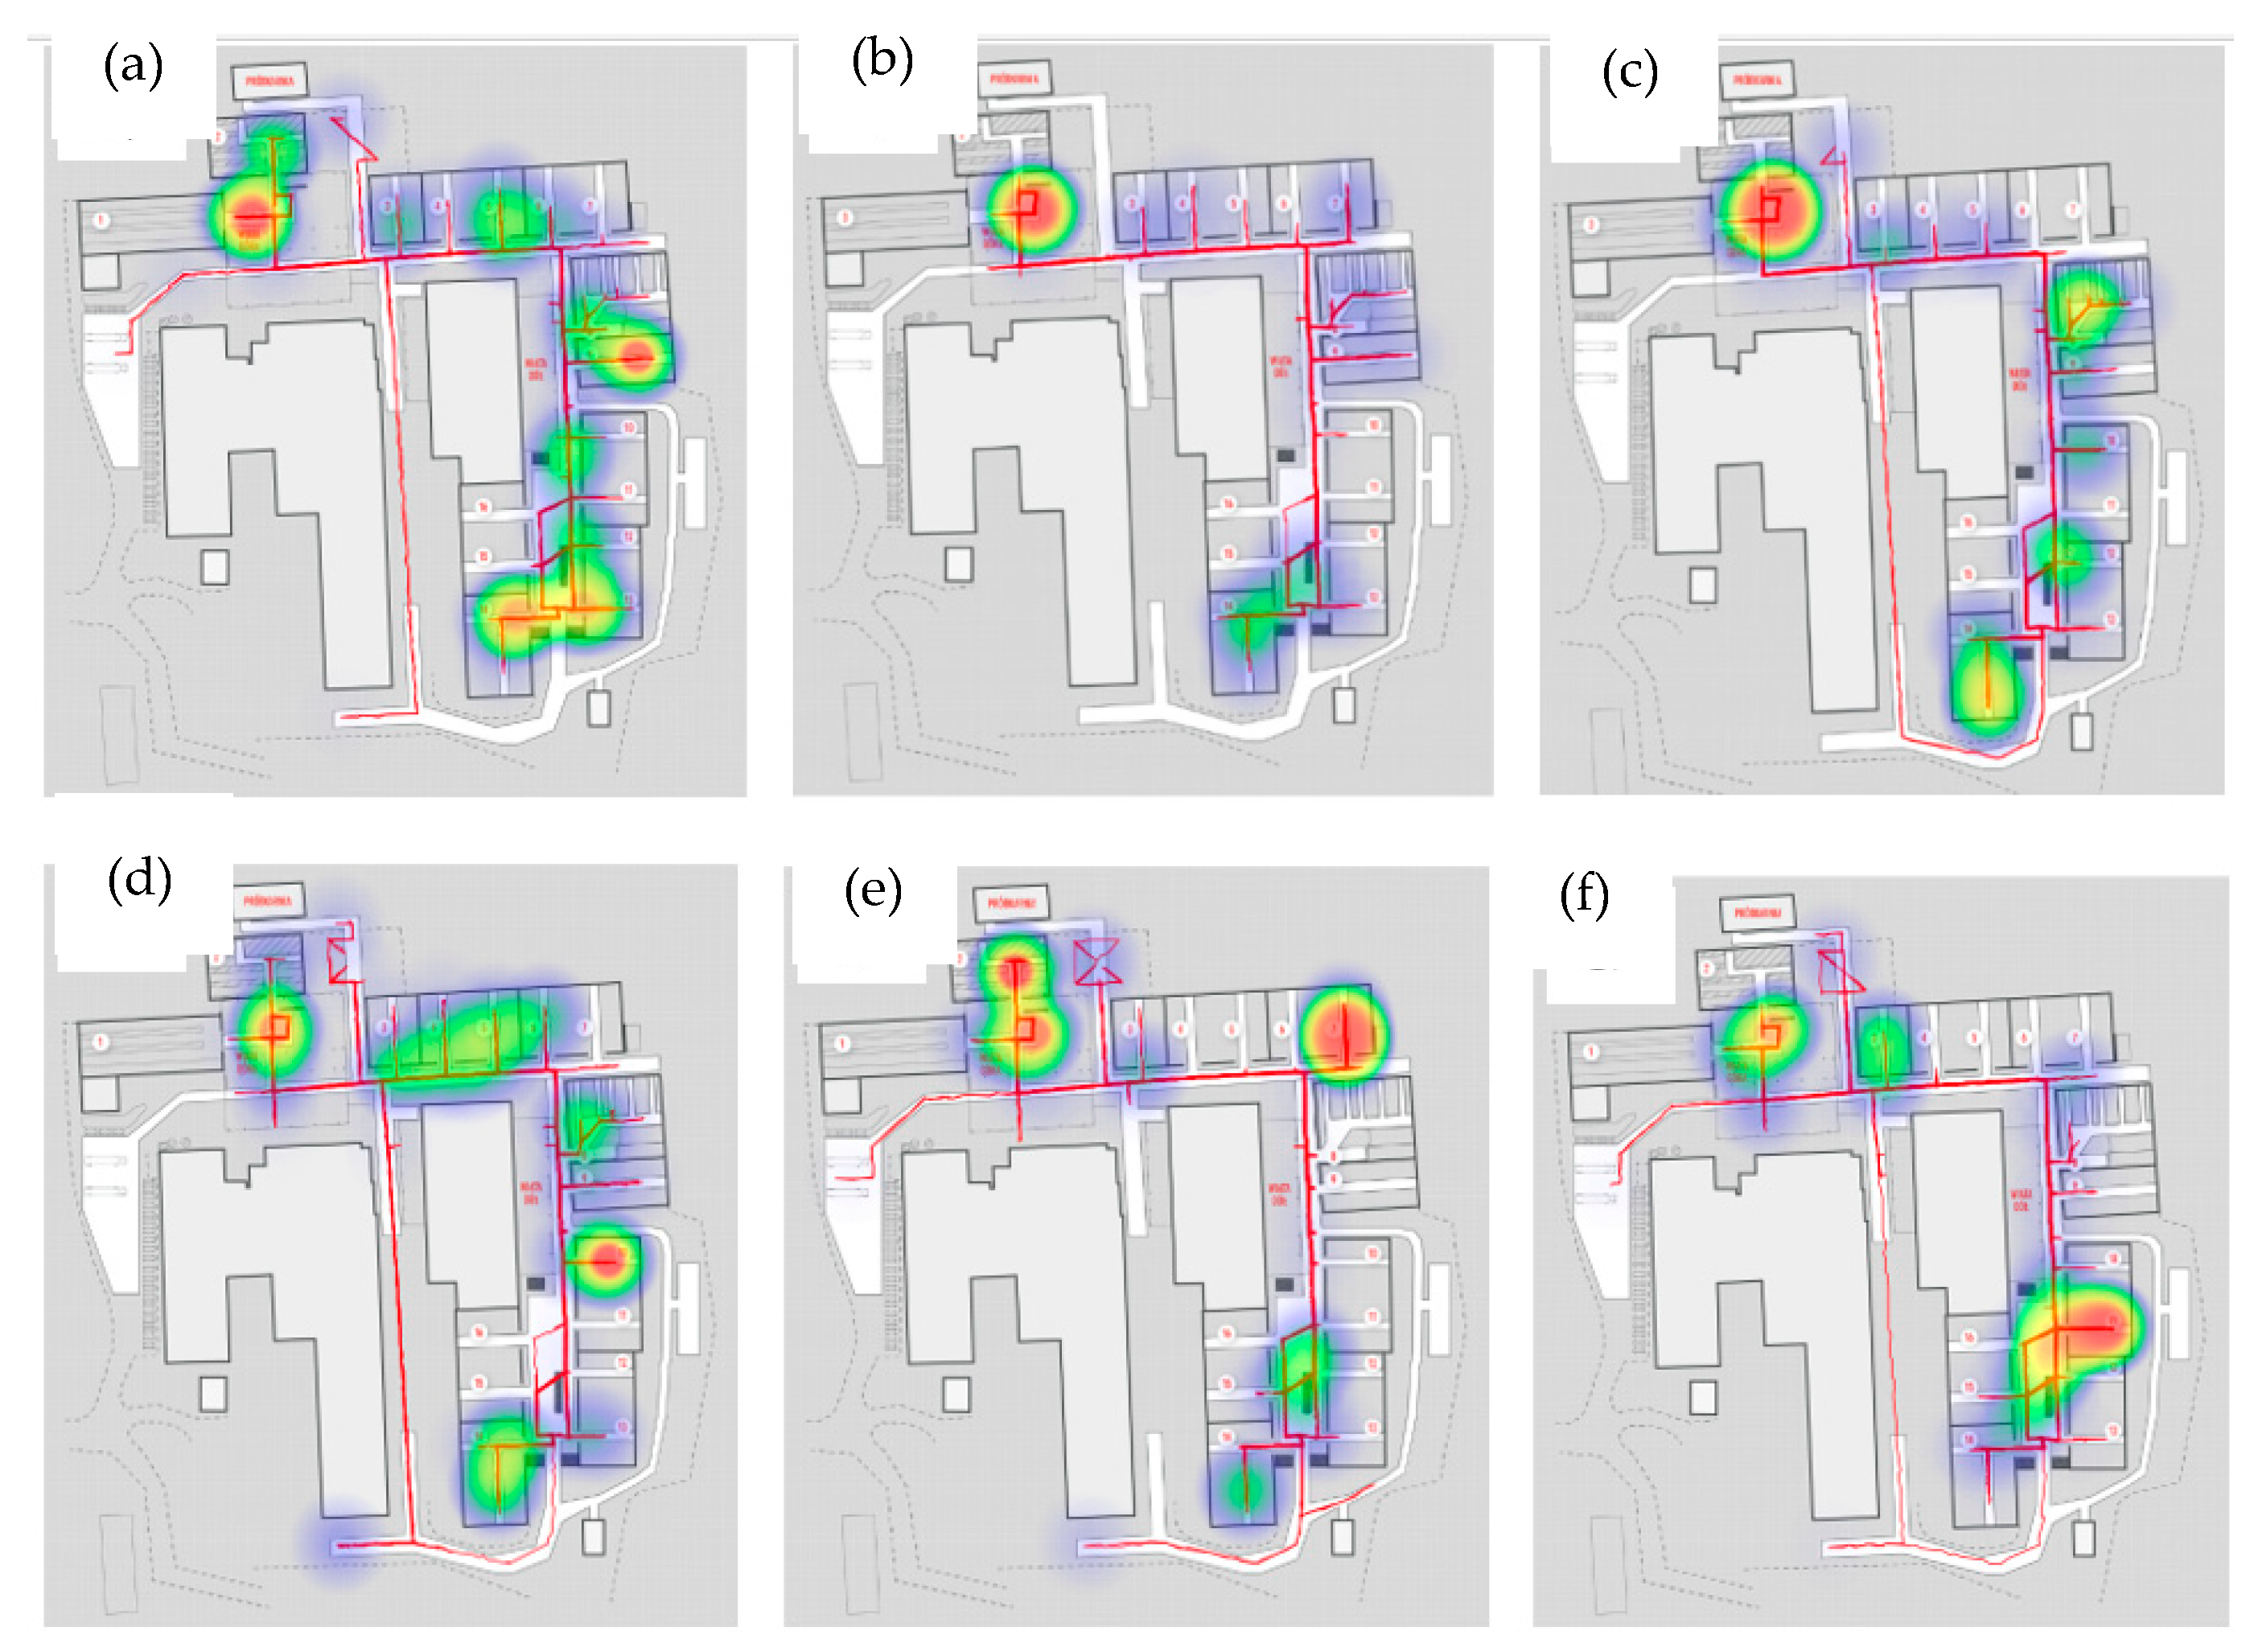
Production-to-warehouse transport (Figure 2a)—receipt of finished products from the intermediate storage area, moving them to a proper warehouse and placing them on storage shelves in the way suitable for their convenient future reception.
(2)
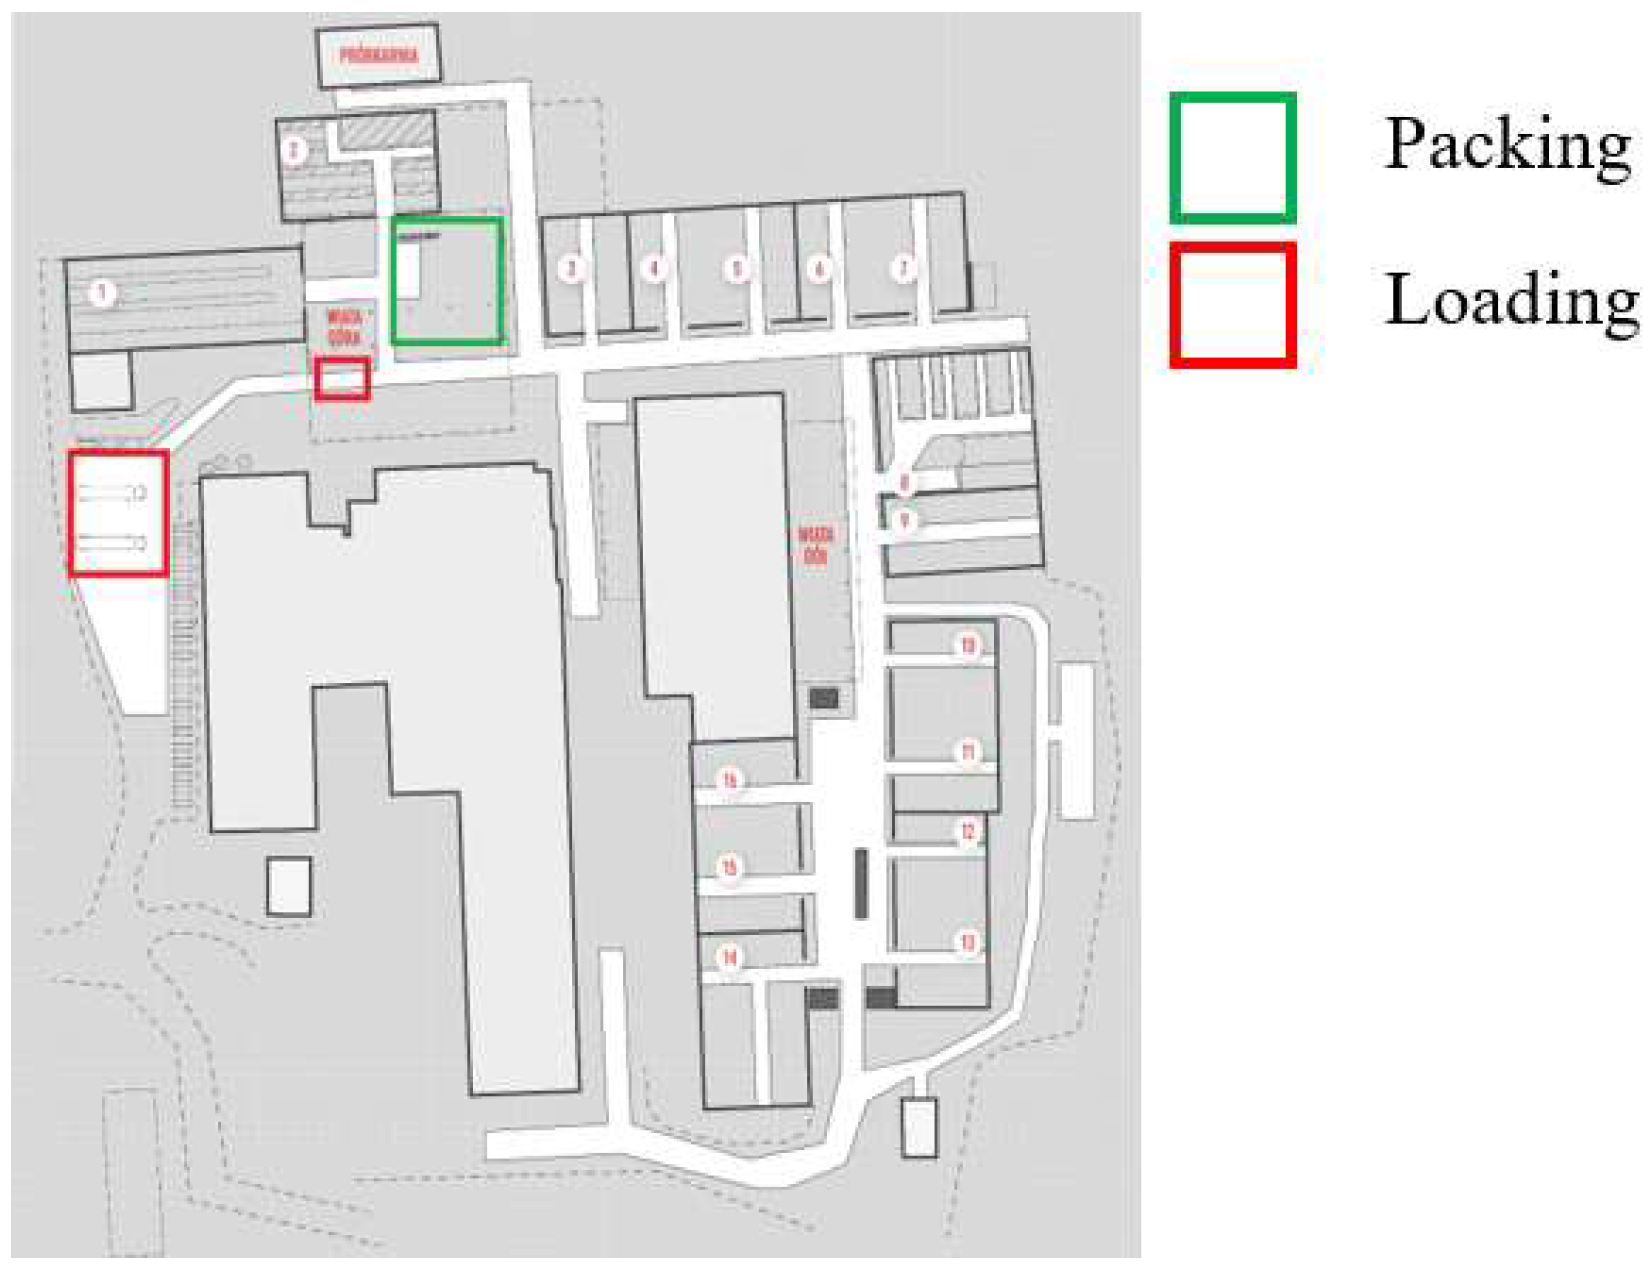
Warehouse-to-packing transport (Figure 2b)—picking an order, moving it to the packing zone and preparation for loading by properly securing the goods.
(3)
Packing-to-loading transport (Figure 2c)—moving the load from the packing zone to the loading area and its placing on a truck.
Figure 2. Transport tasks: (a) production–warehouse; (b) warehouse–packing; (c) packing–loading. Unloading place is marked with a rhombus.
Sustainability 15 01113 g002

4. Results and Discussion

4.1. Production-To-Warehouse Transport

The heat maps generated by the monitoring devices showed the following:
long time spent by vehicles in warehouse No. 2 (Figure 3a,b);
longtime spent by vehicles in warehouse No. 8 (Figure 3b);
long-lasting parking under the zone “upper shelter” (Figure 3b).
Figure 3. Heat maps for the transport task production–warehouse for 2 representative days.
Sustainability 15 01113 g003
The long-lasting stay in warehouse 8 resulted from the manufacture of a large number of the finished products stored exclusively in zone 8. The stay under the zone “upper shelter” was caused by the transport task packing–loading. The problem of the groundless, long-lasting stay in warehouse 2 was recognized and subjected to further analysis. It appeared that finished products could not be unloaded in the warehouse fluently and quickly due to insufficient space and the poor way in which finished products were stored. Consequently, the forklift operator was, each time, compelled to arrange space for a new load by putting the warehouse in order. Knowing the activity and inactivity times of the forklift, it was possible to determine the percentage of its effective use during its stay in the warehouse. The data collected from the system showed that the operator used as much as about 70% of its work in the analyzed area for unscheduled additional activities, which resulted in:
accumulation of a large number of finished products on the intermediate storage area in front of the production workshop,
missing fluidity of the logistic process,
unnecessary traffic and transport resulting from the necessity of frequent han-dling with the load and its displacement in order to arrange sufficient space in the warehouse.
In order to reduce the losses resulting from incorrect organization and inefficient use of the accessible storage area, the following improvements were suggested:
implementation of the 5S method (elimination of unnecessary elements from the route, marking the storage places of individual finished products and putting the warehouse in order would permit the forklift to move freely over the storage area);
rationalization of the storage area according to the ABC analysis (classification of the stored elements with regard to frequency of their picking and releasing would make it possible to identify fast moving goods, to get easy access to the goods most of-ten picked-up, to minimize the stock and increase the storage area, as well as to reduce the order-picking time);
extension of the existing warehouse or adding a new one (Figure 4);
application of an entresol or storage platforms (using whole height of the warehouse with no additional costs, easy for installing and removing);
introduction of the Warehouse Management System (a tool acquiring data about warehouse inventories, quantities and kinds of stored goods, as well as their shelf lives would make it possible to locate goods and indicate a free storage room quickly, thus automating the store-keeper work and eliminating human errors in the process).
Because of insufficient area of the neighboring warehouses, it would be impossible to relocate a part of products without disturbing the existing organization of the company.

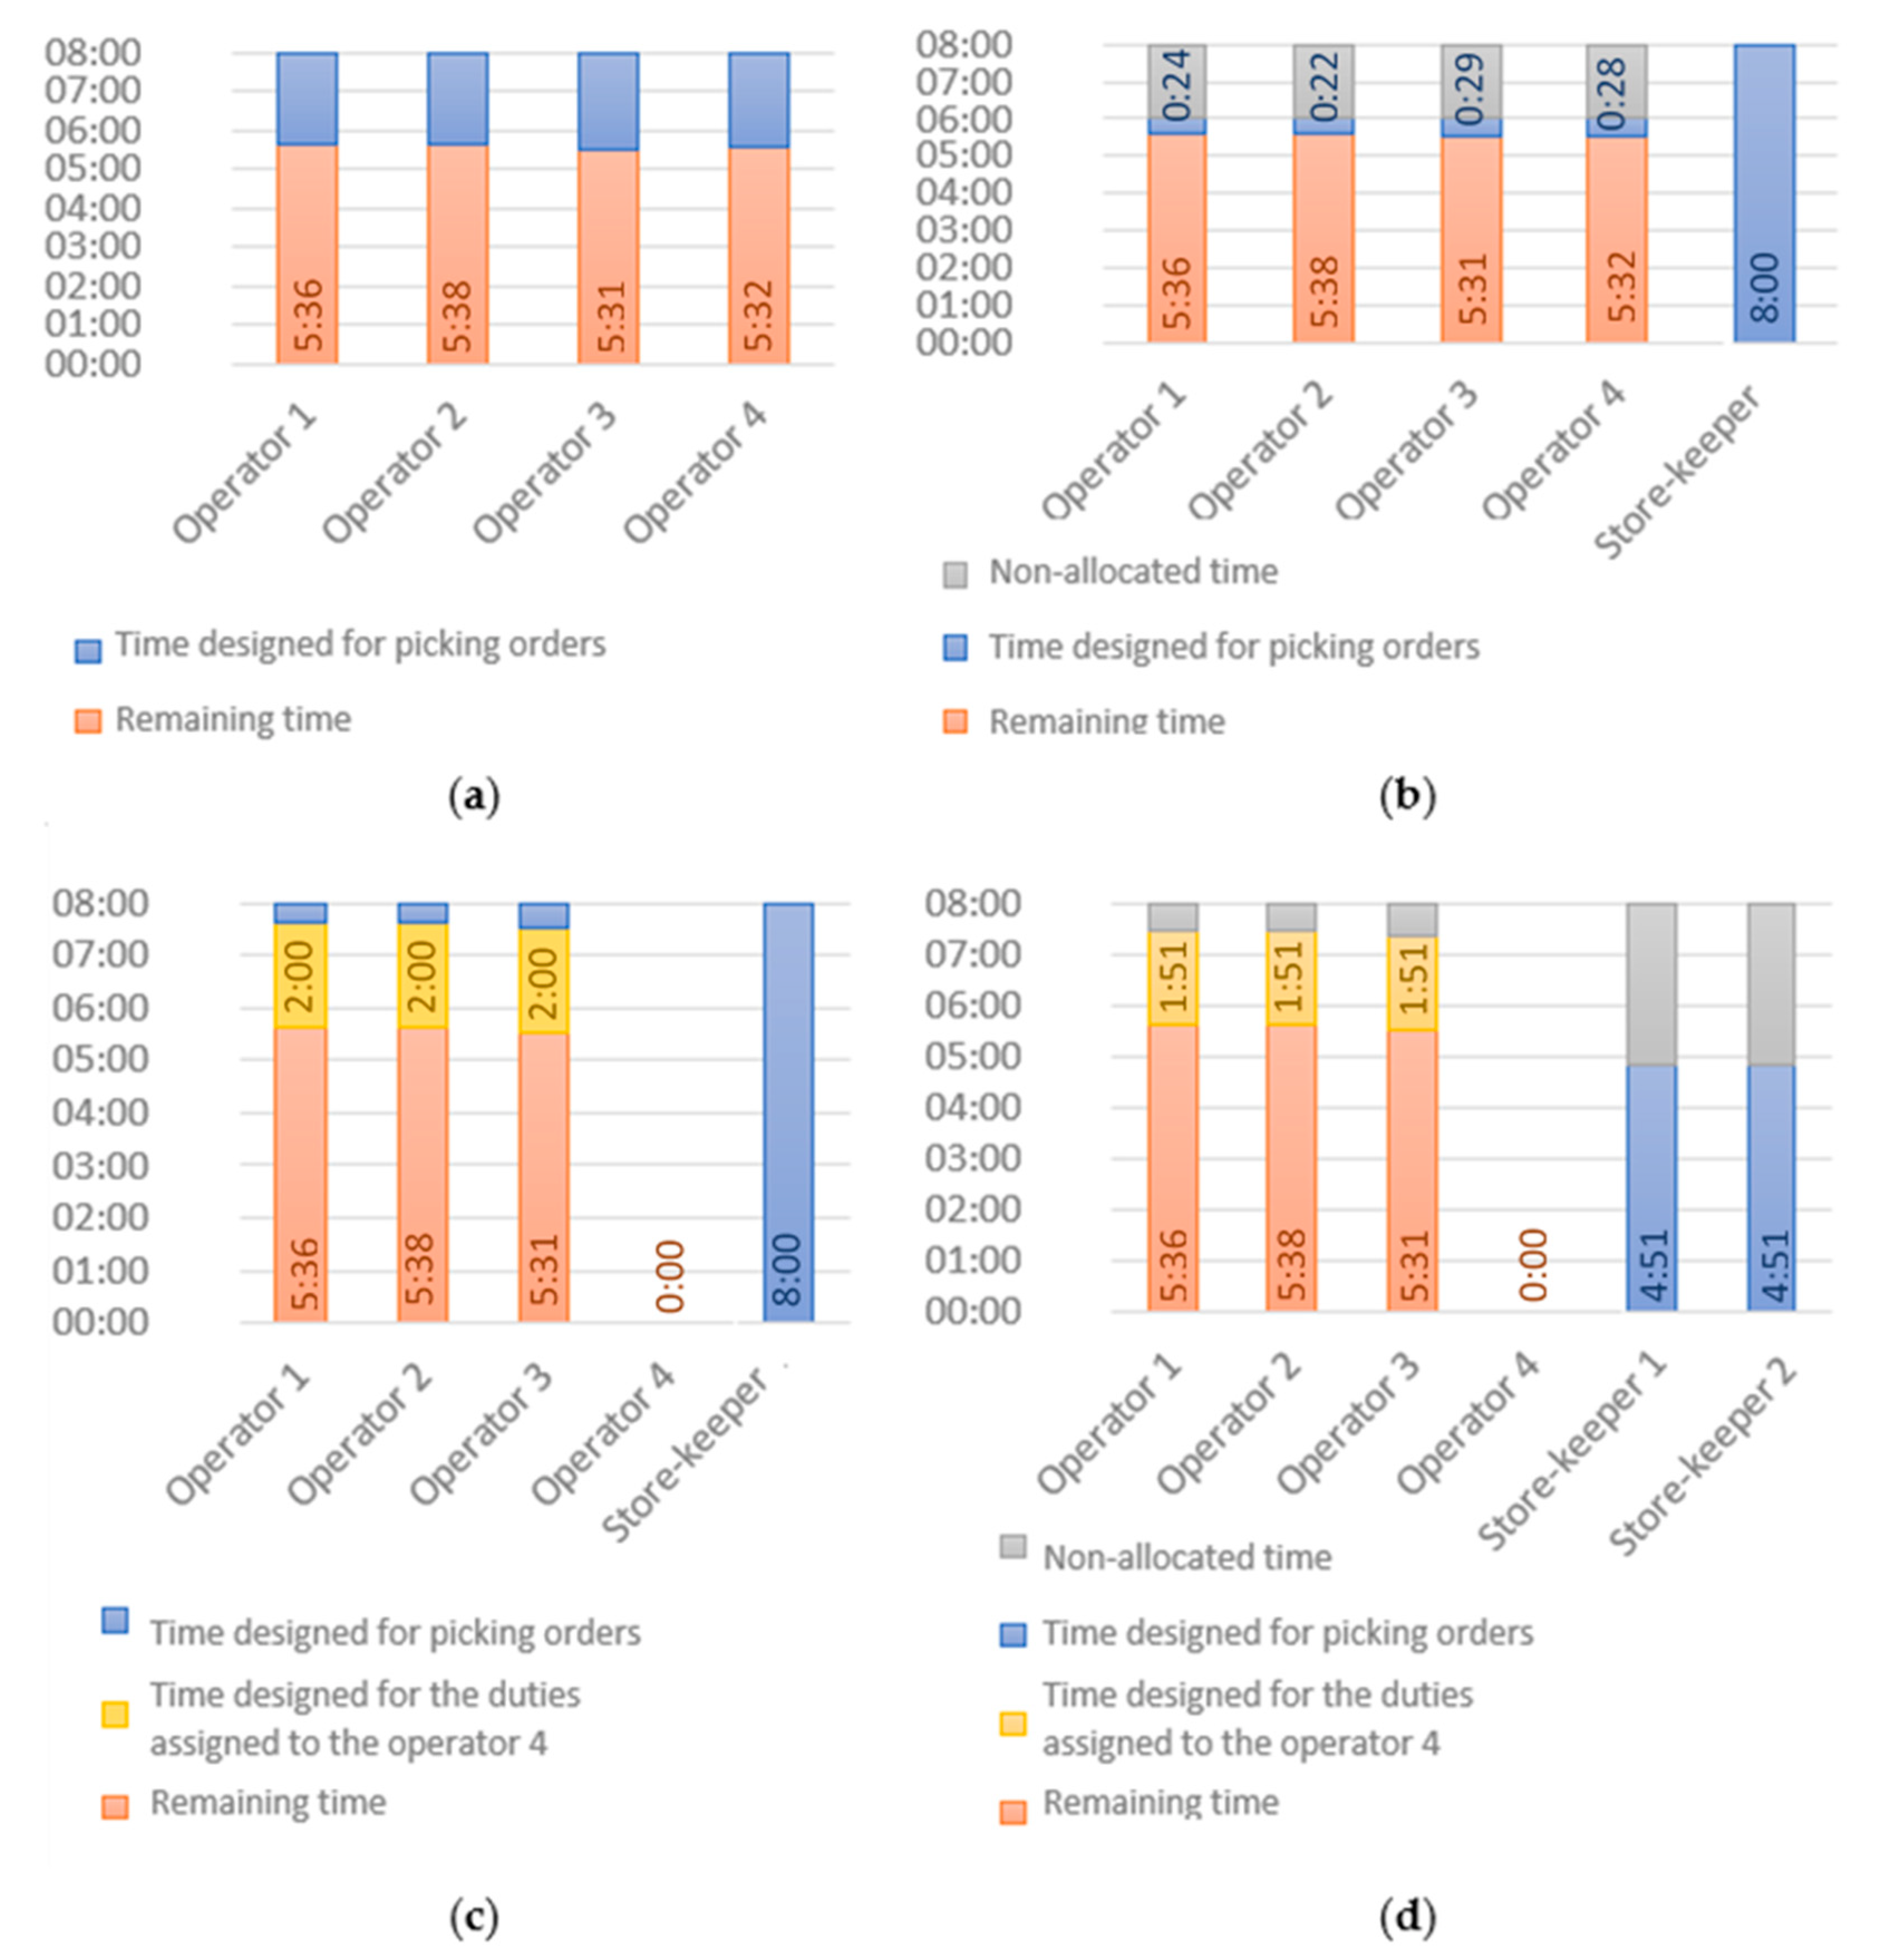
4.2. Warehouse-To-Packing Transport

Two to four forklift operators were assigned to the transport task warehouse–packing. Each of them received a list of indices of the products composing individual orders to be completed during the given day.
Heat maps generated by the monitoring devices revealed the problem of the long-lasting stays of the forklifts (Figure 5):
in the packing area under the upper shelter, and
in the order-picking points.
Figure 5. Heat maps for the transport task warehouses–packing for 6 representative days.
Sustainability 15 01113 g005
Firstly, the problem related to the area under the upper shelter was analyzed. The data acquired from the monitoring system showed that the employee spent on average 22% of their worktime there, and of that about 77% was the inactivity time of the forklift. Figure 6 shows the diagram of daily inactivity of all forklifts in the packing zone.
Use of the five whys method revealed the problem source, which was assigning the forklift operators to manual works (with no forklift) in the packing zone. It meant that each operator spent on average 1 h 40 min a day packing the load and handling it in the packing zone. The described situation resulted in ineffective use of employees and trucks, and thus, excessive costs. Given that work scheduling is usually a challenge, we decided to use mathematical modeling methods and optimization tools (solvers) to minimize unnecessary downtime and streamline the warehouse processes.

4.2.1. Mathematical Model

The analysis of the tasks performed within this logistics task in the warehouse hall, as well as the time needed to process particular orders and related communication problems, allowed us to develop a mathematical model enabling the determination of an optimal number of forklifts and additional manual workers/warehouse workers (who could take over some of the forklift operators’ tasks), and thus, enabling the optimization of the transport process as well as the reduction of its costs.
The following designations were adopted in the model:
T employee’s working time (in the considered period, e.g., day, week, month);
i = 1,2,…, I forklift operators (and thus, forklifts). I means the maximum number of operators/forklifts adopted in the optimization process;
j = 1,2,…, J manual workers/warehouse workers. J means the maximum number of manual workers adopted in the optimization process;
n = 1,2,…, N orders to be completed and transported in the considered time period (N—the number of orders in the considered time);
r n preparation (packing) time of order n (forklift idle time during which the forklift operator performs manual packing of the order);
s n transport time of order n (working time of a forklift);
α the cost of a forklift and an operator (may represent any costs related to the wages, purchase, exploitation, etc.);
β the cost of a manual worker (meaning as above);
Decision making variables applied in the model:
a i n = 1 if order n is packed by a forklift operator i, 0 if otherwise (binary variable);
b j n = 1 if order n is packed by a manual worker/warehouse worker j, 0 if otherwise (binary variable);
c i n = 1 if order n is transported by a forklift operator i, 0 if otherwise (binary variable);
x i = 1 if a forklift operator i realizes (transports or packs and transports) at least one order, 0 if otherwise (binary variable). If x i = 0, then the operator and forklift i are not used in the warehouse process;
y j = 1 if a manual worker/warehouse worker j realizes (packs) at least one order, 0 if otherwise (binary variable). If y j = 0, then the worker j is not used in the warehouse process;
Optimization criterion: optimization aims at the reduction (minimization) of costs by designating a proper number of forklifts and their operators, including possible replacement of the forklift and the operator with a manual worker equipped with a hand-operated pallet truck. The task of the adopted goal function is the reduction of the number of both types of workers considering the cost of their work (parameters α and β):
min α i = 1 I x i + β j = 1 J y j
In Formula (1), the sum of variable values x i is equal to the number of required forklift operators, while the sum of variable values y j is equal to the number of required manual workers.
Constraints:
i = 1 I a i n + j = 1 J b j n = 1 for   each   n   =   1 N
Each order must be completed by a forklift operator (decision-making variables a i n ) or a manual worker (variables b j n ). Limitation (2) ensures that each order is completed by exactly one worker (exactly one of the variables is equal to 1).
i = 1 I c i n = 1 for   each   n   =   1 N
a i n + j = 1 J b j n = c i n for   each   n   =   1 N
Limitation (3) guarantees that each order will be transported. If the order is completed/packed by a forklift operator, then the same operator must transport it (it cannot be done by another operator with another forklift), which is indicated by Limitation (4).
n = 1 N a i n r n + c i n s n T for   each   i   =   1 I
n = 1 N b j n r n T for   each   j   =   1 J
Employees’ working time can’t exceed the maximum working time. In the case of a forklift operator, it is regulated by Limitation (5)—the sum of the working times when completing orders and the working times when transporting orders do not exceed the permissible time T. The maximum working time of a manual worker/warehouse worker is described by Limitation (6)—in the case of these workers, only the completing orders tasks are realized.
Other limitations (7)–(8) define the variable values x i and y j (and thus, indirectly, the number of forklift operators and manual workers) occurring in the criterion (1).
n = 1 N c i n I x i for   each   i   =   1 I
If a forklift operator i is designated to the realization of at least one order, then he/she must be employed—the variable value x i is equal to 1 at that time. The limitation considers only the transport of an order; if the worker performed the completion of the given order, he/she certainly also transported it (which, in turn, is guaranteed by the limitation (4)).
n = 1 N b j n I y j for   each   j   =   1 J
If a manual worker/warehouse worker j packs at least one order, he/she must be employed—the variable value y j is equal to 1 then.
The developed mathematical model enables, with the knowledge of the times necessary for the packing and transport of particular orders, the selection of the cost-optimal number of forklift operators and manual workers. Additionally, it allows management to determine the best distribution of tasks among the workers—the effect of the optimization includes a precise assignment of tasks for both forklift operators (in variables a i n , c i n ) as well as for manual workers (in variable b j n ).
The use of the model and the optimization process allowed us to propose solutions that contribute to a significant improvement of logistics in the considered company. The proposed approach is useful and results in measurable benefits (minimizing the number of employees, better assignment of tasks).
In addition, the developed mathematical model can be used in various cases of optimizing the implementation of tasks in warehouses. It can be easily adapted to the specific conditions of each company, where warehouse processes include various activities performed by employees (e.g., picking orders, packing, transport, loading) and different groups of employees (e.g., forklift operators, warehousemen, controllers).

4.2.2. Solutions

In order to make the work more efficient, two solutions were suggested, shown in Table 1.
Figure 7 Illustrates current average workloads of forklift operators.
Figure 8 shows the possibility of distributing tasks among the forklift operators in the first (Figure 8a) and the second (Figure 8b) variants of the improvement.
In variant II, actual working time of the forklift workers significantly exceeds their available working time, but the excess is smaller than 30 min for each operator, so there is no reason to reject the variant that makes it possible to resign one forklift truck. Each variant was verified by AB tests (testing each shift for minimum 3 working days in real conditions). Further application of the Optimatik BI system would make it possible to generate exact data about the results of each solution.
Next, the problem of stays in the order-picking points was analyzed. It appeared that the problem was caused by:
high fragmentation of the orders (orders are composed of large numbers of variable elements) resulting in long-lasting identification of components, and
numbers of ordered elements inconsistent with numbers of these elements in a transport package, resulting in a necessity to rearrange them manually.
Analysis of the data acquired by the monitoring devices installed on the forklifts showed that, in over 80% cases, efficiency of the vehicles was below 30%. In order to solve the problem, the following options were suggested:
designate storage areas using one of the methods: alphanumerical designation, barcodes or RFID markers; or
standardize the purchase lot size; or
add a packing station (designed for completing orders composed of non-standard numbers of elements); or
employ a store-keeper (see Table 2).
Employment of an additional worker would entail a rearrangement of work division (Figure 9).
Transferring a part of duties to the storekeeper would result in lower efficient use of the operators’ working time and in the appearance of some non-allocated time, so the second and the third variants assume resigning one of the forklift operators executing the warehouse–packing task. Implementation of this solution would result in more efficient use of the other employees and would eliminate maintenance costs of one skilled operator and the vehicle. To verify the variants, AB tests were used again.

4.3. Packing-To-Loading Transport

One of the five forklift operators is responsible for loading (Figure 10).
The problem of reduced speed of forklift trucks was noticed during transportation of large-size elements. It appeared that the logistic route to the loading zone was obstructed by loads, trucks and variable factory infrastructure elements left by workers on roadsides of the route to the loading zone. As a result, width of the road was reduced, sometimes even by half. Due to missing reference points, operators were unable to evaluate whether the remaining free space was sufficient for the vehicles. In consequence, the forklift operator was forced to lift the load to the height of at least 2 m in order to overcome the obstacle freely. The accident risk is higher when a load of non-standard size is transported. Lifting it to the above-mentioned height is more difficult to the operator and involves a hazardous situation. In order to solve the problem, it was suggested to:
mark out minimum width of the logistic road with a clearly visible line; or
use a new type vehicle that would be able to convey loads sideways; or
introduce a “pilot” who would direct the forklift traffic; or
equip the vehicles with warning traffic lights or acoustic signals.
It was also indicated that, for communication reasons, the operator responsible for loading received an incomplete order. Anther situation that was identified was when an employee had to come back to the warehouse to bring a missing element. At that time, the employee responsible for loading, unaware of incompleteness of the order, collected the load and placed it on the lorry. A similar situation took place near the rest break and between work shifts. This problem leads to the following situations: if the error is found before the operator collecting the order has left, the load is taken out and completed (which results in extension of the order execution time); if not, the customer receives an incomplete order. In order to remove the source of this problem, it was suggested to:
introduce a checkpoint integrated in the process (counting elements in the package according to the checklist or weighing it); or
adjust sizes of packages to numbers of products placed inside.
In order to solve the communication problem, it was suggested to:
introduce labels or lights informing about the stage of packing; or
determine intermediate storage zones subdivided to the areas corresponding to stages of packing; or
apply an RFID gate.

5. Conclusions

Within the research, the possibility of improving factory transport using a WiFi-based in-building location system is analyzed. The WiFi technique is non-invasive, sufficiently precise and relatively cheap compared to the other available methods. The industrial vehicle monitoring system Optimatik BI was applied, implemented in a company manufacturing PVC profiles for the building materials and interior equipment market. This is the first paper presenting the implementation (the method and the results) of the Polish, quick, non-invasive and relatively cheap system Optimatik BI on the example of a real production company. The monitoring devices delivered information that enabled full analysis of the in-factory transport. The data collected from the system showed that the average inactivity time of the forklift was about 70%. Ineffective areas and movements were identified and, in consequence, the numbers of forklift operators and trucks can be reduced and organizational changes in the work or the working space can be implemented. The proposed solutions allow reducing the inactivity time to a minimum. A mathematical model of the implementation of one of the logistics tasks was developed, allowing for the optimization of efficiency by determining the best number of workers to be handling transport. The developed model and the proposed optimization process can be easily adapted to the conditions of other enterprises and the improvement of their warehouse processes. Implementation of the suggested improvements would make it possible to rationalize the logistic processes by increasing efficiency of the industrial vehicles and their operators, as well as to improve the safety conditions.
Within the future research, it is planned to extend the analysis by the safety aspect. The system makes it possible to introduce real-time alarms concerning the forklift traffic. The alarm would be actuated in the case of:
speeding,
collision,
entry to a forbidden zone,
stay of more than one vehicle in a designated zone.
It is also expected that the technique will be developing towards the idea “industry 4.0” to build databases supporting management of logistic processes. Future research could focus on using the system for IoT-connected vehicles, enabling their real-time tracking and, with intelligent algorithms, planning optimal (the most effective and safest) trajectories of the vehicles.

Author Contributions

Conceptualization, J.K and A.B.; methodology, J.K., A.B., M.M., A.K. and M.W.; software and validation, A.K. and M.W.; formal analysis, J.K. and A.B.; investigation, J.K., A.B., M.M., A.K. and M.W.; resources, A.K. and M.W.; data curation, J.K, A.B., M.M., A.K. and M.W.; writing—original draft preparation, J.K., A.K. and M.W.; writing—review and editing, A.B. and M.M.; visualization, J.K., A.K. and M.W.; supervision, A.B. All authors have read and agreed to the published version of the manuscript.

Funding

This research received no external funding.

Institutional Review Board Statement

Not applicable.

Informed Consent Statement

Not applicable.

Data Availability Statement

Not applicable.

Conflicts of Interest

The authors declare no conflict of interest.

References

  1. Burduk, A.; Musia, ł.K. Optimization of Chosen Transport Task by Using Generic Algorithms. In Lecture Notes in Computer Science; Saeed, K., Homenda, W., Eds.; Springer: Cham, Switzerland, 2016; Volume 9842, pp. 197–205. [Google Scholar] [CrossRef]
  2. Gola, A.; Kłosowski, G. Application of Fuzzy Logic and Genetic Algorithms in Automated Works Transport Organization. In Advances in Intelligent Systems and Computing; Omatu, S., Rodríguez, S., Villarrubia, G., Faria, P., Sitek, P., Prieto, J., Eds.; Springer: Cham, Switzerland, 2018; Volume 620, pp. 29–36. [Google Scholar] [CrossRef]
  3. Gregor, T.; Krajčovič, M.; Więcek, D. Smart Connected Logistics. Procedia Eng. 2017, 192, 265–270. [Google Scholar] [CrossRef]
  4. Dohn, K. Selected problems of logistics in production—Internal transportation processes organization. WUT J. Transp. Eng. 2009, 70, 47–58. [Google Scholar]
  5. Antosz, K.; Stadnicka, D. Lean Philosophy Implementation in SMEs—Study Results. Procedia Eng. 2017, 182, 25–32. [Google Scholar] [CrossRef]
  6. Senderska, K.; Mares, A.; Vaclav, S. Spaghetti Diagram Application For Workers’ Movement Analysis. UPB Sci. Bull. Ser. D 2017, 79, 1. [Google Scholar]
  7. Kanaganayagam, K.; Muthuswamy, S.; Damoran, P. Lean methodologies to improve assembly line efficiency: An industrial application. Int. J. Ind. Syst. Eng. 2015, 20, 104–116. [Google Scholar] [CrossRef]
  8. Mangiola, S.; Papenfuss, A.T. tidyHeatmap: An R package for modular heatmap production based on tidy principles. J. Open Source Softw. 2020, 2472, 5. [Google Scholar] [CrossRef]
  9. Pryke, A.; Mostaghim, S.; Nazemi, A. Heatmap Visualization of Population Based Multi Objective Algorithms. In Lecture Notes in Computer Science; Obayashi, S., Deb, K., Poloni, C., Hiroyasu, T., Murata, T., Eds.; Springer: Berlin/Heidelberg, Germany, 2007; Volume 4403, pp. 361–375. [Google Scholar] [CrossRef]
  10. Yeong, D.J.; Velasco-Hernandez, G.; Barry, J.; Walsh, J. Sensor and Sensor Fusion Technology in Autonomous Vehicles: A Review. Sensors 2021, 2140, 2140. [Google Scholar] [CrossRef] [PubMed]
  11. Suganuma, N.; Uozumi, T. Development of an autonomous vehicle-System overview of test ride vehicle in the Tokyo Motor Show 2011. In Proceedings of the SICE Annual Conference, Akita, Japan, 18–19 August 2012; pp. 215–218. [Google Scholar]
  12. Rahiman, W.; Zainal, Z. An Overview of Development GPS Navigation for Autonomous Car. In Proceedings of the 8th IEEE Conference on Industrial Electronics and Applications (ICIEA), Melbourne, Australia, 19–21 June 2013. [Google Scholar] [CrossRef]
  13. Campbell, S.; O’Mahony, N.; Krpalcova, L.; Riordan, D.; Walsh, J.; Murphy, A.; Ryan, C. Sensor Technology in Autonomous Vehicles: A review. In Proceedings of the 29th Irish Signals and Systems Conference (ISSC), Belfast, UK, 21–22 June 2018; pp. 1–4. [Google Scholar] [CrossRef]
  14. Terán, M.; Aranda, J.; Carrillo, H.; Mendez, D.; Parra, C. IoT-based system for indoor location using bluetooth low energy. In Proceedings of the IEEE Colombian Conference on Communications and Computing (COLCOM), Cartagena, Colombia, 16–18 August 2017; pp. 1–6. [Google Scholar]
  15. Kuxdorf-Alkirata, N.; Brückmann, D. Reliable and low-cost indoor localization based on bluetooth low energy. In Proceedings of the 3rd International Symposium on Wireless Systems within the Conferences on Intelligent Data Acquisition and Advanced Computing Systems (IDAACS-SWS), Offenburg, Germany, 26–27 September 2016; pp. 92–96. [Google Scholar]
  16. Stavrou, V.; Bardaki, C.; Papakyriakopoulos, D.; Pramatari, K. An Ensemble Filter for Indoor Positioning in a Retail Store Using Bluetooth Low Energy Beacons. Sensors 2019, 4550, 19. [Google Scholar] [CrossRef] [PubMed] [Green Version]
  17. Ding, K.; Jiang, P.; Su, S. RFID-enabled social manufacturing system for inter-enterprise monitoring and dispatching of integrated production and transportation tasks. Robot. Comput. Integr. Manuf. 2018, 49, 120–133. [Google Scholar] [CrossRef]
  18. Röhrig, C.; Heß, D.; Künemund, F. Constrained Kalman filtering for indoor localization of transport vehicles using floor-installed HF RFID transponders. In Proceedings of the 2015 IEEE International Conference on RFID (RFID), Tokyo, Japan, 16–18 September 2015; pp. 113–120. [Google Scholar]
  19. Xiong, Z.; Song, Z.; Scalera, A.; Ferrere, E.; Sottile, F.; Brizzi, P.; Tomasi, R.; Spirito, M.A. Hybrid WSN and RFID indoor positioning and tracking system. J. Embedded Systems 2013, 6, 1–15. [Google Scholar] [CrossRef] [Green Version]
  20. Xu, B.; Gang, W. Random sampling algorithm in RFID indoor location system. In Proceedings of the Third IEEE International Workshop on Electronic Design, Test and Applications (DELTA’06), Kuala Lumpur, Malaysia, 17–19 January 2006; p. 6. [Google Scholar] [CrossRef]
  21. Gladysz, B.; Santarek, K.; Lysiak, C. Dynamic Spaghetti Diagrams. A Case Study of Pilot RTLS Implementation. In Advances in Intelligent Systems and Computing; Burduk, A.D., Mazurkiewicz, D., Eds.; Springer: Cham, Switzerland, 2018; Volume 637, pp. 238–248. [Google Scholar]
  22. Gutewort, D.; Semm, A.; Erfurth, C. Raising Awareness of SMEs for Real-Time Locating Systems (RTLS) in Intralogistics. In Communications in Computer and Information Science; Krieger, U.R., Eichler, G., Erfurth, C., Fahrnberger, G., Eds.; Springer: Cham, Switzerland, 2021; Volume 1404, pp. 223–236. [Google Scholar]
  23. Zhang, Y.; Wu, L. Application of RFID and RTLS Technology in Supply Chain Enterprise. In Proceedings of the 6th International Conference on Wireless Communications Networking and Mobile Computing (WiCOM), Chengdu, China, 23–25 September 2010; pp. 1–4. [Google Scholar]
  24. Curran, K.; Furey, E.; Lunney, T.; Santos, J.; Woods, D.A.; McCaughey, A. An evaluation of indoor location determination technologies. J. Locat. Based Serv. 2011, 5, 61–78. [Google Scholar] [CrossRef]
  25. Lashkari, A.H.; Parhizkar, B.; Ngan, M.N.A. WIFI-Based Indoor Positioning System. In Proceedings of the Second International Conference on Computer and Network Technology, Washington, DC, USA, 23–25 August 2010; pp. 76–78. [Google Scholar] [CrossRef]
  26. Sabanci, K.; Yigit, E.; Ustun, D.; Toktas, A.; Aslan, M.F. WiFi Based Indoor Localization: Application and Comparison of Machine Learning Algorithms. In Proceedings of the XXIIIrd International Seminar/Workshop on Direct and Inverse Problems of Electromagnetic and Acoustic Wave Theory (DIPED), Tbilisi, Georgia, 24–27 September 2018; pp. 246–251. [Google Scholar] [CrossRef]
  27. Liu, H.H.; Yang, Y.N. WiFi-based indoor positioning for multi-floor Environment. In Proceedings of the TENCON 2011—2011 IEEE Region 10 Conference, Bali, Indonesia, 21–24 November 2011; pp. 597–601. [Google Scholar] [CrossRef]
  28. Ryu, S.; Park, B.B.; El-Tawab, S. WiFi Sensing System for Monitoring Public Transportation Ridership: A Case Study. KSCE J. Civ. Eng. 2020, 24, 3092–3104. [Google Scholar] [CrossRef]
  29. Uras, M.; Cossu, R.; Atzori, L. PmA: A solution for people mobility monitoring and analysis based on WiFi probes. In Proceedings of the 4th International Conference on Smart and Sustainable Technologies (SpliTech), Bol/Split, Croatia, 18–21 June 2019; pp. 1–6. [Google Scholar] [CrossRef]
  30. Lesani, A.; Miranda-Moreno, L. Development and Testing of a Real-Time WiFi-Bluetooth System for Pedestrian Network Monitoring, Classification, and Data Extrapolation. IEEE Trans. Intell. Transp. Syst. 2019, 20, 1484–1496. [Google Scholar] [CrossRef]
  31. Rosienkiewicz, M. Artificial intelligence-based hybrid forecasting models for manufacturing systems. Maint. Reliab. 2021, 23, 263–277. [Google Scholar] [CrossRef]
  32. Tubis, A.A.; Poturaj, H. Challenges in the implementation of autonomous robots in the process of feeding materials on the production line as part of Logistics 4.0. LogForum 2021, 17, 411–423. [Google Scholar] [CrossRef]
Figure 1. Stages of implementation of the Optimatik BI system.
Sustainability 15 01113 g001
Figure 4. Areas that could be assigned for a new warehouse.
Sustainability 15 01113 g004
Figure 6. Inactivity times of forklifts in the packing zone.
Sustainability 15 01113 g006
Figure 7. Current use of forklift operators for packing orders.
Sustainability 15 01113 g007
Figure 8. Variants of improvement in the packing zone: (a) variant I; (b) variant II.
Sustainability 15 01113 g008
Figure 9. Use of the operators’ worktime: (a) current state; (b) variant I; (c) variant II; (d) variant III.
Sustainability 15 01113 g009
Figure 10. Places for packing and loading the goods.
Sustainability 15 01113 g010
Table 1. Suggested improvements of the process of order packing.
Variant IVariant II
Introduction1 manual worker
1 hand-operated pallet truck
1 manual worker
1 hand-operated pallet truck
Resignation -1 forklift operator
1 forklift truck
DescriptionIntroducing to the packing station an employee with no forklift operator license. Purchasing a hand-operated pallet truck to the packing zone.Replacing one forklift operator with one employee in the packing station. Resigning one forklift truck (sale). Purchasing a hand-operated pallet truck to the packing zone.
Table 2. Suggested solutions aimed at increasing efficiency of vehicles and their operators.
Variant IVariant IIVariant III
Introduction1 storekeeper
1 hand-operated pallet truck
1 storekeeper
1 hand-operated pallet truck
2 storekeepers
2 hand-operated pallet trucks
Resignation-1 forklift operator
1 forklift truck
1 forklift operator
1 forklift truck
DescriptionEmploying a storekeeper responsible for picking a fragmented order. Purchasing a hand-operated pallet truck to be at the storekeeper’s disposal.Replacing a forklift operator with a manual worker. Resigning one forklift truck (sale). Purchasing a hand-operated pallet truck to be at the storekeeper disposal.Replacing a forklift operator with two storekeepers. Resigning one forklift truck (sale). Purchasing two hand-operated pallet trucks to be at the storekeepers disposal.
Disclaimer/Publisher’s Note: The statements, opinions and data contained in all publications are solely those of the individual author(s) and contributor(s) and not of MDPI and/or the editor(s). MDPI and/or the editor(s) disclaim responsibility for any injury to people or property resulting from any ideas, methods, instructions or products referred to in the content.

