Abstract
The present study presents a cradle-to-built life cycle assessment (LCA) for a road pavements structure of hot mixed asphalt (HMA) with recycled post-consumer polyethylene terephthalate (RPET) addition through the “dry” process using a comparison analysis between declared units equivalent of 1 ton of produced mix and functional units equivalent of 1 m2 pavement variants under the Brazilian “National Design Methodology” (MeDiNa), in contrast with a conventional mix variant. The Tool TRACI 2.0 for reducing and assessing chemical and other environmental impacts was applied for each alternative, assessing the impacts into categories such as acidification, eutrophication, freshwater ecotoxicity, global warming potential, human health, ozone depletion, and smog formation. The life-cycle impact assessment results were interpreted through an internal normalization criteria and weighting rule, obtaining an environmental score for each alternative and allowing an easy stakeholder interpretation. Considering the better mechanical properties and overall functional performance of the HMA + RPET mixes, the functional unit comparison on LCA methodology results in savings in all environmental impact categories for each square meter of pavement constructed and ready to use. For the functional units, the HMA + RPET pavement structures (FU 2 and FU 3) resulted in lower environmental scores (ES) with 49.2 and 47.1, respectively, representing a difference of 26.9 and 29 score points in comparison to the conventional pavement structure (FU 1 − C), with an ES of 76.1. It represents 38% of environmental savings in terms of the environmental score in favor of sustainable pavement alternatives. Focusing on the impact in global warming potential, the use of RPET in the HMA mixes for pavement design can result in savings up to 47.44% of impact decrease (20.4 ES) in comparison with the conventional-mix pavement structure proposal. This result supports the environmental sustainability of the HMA + RPET mixes and is a precedent for future research on new geotechnical and pavement alternative materials.
1. Introduction
Due to its extensive dimensions and high resource consumption, roadway pavements have attracted great attention from researchers focusing on developing sustainable pavements with alternative materials, such as plastic waste as aggregate replacement in asphalt mixtures, that could serve as an environmentally friendly method to dispose of such waste while simultaneously producing high-quality pavements. [1,2,3,4]. With that perspective, studies were developed on the assessment of environmental impact of plastics and polymer recycling from virgin use to post-consumer recyclate, as fiber or composites in the paving industry, applying the life-cycle assessment (LCA) methodology [5,6,7].
LCA is the compilation and assessment of a product’s inputs, outputs, and environmental impacts during its life cycle. This provides a systematic perspective of the environmental factors, resources invested, and wastes produced for one or more production systems [8,9]. The scope of the product system requires the selection of the main processes and life stages to study, as well as the main variables of the system. This allows the definition of the life-cycle inventory (LCI) for the main processes and upstream flows of the system, with data recollected by previous research or field recollection, defined as primary data; data included in public and private life-cycle databases such as the Federal LCA Commons® [10] and Ecoinvent®, which was previously reported in environmental product declarations, are defined as secondary data. Following the LCI, the life cycle impact assessment (LCIA) stage transforms the inventory into environmental impacts, which allows for stakeholder’s interpretation and assessment in function of their perspective.
LCA is extensively used for comparing innovative technologies in pavements or new alternative materials benchmarking. Different types of recycling methods are reported in the literature, such as mechanical recycling, with an overall better environmental profile, and chemical recycling, which allows for a wider range of applications for the RPET [11]. In [12] is reported a cradle-to-gate LCA of asphalt pavements with recycled post-consumer polyethylene (RP) addition via the “dry” process, highlighting that RP pavements are environmentally beneficial relative to HMA when savings in pavement thickness of 12.5% or extension of maintenance cycles by 7% are achieved. Cradle-to-gate LCA comparing the environmental performance of two pavement alternatives from Brazil and Switzerland using practical rates of reclaimed asphalt pavement (RAP) reported that RAP recycling can improve the environmental performance of such pavements, reducing the binder percentage and minimizing its environmental burden [13]. The use of primary data is also reported in comparative LCA for recycled plastic use in the production of asphalt mixes [14]. The results showed that recycling plastics has the potential to produce more environmentally sustainable asphalt mixes, such as polymer for bitumen modification or as synthetic aggregate replacement. In addition to the life-cycle impact assessment (LCIA), normalization and weighting of alternate design is, according to [15], a key step that aims to associate impacts of a design to a set of reference and comparative values that is understandable, measurable, and recognizable by decision-makers and stakeholders. This comparison can include external or internal normalization criteria. The authors in [16] applied impact scores and normalized factors for assessing a nano-silica-modified asphalt mixture in contrast to a conventional alternative, this to ponder the relative significance of each impact category.
Incorporating recycled post-consumer polyethylene terephthalate (RPET) in hot mix asphalt (HMA) through the “dry” process as aggregate replacement has shown increased the pavement performance, better mechanical parameters, superior aging and moisture damage resistance, and asphalt–aggregate adhesion [17,18]. Although it sets a premise for a new life cycle use for the RPET as a sustainable and environmentally friendly component of asphalt pavements, with an optimized thickness effect and potentially better damage resistance improvement, the present LCA study aims to establish a standpoint for the RPET effects on the environmental impacts of these pavement alternatives, with two comparison points: (a) declared unit of 1 t of HMA mixes and (b) functional unit of 1 m2 of pavement structure.
2. Life Cycle Assessment
The structure of a life cycle assessment consists of the scope definition, inventory analysis, and impact assessment for each flow, as defined in the methodology framework of the standards ISO 14040 (2006) and ISO 14044 (2006) [8,9]. It follows an iterative interpretation step until it fulfills the goals defined in the scope.
2.1. Goal and Scope Definition
2.1.1. Product System and Boundary
The main goal of this study is a case comparison of the environmental performance and impacts of a conventional HMA pavement and an HMA pavement with the addition of RPET in flake and micronized form, added in dry conditions as a natural aggregate replacement, in support of previous research that highlighted the potential of its inclusion to improve the mechanical parameters, superior aging and moisture damage resistance, and asphalt–aggregate adhesion, thus promoting an alternative-sustainable pavement project variant. The spatial system boundary is the city of Brasilia, Federal District, Brazil, following the same spatial setting of the sustainable pavement alternatives studied. The life cycle boundary begins with the main materials extraction (cradle) and recollection and ends with the pavement construction (built). Due to the lack of studies on the operation phase of such new sustainable pavement proposals, the following stages will not be considered in the LCA scope: maintenance, use performance, pavement wearing, demolition, or reclamation. Figure 1 presents the product system for the pavement variants, defining the main processes considered for the cradle-to-built LCA. The processes are composed of primary data, obtained for the mix proportions design for each pavement variant, as well as the pavement structure design. The extraction and upstream production, as well as the transport-related input and output, are composed of secondary data. The transportation distances were determined as an average for material supply for the product system, considering the manufacturing of graduated gravel for base and subbase and the HMA production in the same facility. The energy supply is adapted from the energy matrix supply of Brazil [19], coupled with the upstream secondary data corresponding to each type of energy production facility.

Figure 1.
Product system and system boundary.
The stablished product system allows for two LCA comparison points:
- Declared unit comparison. Its definitions depend only on physical quantity and does not require any definition of functionality. For the present study, the declared units are: HMA − C and HMA + RPET.
- Functional unit comparison. This is a representation of the physical dimensions and the quantified performance of the pavement. For the present study, the functional unit’s nomenclature is detailed in Table 1.
 Table 1. Functional unit nomenclature definition.
2.1.2. Products and Materials
This section details the main products and materials considered in the product system.
Recycled Post-Consumer Polyethylene Terephthalate (RPET)
RPET is a waste management process product of post-consumer polyethylene terephthalate, which underwent a secondary recycling procedure involving mechanical procedures such as cutting/shredding, milling, or grinding. The formats used for the present pavement variants consist of flake form, with a nominal size of 10 mm, and micronized form, with a nominal size of 0.42 mm. A combination of these two RPET formats were added to the HMA mixes in mass percentage substitution of the rock filler. Illustration of the RPET’s flake form and micronized form is presented in Figure A1. The addition of the RPET into the HMA mixes follows the “dry” procedure, in which the plastic is added in the final segment of the mixing process and after introducing and incorporating the asphalt binder with the aggregate [1].
For the present study, a cut-off rule is applied for the previous life cycle of RPET. This considers only the steps of production of RPET, which can be numbered as: (a) recovery: collection of postconsumer plastic; (b) sorting and separation: sorting of plastics from other co-collected recovered materials and separating mixed plastics into individual resins; and (c) reclaimer operations: with additional separation and processing of postconsumer resin by a reclaimer to convert the received material into clean resin ready for use in manufacturing. The material is considered “on demand” during all HMA production, and a freightage distance of 10 km was stablished for the present LCA.
Asphalt Binder
The asphalt binder used on the HMA designs is a petroleum asphalt cement (PAC) 30/45 commonly used in Brazilian road paving. The characterization of the asphalt binder is presented in Table A1. The material is considered “on demand” during all HMA production, and a land freightage distance of 750 km was stablished for the present LCA, considering the closest petroleum refinery to Brasília, D.F., located in the city of Belo Horizonte, state of Minas Gerais.
Aggregates
The aggregates used for the HMA design are from granitic origin. Figure A2 presents illustrations of the aggregates used as gravel 1, gravel 0, and rock filler. The properties of these aggregates are presented in Table A2.
The aggregates used for the pavement’s base and subbase course consist of generic graduated material of gneiss matrix origin and are considered for the functional unit assessment with the pavement structure design methodology.
The aggregates are considered “on demand” during all HMA production, and a land freightage distance of 5 km was established for the present LCA, from the aggregate deposit to production plant or project site.
2.1.3. Declared Units
The production of one ton of conventional hot mixed asphalt (DU 1 − C) and one ton of hot mixed asphalt production with RPET addition (DU 2) as corresponding declared units is defined as a first comparative point to assess the inventory and environmental impacts of the analogical production for each mix in the same hypothetical production plant. Such comparison only contemplates the material quantities according to the mix design proposed by [21], and due to the “dry” process inclusion of the RPET into the mix, the present LCA will not consider having any significant variation of energy or resource consumption for the sustainable mixes. Figure 2 details the mechanical characterization and dosage for the HMA with an optimal bitumen content of 5.5%, and the dosage of hot mix asphalt in the percentage of the total mass, highlighting the performance improvements of the mix with the inclusion of the RPET, such as an increase on the resilient modulus and tensile strength, as well as a decrease in the bulk specific gravity and void volume percentage.
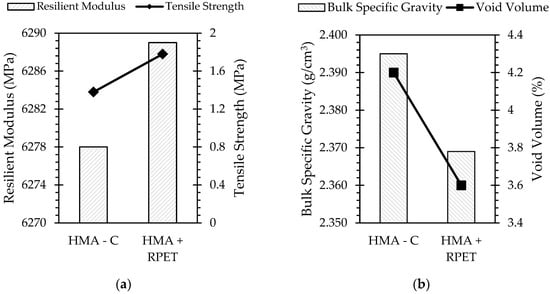
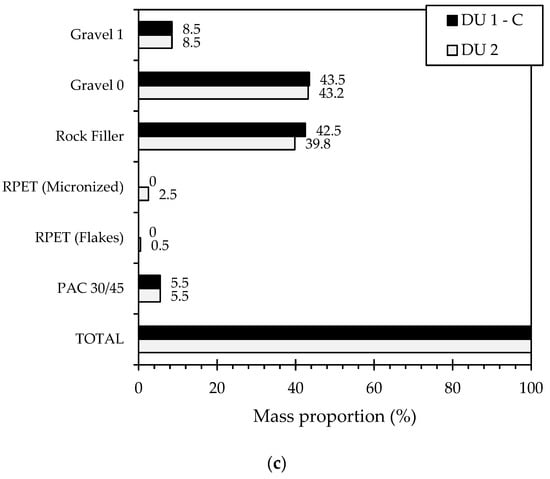
Figure 2.
Declared unit hot mixed asphalt characterization and dosage: (a) resilient modulus and traction resistance; (b) bulk specific gravity and void volume; (c) dosage of hot mixed asphalt in the percentage of total mass, as declared by the author [20].
2.1.4. Functional Units
As a second comparative point, we define one square meter of pavements for each mix as functional units, taking into consideration the mechanical and performance parameters under the National Design Methodology (MeDiNa) [22], a Brazilian methodology. It implements a mechanistic–empiric pavement design methodology and validation based on elastic multi-layer analysis. The main parameters consist of the resilience modulus and fatigue curve assessment. For the present study, three pavement structures are proposed. The first consists of the HMA C mix surface course, graduated gravel base course, and graduated gravel subbase course. The other two structures are the sustainable pavement option with the HMA + RPET surface course and two infrastructure alternatives, one with a graduated gravel base course and graduated gravel subbase course, and one with only the graduated gravel base course directly on the subgrade. We considered a freightage distance of 10 km from the production plant to the project site. The same traffic conditions are applied for the design methodology and consist of an equivalent standard axes load (ESAL) equal to 5 × 10⁵ eq. axes a year, and a 10-year analysis period is considered. Such traffic is representative of a medium-traffic primary arterial road system. Software results of MeDiNa for the functional units are annexed in supplementary material. The structures are represented in Figure 3, together with the performance results, and the graduated gravel mechanical parameters and characterization for use as base and subbase course are detailed in Table 2.
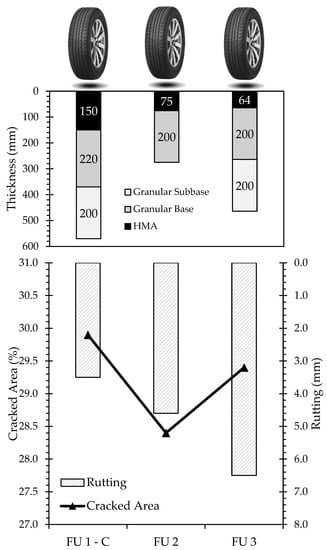
Figure 3.
Functional unit characterization with thickness for each pavement variant and functional parameters such as cracked area (%) and track sinking prediction (mm) by the end of the analysis period.

Table 2.
Base, subbase, and subgrade course material’s mechanical and volumetric parameters.
2.2. Life Cycle Inventory
2.2.1. Primary Data
The primary data used in this study consist of: (1) the hot mix asphalt mass proportion for the conventional and sustainable pavement structures [21], and (2) the equipment efficiency and resource consumption taken from the Work-Costs Reference System (SICRO), a Brazilian federative system proposed by the National Department for Infrastructure and Transport (DNIT). Such efficiency parameters are taken exclusively for Brasília, Federal District of Brazil.
2.2.2. Secondary Data
The main life-cycle inventory database for secondary data comes from Federal Highway Administration/MTU Asphalt Pavement Framework, integrated with the United States Environmental Protection Agency (US EPA) library in the Federal LCA Commons repository [10]. This database compiles the upstream flows and resources for the majority of the processes involved in the supply chain for pavement structures with a spatial scope of North America. These upstream processes are divided into the following categories:
- Domestic electricity supply. The energy supply chain was adapted for the Brazilian Energy Balance, considering the domestic electricity supply by source in 2020, as presented in Figure 4. The upstream data are adapted from the inventory database;
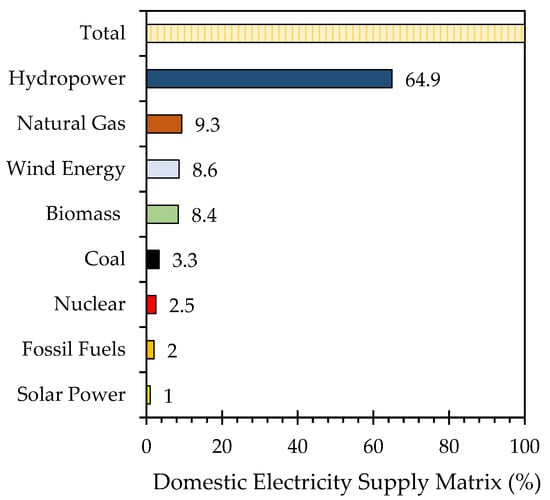 Figure 4. Brazilian domestic energy supply by source in 2020. Adapted from [19].
 - Raw materials (mining, extraction, and processing). Upstream data for raw materials processing and supply;
- Transportation. Upstream data for resource consumption and emissions related to transportation activities;
- Fuel combustion (diesel, gasoline, fuel oil, lignite coal, LPG). Upstream data for resource consumption and emissions related to fuel combustion.
Principal processes. Upstream data for resource consumption and emissions related to the asphalt binder, HMA production, and RPET reclamation. The life cycle inventory data with values and references is annexed in the Supplementary Materials.
2.3. Life Cycle Impact Assessment and Interpretation
2.3.1. Impact Assessment Methodology
The methodology for environmental impact assessment applied is the tool for the reduction and assessment of chemical and other environmental impacts “TRACI 2.0” [23], developed by the US EPA in 2003 and revised in 2011. It allows for the quantification of stressors that have potential effects for sustainability metrics and impact assessment, such as ozone depletion, global warming, acidification, eutrophication, tropospheric ozone (smog) formation, human health criteria-related effects, human health cancer, human health noncancer, ecotoxicity, and fossil fuel depletion effects. Table 3 shows those units for each indicator characterized and the environmental component in which its effect is measured.

Table 3.
TRACI 2.0 Environmental Impact indicators.
Within an LCA, the TRACI utilizes the amount of the chemical emission or resource used and the estimated potency of the stressor. Such potency depends on each chemical for the corresponding impact, which is a characterization factor. The overall Equation (1) applied is listed:
where Ii = the potential impact of all chemicals (x) for a specific impact category of concern (i); CFIxm = the characterization factor of chemical (x) emitted to media (m) for impact category (i), Mxm = the mass of chemical (x) emitted to media (m).
The management of all the life-cycle inventory, upstream processes, and impact assessment methodology is performed through the software OpenLCA® [24], an open-source software developed by GreenDelta.
2.3.2. Normalization and Weighting for Environmental Score
The normalization and weighting are optional stages of an LCA that can be applied to process the results into a more understandable perspective for the user. The normalization step consists of the magnitude of the division of each impact indicator in relation to a reference, which can be external or internal from the same product system, such as the maximum result of all cases evaluated. The weighting stage consists of a secondary ponderation of each normalized indicator, multiplied by a category weight defined by a stakeholder perspective. For this study, an internal normalization procedure is applied for each indicator, and a set of weights defined by [25] for the TRACI 2.0 methodology is implemented and detailed in Table 4.

Table 4.
Weights for each impact category indicator for an average user, under a medium-term time horizon.
The weighting criteria establish a quantitative alternative to synthesize and compare the environmental performance of the studied products, which strengthens the decision-making process for the stakeholders and LCA practitioners into the better sustainable project alternatives. This allows for an easy comparison between the DUs and FUs for the present study by impact category or overall environmental score.
3. Results
3.1. Declared Units Comparison and Interpretation
The declared unit environmental life-cycle impact assessment results are presented in Figure 5, and the relative comparison of the environmental impact assessment for each DU is presented in Figure 6. For each one ton produced of each mix, there is an overall better environmental performance of the DU 1 − C, corresponding to the conventional hot mixed asphalt. The lowest relative result is obtained for the eutrophication impact, resulting in 27% of the total impacts of the analogical HMA with RPET addition. In global warming potential, it represents 85% of the total impacts obtained by the mix with RPET, this impact being the one closer between the two declared units.

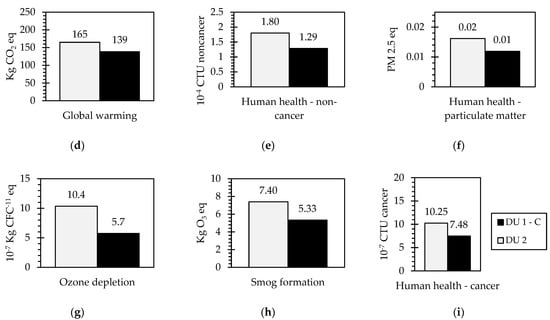
Figure 5.
Characterized results of the environmental impact assessment for the declared units: (a) acidification; (b) eutrophication; (c) freshwater toxicity; (d) global warming; (e) human health—noncancer; (f) human health—particulate matter; (g) ozone depletion; (h) smog formation; (i) human health—cancer.
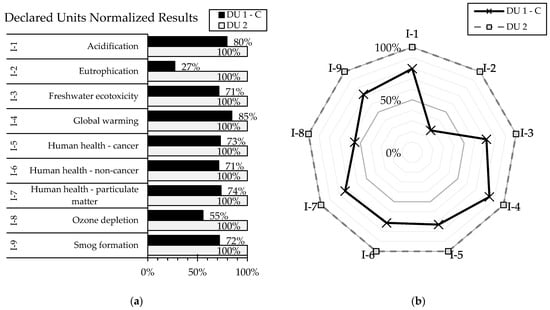
Figure 6.
Relative results for environmental impacts comparing declared units: (a) Percentage comparison for each impact category. (b) Radar chart comparison for each declared unit.
3.2. Functional Unit Comparison and Interpretation
For the functional unit comparison, equivalent to 1 m2 of pavement structure, the results of the environmental life-cycle impact assessment are presented in Figure 7, divided into main upstream processes of the productive chain for each characterized impact.
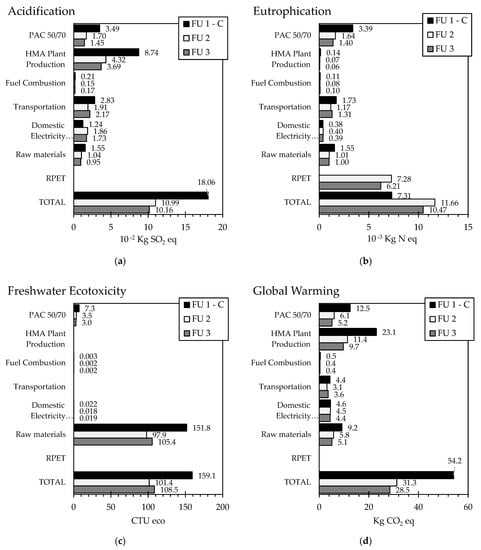

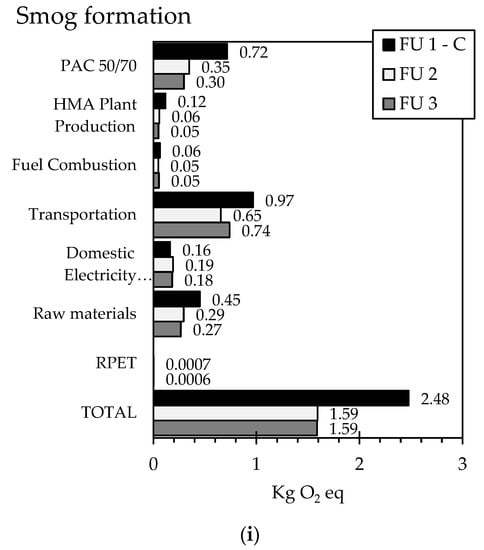
Figure 7.
Characterized results of the environmental impact assessment for the functional units, divided by main upstream processes and total result: (a) acidification; (b) eutrophication; (c) freshwater toxicity; (d) global warming; (e) human health—noncancer; (f) human health—particulate matter; (g) ozone depletion; (h) smog formation; (i) human health—cancer.
The processes contribution for each impact category allows for a sensibility assessment that each activity from the pavement production chain will have on the overall environmental impact. The asphalts binder production process (PAC 30/45) is the main contributor to particulate matter impact, and second major contributor for acidification, eutrophication, global warming, and smog formation. The HMA plant production is the main contributor for acidification and global warming potential. Transportation accounts as the major smog formation contributor. The recycled post-consumer PET processes are highlighted as the major contributors for eutrophication impact, and the raw materials extraction and processing represents the major contributor for freshwater ecotoxicity, human health cancer, and noncancer.
In contrast with the declared unit environmental impact assessment, the functional unit considers the pavement structure design and functional parameters. This allows for thickness-optimized structures for each square meter of pavement and results in the following internal normalized comparison charts presented in Figure 8.
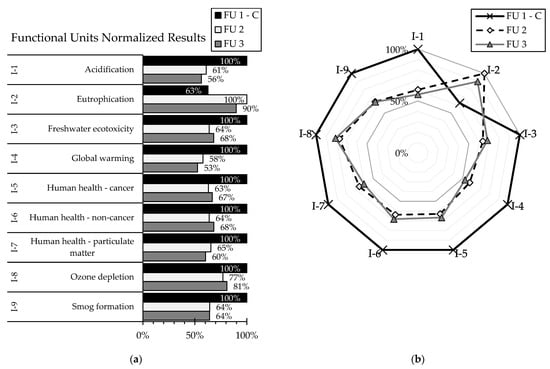
Figure 8.
Relative results for environmental impacts comparing functional units: (a) Percentage comparison for each impact category. (b) Radar chart comparison for each functional unit.
The pavement structures with HMA + RPET present an overall better environmental performance in all but one impact category. Both FU with HMA + RPET proposed (FU 2 and FU 3) resulted in similar performance on average, with savings in important impact categories such as global warming potential, with 58% and 53%, respectively, of equivalent carbon dioxide emissions in comparison with the FU 1 with the conventional HMA mix.
Increased relative eutrophication impact is presented in both RPET mixes due to the impact on the increase of chemical and biochemical oxygen demand attributed to the mechanical recycling process of post-consumer PET in both air and water.
4. Discussion
The declared unit’s LCA takes as the system’s boundary the production of one ton of HMA as the comparative representative unit. The importance of this analysis perspective is to compare such production without considering each mix’s functional parameters and serving as a standpoint for any asphalt concrete production facility for their own environmental product declaration. Under the same upstream input and output conditions, a conventional HMA mix presents better overall environmental performance and wastes than one with RPET.
The functional unit’s LCA expands the system’s boundary up to the construction phase, proposing three pavement structures with the same functional qualities for traffic demand and durability. The variant pavement structures for the HMA + RPET mixes were considered with and without a subbase course in the design software procedure to evaluate the sensitivity of such mixes to a variance in layer stiffness. The analyses resulted in a thicker HMA + RPET surface course for the FU—2, without subbase course.
Considering the better mechanical properties and overall functional performance of the HMA + RPET mixes for the surface course, the functional unit comparison resulted in savings in almost all environmental impact categories for each square meter of pavement constructed and ready to use, with an overall layer thickness optimization effect that carries a cascade of upstream resource and emissions savings. These results agree with the literature when comparing a single impact category within LCA studies with a similar scope. Table 5 and Figure 9 present the comparison of global warming potential score for 1 m2 of different asphalt pavement structures using waste materials such as recycled polymer, crumb rubber, and reclaimed asphalt pavement (RAP), in contrast with the functional units of this study. Differences in system boundaries materials, data quality, and technical and temporal context may prevent a direct linear comparison rule, but allows for the validation of the LCIA results as they fit within the same order of magnitude.

Table 5.
Global warming potential score of the different asphalt pavement structures considered in this study compared to the scores reported by the existing literature on the LCA of the use of waste materials. Key: HMA—hot mix asphalt; RP—recycled polymer; W—wearing course; Bi—binder layer; Ba-base; S—standard HMA structure; Wg—rubberized gap-graded mixture; Wgr—rubberized gap-graded mixture with RAP.
| Ref. | ID | Description | Layer Thickness (cm) | GWP (kg CO2 eq/m2) | Life Cycle Phases Considered | ||
|---|---|---|---|---|---|---|---|
| Surface Course | Binder Layer | Base Layer | |||||
| This study | FU 1 − C | Conventional HMA pavement | 15 | 22 | 54.165 | Pavement construction | |
| FU 2 | HMA + RPET | without subbase | 7.5 | 20 | 31.283 | |||
| FU 3 | HMA + RPET | 6.4 | 20 | 28.489 | |||
| [5] | W(HMA); Bi(HMA); Ba(HMA) | Conventional HMA pavement | 4 | 5 | 20 | 63.577 | |
| W(HMA); Bi (HMAPMB); Ba(HMA) | Modified HMA binder layer with RP in “wet” process | 64.518 | |||||
| W(HMA); Bi(HMAPMA); Ba(HMA) | Modified HMA binder layer with RP in “dry” process | 63.792 | |||||
| [26] | S | Standard pavement | 5 | 43.368 | Pavement construction and maintenance | ||
| Wg | Rubberized gap-graded mixture | 3 | 24.105 | ||||
| Wgr | Rubberized gap-graded mixture with RAP | 3 | 23.263 | ||||
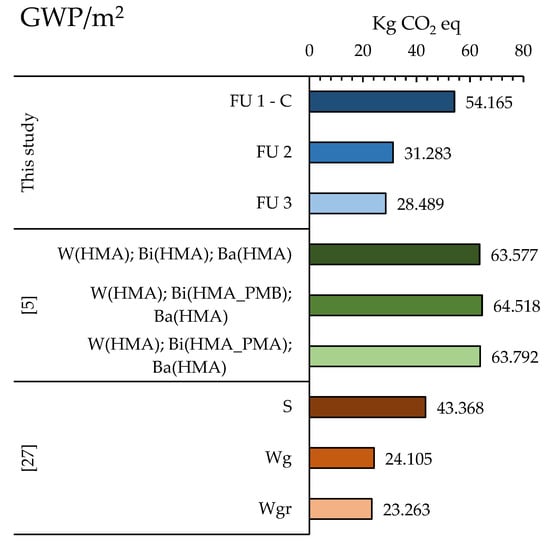
Figure 9.
GWP score comparison for different asphalt pavement structures considered in this study compared to the scores reported by the existing literature on the LCA of the use of waste materials.
Taking into consideration the weighting criteria, the environmental score contribution per category and the total score for the declared and functional units are presented in Figure 10.
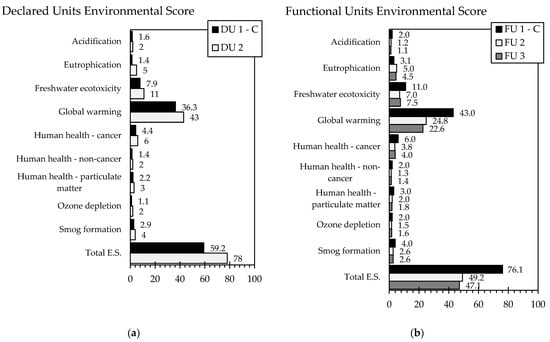
Figure 10.
Environmental score: (a) declared units and (b) functional units; divided by category contribution and total score.
For the declared units, the conventional mix (DU 1 − C) resulted in a lower ES of 59.2, in comparison to the HMA + RPET mix (DU 2), with an ES of 78. This represents a difference of 18.8 score points, or 24.10% of overall environmental savings. In terms of global warming potential, the use of RPET in the HMA mixes increased the impact by 18.45% (or 6.7 ES) in comparison with the conventional mix.
For the functional units, the HMA + RPET pavement structures (FU 2 and FU 3) resulted in lower environmental scores of 49.2 and 47.1, respectively, representing a difference of 26.9 and 29 score points in comparison to the conventional pavement structure (FU 1 − C). It represents 38% of overall environmental savings in terms of the environmental score in favor of the sustainable pavement alternatives. In terms of global warming potential, the use of RPET in the HMA mixes for pavement design can result in savings up to 47.44% of impact decrease (20.4 ES) in comparison with the conventional-mix pavement structure proposal. As such comparison comes with an implicit design procedure, it can serve as a standpoint for government agencies, developers, and pavement engineers that aim for more sustainable construction developing the pavement environmental performance for a major roadway project.
Limitations and Challenges
The limitations and challenges for the present study are the following:
- Allocation criteria and circular economy of RPET. A cut-off rule was applied for the RPET to avoid a double counting on environmental savings, considering only the reclamation activities, from recollection of plastic waste, sorting, cleaning, grinding, and milling. Such processes imply a possible downcycling of the material. Although the current market for reclamation of RPET aims for a second life as resin ready-to-bottle, competing in quality with virgin resin, the use of the RPET as a pavement material may not have a market acceptance, as it will not have the same residual value for reclamation activities. The value of reclaimed asphalt with RPET inclusion and the potential environmental impacts that such reclamation may carry [14] are currently unknown. This same situation puts the assumption of the material being “on-demand” for the project in risk.
- Operation phase. Due to the novelty of the use of RPET in asphalt mixtures, the environmental impacts that will carry during the operation phase are currently uncertain, with concerns for generation of micro or nano plastics (MP and NP) due to surface wearing or health hazards for workers during pavement reclamation and recycling [14]. Studies have been developed on the nano plastics generation potential, but it has proven to be difficult to evaluate the release of MPs on real roads, due to the number of external variables and lack of specialized essays [27].
- Dependence on secondary data, data quality, and availability. The quality of an LCA study depends on the data used, the source, and quality seal. The use of secondary data is implemented to fill the gaps on primary data on the subject, the location, and established systems boundaries. The present study relies on the secondary data provided in public databases and may carry internal errors that are periodically addressed. To assess the data quality for the main processes in the present LCA, the data were revised and checked on each respective original source and reference.
- Pavement design methodology. The pavement design methodology implements a mechanistic–empirical approach for an elastic multilayer case. Calibrations and optimizations on the software for the studied materials may results in pavement structures that may differ with those currently obtained for the present LCA but will not change the overall environmental savings tendency obtained.
5. Conclusions
The proposal of new construction materials or new composites for civil construction or pavements should be assessed for their life-cycle environmental impacts, alongside their transport-related mechanical and functional parameters. This is due to the non-triviality of the environmental performance of any new material, as it can have a strong upstream cascade effect for any impact category. The LCA methodology demands the analyst establish a closed system boundary and conditions, making any LCA results subject to interpretation and subsequent adaptations for any real-life project proposal.
The present study marks a standpoint for pavement researchers on new sustainable materials, as it sustains the hypothesis of the RPET as a promising HMA optimizer for both mechanical parameters and environmental performance. Its use can result in a decrease up to 38% of overall environmental savings in terms of the environmental score in favor of the sustainable pavement alternatives. Concerning the impact on global warming potential, the use of RPET in the HMA mixes for pavement design can result in savings up to 47.44% of impact decrease (20.4 ES) in comparison with the conventional-mix pavement structure proposal.
For every single square meter of sustainable pavement constructed with HMA + RPET and taking a mass of 57 g for each PET bottle discarded, it represents usage of an equivalent of approximately 87 PET bottles. For a 1 km, two lane (7.00 m wide) roadway paved with these sustainable mixes, it represents 34.713 t of RPET, equivalent to 609,000 discarded PET bottles.
Based on the results and discussions of this study, the following key recommendations are proposed:
- Further analysis with more pavement combinations is proposed considering the promising savings in environmental impacts for sustainable pavement with RPET.
- System expansion, temporal analysis, and consideration of the operation phase will support the sustainable pavement hypothesis, and a consequential LCA approach is recommended to assess the market response and effects of the RPET new lifecycle and destination.
Supplementary Materials
The following supporting information can be downloaded at: https://www.mdpi.com/article/10.3390/su15021102/s1, Table S1: Index for cost compositions from SICRO—Brasilia, Federal District, Brazil. Table S2: Index for equipment efficiency data from SICRO—Brasilia, Federal District, Brazil. Table S3: Dataset of cost composition. Table S4: Declared units life-cycle impact assessment results. Table S5: Functional units life-cycle impact assessment results. Table S6: Dataset of life-cycle impact assessment results divided by processes. Table S7: Life cycle inventory of declared unit 1. Table S8: Life cycle inventory of declared unit 2. Table S9: Life cycle inventory of functional unit 1. Table S10: Life cycle inventory of functional unit 2. Table S11: Life cycle inventory of functional unit 3.
Author Contributions
Conceptualization, M.D.T.C.; methodology, M.D.T.C. and M.R.R.O.; software, M.R.R.O.; validation, M.R.R.O.; data curation, M.R.R.O.; writing—original draft preparation, M.R.R.O.; writing—review and editing, M.D.T.C. and M.R.R.O.; supervision, M.D.T.C.; project administration, M.D.T.C.; funding acquisition, M.D.T.C. All authors have read and agreed to the published version of the manuscript.
Funding
The APC was funded by the University of Brasília and the National Council for Scientific and Technological Development (CNPq), with process number 405486/2022-7.
Institutional Review Board Statement
Not applicable.
Informed Consent Statement
Not applicable.
Data Availability Statement
Publicly available datasets were analyzed in this study. These data can be found here: https://www.lcacommons.gov/lca-collaboration/ (accessed on 7 June 2022) for Federal Highway Administration/MTU Asphalt Pavement Framework.
Acknowledgments
The authors wish to express their gratitude for the financial support provided by the Brazilian government through the National Council for Scientific and Technological Development (CNPq) for the Productivity Research and Master scholarships.
Conflicts of Interest
The authors declare no conflict of interest.
Appendix A
This section presents the product and material descriptions and specification used for the present LCA.

Figure A1.
RPET format for use in pavement variants: (a) flake form of 10 mm nominal size; (b) micronized form of 0.42 mm nominal size.

Figure A2.
Aggregates used for sustainable pavement with RPET: (a) gravel 1; (b) gravel 0; (c) rock filler.

Table A1.
Characterization of the asphalt binder as reported in [20].
Table A1.
Characterization of the asphalt binder as reported in [20].
| Property | Standard MethodASTM/Brazilian | Result | Brazilian Specification |
|---|---|---|---|
| Specific Gravity | D 70/DNER ME 193 | 1.01 | |
| Penetration (10−1 mm) | D5/DNIT 155 | 36 | 30 to 45 |
| Softening Point (°C) | D 36/DNIT 131 | 52 | ≥52 |
| Flash Point (°C) | D 92/NBR 11,341 | 348 | >235 |
| Brookfield Viscosity 135 °C | D 4402/NBR 15,184 | 472.5 | >374 |
| Brookfield Viscosity 150 °C | D 4402/NBR 15,184 | 227 | >203 |
| Brookfield Viscosity 177 °C | D 2872/NBR 15,235 | 81.5 | 76 to 285 |
| RTFOT—% Weight Range | D 2872/NBR 15,235 | −0.09 | <0.5 |
| RTFOT—Residual Penetration (%) | D 5/DNIT 155 | 69 | >60 |
| RTFOT—Softening Point Increase (°C) | D 36/DNIT 131 | 4 | <8 |

Table A2.
Properties of aggregates for HMA designs as reported in [20].
Table A2.
Properties of aggregates for HMA designs as reported in [20].
| Property | Standard MethodASTM/Brazilian | Gravel 1 | Gravel 0 | Rock Filler | Brazilian Specification |
|---|---|---|---|---|---|
| Bulk Specific Gravity | ASTM C 127/DNIT 313 | 2.7 | 2.8 | 2.74 | - |
| Apparent Specific Gravity | ASTM C 127/DNIT 411 | 2.6 | 2.1 | - | - |
| Los Angeles Abrasion (%) | ASTM C 131/DNER 035 | 23 | 35 | <40 | |
| Sand Equivalent (%) | ASTM D 2419/DNER 054 | - | - | 78 | >35 |
| Absorption | ASTM C 127/DNIT 413 | 0.75 | 0.80 |
References
- Ben Zair, M.M.; Jakarni, F.M.; Muniandy, R.; Hassim, S. A Brief Review: Application of Recycled Polyethylene Terephthalate in Asphalt Pavement Reinforcement. Sustainability 2021, 13, 1303. [Google Scholar] [CrossRef]
- Colangelo, F.; Forcina, A.; Farina, I.; Petrillo, A. Life Cycle Assessment (LCA) of Different Kinds of Concrete Containing Waste for Sustainable Construction. Buildings 2018, 8, 70. [Google Scholar] [CrossRef]
- Gravina, R.J.; Xie, T.; Bennett, B.; Visintin, P. HDPE and PET as Aggregate Replacement in Concrete: Life-cycle assessment, Material Development, and a case study. J. Build. Eng. 2021, 44, 103329. [Google Scholar] [CrossRef]
- Movilla-Quesada, D.; Lagos-Varas, M.; Raposeiras, A.C. Analysis of greenhouse gas emissions and the environmental impact of the production of asphalt mixes modified with recycled materials. Sustainability 2021, 13, 8081. [Google Scholar] [CrossRef]
- Oreto, C.; Russo, F.; Veropalumbo, R. Life Cycle Assessment of Sustainable Asphalt Pavement Solutions Involving Recycled Aggregates and Polymers. Materials 2021, 14, 3867. [Google Scholar] [CrossRef] [PubMed]
- Silva, T.R.; Azevedo, A.R.G.; Cecchin, D. Application of plastic wastes in construction materials: A review using the concept of life-cycle assessment in the context of recent research for future perspectives. Materials 2021, 14, 3549. [Google Scholar] [CrossRef] [PubMed]
- Fangueiro, R. Fibrous and Composite Materials for Civil Engineering Applications; Woodhead Publishing Series in Textiles Number 104; Woodhead Publishing Limited: Cambridge, UK, 2011. [Google Scholar]
- ISO 14040:2006; Environmental management—Life cycle assessment—Requirements and guidelines. ISO: Geneva, Switzerland, 2010. Available online: https://www.iso.org/obp/ui/#iso:std:iso:14040:ed-2:v1:en (accessed on 30 July 2022).
- ISO 14044:2006; Environmental management—Life cycle assessment—Requirements and guidelines. ISO: Geneva, Switzerland, 2010. Available online: https://www.iso.org/obp/ui/#iso:std:iso:14044:ed-1:v1:en (accessed on 30 July 2022).
- Federal Highway Administration/MTU Pavement: LCI Repository. Available online: https://www.lcacommons.gov (accessed on 7 June 2022).
- Shen, L.; Worrell, E.; Patel, M.K. Open-loop recycling: A LCA case study of PET bottle-to-fibre recycling. Resour. Conserv. Recycl. 2010, 55, 34–52. [Google Scholar] [CrossRef]
- Rangelov, M.; Dylla, H.; Sivaneswaran, N. Life-Cycle Assessment of Asphalt Pavements with Recycled Post-Consumer Polyethylene. Transp. Res. Rec. 2021, 2675, 1393–1407. [Google Scholar] [CrossRef]
- Mascarenhas, Z.M.; Piao, Z.; Vasconcelos, K.L.; Poulikakos, L.D.; Bernucci, L.L. Comparative environmental performance of pavement structures considering recycled materials and regional differences. Sci. Total Environ. 2022, 858, 159862. [Google Scholar] [CrossRef] [PubMed]
- Santos, J.; Pham, A.; Stasinopoulos, P.; Giustozzi, F. Recycling waste plastics in roads: A life-cycle assessment study using primary data. Sci. Total Environ. 2021, 751, 141842. [Google Scholar] [CrossRef] [PubMed]
- Inti, S.; Sharma, M.; Tandon, V. An Approach for Performing Life Cycle Impact Assessment of Pavements for Evaluating Alternative Pavement Designs. Procedia Eng. 2016, 145, 964–971. [Google Scholar] [CrossRef]
- Sackey, S.; Lee, D.-E.; Kim, B.-S. Life Cycle Assessment for the Production Phase of Nano-Silica-Modified Asphalt Mixtures. Appl. Sci. 2019, 9, 1315. [Google Scholar] [CrossRef]
- Mashaan, N.; Chegenizadeh, A.; Nikraz, H. Laboratory Properties of Waste PET Plastic-Modified Asphalt Mixes. Recycling 2021, 6, 49. [Google Scholar] [CrossRef]
- Ferreira, J.W.S.; Marroquin, J.F.R.; Felix, J.F.; Farias, M.M.; Casagrande, M.D.T. The feasibility of recycled micro polyethylene terephthalate (PET) replacing natural sand in hot-mix asphalt. Constr. Build. Mater. 2022, 330, 127276. [Google Scholar] [CrossRef]
- Brazilian Energy Balance 2020 Technical Report Year 2019/Empresa de Pesquisa Energética–Rio de Janeiro: EPE, 2020. 292 p.: 182 ill.: 23 cm. Available online: https://www.epe.gov.br/sites-pt/publicacoes-dados-abertos/publicacoes/PublicacoesArquivos/publicacao-479/topico-528/BEN2020_sp.pdf (accessed on 30 July 2022).
- Carvalho, L.M.C.; Casagrande, M.D.T. Influence of Coconut Fibers on the Shear Strength Parameters of a Sandy Soil. In Proceedings of the EGRWSE 2019–Environmental Geotechnology, Recycled Waste Materials and Sustainable Engineering, Chicago, IL, USA, 16–20 June 2019. [Google Scholar]
- Arao, M.; Casagrande, M.D.T.; Guimaraes, A.C.R. Evaluation of the Mechanical Behavior of Asphalt Mixtures with Crushed Polyethylene Terephthalate (PET) Insertion. J. Paviment. 2017, 45, 36–53. [Google Scholar]
- MeDiNa Software. Available online: https://www.gov.br/dnit/pt-br/assuntos/planejamento-e-pesquisa/ipr/medina (accessed on 1 July 2022).
- Bare, J. TRACI 2.0: The tool for the reduction and assessment of chemical and other environmental impacts 2.0. Clean Technol. Environ. Policy 2011, 13, 687–696. [Google Scholar] [CrossRef]
- OpenLCA® Software. Available online: https://www.openlca.org/download/ (accessed on 8 April 2022).
- Gloria, T.P.; Lippiatt, B.C.; Cooper, J. Life cycle impact assessment weights to support environmentally preferable purchasing in the United States. Environ. Sci. Technol. 2007, 41, 7551–7557. [Google Scholar] [CrossRef]
- Farina, A.; Zanetti, M.C.; Santagata, E.; Blengini, G.A. Life cycle assessment applied to bituminous mixtures containing recycled materials: Crumb rubber and reclaimed asphalt pavement. Resour. Conserv. Recycl. 2017, 117, 204–212. [Google Scholar] [CrossRef]
- Enfrin, M.; Myszka, R.; Giustozzi, F. Paving roads with recycled plastics: Microplastic pollution or eco-friendly solution? J. Hazard. Mater. 2022, 437, 129334. [Google Scholar] [CrossRef] [PubMed]
Disclaimer/Publisher’s Note: The statements, opinions and data contained in all publications are solely those of the individual author(s) and contributor(s) and not of MDPI and/or the editor(s). MDPI and/or the editor(s) disclaim responsibility for any injury to people or property resulting from any ideas, methods, instructions or products referred to in the content. |
© 2023 by the authors. Licensee MDPI, Basel, Switzerland. This article is an open access article distributed under the terms and conditions of the Creative Commons Attribution (CC BY) license (https://creativecommons.org/licenses/by/4.0/).