Article

Intensification of Rice-Fallow Agroecosystem of South Asia with Oilseeds and Pulses: Impacts on System Productivity, Soil Carbon Dynamics and Energetics

1
ICAR Research Complex for Eastern Region, Farming System Research Centre for Hill and Plateau Region, Plandu, Ranchi 834 010, Jharkhand, India
2
ICAR Research Complex for Eastern Region, Patna 800 014, Bihar, India
3
ICAR Directorate of Weed Research, Jabalpur 482 004, Madhya Pradesh, India
4
ICAR Indian Institute of Soil Science, Nabibagh, Bhopal 462 038, Madhya Pradesh, India
5
ICAR Research Complex for NEH Region, Lembucherra 799 210, Tripura, India
6
ICAR Indian Agricultural Research Institute, New Delhi 110 002, India
7
ICAR Research Complex for NEH Region, Umiam 793 103, Meghalaya, India
8
Natural Resource Management Division, Krishi Anusandhan Bhawan-II, Pusa, New Delhi 110 012, India
9
Natural Resource Management, ICAR Headquarters, New Delhi 110 002, India
*
Author to whom correspondence should be addressed.
Sustainability 2023, 15(2), 1054; https://doi.org/10.3390/su15021054
Submission received: 2 December 2022 / Revised: 22 December 2022 / Accepted: 3 January 2023 / Published: 6 January 2023
(This article belongs to the Special Issue Agrifood Production and Conservation Agriculture)

Abstract

:
Rice-fallow systems in South Asian countries play a pivotal role in increasing agricultural production. However, the productivity of these system is largely challenged by deteriorating soil health and limited residual soil moistures in dry-periods, precluding the possibility of winter and/or spring season crops after rice harvest. This investigation explores the possibilities of including winter and/or spring crops through conservation agriculture (CA)-based management practices and evaluates its effect on soil carbon dynamic, system productivity, energy and carbon budgeting. Field experiments were conducted at a farmer’s field in participatory modes at Chene Village, Jharkhand, India, and had five treatments comprising (1) fallow-land [FL]; (2) transplanted puddle rice (TPR)-fallow (winter)-fallow (summer), a typical cultivation practice of this region [RF]; (3) TPR–conventional-till mustard–conventional-till blackgram [CP]; (4) CA with zero-till transplanted rice (ZTTR)-ZT mustard–ZT blackgram [CA1]; (5) CA with zero-till direct seeded rice (ZTDSR)-ZT mustard–ZT blackgram [CA2]. Results revealed that CA2 comprising full CA practice of growing direct seeded rice, mustard and blackgram under ZT increased total soil organic carbon (TSOC) of 0–0.6 m soil layer by 14.3% and 10.3% over RF and CP, respectively. The C-sequestration rate was higher in CA treatments and varied from 0.55 to 0.64 Mg C ha−1 year−1. The system rice equivalent yield in CA2 during the initial four years was lower than CP but it was 23.7% higher over CP in fifth year. The CA-based system (CA2) enhanced the water productivity of rice, mustard and blackgram by 7.0%, 23.6% and 14.1% over CP, respectively. The CA2 treatment, having higher system productivity, better C-sequestration potential, lower C-footprint, higher energy and water productivity has very good potential for sustaining soil health and crop yield of rice-fallow systems.

1. Introduction

As per estimates, the world population will be 9.7 billion by 2050 [1]. The requirement of food is also supposed to rise by 56% by that time [2]. One of the major goals of agriculture is to feed the burgeoning population and to attain food as well as nutritional security. The scope of the horizontal expansion of agriculture is limited due to land shortage and, therefore, an additional food demand must be met by vertical expansion, i.e., by increasing the cropping intensity and productivity of existing agricultural land. Rice-fallow is an important cropping system in South Asia covering an area of 22.3 M ha, and ~18.0 M ha of that area comes from India [3]. Under that production system, only rice is taken as a rainfed crop in the rainy season depending on monsoonal rains, and the land remains fallow for the rest of the period. Hence, those areas have huge potential for increasing crop production and can play a pivotal role in regional food security. The uncertainty of monsoon rain is a serious issue in attaining a secured yield. The adoption of different resource conservation technologies (RCTs) could be a potential alternative in attaining the sustainable productivity and higher cropping intensity in the region [4].
Rice (Oryza sativa L.), largely cultivated by transplanting in rainfed conditions during the southeast monsoon season, is a staple food crop of the eastern region of India. Puddling, i.e., tillage in standing water, is extensively practiced for rice transplanting, which minimizes percolation losses, suppresses weed growth and improves plant nutrient availability [5]. However, puddling is known to degrade the soil health by the formation of hardpan in the sub-soil, destroying soil aggregation and decreasing the population of beneficial microorganisms, thus reducing crop yields of subsequent post-rainy crops in rice-fallows [6]. Puddled soil becomes very hard upon drying and restricts the root growth of succeeding crops, thereby limiting the utilization of the residual soil moistures [7]. Ploughing, coupled with the removal of crop residue, rapidly depletes SOC pools in comparison to the natural ecosystem [8].
India’s Eastern Hill and Plateau eco-region is a less developed region [6] and, therefore, has a great scope for improvement in food production by the adoption of scientific agricultural practices. Over the generations, rice is generally grown in this region during the wet season (mid-June to October) in the lowlands. However, the rice production has now been shifted to terraced hill-slopes (medium land), where rice is grown as a monocrop rice-fallow system caused by increasing population pressure [6]. Paddy yields in these regions are poor (<2.0 t ha−1) and, due to the heavy dependence on rainfall, the crop is frequently prone to vagaries of the drought despite high annual precipitation (>1200 mm) [9]. Declining soil health, irregularities in monsoonal rain, lack of irrigation facility, low residual soil moistures, prevalence of long-duration rice variety and free grazing/poor socio-economic conditions of farmers are major issues leading to the unsustainability of the rice-fallow system in the region [10,11,12,13]. The continuous cultivation of rainfed rice during the wet season followed by fallow during the winter and summer periods in this region without the use of conservation-effective measures resulted in accelerated soil erosion and depletion of the SOC [14]. Therefore, immediate attention is required for the identification of suitable management and to devise a practical solution for improving soil quality, water productivity and sustainability of the rice-fallow system.
Conventional agriculture, which favors repeated tillage operation, intensive fertilizer application, water use and crop residue removal, has increased crop productivity by more than three times in the past century [15]. However, use of the synthetic fertilizers and pesticides in conventional tillage has been responsible for degrading soil quality, eutrophicating water resources and causing biodiversity losses [16]. On the contrary, CA depends on the principles of minimum soil disturbances, permanent soil covers of crop residue or covering crops and crop rotations [17], which is often promoted as an environment-friendly alternative to the conventional tillage system [18]. No-tillage (NT), a central component of CA, is one of the most cost-effective means to safeguard and recuperate the soil resources [19]. Soil fertility in NT is reported to improve due to the reutilization of residue, increased microbial activity and a reduction in erosion due to the simultaneous decline in the requirement of synthetic fertilizers and, thus, circuitously protect the environment from radiative forces through the sequestration of carbon and nitrogen [20]). NT also requires fewer inputs and had slightly lower or even comparable yields than the conventional tillage system [17]. Time-based yield stability in NT is similar to that obtained under conventional tillage (CT) and, thus, a transition from CT to NT is possible without having yield penalties [18].
Long-duration rice (150–160 day) varieties often delay the planting of winter crops, which aggravates the soil moisture and temperature stress, leading to reduced yields. To enhance crop yields and the yield stability of succeeding winter crops after rice, CA is presently being emphasized in rice-fallow systems [21]. Energy and carbon budgeting of different CA-based production systems are extremely reliant on the type of tillage operation, crop residue and choice of crops. This calls for precise and accurate assessments of the energy and carbon budget of diversified CA-based cropping systems in the Eastern Hill and Plateau region. This will facilitate the designing of better energy- and carbon-efficient cropping systems in this region.
In the scenario of global climate change, low carbon-emitting and low energy-input farming systems are given paramount importance. Systematic studies on comparative evaluation of the different cropping systems in terms of carbon and energy intensiveness in diverse RCTs are not available for the Eastern Plateau and Hill region of India. The quantifications of the carbon pools, water and energy productivity and system productivities would be useful in the selection of better cropping systems and their management practices in the Eastern Plateau and Hill Region of India. In this context, the present study was conducted in a participatory mode for evaluating the feasibility of second and/or third crops in an extreme rice-fallow region and the impacts of RCTs on soil property. It has been reported that including short duration cultivars of pulses/oilseeds along with anchored residues could be a better alternative to reduce adverse effects of production systems on soil and the environment [22]. Keeping this in view, the present investigation was aimed at the inclusion of a medium-duration rice variety followed by short duration oilseeds/pulses in the existing rice-fallow systems to evaluate their response to carbon footprints, water, energy and system productivity under different conventional and RCT-based management practices. The current investigation hypothesized that the intensification of the rice-fallow system using RCTs will lead to (1) an improvement in overall system productivity by including second and/or third crops; (2) an improvement in soil health vis-à-vis carbon dynamics; and (3) enhancement in water, energy and carbon efficiency.

2. Materials and Methods

2.1. Experimental Sites

A field trial was conducted at a farmer’s field in a participatory mode in Chene Village, Jharkhand, India (23°17′05″ N latitude and 85°25′59″ E longitude, altitude 648 m amsl) from 2015 to 2020 (Figure 1). The experimental soil was alfisol with an acidic nature (pH = 5.13) and sandy loam in texture (67.5% sand, 20.3% silt and 12.2% clay). The soil organic carbon (SOC) content before experimentation was 4.1 g kg−1 in 0–15 cm soil layer. The soil was low in available nitrogen (105.3 kg ha−1) [23], low in available phosphorus (4.82 kg ha−1) [24] and medium status in available potassium (190.4 kg ha−1) [25]. The experimental site is characterized by a hot and sub-humid climate with an average annual precipitation of 1350 mm, out of which 80–90% is received during the rainy cropping season (June to September).

2.2. Experiment Details

The study region has three main cropping seasons coinciding with rainy (July–October), winter (November–February) and summer (March–June) seasons. To match with these cropping seasons, the present experiment had five treatments as (1) fallow land (FL) in all three seasons (2), conventional practice with a rice-fallow–fallow cropping system (RF), (3) conventional practice with a rice–mustard–blackgram system (CP), (4) transplanted rice (TPR)–mustard–blackgram system under conservation agriculture practice (CA1) and (5) direct sown rice (DSR)–mustard–blackgram system under a conservation agriculture practice (CA2). In both the conservation agriculture (CA) treatments, all three principles of conservation agriculture, i.e., soil coverage with crop residue, crop rotation and minimum disturbance to soil with the adoption of zero tillage (ZT) practice were used in all the three crops.
As per conventional practices followed in the region, mustard and blackgram crops in CP were sown using broadcasting methods, while in both CA methods (CA1 and CA2), these crops were sown with ZT with residue retentions of the previous crop. Experiments were laid out in a randomized block design (RBD) with five replications (each plot size was 200 m2). Treatment-specific details of various field operations are indicated in Supplementary Table S1. Soil samples were collected from the fallow plot (FL) where no cultivation was performed. Observations from this fallow plot were taken as reference to facilitate the computation of indices related to carbon stock and carbon dynamics.
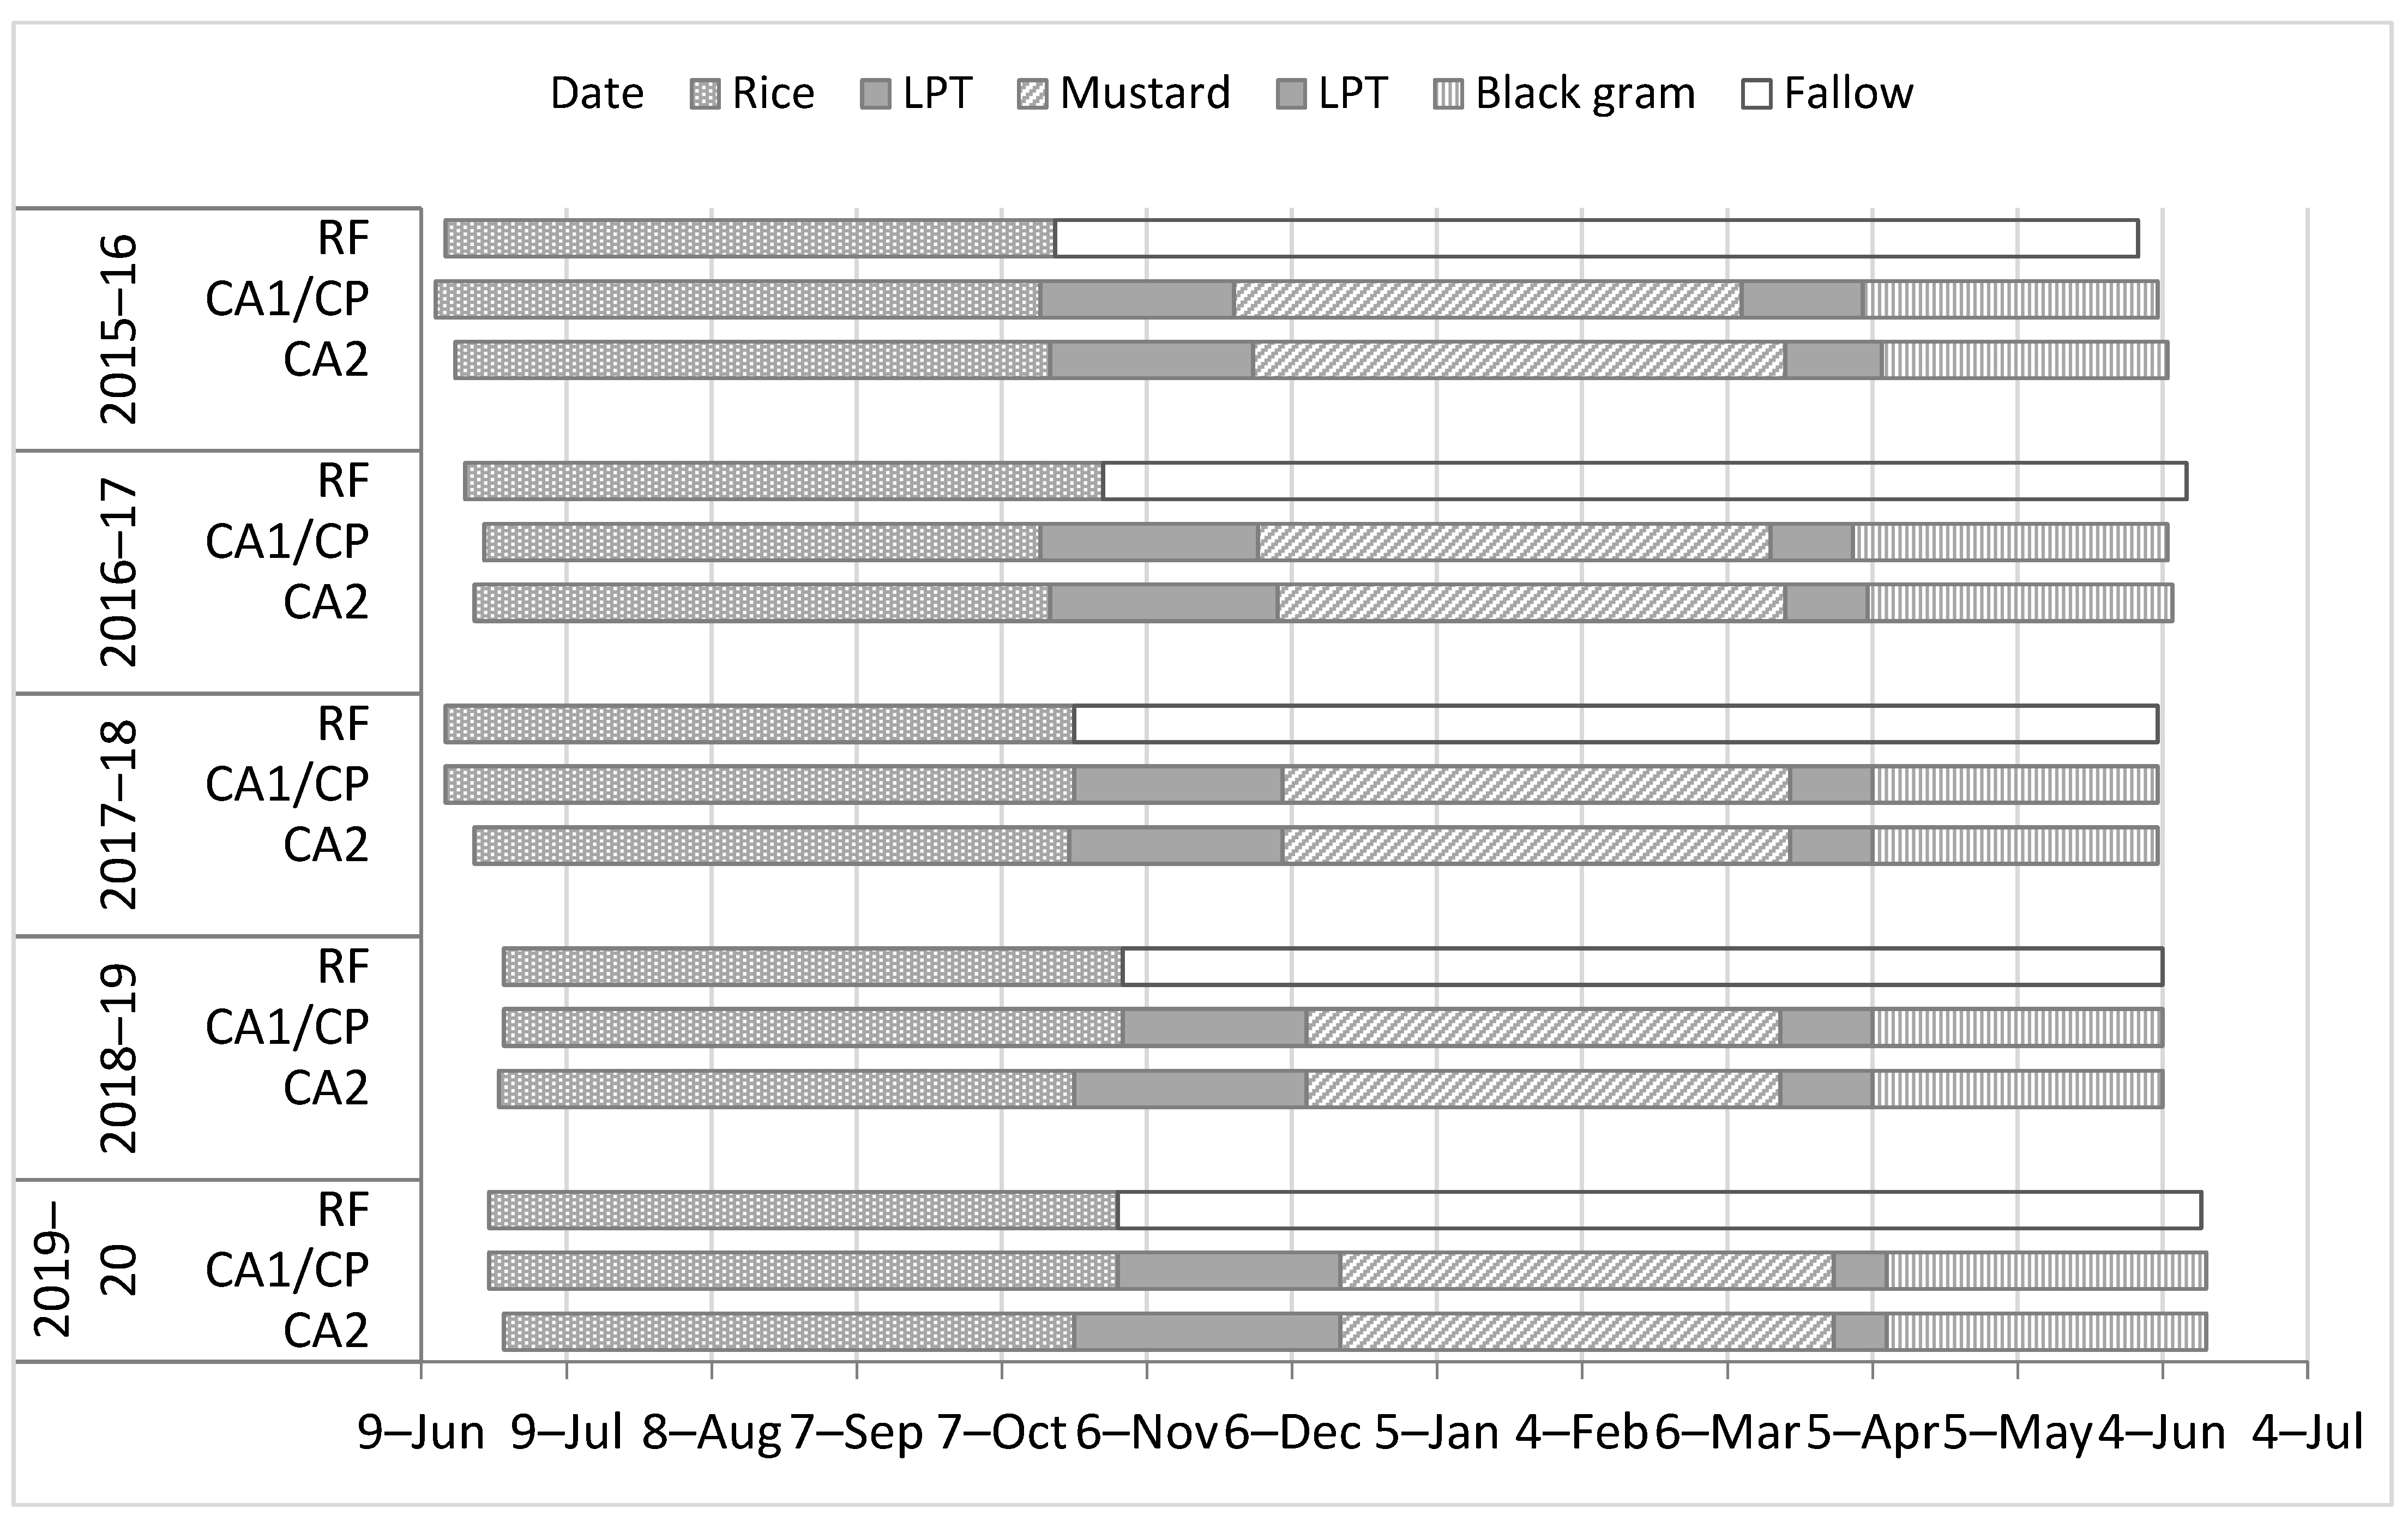
The medium-duration rice variety “Naveen” (130 days) was grown in all the treatments during wet season. About 21-day old seedlings were transplanted (2 seedlings per hill) in first fortnight of June with a plant spacing of 20 cm × 15 cm in RF, CP and CA1 treatments, while in CA2, having ZTDSR, rice was sown directly by ZT-fertilizer-cum-seed drill using seeding rates of 25 kg ha−1 with a row-spacing of 20 cm. Date of paddy planting in CA2 was same as that of nursery sowing date for RF, CP and CA1. In CA1, having ZTTR treatment, plots were ponded with a water depth of 5 cm and then rice seedlings were transplanted with dibbler in the soft top layers of soil without puddling. Cropping calendar for the experimental years of 2015–2020 is presented in Figure 2. In general, DSR was sown 21 days before transplanted rice depending on rainfall situation of particular year.
Recommended doses of N–P2O5–K2O at 80–40–40 kg ha−1 were applied to rice crop [26]. Half dose of N and full doses of P2O5 and K2O were applied as basal and remaining half dose of fertilizer N was top dressed in two equal splits at tillering and at panicle initiation stages. After harvesting of paddy, pre-emergence application of glyphosate (41% EC) was performed @ 2 l ha−1 in CA1 and CA2 plots for managing weeds. Sowing of winter mustard (Pusa Mustard 30) having duration of 100–105 days was delayed to first fortnight of December mainly due to prevalence of prolonged high soil moisture after rice harvest. Recommended doses of N–P2O5–K2O for mustard were 40–20–20 kg ha−1, wherein half dose of N and full doses of P2O5 and K2O applied as basal and remaining half dose of N was top dressed at 45 DAS. Summer crops of blackgram (TAU–1) having 60–65 day duration were sown in first week of April and recommended dose of fertilizer (20:40:20 kg ha−1) was applied as basal dose. Applications of N, P2O5 and K2O were performed through urea, diammonium phosphate (DAP) and muriate of potash (MOP), respectively. Before the start of each cropping season, farmyard manure (FYM) was applied at 5 Mg ha−1 to each crop of rice, mustard and blackgram as basal. Accordingly, over the period of five years, 25 Mg ha−1 of FYM was added in RF, while 75 Mg ha−1 of FYM each was added to CP, CA1 and CA2 treatments.

2.3. Soil Sampling and Analysis

Composite soil samples (collected from seven randomly selected points in each plot) at depths of 0–0.15, 0.15–0.30, 0.30–0.45 and 0.45–0.60 m were collected during 2020 after harvest of summer crops. Soil samples were air-dried and passed through 2 mm sieve for analysis of soil organic carbon (SOC) and its fractions. Sub-samples of the collected soil were stored at 4 °C and were used later afresh (after no more than 24 h) for estimation of biological properties (soil microbial biomass carbon and dehydrogenase activity) of soil. A core sampler (5.0 cm diameter and 8.0 cm length) was used for the measurement of bulk density of soil of each layer of profiles from 0–0.15, 0.15–0.30, 0.30–0.45 and 0.45–0.60 m soil depth [27].

2.4. Total Soil Organic Carbon

Total carbon (TC) was analyzed by carbon-hydrogen-nitrogen-sulfur (CHNS) analyzer (Elementar Vario EL III, Hanau, Germany) following dry combustion method [28]. Total soil organic carbon (TSOC) [TC–inorganic carbon] stock at different soil depths was calculated by multiplying the respective SOC value with bulk density and depth of soil as given by [29],
TSOC stock =   SOC   × ρ × d × 10
where TSOCstock is TSOC stock (Mg ha−1), SOC is soil organic carbon (g kg−1), ρ is soil bulk density (Mg m−3) and d is depth of soil layer in m.
The carbon retention efficiency (CRE) under different treatments was calculated using the following formula [30],
C R E = d = 0 0.6 T S O C t r e a t m e n t T S O C f a l l o w T C I × 100
where CRE is carbon retention efficiency (%) and TSOCtreatment and TSOCfallow represent total SOC stock (Mg ha−1) from treatment plots (RF, CP, CA1, CA2) and fallow plot (FL), respectively. TCI is total carbon input expressed as Mg C ha−1, while 0.60 stands for soil depth expressed in m.
The carbon sequestration rate (CSR) in different treatments was calculated using the following formula given by [31],
C S R   Mg   ha 1   year 1 = d = 0 0.6 T S O C t r e a t m e n t T S O C f a l l o w N × 100
where CSR is carbon sequestration rate (Mg ha−1 year−1) and N is experimental year.
The residual carbon left in soil (CR) and C build-up in soil (CBS) in different treatments was estimated as follows [32]:
C R = d = 0 0.6 C t r e a t m e n t C f a l l o w
C B S = d = 0 0.6 C t r e a t m e n t C f a l l o w C f a l l o w × 100
where CR is residual carbon left in soil (Mg ha−1), CBS is carbon build-up in soil (%) and Ctreatment and Cfallow (Mg ha−1) represent carbon stock in the treatment plots (FP, CP, CA1, CA2) and fallow plot (FL), respectively.

2.5. Oxidizable Organic Carbon Fractions

Different fractions of TSOC were computed following the procedure of Walkley and Black method [33] using 5, 10 and 20 mL of concentrated H2SO4 resulting in 3-acid aqueous solution ratios of 0.5:1, 1:1 and 2:1 that corresponded to 12, 18 and 24 N H2SO4. The C-oxidized by 24 N H2SO4 is equivalent to oxidizable C-obtained by standard [34] method. The different fractions of TSOC were calculated as follows:
Very labile (VLC): organic carbon oxidizable by 12 N H2SO4;
Labile (LC): difference in organic carbon extracted between 18 and 12 N H2SO4;
Less labile (LLC): difference in organic carbon extracted between 24 and 18 N H2SO4;
Non-labile (NLC): difference between TSOC and organic carbon extracted with 24 N H2SO4.

2.6. Active and Passive Pools

Active pool (AP) of TSOC was estimated by adding VLC and LC, while passive pool (PP) represented the LLC and NLC.

2.7. Biological Properties of the Soil

The soil microbial biomass carbon (SMBC) was determined by chloroform fumigation method [35]. Soil microbial biomass carbon was calculated as follows,
S M B C = F c 0.45
where SMBC is the soil microbial biomass carbon (µg g−1) and Fc is the organic carbon extracted from 0.5 M K2SO4 from fumigated soil (µg g−1) minus organic carbon extracted from non-fumigated soil (µg g−1). Dehydrogenase activity (DHA) in soil was estimated by the methodology outlined by [36].

2.8. Crop Yield and System Rice Equivalent Yield (SREY)

Rice, mustard and blackgram were manually harvested, and biological yields from an area of 50 m2 were recorded. Grain yield was recorded after threshing and kept at ~12% (w/w) moisture content following sun drying. In CP treatment, the crops were harvested close to the ground level. In CA1 and CA2 treatments, rice, mustard and blackgram were manually harvested leaving bottom one-third of plants as crop residue in the field. Yields of all non-rice crop were converted into rice equivalent yield (REY) for computing system productivity [29].
R E Y = Y c × M S P c     M S P r
where REY is rice equivalent yield of non-rice crop (Mg ha−1), Yc is yield of non-rice crop (Mg ha−1), MSPc is minimum support price of non-rice crop in Indian rupees fixed by the Government of India (₹ Mg−1) and MSPr is the minimum support price of rice crop (₹ Mg−1).
S R E Y = Y r + R E Y w + R E Y s
Where, SREY is system rice equivalent yield (Mg ha−1), Yr is yield of rice (Mg ha−1), REYw is rice equivalent yield of winter crop (Mg ha−1) and REYs is rice equivalent yield of summer crop (Mg ha−1).

2.9. Energy Budgeting

Energy budgeting of different treatments considered in this study comprised of input energy assessed from the farm input used in various operations and output energy generated in grain and straw yield. The treatment-wise input was supplied and field operations was recorded for the fifth year of experimentation (Supplementary Table S2) when yield gain from CA systems started. In computing energy budgets, the amounts of inputs and field operations were multiplied with corresponding energy equivalents (Supplementary Table S3). The output energy (OE) was computed by multiplying grain and stover yield with their corresponding energy equivalent. Various energy input indicators were computed in rice-fallow system as suggested by various researchers [37,38,39]:
N E = O u t p u t   e n e r g y I n p u t   e n e r g y
E U E = O u t p u t   e n e r g y   I n p u t   e n e r g y  
E P Y e I n p u t   e n e r g y
S E = I n p u t   e n e r g y   S y s t e m   p r o d u c t i v i t y  
E P r = N e t   e n e r g y   I n p u t   e n e r g y
where, NE is net energy (MJ ha−1), output and input energy are expressed in MJ ha−1, EUE is energy use efficiency (%), EP is energy productivity (kg MJ−1), Ye is economic yield of crop (kg ha−1) and SE is specific energy (MJ kg−1); system productivity is expressed in kg ha−1, EPr is energy profitability.

2.10. Carbon Budgeting

Effects of different production systems on the environment were evaluated in terms of carbon budgets. Carbon inflows and outflows of each production system were estimated by considering the type and quantity of different inputs consumed and outputs generated from the system in fifth year. Carbon flows were computed in units of C-footprint expressed in CO2 equivalent per unit area and time (CO2-e ha−1) [40]. The quantity of input or field operation was multiplied with corresponding emissions factors (Supplementary Table S4) to get CO2 emission in terms of kg CO2-e ha−1. The C-output (CO) was calculated by multiplying grain and straw/stover yield with average C-content of biomass (40% on dry weight basis) [40]. The N2O emission from applied fertilizer, manures/residues were estimated as suggested by [41],
N2O emissions (CO2-e kg ha−1) = N applied (kg ha−1) × EF × 44/28 × 285
where N applied through fertilizers, manures, and crop residue; EF is emission factors for N2O emission from N inputs and taken as 0.01 for Indian subcontinent, kg N2O-N/kg N input [41]; 44/28 is a coefficient converting N2O-N to N2O; 285 is global worming potential (GWP).
The seasonal emission of CH4 from rice cultivation in CP, CA1 (ZTTPR) and CA2 (ZTDSR) were, 12.8, 12.8 and 5.6 kg CH4 ha−1 season−1 [42]. The values of CH4 emission were converted to CO2 equivalent by multiplying with GWP factor of 28. In our experiment, the mustard and blackgram were not in an anaerobic condition and only CO2 and N2O emissions were considered [43].
We used six carbon-based indicators (C-footprint in spatial scales, C-footprint in yield scales, C- input, C-output, CSI, and C-efficiency) for comparative analysis of production systems in terms of environmental effects. The C-footprint (CF) represents overall C-intensiveness of different production systems and has been frequently studied to quantify environmental performance of production systems. Different components of carbon budgeting were calculated as follows [4]:
C F s = CO 2 - e   kg   ha 1 C E i n p u t s + C E N 2 O + C E CH 4  
C F y = C F s S R E Y  
C I = C F s × 12 44
C O = B t × 0.40
C S I = C O C I C I
C E = C O C I
where CFs is C-footprints of a production system in spatial scale (CO2-e kg ha−1), CEinputs is the CO2 equivalent of carbon emissions from all the inputs used (CO2-e kg ha−1), CEN2O is the C-emissions equivalent to N2O emissions from the system (CO2-e kg ha−1), CECH4 is the carbon emissions equivalent to CH4 emissions from the system (CO2-e kg ha−1), CFy is the C-footprints in yield scales (CO2-e kg Mg−1), CI is the C input to the system (kg C ha−1), CO is the C-output from the system (kg C ha−1), Bt is the total biomass produced by the system (kg ha−1) and CSI is the C-sustainability index and CE is the C-efficiency.

2.11. Irrigation Management

In the present study, rice was cultivated as purely rainfed crop. The furrow and flooding are most common methods of water application to mustard and blackgram crops cultivated in Eastern Indo-Gangetic plains (EIP) region and these conventional methods of irrigation were adopted in preceding winter and spring crops. In the case of mustard, two irrigations of 50 mm each were applied at critical stages viz. vegetative and pod formation, coinciding with 35–40 and 65–70 days after sowing (DAS) using furrow method of water application. At the time of sowing, the residual soil moisture left over after the harvest of rice was sufficient for the germination of mustard and only two irrigations were deemed necessary to meet the crop water requirement. In blackgram, three irrigations of 50 mm each were applied through flooding method at 5–10, 18–28 and 37–42 DAS. In order to apply 50 mm of irrigation, the duration of each irrigation event was decided based on pump discharge and amount of water to be applied.

2.12. Crop Water Use and Water Productivity

The actual crop water use was estimated using CROPWAT 8.0 model ([44]. CROPWAT estimates the reference evapotranspiration (ET0) using Penman–Monteith method and converts it to crop’s actual water use using mathematical functions based on climate, crop and soil parameters. The meteorological data viz. maximum and minimum temperature (°C) and daily rainfall were collected from the automatic weather station located nearby experiment sites, while relative humidity and sunshine hours were estimated using inbuilt functions available in CROPWAT. The soil parameters, i.e., field capacity and wilting point of soil in the experimental plots were determined using laboratory tests [45]. The crop data pertaining to sowing date, crop duration and rooting depth as recorded during the period of experimentation were used in the CROPWAT simulations. Crop coefficient values (Kc) for initial to later stages of crop growth used in the modeling were taken from [44].
Since rice was grown as rainfed crop, its water use was estimated using ‘no irrigation (rainfed)’ options available in CROPWAT. In rice, the water consumption was same in the case of rice-fallow (RF), CP and CA1, while the water consumption of rice in CA2 was estimated separately without considering nursery water requirements. The time and depth of water application for each irrigation in mustard and blackgram crops in CP were specified using the ‘Irrigation at user defined interval’ option available in CROPWAT. The crop water use under the condition of organic mulch was estimated using the adjusted crop coefficient (Kc) values. In case of organic mulches covering the soil surface, as was the case for CA1 and CA2 plots, Kc values for initial, mid and late seasons were reduced by 25%, 8% and 8%, respectively, as per the approach suggested by [44]. The water productivity (WP) was worked out by dividing the total yield (Y) by total water use (CWU) by the crop during growing season. The system water productivity (SWP) was computed by dividing the REY of the whole cropping systems with the annual crop water use.

2.13. Statistical Analysis

The data pertaining to different indicators and attributes of production systems were analyzed using analysis of variance (ANOVA) for randomized block design (RBD). The significance of the treatment effect was determined using F-test. Principal component analysis (PCA) was performed using XLSTAT version 2021.1 (Addinsoft, Paris, France)

3. Results

3.1. Total Soil Organic Carbon

Different treatments had marked variations (p ≤ 0.05) in TSOC in the surface soil after 5 years of study (Table 1). The CA1 and CA2 treatments having full CA practice recorded the significantly highest TSOC content of 18.6 and 18.4 Mg ha−1, respectively, in the surface soil (0–0.15 m) compared to all other treatments. At higher soil depths (0.3 to 0.6 m), the effect of different production systems on TSOC was statistically non-significant. On average, the TSOC stock in the entire soil depth (0–0.6 m) under different treatments followed the trend as CA2 (50.1) > CA1 (49.6) > FL (46.9) > CP (45.5) > RF (43.8 Mg ha−1). As compared to fallow land (FL), the continuous cropping for five years in rice-fallow (RF) and in CP caused a net decrease of 6.5% and 3.2% in TSOC, respectively. The C-sequestration rates in CA (CA1 and CA2) varied from 0.55–0.64 Mg C ha−1 year−1 and were significantly higher over CP and RF.

3.2. Soil organic Carbon Fraction

Various SOC fractions viz. VLC, LC, LLC and NLC varied significantly (p ≤ 0.05) among the different treatments (Table 2). The VLC was significantly (p ≤ 0.05) higher in CA1 and CA2 treatments over FL, RF and CP throughout the soil profile depth (0–0.6 m). The total VLC fraction was highest (18.8 Mg ha−1) in CA2 and was 45.4% higher over RF. In the entire soil profile depth (0–0.6 m), the relative preponderance of VLC among the different treatments followed the trend of CA2 > CA1 > FL > CP > RF. The LC fraction was significantly (p ≤ 0.05) higher in CA2, over other treatments in the soil depth of 0–0.60 m. Both CA practices (CA1 and CA2) registered significantly higher LC over RF and CP in 0–0.15 m soil depth and at deeper depths; the differences in LC were non-significant among the treatments. The highest total LC fraction was 11.7 Mg ha−1 in CA2, which was 14.5% higher over RF. The distribution of the total labile carbon pool among the treatments followed the order of CA2> FL = CA1 > CP > RF in the soil depth of 0–0.60 m. The LLC fraction was significantly (p ≤ 0.05) higher (10.7 Mg ha−1) in FL treatment in 0–0.60 m soil depth over CA1 and CA2. The relative availability of LLC fraction followed the order of, FL > CP > RF > CA1 > CA2 in the soil depth of 0–0.60 m. The NLC fraction did not show a significant difference among the CA practices, FL and CP, while the CA practices showed significant variation over RF in the soil profile depth of 0–0.60 m. The CA1 and CA2 treatments recorded higher NLC of 12.35 and 12.42 Mg ha−1, respectively, and accounted for 15.1% and 15.7% increases in NLC over the RF.

3.3. Active and Passive Pool of Carbon

The active pool of C was significantly (p ≤ 0.05) higher in CA1 and CA2 treatments over FL, RF and CP in the surface soil up to 0–0.3 m (Table 3). The highest active pools of carbon were 28.8 and 30.5 Mg ha−1 in CA1 and CA2 treatments, respectively, which constituted 58.1 and 60.9% of the respective total C-stock in the soil profile depth of 0–0.60 m. In 0–0.15 m depth profile, the passive pool of carbon was significantly (p ≤ 0.05) higher in CA1 (7.5 Mg ha−1) over other treatments. The highest total passive pool of C was 22.4 Mg ha−1 in FL and was significantly (p ≤ 0.05) higher over CA2 treatment in the soil depths of 0–0.60 m.

3.4. Carbon Build-Up and Retention

There was net TSOC build-up of 2.74 and 3.2 Mg C ha−1 in CA1 and CA2 treatments, which constituted a 5.85 and 6.82% increase over FL, respectively (Table 4). The RF showed a net depletion of TSOC, active and passive pools by −3.06, −1.34 and −1.72 Mg C ha−1 compared to FL, respectively. There was active pool C-build-up in CA1 (4.35 Mg C ha−1) and CA2 (6.02 Mg C ha−1), which accounted for a 17.8% and 24.6% increase over FL, respectively. The results confirmed that the conventional tillage practices (RF and CP) showed a negative build-up of SOC in total, passive and active pools, while the CA practices (CA1 and CA2) registered a significant positive build-up of SOC in total and active pools. The carbon retention efficiency in CA1 and CA2 (10.95 and 12.52%, respectively) was significantly (p ≤ 0.05) higher over RF and CP.

3.5. Soil Microbial Biomass Carbon and Dehydrogenase Activities

The soil microbial biomass carbon (SMBC) was significantly (p ≤ 0.05) higher in CA1 (121.5 µg g−1) and CA2 (118.6 µg g−1) treatments than FL, RF and CP in the upper soil layer of 0–0.15 m (Table 5). The SMBC declined with an increase in soil depth in all the treatments, and significant differences of SMBC in CA2 were observed up to 0–0.3 m soil depths over FL, RF and CP. The dehydrogenase activity registered significantly (p ≤ 0.05) higher in CA1 (197.8 µg TPF g−1 day−1) and CA2 (196.1 µg TPF g−1 day−1) treatments than RF and CP. The CA practices showed significant differences in dehydrogenase activity over RF treatment up to 0–0.3 m soil depths.

3.6. Crop and System Yield

The rice grain yields in the third and fourth years (2017–2018 and 2018–2019) were significantly (p ≤ 0.05) higher in CP (3.49 and 4.03 Mg ha−1) over CA1 (2.74 and 3.24 Mg ha−1) and CA2 (2.55 and 3.4 t ha−1) treatments (Table 6). However, in the fifth year (2019–2020), the rice grain yield was significantly (p ≤ 0.05) higher in CA2 (4.11 Mg ha−1) than CP (3.27 Mg ha−1) and RF (3.44 Mg ha−1). The mustard grain yields in the fourth and fifth years were significantly (p ≤ 0.05) higher in CA2 (0.31 and 0.39 Mg ha−1) over CP and CA1 treatments. The average mustard yield during the cropping year followed the order of CA2 > CP ≥ CA1. The blackgram yield in the fifth year was significantly (p ≤ 0.05) higher with CA2 (0.23 Mg ha−1) than CP (0.20 Mg ha−1). The system productivity of rice–mustard–blackgram in terms of rice equivalent yield during the third year was significantly (p ≤ 0.05) higher in CP (5.05 Mg ha−1) compared to CA1 and CA2 treatments, while in the fourth year, the CP treatment showed non-significant variation with CA2. However, the rice equivalent yield in the fifth year was significantly (p ≤ 0.05) higher in CA2 (5.94 Mg ha−1) than CP and CA1 treatments.

3.7. Crop Water Use and Water Productivity

Crop water use varied across crops, management practices and the experiment’s length. The average water consumption of rice was 387, 387, 366 and 339 mm ha−1 under RF, CP, CA1 and CA2 treatments, respectively. Compared across the cropping years, the water use by rice in CA treatments of CA1 and CA2 was 5.6% and 12.6% less than RF (Figure 3). Owing to the same management practices and same dates of sowing, the crop water use of mustard and blackgram in CA treatments (CA1 and CA2) was the same. Under CP, the mean water use of mustard and blackgram was 278 and 266 mm ha−1, respectively, while the respective water uses in CA1 and CA2 treatments were 252 and 247 mm ha−1. During the last three experimental years, CA2 improved mean water productivity by 7.0%, 23.6% and 14.1% and reduced the mean crop water requirement by 49, 25 and 19 mm ha−1 in rice, mustard and blackgram, respectively. The consumptive water use of rice–mustard–blackgram was estimated using the water use of individual crop in the cropping sequence. The analysis showed that the average crop water use in CP, CA1 and CA2 was 931, 865 and 838 mm, respectively. Compared to CP, the CA practices under CA1 and CA2 reduced the system water use by 7.1% and 10%, respectively.
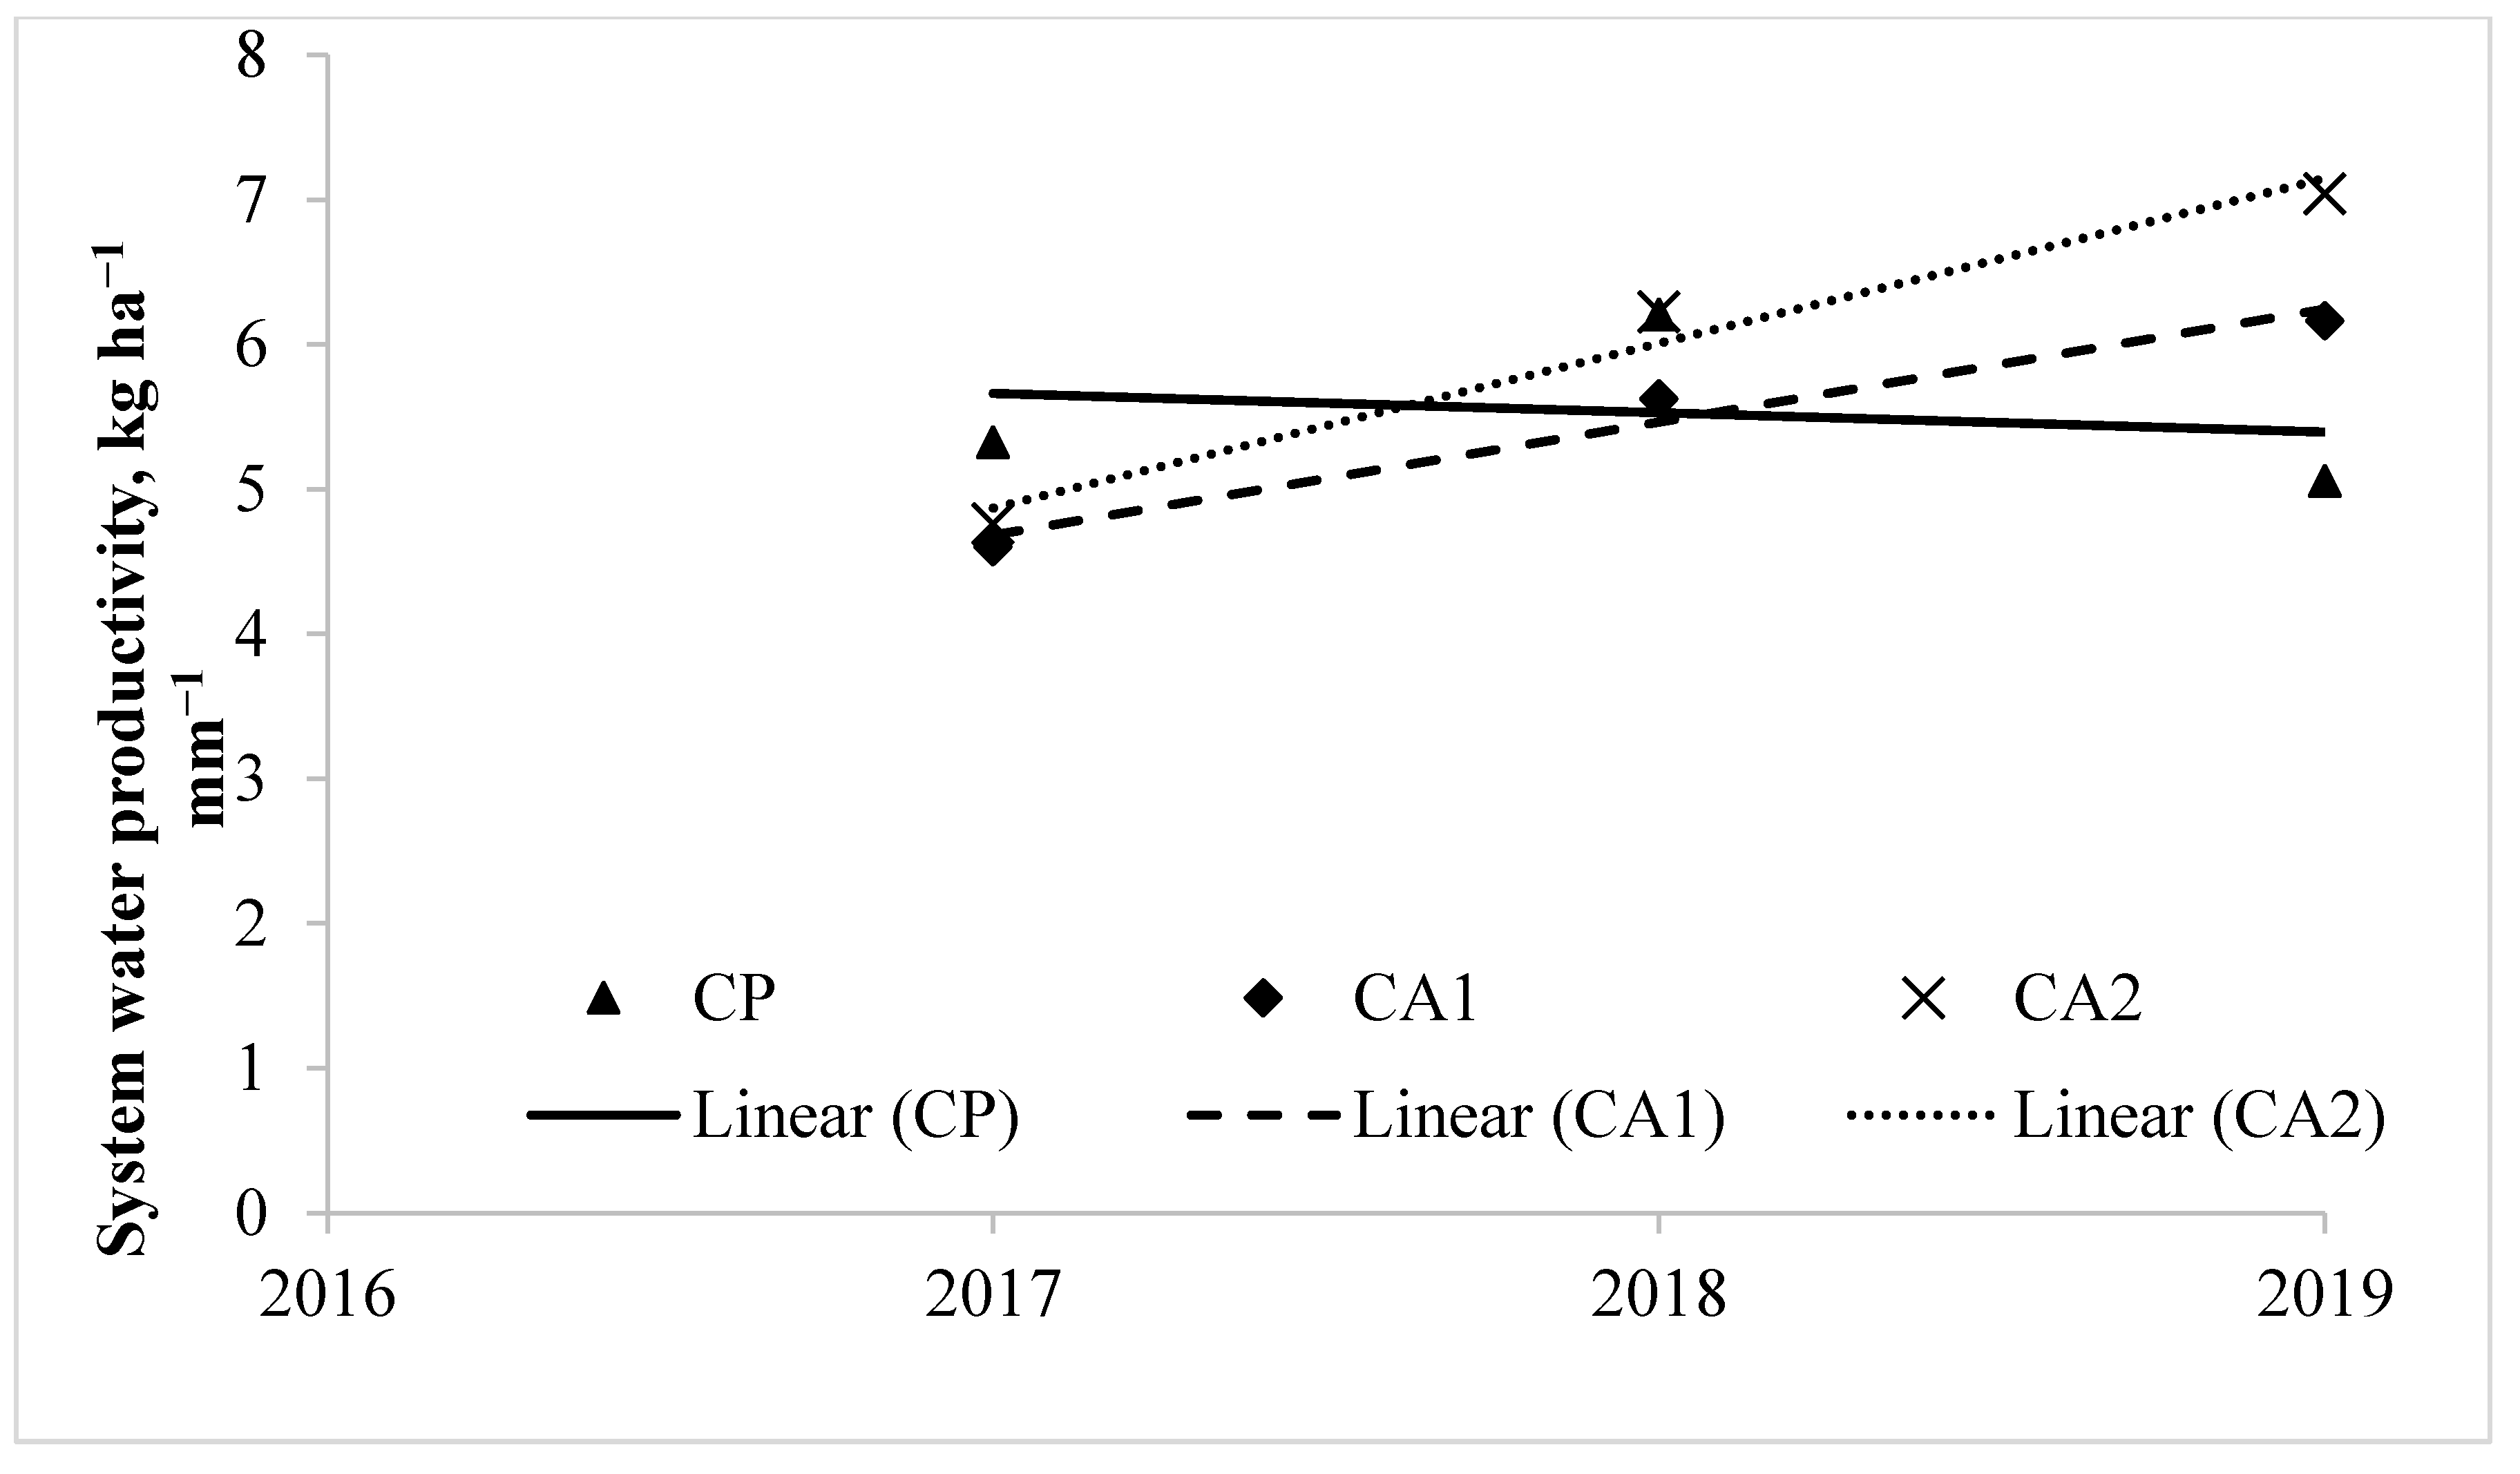
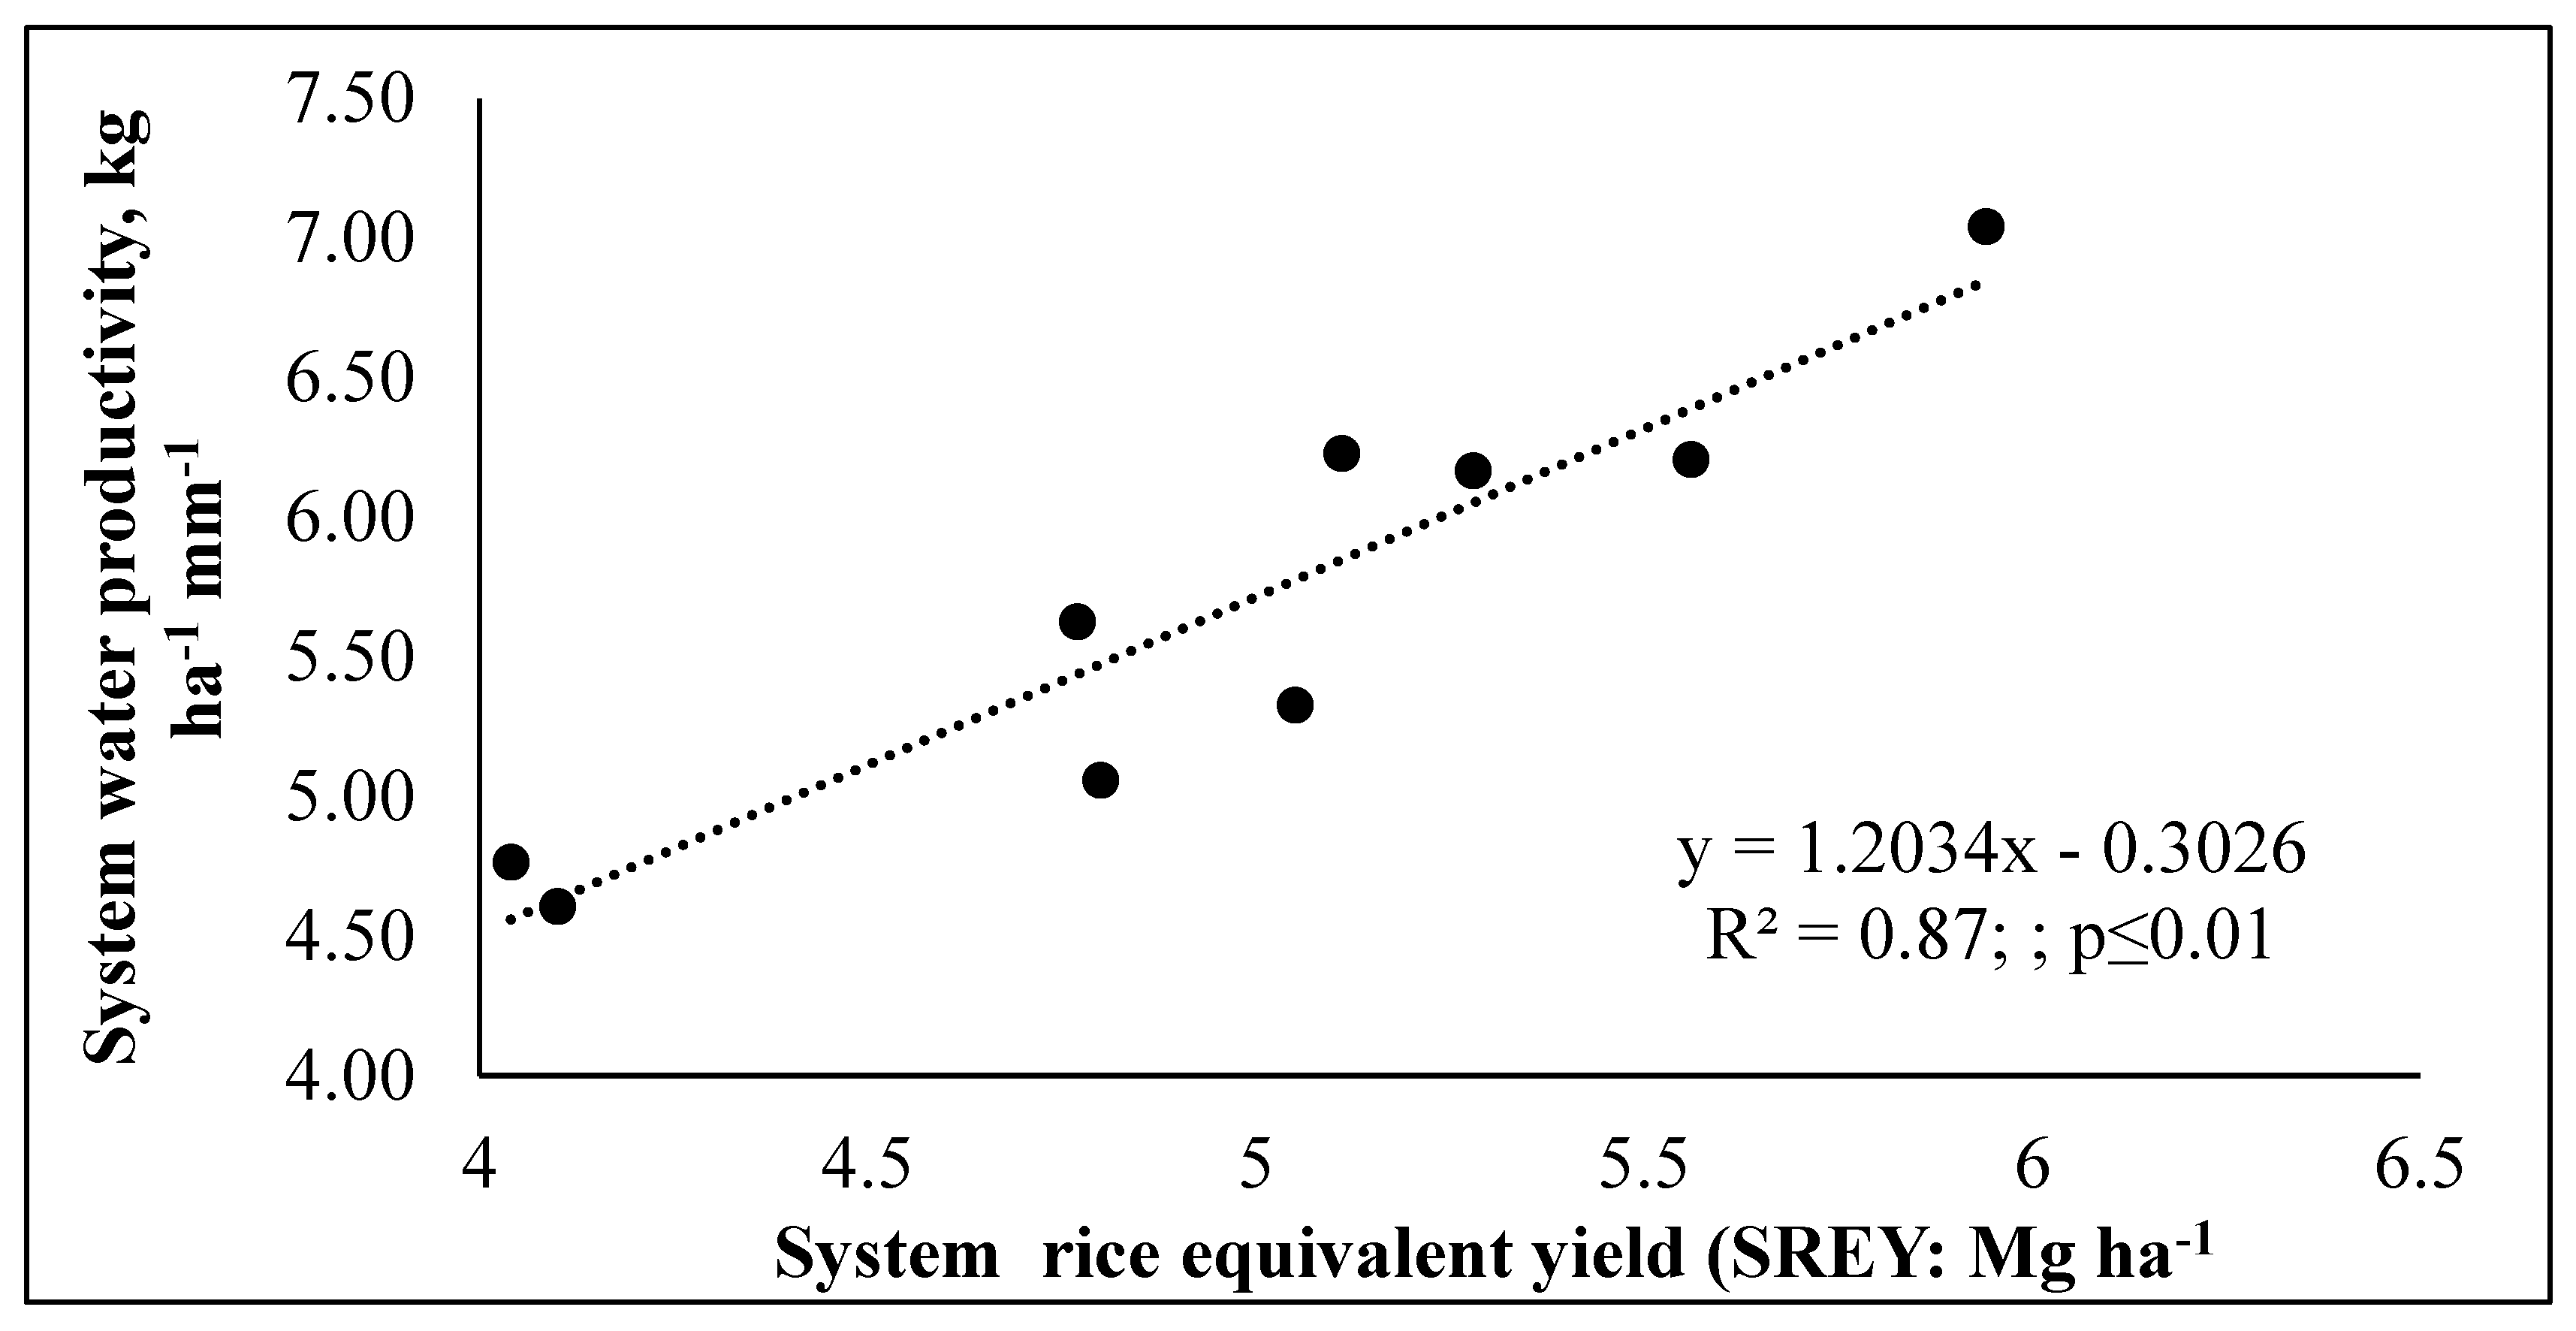
During the third year, the water productivity (WP) of rice cultivated under CA1 and CA2 was comparatively lower than WP observed in CP and RF, while in the fifth year, it was significantly (p ≤ 0.05) higher over CP (Table 7). The CA2 treatment registered a significantly higher mean water productivity of rice (9.95 kg ha−1 mm−1) than RF, CP and CA1. In mustard, the mean WP was significantly (p ≤ 0.05) higher in CA2 (1.30 kg ha−1 mm−1) than CP and CA1. Although, the WP of mustard in CA2 showed non-significant variations with CP during the third and fourth years, while, in the fifth year, it was significantly (p ≤ 0.05) higher in CA2 (1.42 kg ha−1 mm−1) than CP and CA1. The WP of blackgram varied from 0.77 to 0.96 kg ha−1 mm−1, while the mean WP was significantly (p ≤ 0.05) higher in CA2 (0.92 kg ha−1 mm−1) than CP and CA1. The system WP calculated based on the REY of the cropping sequence was significantly higher in CA2 (6.01 kg ha−1 mm−1) than CP and CA1. The system water productivity in CA1 and CA2 treatments showed an increasing trend (Figure 4) over time, while there was no rising or declining trend in CP.

3.8. Energy Budgeting

Energy budgeting in different cultivation practices showed significant (p ≤ 0.05) variation amongst treatments in all the parameters of input and output energy (Table 8). The input energy requirement was highest for rice followed by mustard and blackgram. The system input energy requirement was significantly lower at 19,570 MJ ha−1 in CA2 than in CP practice. The output energy produced among crops was highest in rice, while CA1 and CA2 treatment showed higher output energy than CP for all crops. The CA2 treatment registered to be a significantly (p ≤ 0.05) higher system of output energy of 177,417 MJ ha−1 over CP. The system net energy in CA2 was significantly (p ≤ 0.05) higher at 157,847 MJ ha−1 over CP. The system EUE of all crops was significantly (p ≤ 0.05) higher at 9.21 in CA2 than CP. The system energy productivity in CA2 recorded a 20% and 48.3% increase over CA1 and CP, respectively. The specific energy requirement in different cultivation practices was more in CP than CA1 and CA2. The CP registered 26.8% and 50.4% increased system specific energy requirements over CA1 and CA2, respectively. Among the cultivation practices, CA2 recorded the highest energy profitability of 14.4, 3.1 and 1.54 in rice, mustard and blackgram, respectively, compared to CA1 and CP. The system energy profitability in CA2 was significantly (p ≤ 0.05) higher at 8.21 compared to CP.

3.9. Carbon Budgeting

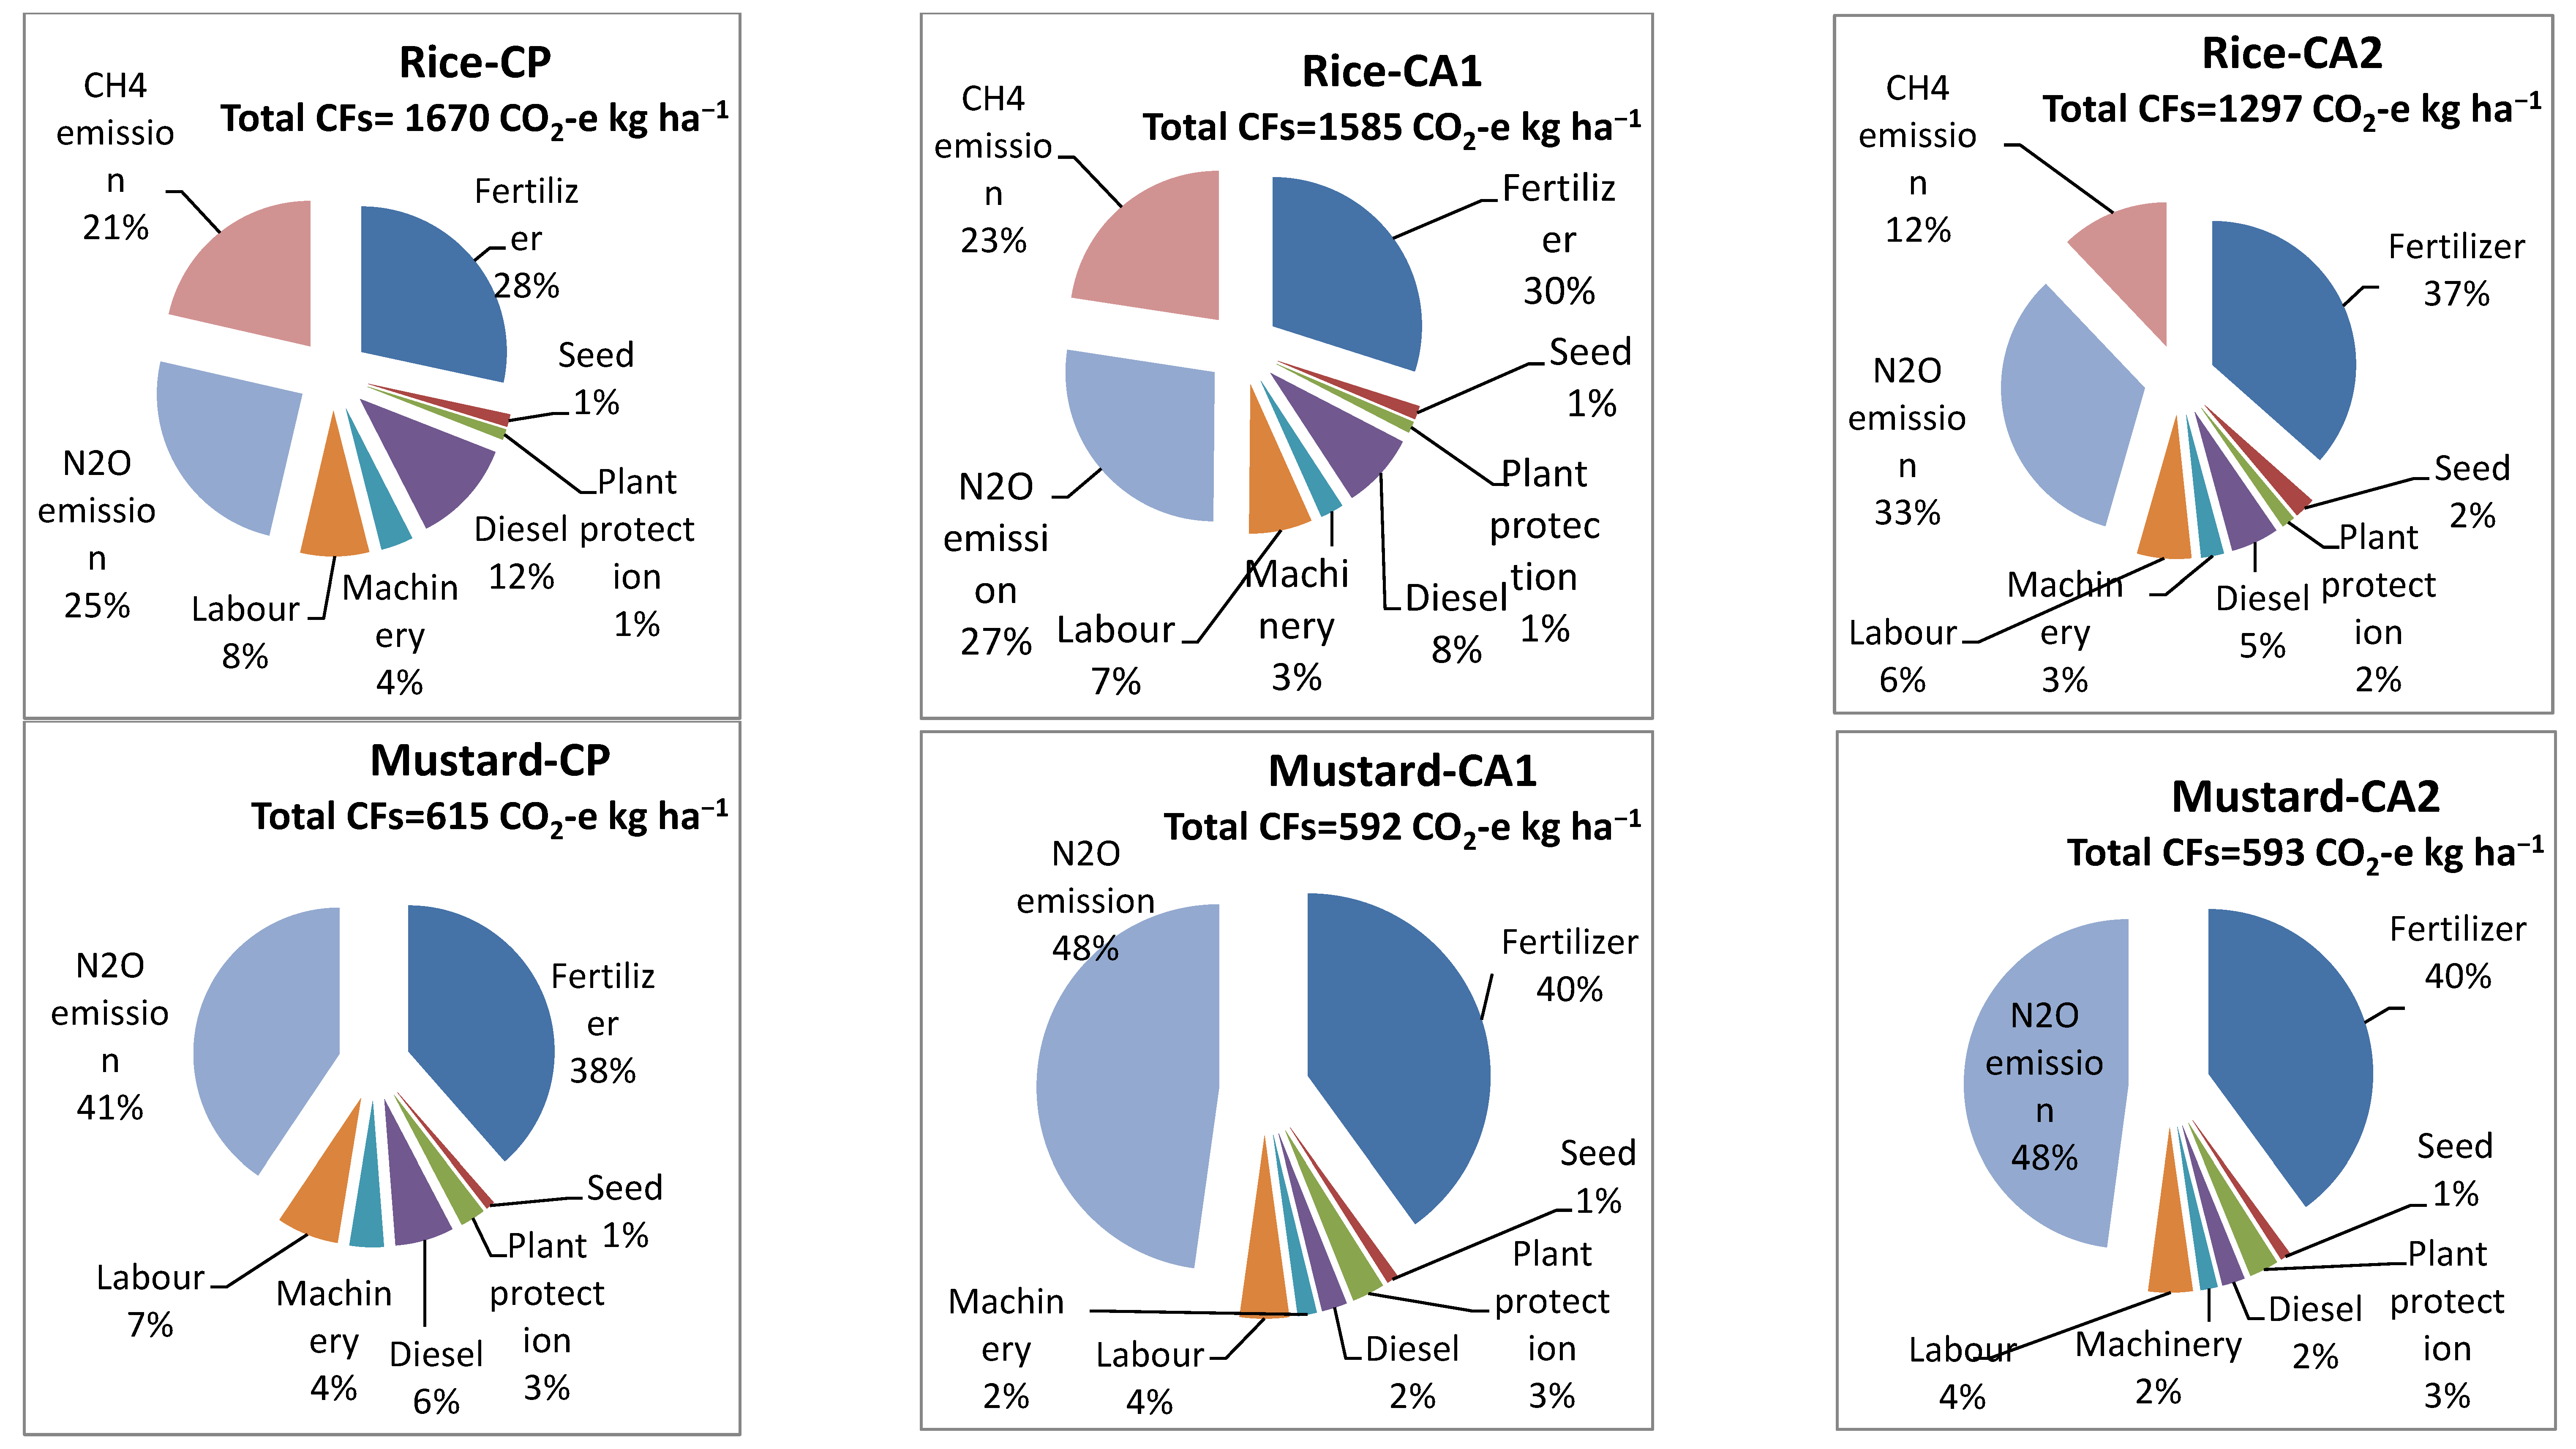
Different parameters of C-budgeting viz. C-footprint in spatial scales (CFs), C-footprints in yield scales (CFy), C-sustainability index (CSI), C-input (CI), C-output (CO) and carbon efficiency (CE) in rice, mustard and blackgram were significantly influenced by different cultivation practices (Table 9). The system-based production showed a significant (p ≤ 0.05) minimum of CFs of 2311 CO2-e kg ha−1 in CA2 compared to CA1 and CP. The contribution of fertilizer, CH4 and N2O emission accounted for 74–84% toward CFs in the rice crop, while the contribution of fertilizer and N2O emissions toward CFs in mustard and blackgram varied at 79–88% and 72–80%, respectively (Figure 5 and Figure 6). Similarly, the system CFy was lowest of 1427 CO2-e kg Mg−1 in CA2 and registered a 16.7% and 26.6% decrease over CA1 and CP, respectively. The system C-input in CA2 observed 11% and 15.8% decrease over CA1 and CP, respectively. The CA2 registered a significantly higher system C-output of 5215 kg ha−1 with a 27.5% increase over CP. The CSI recorded in CA2 in rice (11.4) and mustard (2.39) was significantly (p ≤ 0.05) higher over both CA1 and CP, while in blackgram, it was significantly (p ≤ 0.05) higher over CP. The system CSI in CA2 recorded a 31.1% and 63.2% increase over CA1 and CP, respectively. The C-efficiency (CE) among different treatments was significantly (p ≤ 0.05) higher in CA2 and recorded 12.4, 3.4 and 3.04 in rice, mustard and blackgram, respectively, compared to CP. The system CE observed in CA2 was 8.38 and resulted in 26.4% and 51.8% increase over CA1 and CP, respectively.

4. Discussion

4.1. Total SOC Stock (TSOC)

The TSOC stock in RF showed a 6.5% and 12.5% depletion compared to fallow treatment (FL) and CA practice (CA2), respectively. In RF, rice was transplanted in the wet season and land was kept fallow in winter and summer seasons without the addition of crop residue over a five-year period, while in the fallow treatment (FL), land was allowed to have native vegetation grow, which was subsequently incorporated in situ in soil with minimum tillage. Crop cultivation involving tillage opens the furrow slice, as in RF and CP, exposing SOC to rapid oxidation and leading to loss of soil carbon stock; the results find support from [29] who reported a TSOC depletion of 12.7% in a conventional tillage (CT) rice-wheat system over full CA. The higher TSOC stock in the surface soil under CA1 and CA2 treatments was attributed to higher additions of crop residue (2.36 and 2.51 t ha−1 in CA1 and CA2, respectively) together with ZT [46,47]. Furthermore, the leftover crop residues of rice, mustard and blackgram in CA1 and CA2 treatments caused a slower decomposition of residue, protection of soil surfaces from raindrop impacts and erosions resulting in the enhancement of SOC in the topsoil [29,48] and even extended up to a soil depth of 0.15–0.30m. The C-stock value in the entire depth of 0–0.6 m across treatments justified that CA with additional residue augmented the C-sequestration rate, while conventional tillage, as in RF and CP, reduced the soil C-stock and failed to enhance the carbon sequestration rate.

4.2. Soil Organic Carbon Pools, Carbon Stabilization and Microbial Parameters

The different fractions of SOC viz. VLC, LC and LLC having different lability showed prominent variations among the different treatments. The higher C VLC in CA1 and CA2 to the tune of a 39.7% and 45.5% increase, respectively, over RF was due to more C added to the soil, resulting from the decomposition of crop residues [49]. Further, the LLC was lower in both CA1 and CA2 than FL, RF and CP owing to the fact that higher SOC mineralization, which resulted in a quick breakdown of less labile substrates, i.e., organic acid, amino acid and simple sugars from residue addition [50]. The results further confirmed that increased C-supply through residue addition enhanced microbial activities and SOC mineralization [51]. The non-labile C-fractions (NLC) in the entire soil depths of 0–0.6 m were significantly higher in CA1 and CA2 than RF, which might be due to the conversion of residue biomass and labile C-fraction to recalcitrant form under minimum soil tillage [31].
Active pool carbon was higher in CA1 and CA2 treatments, where CA practiced and was ascribed to the non-disturbance of soil coupled with higher levels of residue addition. Higher active C build-up in CA1 and CA2 treatments was attributed to the conversion of added crop residue and FYM-C to very labile C (VLC) due to less soil disturbance, thus suggesting FYM might have enhanced the conversion process by enhancing better microbial growth and production of higher polysaccharides [52]. This result highlights the favorable influence of FYM in combination with crop residues to attain higher active pool C-stabilization in the initial year of adopting CA. The lowest active pool in RF and CP, where tillage resulted in a loss of SOC due to furrow opening and its further oxidation, combined with soil microbiome respirations [53]. Lower passive C-pools in CA1 and CA2 treatments were associated with low levels of LLC, attributed to C-mineralization of added crop residue [50]. The passive pool C build-up showed a higher value in CP over CA1 and CA2 due to a higher level of less labile-C (LLC), suggesting a high degree of resistance to the microbial decomposition of FYM-C containing biopolymers [54].
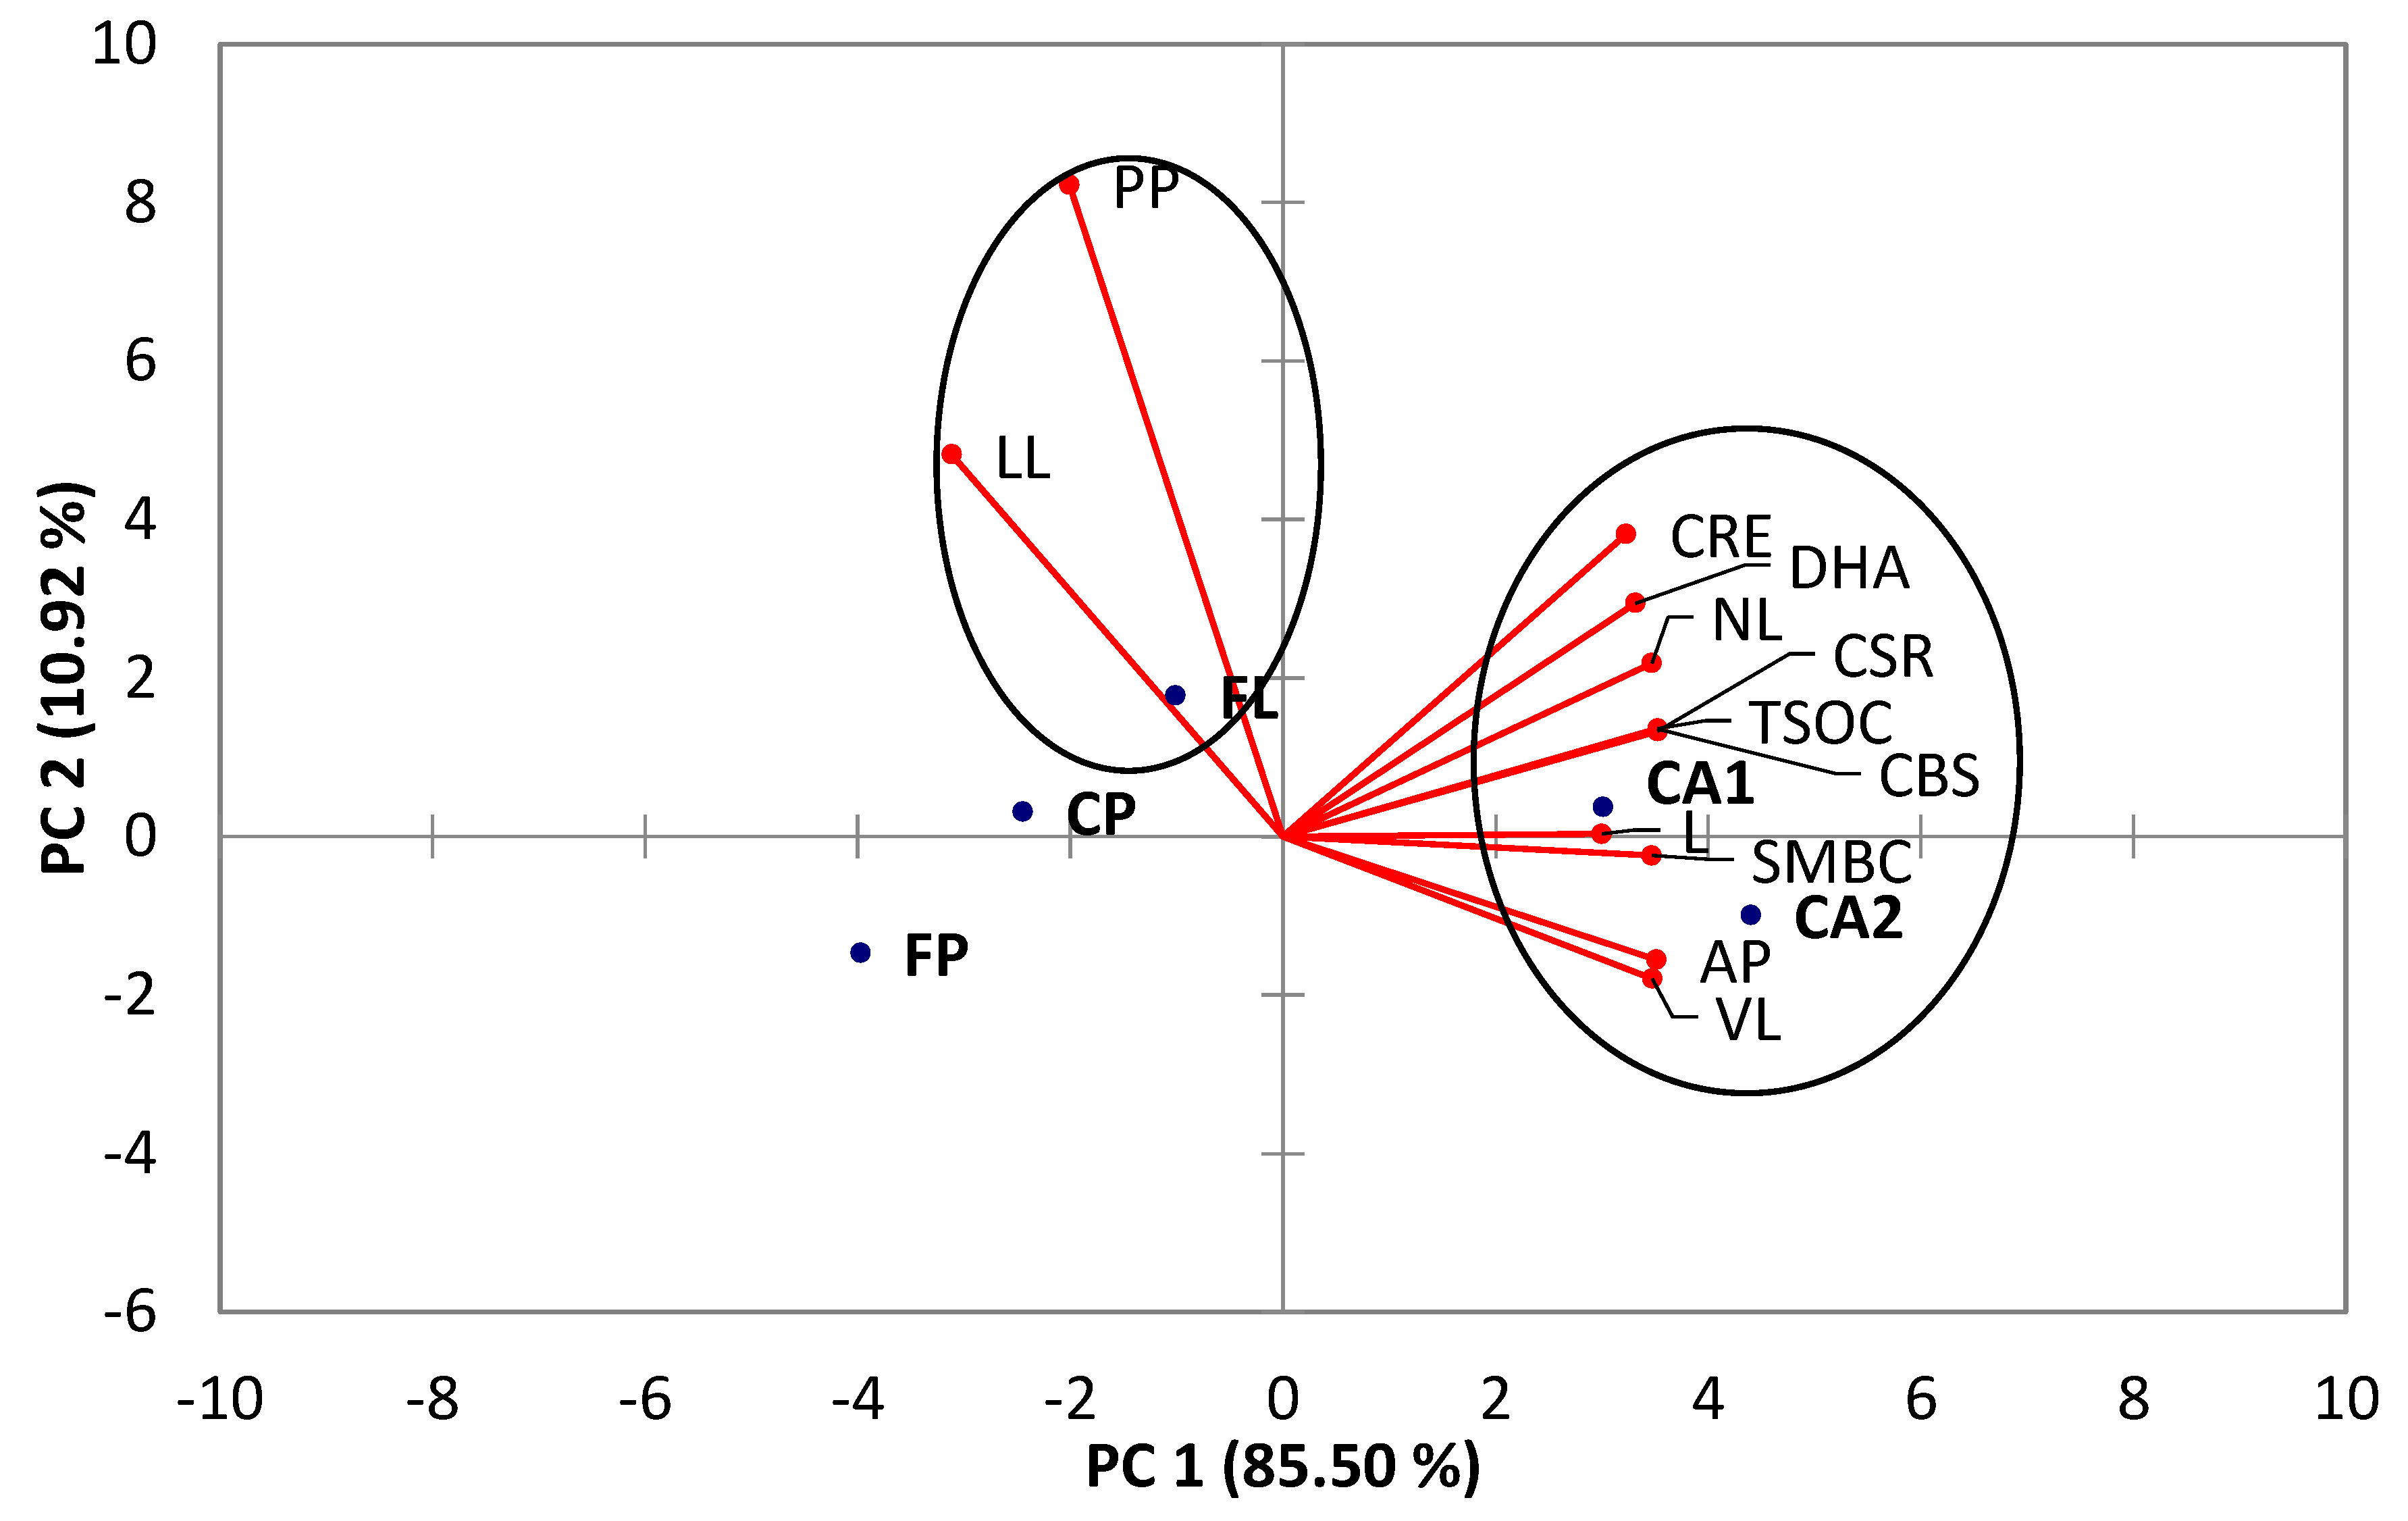
The microbial parameters viz. SMBC and DHA were more in CA1 and CA2 treatments owing to the fact that ZT with residue addition caused better microbial growth. The microbial parameters varied significantly among the different treatments and confined to surface soil (0–0.30 m), resulting from the supply of readily mineralizable and hydrolyzable carbon along with greater availability of nutrients from crop residues [46]. The gradual decline in microbial parameters with soil depth was due to a decreased supply of C input. The PCA-biplots (Figure 7) of different variable loading, i.e., CRE, DHA, TSOC, NL, CSR, CBS and L, were positively correlated to the CA practice (CA1 and CA2), which confirmed the better SOC dynamics compared to conventional practices.

4.3. System Productivity

The practice of CA (CA1 and CA2) showed a lower yield than RF and CP during the third and fourth years, which agreed with the findings of [55] who observed low rain-fed rice yields during the two to three years of CA compared to CT. Furthermore, Bruelle et al. [55] observed that consecutive years of CA on the same field improved yield and reduced rice yield variability from the first year of CA. During the fifth year, the rice grain yields in CA1 and CA2 caused a 12.5% and 25.7% increase over CP, respectively. The continuous adoption of ZT and residue addition in CA1 and CA2 treatment for five years increased labile SOC pool and TSOC, which caused a better microclimate and nutrient availability responsible for higher crop yield [56]. During the fourth and fifth years, the CA2 treatment registered significantly better mustard yield than CP with a yield enhancement of 17.3% and 25.2%, respectively. In contrast, puddling in rice with residue removal (CP) resulted in poor soil health and a consequent reduction in the yield of winter crops [57]. The summer blackgram practiced under ZT with residue addition caused higher yields during the fourth and fifth years in CA1 and CA2 over CP, which might be due to improved soil water availability following the suppression of soil evaporations [58]. Venkatesh et al. [59] observed a better performance of pulses in ZT than CT due to higher plant population, a deeper root system and the ability to overcome moisture stresses. In the fifth year, the SREY in CA2 was higher than CP, which was attributed to better rice productivity and associated crops.

4.4. Crop Water Productivity

The CA practice resulted in reduced water use in all the crops of selected cropping sequence. The CA2 treatment reduced the mean water consumption of rice by 12.6% as compared to RF and CP. In the subsequent crops of mustard and blackgram, the adoption of CA (CA1 and CA2) reduced the water use by 9.2% and 7.3%, respectively. Retentions of residue on the soil surface in CA help in moderating evaporation loss and conserving soil moisture [60,61], leading to water saving over RF and CP. The highest WP of an individual crop and cropping system as a whole was recorded in CA2, which might be due to the cumulative effect of lowering crop water use and better crop yield. In the present rice–mustard–blackgram cropping system, the CA2 resulted in an 8.7% higher mean system water productivity over the CP practice, and these results find support from [62] who observed 10% more system yield and 29% greater water productivity in CA practice (permanent broad bed+crop residue) in comparison to CT in maize–wheat systems. Compared across the management practices, a direct relationship was noted between system productivity and system water productivity (Figure 8), underlining the fact that an increase in WP was associated with an increase in system productivity [63].

4.5. Energy and Carbon Budgeting

The average input energy requirement in both CA practices (CA1 and CA2) for all the crops of rice, mustard and blackgram was low compared to CP, which might be due to the minimum use of diesel, machineries, and labor input. Intensive tillage operations in CT, which caused higher machinery use, resulted in higher fossil fuel consumption, leading to higher input energy. These results find support from [4] who observed mechanized tillage (MT) consumed 0.5 and 2.09 times higher total input energy than that of partly mechanized tillage and traditional tillage, respectively. The CA2 practice confirmed input energy savings of 63.8% to 66.7% in diesel, 44.4% to 58.3% in machinery and 32.6% to 39% in labor compared to CP, thus making CA2 cultivation practice an energy-profitable system. The CA practices reduce diesel use from land preparation by 50–60 L ha−1 [64]. The CT practice is more energy intensive by consuming higher energy in fertilizer, chemical and machinery [37,40]. The input energy requirement was the maximum in rice followed by mustard and blackgram, which could be attributed to higher fertilizer, diesel, machinery and labor use in rice compared to winter (mustard) and summer crops (blackgram). The output energy and net energy in CA2 out-performed other cultivation practices, which could be ascribed to higher crop yield enhancement contributing more output energy with a requirement of minimum input energy. The energy use efficiency and energy productivity among the cultivation practices confirmed CA2 as the best crop establishment practice for all crops of rice, mustard and blackgram. Furthermore, CA2 required the lowest specific energy compared to other cultivation practices due to the lower input energy consumed in CA practices. The CA2 practice showed higher net energy and lower input energy, which consecutively resulted in higher energy profitability with an enhancement of 27.2–68.8% compared to CA1 and CP.
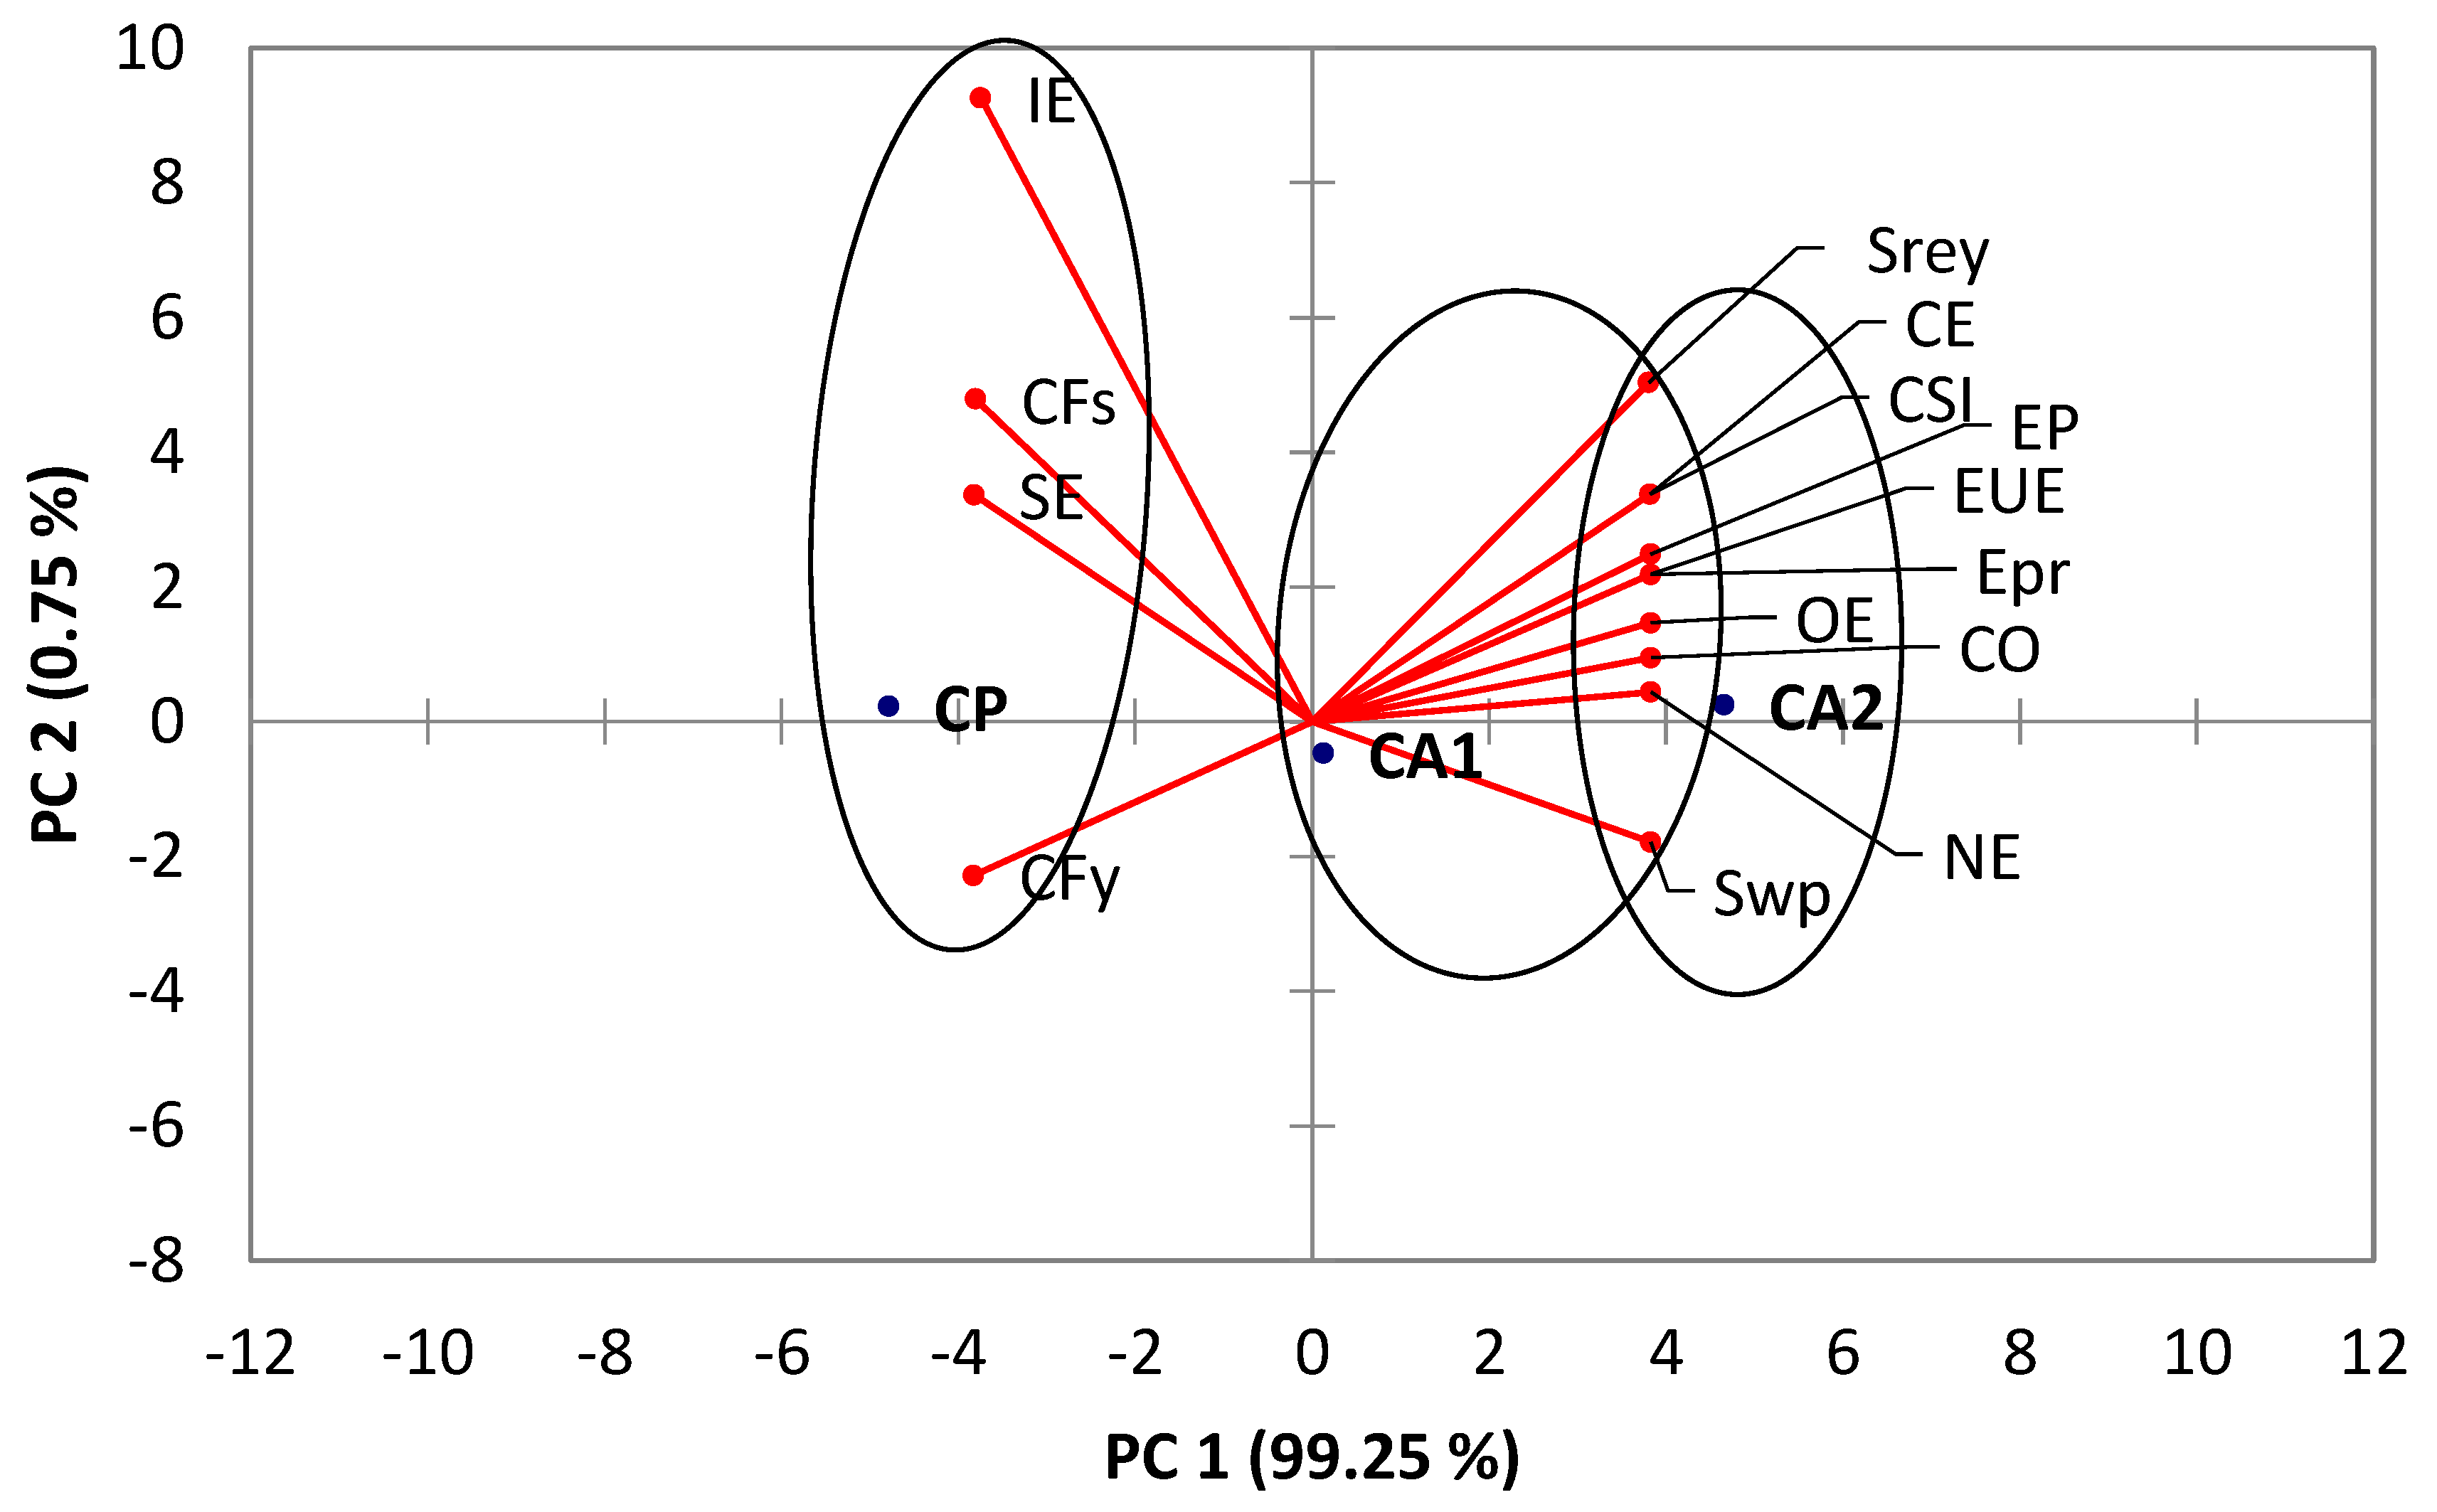
The higher CO2 emissions in the CP practice were attributed to the higher use of fossil fuel, machinery, labor and the contribution of N2O and CH4 emissions (Figure 5 and Figure 6). In contrast, the CA2 practice reduced CO2 emissions by 13.4%, 2.76% and 8% in rice, mustard and blackgram, respectively. Further, Kumar et al. [4] observed 84–85% C-emissions in MT, which was contributed by fertilizers, diesels and machinery in eastern India. The low C-footprint in the yield scales (CFy) in CA2 further provided significant evidence of CA practices in reducing GHG emission by 32.7%, 22.6% and 19.4% in rice, mustard and blackgram, respectively. Lal et al. [39] also observed C-footprint in yield scale (CFy) with value ranging from 300–348 CO2-e kg Mg−1 in different rice establishment practices and identified it as a better indicator for computing GHG emission. One of the limitations of the present study is that the estimates of CO2 emissions are based on emission factors and are not derived from direct field measurements; however, a standard emission factor-based computational framework has been adopted by many researchers [22,39,41]. Compared to CP, the increased C-output in CA2 by 29 and 25.2% in rice and mustard was due to higher crop yields. Higher CSI and CE in CA practices (CA1 and CA2) compared to CP were attributed to a greater C-output with the simultaneous use of low C-input from fossil fuels, machinery and labor. The PCA biplot of the scores of different cultivation practices with variable loadings of energy and C-budgeting (Figure 9) showed higher positive correlation of SREY, CI, CSI, CE, Epr, EUE, EP, OE, CO and NE with both CA1 and CA2 practices and thus confirmed the sustainability of energy and carbon compared to a conventional practice (CP).

5. Conclusions

The present investigation was carried out to evaluate the response of different conventional and conservation agricultural practices in rice-fallow ecosystems of South Asia. The research outcomes clearly demonstrated that CA-based crop management practices can address the issues of deteriorating soil health, declining system productivity, water availability and greenhouse gas emissions. The present research concludes that conservational agricultural practices caused a significant improvement in TSOC both in labile and non-labile carbon fractions that led to an increase in carbon retention efficiency. The practice of conservational agriculture enhanced the very labile C in all of the soil depths and stabilized the SOC as a non-labile recalcitrant fraction in 0–0.30 m soil depth. This practice also showed a lower carbon footprint, higher carbon sustainability index and carbon efficiency.
The CA treatments were more water efficient and increased the crop water productivity over conventional practices. This has larger implications on the water-stressed Eastern Hill and Plateau region where water availability is a major concern. The modified CA-based cropping system increased the system productivity by 34–46% over the conventional rice-fallow system, highlighting the importance of including second and third crops in the rice-fallow eco-systems of South Asia. Such a modified CA-based system showed low energy consumption, higher energy use efficiency and improved energy productivity and energy profitability.
A cropping system having direct seeded rice (DSR)–mustard–blackgram under conservation agriculture was adjudged as the best practice in terms of C-sequestration, C-stabilization, biological activity with higher system productivity, energy use efficiency and reduced carbon footprints. Thus, the findings of our investigation could be helpful to researchers and policy makers for designing cleaner and eco-friendly production systems for rice-fallow in the Eastern Hill and Plateau region of eastern India and similar agro-ecotypes of South Asia.

Supplementary Materials

The following supporting information can be downloaded at: https://www.mdpi.com/article/10.3390/su15021054/s1, Table S1: Field operations carried out in different cultivation practices at a farmer’s field; Table S2: Input requirements for different cultivation practices; Table S3: Energy equivalents of different inputs and outputs of agricultural production; Table S4: Emission factors of different agricultural inputs used in the experiment. References [65,66,67] are cited in the supplementary materials.

Author Contributions

S.K.N.: Conceptualizations, data curations, drafting the manuscript; S.S.M.: Methodology, writing-review and editing of the manuscript; B.K.J.: Conceptualization, validation, resources; R.K.: Conceptualizations, editing/reviewing manuscript; S.M.: Writing-review and editing the manuscript; J.S.M.: Validation, writing-review and editing manuscript; A.K.S.: Resources, supervision; A.K.B.: Supervision, project administration, resources; A.K.C.: Supervision, project administration, resources; J.S.C.: Writing-review and editing the manuscript; H.H.: Data curations, compilations, A.D.: Reviewing and editing manuscript; S.B.: Reviewing and editing manuscript; J.L.: Reviewing/editing manuscript; A.U.: Resources, supervision; B.P.B.: Project administration, resources; S.K.C.: Supervisions, project administration, resources. All authors have read and agreed to the published version of the manuscript.

Funding

This research received no external funding.

Institutional Review Board Statement

Not required. Can be excluded.

Informed Consent Statement

Informed consent was obtained from all subjects involved in the study.

Data Availability Statement

The research data will be made available on reasonable request to the corresponding author.

Acknowledgments

The authors are grateful to the Indian Council of Agricultural Research (ICAR) and Department of Agricultural Research and Education (DARE), Ministry of Agriculture and Farmers Welfare, India, for necessary assistance during the experimentation.

Conflicts of Interest

Authors declare that they have no known competing financial interest or personal relationships that could have appeared to influence the work reported in this paper.

References

  1. United Nations. World Population Prospects: The 2019 Revision (Medium Variant); United Nations: New York, NY, USA, 2019. [Google Scholar]
  2. Van Dijk, M.; Morley, T.; Rau, M.L.; Saghai, Y. A meta-analysis of projected global food demand and population at risk of hunger for the period 2010–2050. Nat. Food 2021, 2, 494–501. [Google Scholar] [CrossRef]
  3. Gumma, M.K.; Thenkabail, P.S.; Teluguntla, P.; Rao, M.N.; Mohammed, I.A.; Whitbread, A.M. Mapping rice-fallow cropland areas for short-season grain legumes intensification in South Asia using MODIS 250 m time-series data. Int. J. Digit. Earth 2016, 9, 981–1003. [Google Scholar] [CrossRef] [Green Version]
  4. Kumar, R.; Sarkar, B.; Bhatt, B.P.; Mali, S.S.; Mondal, S.; Mishra, J.S.; Jat, R.K.; Meena, R.S.; Anurag, A.P.; Raman, R.K. Compara-tive assessment of energy flow, carbon auditing and eco-efficiency of diverse tillage systems for cleaner and sustainable crop pro-duction in eastern India. J. Clean. Prod. 2021, 293, 126162. [Google Scholar] [CrossRef]
  5. Saurabh, K.; Kumar, R.; Mishra, J.S.; Singh, A.K.; Mondal, S.; Meena, R.S.; Choudhary, J.S.; Biswas, A.K.; Kumar, M.; Roy, H.S.; et al. Sustainable intensification of rice fallows with oilseeds and pulses: Effects on soil aggregation, organic carbon dynamics, and crop productivity in eastern Indo-Gangetic Plains. Sustainability 2022, 14, 11056. [Google Scholar] [CrossRef]
  6. Singh, A.K.; Das, B.; Mali, S.S.; Bhavana, P.; Shinde, R.; Bhatt, B.P. Intensification of rice-fallow cropping systems in the Eastern Plateau region of India: Diversifying cropping systems and climate risk mitigation. Clim. Dev. 2020, 12, 791–800. [Google Scholar] [CrossRef]
  7. Sharma, P.K.; De-Datta, S.K. Effect of puddling on soil physical properties and processes. In Soil Physics and Rice; International Rice Research Institute: Los Banos, CA, USA, 1985; pp. 217–234. [Google Scholar]
  8. Bonin, C.L.; Lal, R. Aboveground productivity and soil carbon storage of biofuel crops in Ohio. GCB Bioenerg. 2014, 6, 67–75. [Google Scholar] [CrossRef] [Green Version]
  9. Adhya, T.K.; Singh, O.N.; Swain, P.; Ghosh, A. Rice in Eastern India: Causes for low productivity and available options. J. Rice Res. 2008, 2, 1–5. [Google Scholar]
  10. NAAS. Improving Productivity of Rice Fallows; Policy Paper No. 64; National Academy of Agricultural Sciences: New Delhi, India, 2013; p. 16. [Google Scholar]
  11. Bhatt, R.; Kukal, S.S.; Busari, M.A.; Arora, S.; Yadav, M. Sustainability issues on rice–wheat cropping system. Int. Soil Water Conserv. Res. 2016, 4, 64–74. [Google Scholar] [CrossRef] [Green Version]
  12. Bandyopadhyay, P.K.; Halder, S.; Mondal, K.; Singh, K.C.; Nandi, R.; Ghosh, P.K. Response of Lentil (Lens culinaries) to Post-rice Residual Soil Moisture Under Contrasting Tillage Practices. Agric. Res. 2018, 7, 463–479. [Google Scholar] [CrossRef]
  13. Naik, S.K.; Das, B.; Kumar, S.; Bhatt, B.P. Evaluation of Major and Micronutrient Status of Acid Soils of Different Mango Orchards. Int. J. Fruit Sci. 2015, 15, 10–25. [Google Scholar] [CrossRef]
  14. Cornish, P.S.; Choudhury, A.; Kumar, A.; Das, S.; Kumbakhar, K.; Norrish, S.; Kumar, S. Improving crop production for food secu-rity and improved livelihoods on the East India Plateau II. Crop options, alternative cropping systems and capacity building. Agric Syst. 2015, 137, 180–190. [Google Scholar] [CrossRef]
  15. Godfray, H.C.J.; Beddington, J.R.; Crute, I.R.; Haddad, L.; Lawrence, D.; Muir, J.F.; Pretty, J.; Robinson, S.; Thomas, S.M.; Toulmin, C. Food security: The chal-lenge of feeding 9 billion people. Science 2010, 327, 812–818. [Google Scholar] [CrossRef] [PubMed] [Green Version]
  16. Foley, J.A.; Ramankutty, N.; Brauman, K.A.; Cassidy, E.S.; Gerber, J.S.; Johnston, M.; Mueller, N.D.; O’Connell, C.; Ray, D.K.; West, P.C.; et al. Solutions for a cultivated planet. Nature 2011, 478, 337–342. [Google Scholar] [CrossRef] [Green Version]
  17. Pittelkow, C.M.; Liang, X.; Linquist, B.A.; van Groenigen, K.J.; Lee, J.; Lundy, M.E.; van Gestel, N.; Six, J.; Venterea, R.T.; van Kessel, C. Productivity Limits and Po-tentials of the Principles of Conservation Agriculture. Nature 2015, 517, 365–368. [Google Scholar] [CrossRef] [PubMed]
  18. Knapp, S.; van der Heijden, M.G. A global meta-analysis of yield stability in organic and conservation agriculture. Nat. Commun. 2018, 9, 1–9. [Google Scholar] [CrossRef] [PubMed] [Green Version]
  19. Buffett, H.G. Reaping the benefits of no-tillage farming. Nature 2012, 484, 455. [Google Scholar] [CrossRef] [PubMed] [Green Version]
  20. Briones, M.J.; Schmidt, O. Conventional tillage decreases the abundance and biomass of earthworms and alters their community structure in a global meta-analysis. Glob. Chang. Biol. 2017, 23, 4396–4419. [Google Scholar] [CrossRef] [Green Version]
  21. Jat, H.S.; Datta, A.; Choudhary, M.; Sharma, P.C.; Yadav, A.K.; Choudhary, V.; Vishu, G.M.; Jat, M.L.; McDonald, A. Climate Smart Agriculture practices improve soil organic carbon pools, biological properties and crop productivity in cereal-based systems of North-West India. Catena 2019, 181, 104059. [Google Scholar] [CrossRef]
  22. Liu, C.; Cutforth, H.; Chai, Q.; Gan, Y. Farming tactics to reduce the carbon footprint of crop cultivation in semiarid areas. A review. Agron. Sustain. Dev. 2016, 36, 1–16. [Google Scholar] [CrossRef] [Green Version]
  23. Subbiah, B.V.; Asija, G.L. A rapid method for the estimation of nitrogen in soil. Curr. Sci. 1956, 26, 259–260. [Google Scholar]
  24. Bray, R.H.; Kurtz, L.T. Determination of total, organic, and available forms of phosphorus in soils. Soil Sci. 1945, 59, 39–46. [Google Scholar] [CrossRef]
  25. Page, A.L.; Miller, R.H.; Keeney, D.R. Chemical and Microbiological Properties. In Methods of Soil Analysis Part 2, 2nd ed.; Soil Science Society of America: Madison, WI, USA, 1982. [Google Scholar]
  26. BAU. Crop Production Technology. Birsa Kisan Diary; Birsa Agricultural University: Ranchi, India, 2010; p. 18. [Google Scholar]
  27. Piper, C.S. Soil and Plant Analysis; University of Adelaide: Adelaide, Australia, 1950. [Google Scholar]
  28. Nelson, D.W.; Sommers, L.E. Total carbon, organic carbon, and organic matter. In Methods of Soil Analysis, 2nd ed.; Page, A.L., Ed.; ASA Monograph 9(2): Madison, WI, USA, 1982; pp. 539–579. [Google Scholar]
  29. Samal, S.; Rao, K.; Poonia, S.; Kumar, R.; Mishra, J.; Prakash, V.; Mondal, S.; Dwivedi, S.; Bhatt, B.; Naik, S.K.; et al. Evaluation of long-term conservation agriculture and crop intensification in rice-wheat rotation of Indo-Gangetic Plains of South Asia: Carbon dynamics and productivity. Eur. J. Agron. 2017, 90, 198–208. [Google Scholar] [CrossRef] [PubMed]
  30. Das, T.; Bhattacharyya, R.; Sharma, A.; Das, S.; Saad, A.; Pathak, H. Impacts of conservation agriculture on total soil organic carbon retention potential under an irrigated agro-ecosystem of the western Indo-Gangetic Plains. Eur. J. Agron. 2013, 51, 34–42. [Google Scholar] [CrossRef]
  31. Ghosh, P.K.; Venkatesh, M.S.; Hazra, K.K.; Kumar, N. Long-term effect of pulses and nutrient management on soil organic carbon dynamics and sustainability on an inceptisol of indo-gangetic plains of india. Exp. Agric. 2012, 48, 473–487. [Google Scholar] [CrossRef]
  32. Mandal, B.; Majumder, B.; Bandyopadhyay, P.K.; Hazra, G.C.; Gangopadhyay, A.; Samantaray, R.N.; Mishra, A.K.; Chaudhury, J.; Saha, M.N.; Kundu, S. The potential of cropping systems and soil amendments for carbon sequestration in soils under long-term ex-periments in subtropical India. Glob. Chang Biol. 2007, 13, 357–369. [Google Scholar] [CrossRef]
  33. Chan, K.Y.; Bowman, A.; Oates, A. Oxidizible organic carbon fractions and soil quality changes in an oxic paleustalf under different pasture leys. Soil Sci. 2001, 166, 61–67. [Google Scholar] [CrossRef]
  34. Walkey, A.; Black, T.A. An examination of the Dugtijaraff method for determining soil organic matter and proposed modification of the chronic and titration method. Soil Sci. 1934, 37, 23–38. [Google Scholar]
  35. Vance, E.D.; Brookes, P.C.; Jenkinson, D.S. An extraction method for measuring soil microbial biomass C. Soil Biol. Biochem. 1987, 19, 703–707. [Google Scholar] [CrossRef]
  36. Casida, L.E., Jr.; Klein, D.A.; Santoro, T. Soil dehydrogenase activity. Soil Sci. 1964, 98, 371–376. [Google Scholar] [CrossRef]
  37. Choudhary, M.; Rana, K.S.; Bana, R.S.; Ghasal, P.C.; Choudhary, G.L.; Jakhar, P.; Verma, R.K. Energy budgeting and carbon foot-print of pearlmillet-mustard cropping system under conventional and conservation agriculture in rainfed semi-arid agro-ecosystem. Energy 2017, 141, 1052–1058. [Google Scholar] [CrossRef]
  38. Yadav, G.S.; Lal, R.; Meena, R.S.; Datta, M.; Babu, S.; Das, A.; Layek, J.; Saha, P. Energy budgeting for designing sustainable and environmentally clean/safer cropping systems for rainfed rice fallow lands in India. J. Clean. Prod. 2017, 158, 29–37. [Google Scholar] [CrossRef]
  39. Lal, B.; Gautam, P.; Panda, B.; Tripathi, R.; Shahid, M.; Bihari, P.; Guru, P.; Singh, T.; Meena, R.; Nayak, A. Identification of energy and carbon efficient cropping system for ecological sustainability of rice fallow. Ecol. Indic. 2020, 115, 106431. [Google Scholar] [CrossRef]
  40. Pratibha, G.; Srinivas, I.; Rao, K.; Raju, B.; Thyagaraj, C.; Korwar, G.; Venkateswarlu, B.; Shanker, A.K.; Choudhary, D.K.; Srinivasarao, C. Impact of conservation agriculture practices on energy use efficiency and global warming potential in rainfed pigeonpea–castor systems. Eur. J. Agron. 2015, 66, 30–40. [Google Scholar] [CrossRef]
  41. Tubiello, F.N.; Salvatore, M.; Ferrara, A.F.; House, J.; Federici, S.; Rossi, S.; Biancalani, R.; Golec, R.D.C.; Jacobs, H.; Flammini, A.; et al. The contribution of agriculture, forestry and other land use activities to global warming, 1990–2012. Glob. Change Biol. 2015, 21, 2655–2660. [Google Scholar] [CrossRef] [PubMed] [Green Version]
  42. Padre, T.A.; Rai, M.; Kumar, V.; Gathala, M.; Sharma, P.C.; Sharma, S.; Nagar, R.K.; Deshwal, S.; Singh, L.K.; Jat, H.S.; et al. Quantifying changes to the global warming potential of rice-wheat systems with the adoption of conservation agriculture in north-western India. Agric. Ecosyst. Environ. 2016, 219, 125–137. [Google Scholar] [CrossRef]
  43. Jat, S.L.; Parihar, C.M.; Singh, A.K.; Nayak, H.S.; Meena, B.R.; Kumar, B.; Parihar, M.D.; Jat, M.L. Differential response from nitrogen sources with and without residue management under conservation agriculture on crop yields, water-use and economics in maize-based rotations. Field Crop. Res. 2019, 236, 96–110. [Google Scholar] [CrossRef]
  44. Allen, R.G.; Pereira, L.S.; Raes, D.; Smith, M. Crop Evapotranspiration. In Guidelines for Computing Crop Water Requirements; FAO Irrigation and Drainage Paper 56; FAO: Rome, Italy, 1998; p. 300. [Google Scholar]
  45. Salter, P.J. Methods of Determining the Moisture Characteristics of Soils. Exp. Agric. 1967, 3, 163–173. [Google Scholar] [CrossRef]
  46. Naik, S.K.; Maurya, S.; Bhatt, B.P. Soil organic carbon stocks and fractions in different orchards of eastern plateau and hill region of India. Agrofor. Syst. 2017, 91, 541–552. [Google Scholar] [CrossRef]
  47. Mondal, S.; Poonia, S.P.; Mishra, J.S.; Bhatt, B.P.; Karnena, K.R.; Saurabh, K.; Kumar, R.; Chakraborty, D. Short-term (5 years) impact of conservation agriculture on soil physical properties and organic carbon in a rice–wheat rotation in the Indo-Gangetic plains of Bihar. Eur. J. Soil Sci. 2020, 71, 1076–1089. [Google Scholar] [CrossRef]
  48. Chivenge, P.; Murwira, H.; Giller, K.; Mapfumo, P.; Six, J. Long-term impact of reduced tillage and residue management on soil carbon stabilization: Implications for conservation agriculture on contrasting soils. Soil Tillage Res. 2007, 94, 328–337. [Google Scholar] [CrossRef]
  49. Campbell, C.A.; Lafond, G.P.; Biederbeck, V.O.; Wen, G.; Schoenau, J.; Hahn, D. Seasonal trends in soil biochemical attributes: Effects of crop management on a Black Chernozem. Can. J. Soil Sci. 1999, 79, 85–97. [Google Scholar] [CrossRef]
  50. Ghimire, B.; Ghimire, R.; VanLeeuwen, D.; Mesbah, A. Cover crop residue amount and quality effects on soil organic carbon min-eralization. Sustainability 2017, 9, 2316. [Google Scholar] [CrossRef] [Green Version]
  51. Lou, Y.; Ren, L.; Li, Z.; Zhang, T.; Inubushi, K. Effect of Rice Residues on Carbon Dioxide and Nitrous Oxide Emissions from a Paddy Soil of Subtropical China. Water Air Soil Pollut. 2007, 178, 157–168. [Google Scholar] [CrossRef]
  52. Mandal, B.; Majumder, B.; Adhya, T.K.; Bandyopadhyay, P.K.; Gangopadhyay, A.; Sarkar, D.; Kundu, M.C.; Choudhury, S.G.; Hazra, G.C.; Kundu, S.; et al. Potential of double-cropped rice ecology to conserve organic carbon under subtropical climate. Glob. Chang. Biol. 2008, 14, 2139–2151. [Google Scholar] [CrossRef]
  53. Six, J.A.Ε.Τ.; Elliott, E.T.; Paustian, K. Soil macroaggregate turnover and microaggregate formation: A mechanism for C sequestra-tion under no-tillage agriculture. Soil Biol. Biochem. 2000, 32, 2099–2103. [Google Scholar] [CrossRef]
  54. Olk, D.; Cassman, K.; Schmidt-Rohr, K.; Anders, M.; Mao, J.-D.; Deenik, J. Chemical stabilization of soil organic nitrogen by phenolic lignin residues in anaerobic agroecosystems. Soil Biol. Biochem. 2006, 38, 3303–3312. [Google Scholar] [CrossRef] [Green Version]
  55. Bruelle, G.; Naudin, K.; Scopel, E.; Domas, R.; Rabeharisoa, L.; Tittonell, P. Short- to mid-term impact of conservation agriculture on yield variability of upland rice: Evidence from farmer’s fields in madagascar. Exp. Agric. 2015, 51, 66–84. [Google Scholar] [CrossRef] [Green Version]
  56. Bhattacharyya, R.; Prakash, V.; Kundu, S.; Srivastva, A.K.; Gupta, H.S. Effect of long-term manuring on soil organic carbon, bulk density and water retention characteristics under soybean-wheat cropping sequence in North-Western Himalayas. J. Ind. Soc. Soil Sci. 2004, 52, 238–242. [Google Scholar]
  57. Munkholm, L.J.; Schjønning, P.; Rasmussen, K.J.; Tanderup, K. Spatial and temporal effects of direct drilling on soil structure in the seedling environment. Soil Tillage Res. 2003, 71, 163–173. [Google Scholar] [CrossRef]
  58. Singh, V.K.; Dwivedi, B.S.; Singh, S.K.; Majumdar, K.; Jat, M.L.; Mishra, R.P.; Rani, M. Soil physical properties, yield trends and economics after five years of conservation agriculture-based rice-maize system in North-Western India. Soil Till. Res. 2016, 155, 133–148. [Google Scholar] [CrossRef]
  59. Venkatesh, M.S.; Hazra, K.K.; Ghosh, P.K.; Khuswah, B.L.; Ganeshamurthy, A.N.; Ali, M.; Singh, J.; Mathur, R.S. Long–term ef-fect of crop rotation and nutrient management on soil–plant nutrient cycling and nutrient budgeting in Indo–Gangetic plains of India. Arch. Agron. Soil Sci. 2017, 63, 2007–2022. [Google Scholar] [CrossRef]
  60. Parihar, C.; Jat, S.; Singh, A.; Kumar, B.; Singh, Y.; Pradhan, S.; Pooniya, V.; Dhauja, A.; Chaudhary, V.; Jat, M.; et al. Conservation agriculture in irrigated intensive maize-based systems of north-western India: Effects on crop yields, water productivity and economic profitability. Field Crop Res. 2016, 193, 104–116. [Google Scholar] [CrossRef]
  61. Choudhary, R.; Singh, P.; Sidhu, H.S.; Nandal, D.P.; Jat, H.S.; Jat, M.L. Evaluation of tillage and crop establishment methods inte-grated with relay seeding of wheat and mungbean for sustainable intensification of cotton-wheat system in South Asia. Field Crops Res. 2016, 199, 31–41. [Google Scholar] [CrossRef]
  62. Das, T.; Saharawat, Y.; Bhattacharyya, R.; Sudhishri, S.; Bandyopadhyay, K.; Sharma, A.; Jat, M. Conservation agriculture effects on crop and water productivity, profitability and soil organic carbon accumulation under a maize-wheat cropping system in the North-western Indo-Gangetic Plains. Field Crop Res. 2018, 215, 222–231. [Google Scholar] [CrossRef]
  63. Chen, G.; Kong, X.; Gan, Y.; Zhang, R.; Feng, F.; Yu, A.; Zhao, C.; Wan, S.; Chai, Q. Enhancing the systems productivity and water use efficiency through coordinated soil water sharing and compensation in strip-intercropping. Sci. Rep. 2018, 8, 10494. [Google Scholar] [CrossRef] [PubMed] [Green Version]
  64. Sharma, A.R.; Singh, R.; Dhyani, S.K. Conservation tillage and mulching for optimizing productivity in maize-wheat cropping sys-tem in the outer western Himalaya region—A review. Ind. J. Soil Conserv. 2015, 33, 35–41. [Google Scholar]
  65. Devasenapathy, P.; Senthilkumar, G.; Shanmugam, P.M. Energy management in crop production. Indian J. Agron. 2009, 54, 80–90. [Google Scholar]
  66. Lal, R. Carbon emission from farm operations. Environ. Int. 2004, 30, 981–990. [Google Scholar] [CrossRef]
  67. Wang, H.; Yang, Y.; Zhang, X.; Tian, G. Carbon footprint analysis for mechanization of maize production based on life cycle assessment: A case study in Jilin Province, China. Sustainability 2015, 7, 15772–15784. [Google Scholar] [CrossRef]
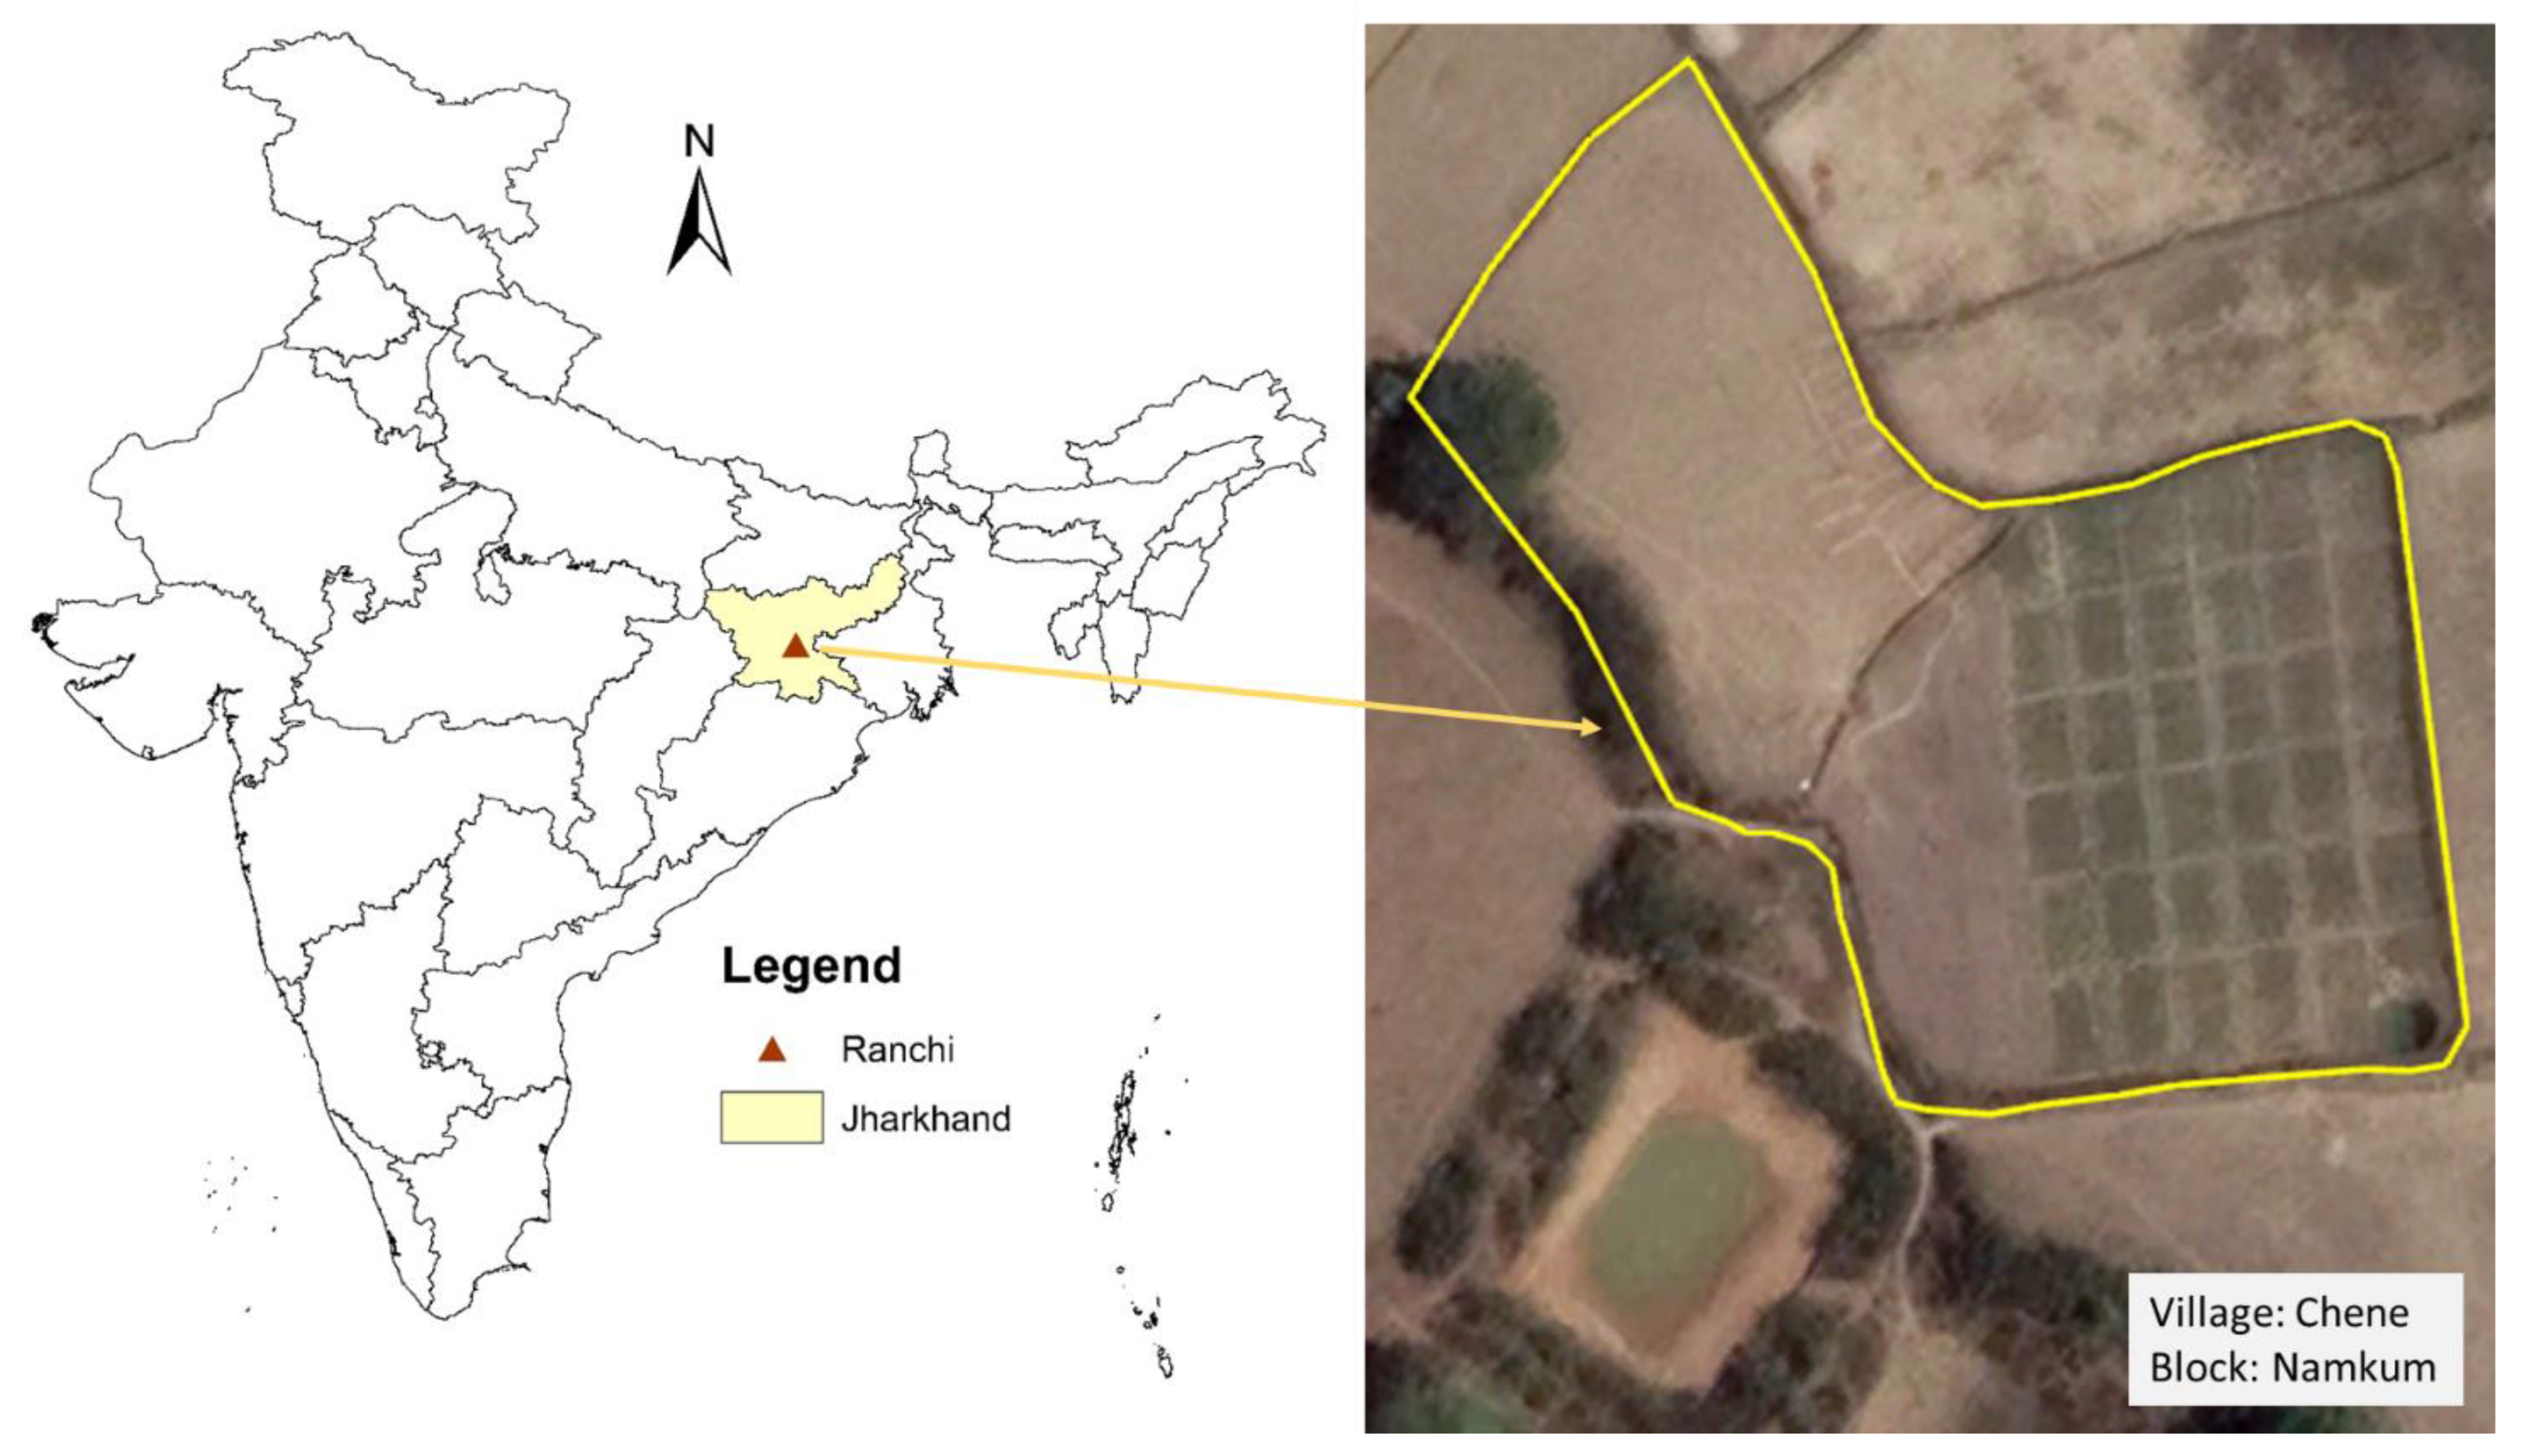
Figure 1. Location of the experimental sites in India.
Sustainability 15 01054 g001
Figure 2. Cropping calendar of different treatments from 2015–2020. RF: Rice-fallow; CP: Conventional practice; CA1: Conservation agriculture-1; CA2: Conservation agriculture-2, LPT: Land preparation time.
Sustainability 15 01054 g002
Figure 3. Annual water use of crops during last three cropping years (2017–2020). RF: Rice-fallow; CP: Conventional practice; CA1: Conservation agriculture-1; CA2: Conservation agriculture-2.
Sustainability 15 01054 g003
Figure 4. Trends in system water productivity of rice–mustard–blackgram cropping system under different cultivation practices. CP: Conventional practice; CA1: Conservation agriculture-1; CA2: Conservation agriculture-2.
Sustainability 15 01054 g004
Figure 5. Contribution of different inputs, CH4 and N2O emission toward carbon footprint (CFs) of rice and mustard.
Sustainability 15 01054 g005
Figure 6. Contribution of different inputs, CH4 and N2O emission toward carbon footprint (CFs) of blackgram and cropping system as a whole.
Sustainability 15 01054 g006
Figure 7. PCA biplot (biplot shows both PC scores of cultivation practices and loadings of variables comprising soil organic carbon dynamics after 5 years of cropping). FL, Fallow land; RF, Rice-fallow; CP, Conventional practice; CA1, Conservation agriculture practice 1; CA2, Conservation agriculture practice 2; TSOC, Total soil organic carbon; VL, very labile carbon; L, labile carbon; LL, Less labile carbon; NL, Non-labile carbon; AP, Active pool; PP, Passive pool; CSR, Carbon sequestration rate; CRE, Carbon retention efficiency; SMBC, Soil microbial biomass carbon; DHA, Dehydrogenase activity; CBS, Total carbon build-up.
Sustainability 15 01054 g007
Figure 8. Relationship between system rice equivalent yield and water productivity (pooled data of last three years of cropping, 2017–2020).
Sustainability 15 01054 g008
Figure 9. PCA biplot (biplot shows both PC scores of cultivation practices and loadings of variables comprising energy and carbon budgeting after 5 years of cropping). CP, Conventional practice; CA1, Conservation agriculture practice 1; CA2, Conservation agriculture practice 2; IE, Input energy; OE, Output energy; NE, Net energy; EUE, Energy use efficiency; EP, Energy productivity; SE, Specific energy; Epr, Energy profitability; CFs, Carbon footprint-kg ha−1; CFy, Carbon footprint-kg Mg−1; CI, Carbon input; CO, Carbon output; CSI, Carbon sustainability index; CE, Carbon efficiency; SREY, System rice equivalent yield; SWP, System water productivity.
Sustainability 15 01054 g009
Table 1. Distributions of total SOC at different soil depths influenced by conventional and CA after five years of cropping.
Treatments Total Soil Organic Carbon (Mg C ha−1)Carbon Sequestration Rate (Mg C ha−1 year−1)
0–0.15 m0.15–0.30 m0.30–0.45 m0.45–0.60 mTotal (0–0.60 m)
FL15.43 b11.97 a10.87 a8.63 a46.90 b-
RF14.45 b11.16 b10.27 a7.95 a43.83 c−0.61 b
CP14.81 b11.57 b10.95 a8.07 a45.40 bc−0.30 b
CA118.59 a14.40 a9.94 a6.71 b49.63 a0.55 a
CA218.42 a13.55 a10.38 a7.74 ab50.08 a0.64 a
FL: Fallow land; RF: Rice-fallow; CP: Conventional practice; CA1: Conservation agriculture-1; CA2: Conservation agriculture-2. Values within a column followed by different letters are significantly different at p ≤ 0.05 according to Duncan’s multiple range tests.
Table 2. Effect of different cultivation practices on SOC fractions after five years of cropping.
TreatmentsSoil Organic Carbon Fraction (Mg C ha−1 Soil)
Very Labile Pool (VLC)Labile Pool (LC)
0–0.15 m0.15–0.30 m0.30–0.45 m0.45–0.60 mTotal
0–0.60 m
0–0.15 m0.15–0.30 m0.30–0.45 m0.45–0.60 mTotal
0–0.60 m
FL5.19 b3.25 b3.11 b2.06 a13.61 b3.38 bc2.88 abc2.40 a2.24 a10.89 b
RF4.97 b3.12 b2.86 c1.96 a12.91 b3.22 c2.64 c2.17 ab2.22 a10.25 b
CP5.01 b3.20 b2.92 c1.95 a13.08 b3.27 c2.75 bc2.39 a2.30 a10.70 b
CA17.51 a4.96 a3.56 ab2.00 a18.03 a3.58 ab3.36 a1.98 b1.91 a10.82 b
CA27.90 a5.00 a3.74 a2.15 a18.78 a3.70 a3.19 ab2.53 a2.32 a11.74 a
Less labile pool (LLC)Non-labile pool (NLC)
FL2.96 a2.88 a2.67 a2.19 a10.70 a3.90 b2.96 bc2.69 a2.15 a11.70 ab
RF2.73 a2.68 a2.64 a1.90 a9.95 a3.52 b2.73 c2.61 a1.86 a10.73 b
CP2.86 a2.75 a2.92 a1.83 a10.36 a3.66 b2.88 bc2.72 a1.99 a11.26 ab
CA12.88 a2.49 a1.91 b1.15 b8.43 b4.62 a3.58 a2.48 a1.67 a12.35 a
CA22.25 b1.99 b1.54 b1.36 b7.13 c4.57 a3.35 ab2.58 a1.92 a12.42 a
FL: Fallow land; RF: Rice-fallow; CP: Conventional practice; CA1: Conservation agriculture-1; CA2: Conservation agriculture-2. Values within a column followed by different letters are significantly different at p ≤ 0.05 according to Duncan’s multiple range tests.
Table 3. Depth-wise distributions of active and passive pools of SOC as influenced by different cultivation after five years of cropping.
TreatmentsActive Carbon Pool (Mg ha−1)
0–0.15 m0.15–0.30 m0.30–0.45 m0.45–0.60 mTotal
0–0.60 m
FL8.57 b6.13 b5.51 b4.30 a24.50 c
RF8.19 b5.76 b5.02 b4.18 a23.16 d
CP8.28 b5.95 b5.30 b4.25 a23.78 cd
CA111.09 a8.32 a5.54 b3.91 a28.85 b
CA211.59 a8.19 a6.27 a4.47 a30.52 a
Passive carbon pool (Mg ha−1)
FL6.85 b5.85 a5.36 a4.34 a22.39 a
FP6.26 b5.41 a5.25 a3.76 ab20.67 ab
CP6.53 b5.62 a5.64 a3.82 ab21.62 a
CA17.49 a6.07 a4.39 b2.82 c20.78 ab
CA26.82 b5.34 a4.11 b3.28 bc19.56 b
RF: Fallow land; FP: Rice-fallow; CP: Conventional practice; CA1: Conservation agriculture-1; CA2: Conservation agriculture-2. Values within a column followed by different letters are significantly different at p ≤ 0.05 according to Duncan’s multiple range tests.
Table 4. Carbon build-up and retention under conventional and conservation agricultural practices after five years of cropping.
TreatmentsCarbon Left in Soil (Mg ha−1)Carbon Build-Up (%)Carbon Retention Efficiency (%)
TotalActive PoolPassive PoolTotalActive PoolPassive Pool
RF−3.06 b−1.34 c−1.72 a−6.57 b−5.43 c−7.64 a−30.80 c
CP−1.50 b−0.72 c−0.78 a−3.20 b−2.82 c−3.49 a−7.35 b
CA12.74 a4.35 b−1.62 a5.85 a17.84 b−7.33 a10.95 a
CA23.18 a6.02 a−2.84 a6.82 a24.66 a−12.64 a12.52 a
RF: Rice-fallow; CP: Conventional practice; CA1: Conservation agriculture-1; CA2: Conservation agriculture-2. Values within a column followed by different letters are significantly different at p ≤ 0.05 according to Duncan’s multiple range tests.
Table 5. Effect of different cultivation practices on SMBC and dehydrogenase activity after five years of cropping.
TreatmentsSoil Microbial Biomass Carbon (µg g−1)
0–0.15 m0.15–0.30 m0.30–0.45 m0.45–0.60 m
FL93.6 b86.8 b48.5 a22.2 a
RF84.0 b82.4 b50.2 a19.7 a
CP88.3 b87.7 b56.0 a18.2 a
CA1121.5 a100.3 ab54.3 a20.7 a
CA2118.6 a109.0 a52.1 a19.4 a
Dehydrogenase activity (µg TPF g−1 day−1)
FL188.6 a150.6 bc99.5 a65.2 a
RF168.5 b152.7 c93.4 a54.1 a
CP172.5 b155.6 bc101.7 a60.8 a
CA1197.8 a165.6 ab108.2 a59.6 a
CA2196.1 a171.8 a111.5 a55.8 a
FL: Fallow land; RF: Rice-fallow; CP: Conventional practice; CA1: Conservation agriculture-1; CA2: Conservation agriculture-2. Values within a column followed by different letters are significantly different at p ≤ 0.05 according to Duncan’s multiple range tests.
Table 6. Crop productivity and system rice equivalent yield in different cultivation practices for the last three cropping years.
TreatmentsRice Yield (Mg ha−1)Mean
2017–20182018–20192019–2020
RF3.33 a3.77 ab3.44 b3.51 a
CP3.49 a4.03 a3.27 b3.60 a
CA12.74 b3.24 c3.68 ab3.22 b
CA22.55 b3.40 bc4.11 a3.35 ab
Mustard yield (Mg ha−1)
CP0.29 a0.27 b0.31 b0.29 b
CA10.25 a0.25 b0.32 b0.28 b
CA20.27 a0.31 a0.39 a0.33 a
Blackgram yield (Mg ha−1)
CP0.22 a0.23 a0.20 b0.22 a
CA10.19 a0.24 a0.21 ab0.21 a
CA20.21 a0.25 a0.23 a0.23 a
System rice equivalent yield (Mg ha−1)Mean
CP5.05 a5.56 a4.80 b5.14 a
CA14.10 b4.77 b5.28 b4.72 b
CA24.04 b5.11 ab5.94 a5.03 a
RF: Rice-fallow; CP: Conventional practice; CA1: Conservation agriculture-1; CA2: Conservation agriculture-2. Values within a column followed by different letters are significantly different at p ≤ 0.05 according to Duncan’s multiple range tests.
Table 7. Crop water productivity and systems water productivity under different cultivation practices for the last three cropping years.
TreatmentsRice (kg ha−1 mm−1)
2017–20182018–20192019–2020Mean
RF8.36 a9.87 ab9.02 b9.08 bc
CP8.76 a10.55 a8.57 c9.30 b
CA17.01 c8.93 b10.69 b8.88 c
CA27.32 b10.13 a12.40 a9.95 a
Mustard (kg ha−1 mm−1)
CP1.01 a1.12 a1.01 c1.05 c
CA10.99 b1.13 b1.17 b1.09 b
CA21.06 a1.41 a1.42 a1.30 a
Blackgram (kg ha−1 mm−1)
CP0.84 b0.82 c0.77 c0.81 c
CA10.79 c0.90 b0.89 b0.86 b
CA20.87 a0.93 a0.96 a0.92 a
System (REY kg ha−1 mm−1)
CP5.32 a6.20 a5.06 c5.53 b
CA14.60 c5.63 b6.16 b5.46 b
CA24.76 b6.23 a7.04 a6.01 a
RF: Rice-fallow; CP: Conventional practice; CA1: Conservation agriculture-1; CA2: Conservation agriculture-2. Values within a column followed by different letters are significantly different at p ≤ 0.05 according to Duncan’s multiple range tests.
Table 8. Energy budgeting under different cultivation practices after five years of cropping.
ParametersTreatmentsCrops
RiceMustardBlackgramMeanSystem
Input energy (IE, MJ ha−1)CP12,404 a6054 a5046 a7835 a23,504 a
CA110,922 b5325 b4473 b6907 b20,721 b
CA29812 b5320 b4438 b6523 b19,570 b
Mean11,04655664652
Output energy (OE, MJ ha−1)CP112,023 b17,396 b9956 a46,459 b139,376 b
CA1129,093 ab18,023 b10,957 a52,691 ab158,073 ab
CA2144,308 a21,808 a11,301 a59,139 a177,417 a
Mean128,47519,07610,738
Net energy (NE, MJ ha−1)CP99,619 b11,343 b4910 b38,624 b115,872 b
CA1118,170 ab12,698 b6484 a45,784 ab137,352 ab
CA2134,495 a16,488 a6863 a52,616 a157,847 a
Mean117,42813,5106086
Energy use efficiency (EUE)CP9.42 b2.88 c1.97 b4.76 c6.00 b
CA112.15 b3.38 b2.45 a5.99 b7.72 ab
CA215.40 a4.10 a2.54 a7.35 a9.21 a
Mean12.323.452.32
Energy productivity (EP, kg MJ−1)CP0.276 b0.126 c0.151 c0.184 c0.207 b
CA10.347 b0.148 b0.181 b0.225 b0.258 ab
CA20.438 a0.180 a0.196 a0.271 a0.307 a
Mean0.3540.1510.176
Specific energy (SE, MJ kg−1)CP3.98 a7.96 a6.63 a6.19 a5.01 a
CA13.06 ab6.80 b5.53 b5.13 b3.95 b
CA22.45 b5.57 c5.12 c4.38 c3.33 b
Mean3.166.785.76
Energy profitability (EPr)CP8.42 b1.88 c0.97 b3.76 c5.00 b
CA111.15 b2.38 b1.45 a4.99 b6.72 ab
CA214.40 a3.10 a1.54 a6.35 a8.21 a
Mean11.322.451.32
Values within a column followed by different letters are significantly different at p ≤ 0.05 according to Duncan’s multiple range tests.
Table 9. Carbon budgeting in different cultivation practices after five years of cropping.
ParametersTreatmentsCrops
RiceMustardBlackgramMeanSystem
Carbon footprint (CFs, CO2-e kg ha−1)CP1670 a615 a458 a914 a2743 a
CA11585 b592 a421 b866 b2598 b
CA21297 c593 a421 b770 c2311 c
Mean1517600433
CFy (CO2-e kg Mg−1)CP525 a818 a601 a648 a1944 a
CA1437 b756 a521 b571 b1714 b
CA2320 c624 b483 b476 c1427 c
Mean427733535
Carbon input (CI, kg ha−1)CP451 a166 a124 a247 a741 a
CA1428 b160 a114 b234 b701 b
CA2350 c160 a114 b208 c624 c
Mean410162117
Carbon output (CO, kg ha−1)CP3354 b432 b305 a1364 b4091 b
CA13872 ab447 b336 a1552 ab4655 ab
CA24328 a541 a346 a1738 a5215 a
Mean3852473329
CSI (Carbon sustainability index)CP6.43 b1.60 b1.47 b3.17 c4.52 c
CA18.03 b1.79 b1.97 a3.93 b5.63 b
CA211.40 a2.39 a2.04 a5.28 a7.38 a
Mean8.621.931.83
Carbon efficiency (CE)CP7.43 b2.60 b2.47 b4.17 c5.52 c
CA19.03 b2.79 b2.97 a4.93 b6.63 b
CA212.40 a3.39 a3.04 a6.28 a8.38 a
Mean9.622.932.83
Values within a column followed by different letters are significantly different at p ≤ 0.05 according to Duncan’s multiple range tests.
Disclaimer/Publisher’s Note: The statements, opinions and data contained in all publications are solely those of the individual author(s) and contributor(s) and not of MDPI and/or the editor(s). MDPI and/or the editor(s) disclaim responsibility for any injury to people or property resulting from any ideas, methods, instructions or products referred to in the content.