

Assessment of Machine Learning Methods for Urban Types Classification Using Integrated SAR and Optical Images in Nonthaburi, Thailand


Abstract
1. Introduction
2. Methods
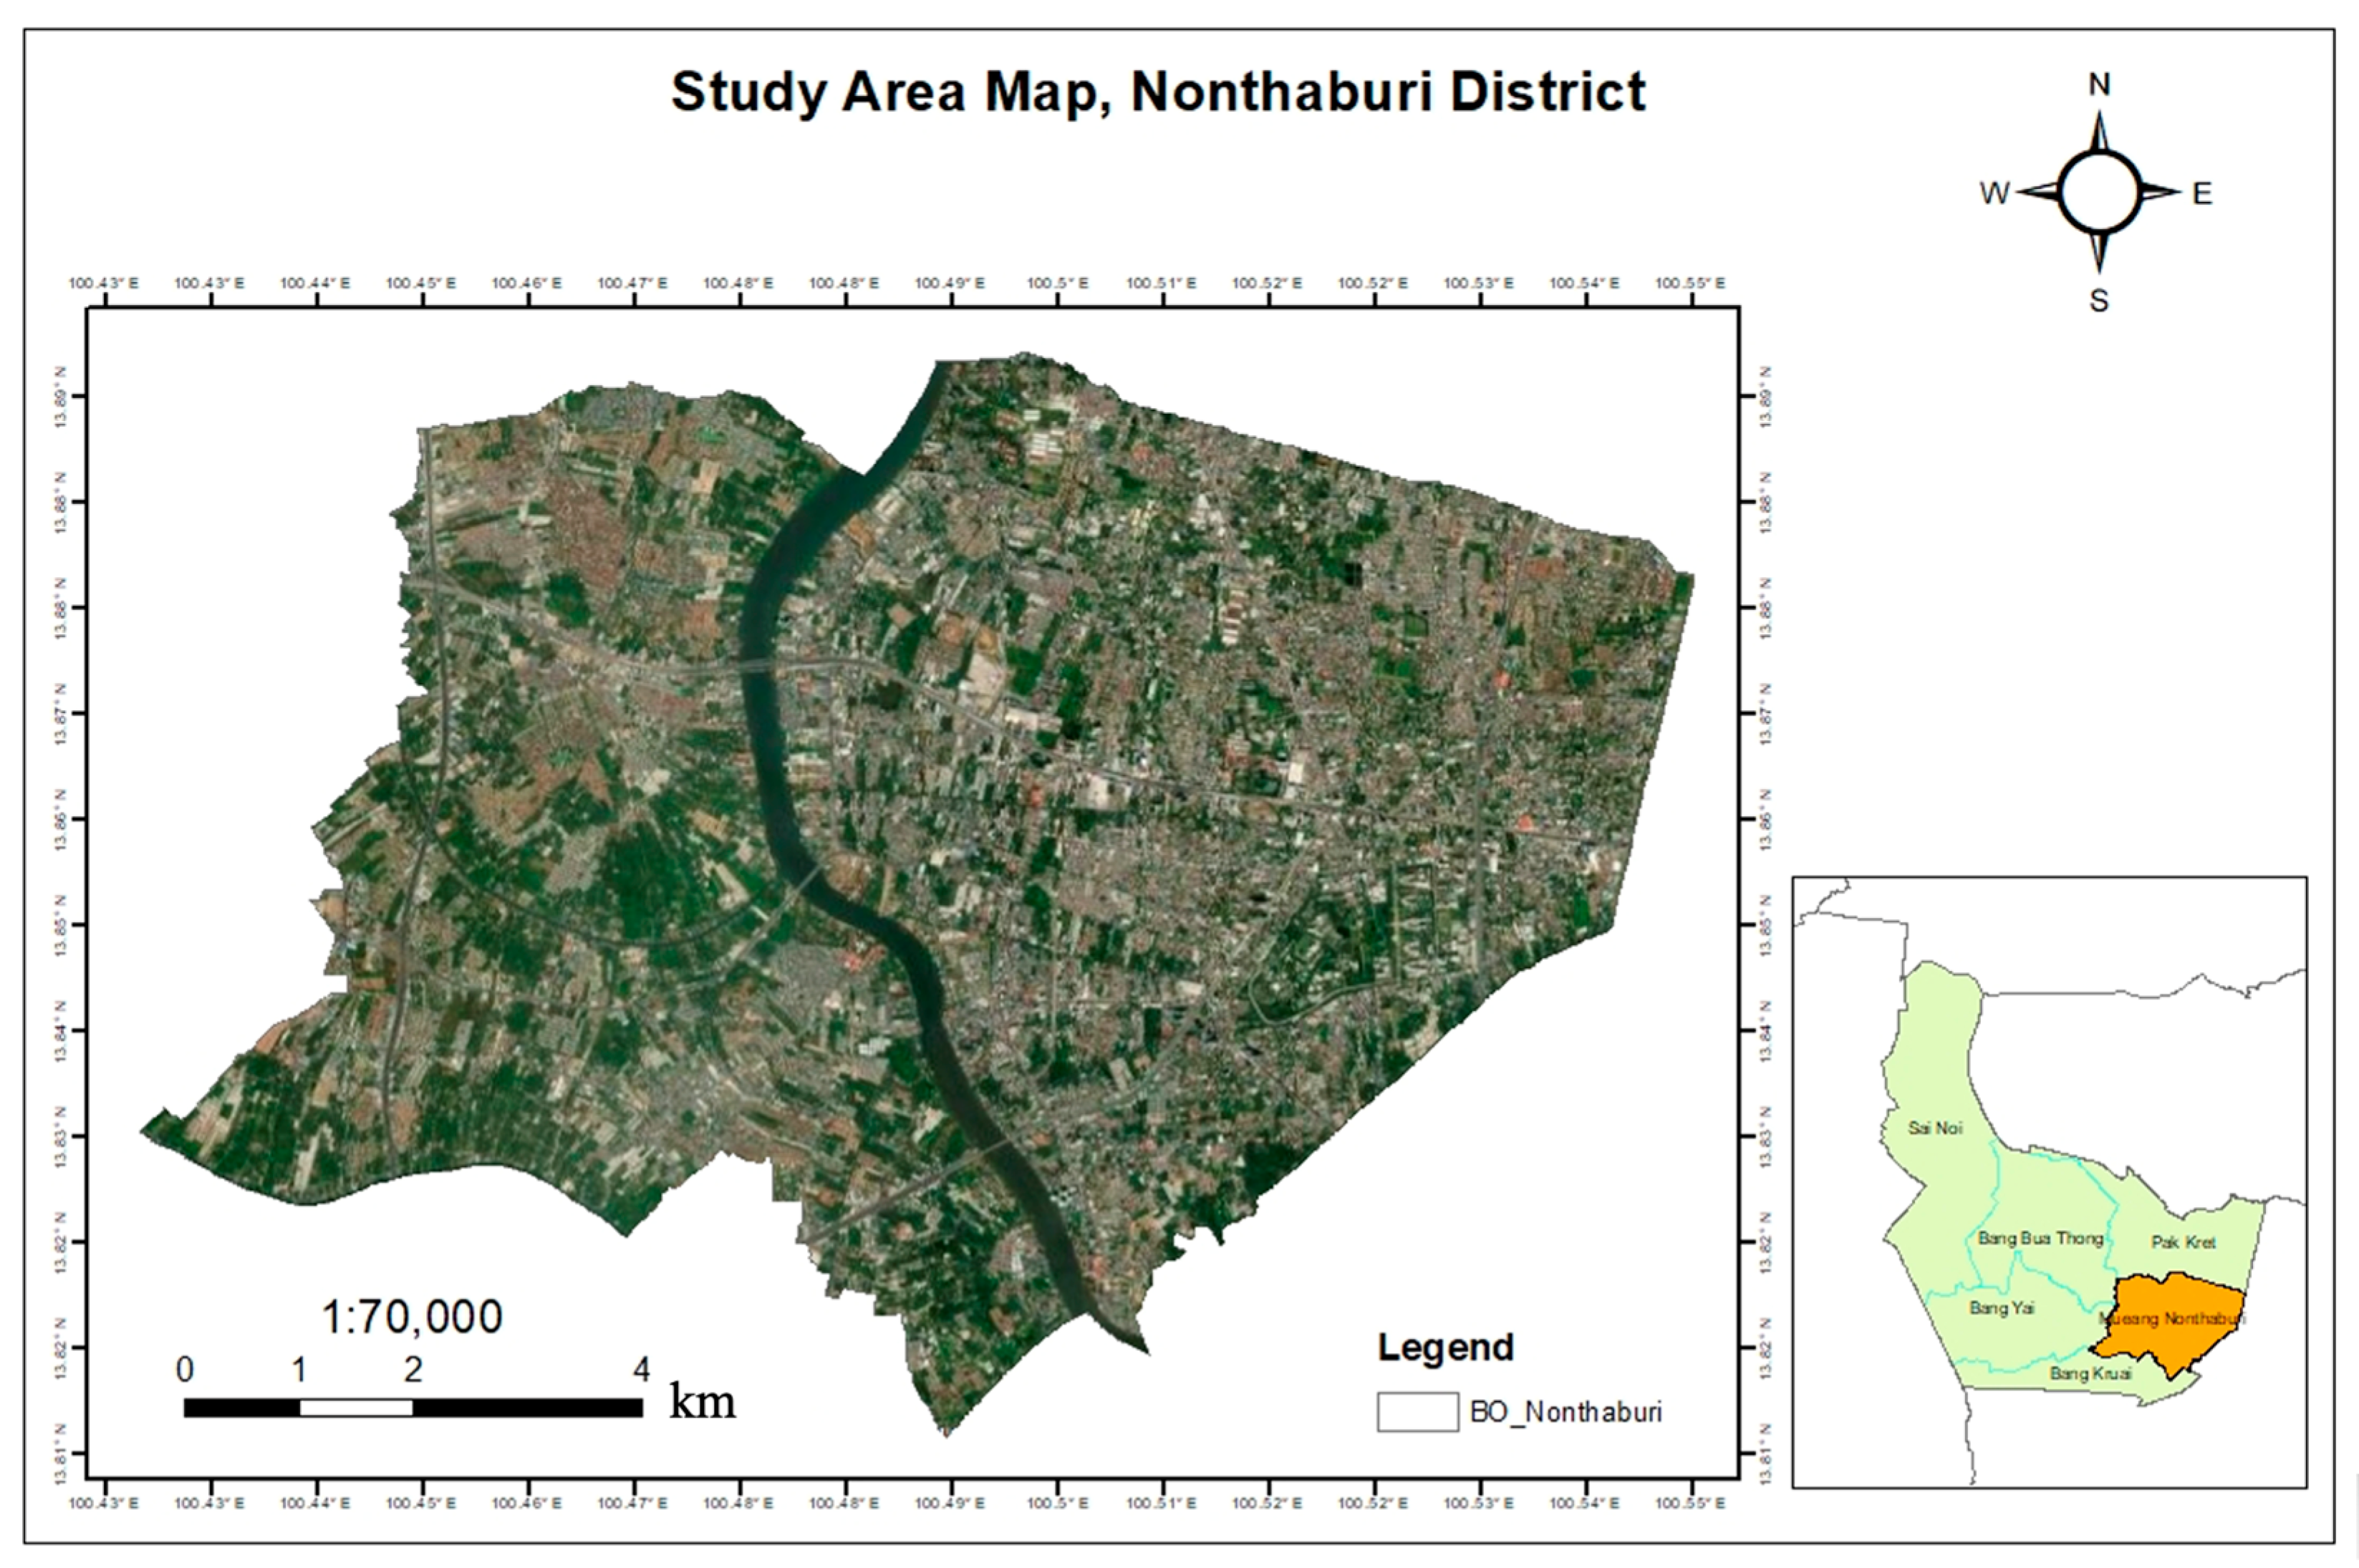
2.1. Study Area
2.2. Data
2.2.1. Building Blocks
2.2.2. Sentinel-1 Images
2.2.3. Sentinel-2A Images
2.3. Overall Methodology
2.4. Data Preprocessing
2.4.1. Preprocessing of Sentinel-1 SAR
2.4.2. Sentinel-2A Optical Image Preprocessing
2.5. Machine Learning Classification of Urban Types
3. Result and Discussion
3.1. Relationship of Building Heights and Backscatter Values
3.2. Developing of VVH Indicator
3.3. Building Height Model
3.4. Urban Types Classification
3.5. Urban Types Mapping
4. Discussion
4.1. Building Height Estimation
4.2. Urban Types Classification
5. Conclusions
Author Contributions
Funding
Institutional Review Board Statement
Informed Consent Statement
Data Availability Statement
Conflicts of Interest
References
- Losiri, C.; Nagai, M.; Ninsawat, S.; Shrestha, R.P. Modeling Urban Expansion in Bangkok Metropolitan Region Using Demographic–Economic Data through Cellular Automata-Markov Chain and Multi-Layer Perceptron-Markov Chain Models. Sustainability 2016, 8, 686. [Google Scholar] [CrossRef]
- Limgomonvilas, T. Prediction for Nonthaburi Urban Parks by Integrated Geo-Informatics Techniques. Int. J. Technol. Eng. Stud. 2017, 3, 20–28. [Google Scholar]
- Chini, M.; Pelich, R.; Hostache, R.; Matgen, P. Built-up areas mapping at global scale based on adaptive parametric thresholding of Sentinel-1 intensity & coherence time series. In Proceedings of the 2017 9th International Workshop on the Analysis of Multitemporal Remote Sensing Images, MultiTemp 2017, Bruges, Belgium, 27–29 June 2017; pp. 12–15. [Google Scholar] [CrossRef]
- Misra, P.; Avtar, R.; Takeuchi, W. Comparison of Digital Building Height Models Extracted from AW3D, TanDEM-X, ASTER, and SRTM Digital Surface Models over Yangon City. Remote Sens. 2018, 10, 2008. [Google Scholar] [CrossRef]
- Holobâcă, I.-H.; Ivan, K.; Alexe, M. Extracting built-up areas from Sentinel-1 imagery using land-cover classification and texture analysis. Int. J. Remote Sens. 2019, 40, 8054–8069. [Google Scholar] [CrossRef]
- Jacob, A.W.; Vicente-Guijalba, F.; Lopez-Martinez, C.; Lopez-Sanchez, J.M.; Litzinger, M.; Kristen, H.; Mestre-Quereda, A.; Ziolkowski, D.; Lavalle, M.; Notarnicola, C.; et al. Sentinel-1 InSAR Coherence for Land Cover Mapping: A Comparison of Multiple Feature-Based Classifiers. IEEE J. Sel. Top. Appl. Earth Obs. Remote Sens. 2020, 13, 535–552. [Google Scholar] [CrossRef]
- Semenzato, A.; Pappalardo, S.E.; Codato, D.; Trivelloni, U.; De Zorzi, S.; Ferrari, S.; De Marchi, M.; Massironi, M. Mapping and Monitoring Urban Environment through Sentinel-1 SAR Data: A Case Study in the Veneto Region (Italy). ISPRS Int. J. Geo-Inf. 2020, 9, 375. [Google Scholar] [CrossRef]
- Sica, F.; Pulella, A.; Nannini, M.; Pinheiro, M.; Rizzoli, P. Repeat-pass SAR interferometry for land cover classification: A methodology using Sentinel-1 Short-Time-Series. Remote Sens. Environ. 2019, 232, 111277. [Google Scholar] [CrossRef]
- Tavares, P.A.; Beltrão, N.E.S.; Guimarães, U.S.; Teodoro, A.C. Integration of Sentinel-1 and Sentinel-2 for Classification and LULC Mapping in the Urban Area of Belém, Eastern Brazilian Amazon. Sensors 2019, 19, 1140. [Google Scholar] [CrossRef] [PubMed]
- Haack, B.N. From Your Neighborhood to the Whole Planet. In Proceedings of the American Society for Photogrammetry and Remote Sensing—Annual Conference 2005—Geospatial Goes Global, Baltimore, MD, USA, 7–11 March 2005; Volume 1, pp. 324–334. [Google Scholar]
- Zhu, Z.; Woodcock, C.E.; Rogan, J.; Kellndorfer, J. Assessment of spectral, polarimetric, temporal, and spatial dimensions for urban and peri-urban land cover classification using Landsat and SAR data. Remote Sens. Environ. 2012, 117, 72–82. [Google Scholar] [CrossRef]
- MacLachlan, A.; Roberts, G.; Biggs, E.; Boruff, B. Subpixel land-cover classification for improved urban area estimates using Landsat. Int. J. Remote Sens. 2017, 38, 5763–5792. [Google Scholar] [CrossRef]
- Bai, Z.; Fang, S.; Gao, J.; Zhang, Y.; Jin, G.; Wang, S.; Zhu, Y.; Xu, J. Could Vegetation Index be Derive from Synthetic Aperture Radar?—The Linear Relationship between Interferometric Coherence and NDVI. Sci. Rep. 2020, 10, 6749. [Google Scholar] [CrossRef] [PubMed]
- Mazza, A.; Gargiulo, M.; Gaetano, R.; Scarpa, G. Estimating the NDVI from SAR by convolutional neural networks. In Proceedings of the International Geoscience and Remote Sensing Symposium (IGARSS), Valencia, Spain, 22–27 July 2018; pp. 1954–1957. [Google Scholar] [CrossRef]
- Jaturapitpornchai, R.; Matsuoka, M.; Kanemoto, N.; Kuzuoka, S.; Ito, R.; Nakamura, R. Sar-Image Based Urban Change Detection in Bangkok, Thailand Using Deep Learning. In Proceedings of the International Geoscience and Remote Sensing Symposium (IGARSS), Yokohama, Japan, 28 July–2 August 2019; pp. 7403–7406. [Google Scholar] [CrossRef]
- Corbane, C.; Faure, J.-F.; Baghdadi, N.; Villeneuve, N.; Petit, M. Rapid Urban Mapping Using SAR/Optical Imagery Synergy. Sensors 2008, 8, 7125–7143. [Google Scholar] [CrossRef] [PubMed]
- Izadi, M.; Saeedi, P. Three-Dimensional Polygonal Building Model Estimation From Single Satellite Images. IEEE Trans. Geosci. Remote Sens. 2011, 50, 2254–2272. [Google Scholar] [CrossRef]
- Ok, A.O.; Senaras, C.; Yuksel, B. Automated Detection of Arbitrarily Shaped Buildings in Complex Environments From Monocular VHR Optical Satellite Imagery. IEEE Trans. Geosci. Remote Sens. 2012, 51, 1701–1717. [Google Scholar] [CrossRef]
- Liu, W.; Yamazaki, F. Building height detection from high-resolution TerraSAR-X imagery and GIS data. In Proceedings of the Joint Urban Remote Sensing Event 2013, JURSE 2013, Sao Paulo, Brazil, 21–23 April 2013; pp. 33–36. [Google Scholar] [CrossRef]
- Sun, Y.; Shahzad, M.; Zhu, X.X. Building height estimation in single SAR image using OSM building footprints. In Proceedings of the 2017 Joint Urban Remote Sensing Event, JURSE 2017, Dubai, United Arab Emirates, 6–8 March 2017. [Google Scholar] [CrossRef]
- Li, X.; Zhou, Y.; Gong, P.; Seto, K.C.; Clinton, N. Developing a method to estimate building height from Sentinel-1 data. Remote Sens. Environ. 2020, 240, 111705. [Google Scholar] [CrossRef]
- Minh, D.H.T.; Le Toan, T.; Rocca, F.; Tebaldini, S.; Villard, L.; Réjou-Méchain, M.; Phillips, O.L.; Feldpausch, T.R.; Dubois-Fernandez, P.; Scipal, K.; et al. SAR tomography for the retrieval of forest biomass and height: Cross-validation at two tropical forest sites in French Guiana. Remote Sens. Environ. 2016, 175, 138–147. [Google Scholar] [CrossRef]
- Liao, C.; Wang, J.; Shang, J.; Huang, X.; Liu, J. Sensitivity study of Radarsat-2 polarimetric SAR to crop height and fractional vegetation cover of corn and wheat. Int. J. Remote Sens. 2018, 39, 1475–1490. [Google Scholar] [CrossRef]
- QGIS Development Team. QGIS (Version 3.26.2-Bonn). Open Source Geospatial Foundation Project. 2022. Available online: https://qgis.org/en/site/ (accessed on 12 December 2022).
- Veci, L.; March, I. SENTINEL-1 Toolbox SAR Basics Tutorial. Esa, August, 1–20. Available online: http://step.esa.int/docs/tutorials/S1TBX%20SAR%20Basics%20Tutorial.pdf (accessed on 10 October 2022).
- Pat, S.; Chavez, J. An improved dark-object subtraction technique for atmospheric scattering correction of multispectral data. Remote Sens. Environ. 1988, 24, 459–479. [Google Scholar] [CrossRef]
- Mao, W.; Lu, D.; Hou, L.; Liu, X.; Yue, W. Comparison of Machine-Learning Methods for Urban Land-Use Mapping in Hangzhou City, China. Remote Sens. 2020, 12, 2817. [Google Scholar] [CrossRef]
- Ettehadi Osgouei, P.; Kaya, S.; Sertel, E.; Alganci, U. Separating built-up areas from bare land in mediterranean cities using Sentinel-2A imagery. Remote Sens. 2019, 11, 345. [Google Scholar]
- Tian, Y.; Wang, S.; Zhou, Y.; Liu, W.; Lin, C. Urban building height estimation from radarsat 2 imagery, a case study in Beijing, China. In Proceedings of the International Geoscience and Remote Sensing Symposium (IGARSS), Beijing, China, 10–15 July 2016; pp. 1066–1069. [Google Scholar] [CrossRef]


| Name | Acquisition Date | Resources |
|---|---|---|
| Sentinel-1 data | 23 March 2020 | European Space Agency |
| Sentinel-2A data | 21 February 2020 | European Space Agency |
| Building Blocks | 2012 | NOSTRA |
| Band | Spatial Resolution (m) | Wavelength (GHz) |
|---|---|---|
| HH | 5 | 5.405 |
| HV | 5 | 5.405 |
| VV | 5 | 5.405 |
| VH | 5 | 5.405 |
| Models | Residential | Commercial | Other buildings | Weighted Avg | Overall Accuracy | ||||
|---|---|---|---|---|---|---|---|---|---|
| Precision | Recall | Precision | Recall | Precision | Recall | Precision | Recall | ||
| RF | 0.74 | 1.00 | 0.8 | 0.33 | 1.00 | 0.12 | 0.78 | 0.75 | 0.75 |
| SVM | 0.90 | 0.95 | 0.8 | 0.67 | 0.75 | 0.75 | 0.86 | 0.86 | 0.86 |
| KNN | 0.75 | 0.97 | 1.00 | 0.5 | 0.5 | 0.12 | 0.76 | 0.76 | 0.76 |
| Models | Residential | Commercial | Other buildings | Weighted Avg | Overall Accuracy | ||||
|---|---|---|---|---|---|---|---|---|---|
| Precision | Recall | Precision | Recall | Precision | Recall | Precision | Recall | ||
| RF | 0.73 | 0.90 | 0.50 | 0.33 | 0.67 | 0.25 | 0.67 | 0.69 | 0.69 |
| SVM | 0.80 | 0.85 | 0.62 | 0.42 | 0.44 | 0.50 | 0.71 | 0.71 | 0.71 |
| KNN | 0.76 | 0.87 | 0.56 | 0.42 | 0.20 | 0.12 | 0.64 | 0.68 | 0.68 |
| Models | Residential | Commercial | Other Buildings | Weighted Avg | Overall Accuracy | ||||
|---|---|---|---|---|---|---|---|---|---|
| Precision | Recall | Precision | Recall | Precision | Recall | Precision | Recall | ||
| RF | 0.70 | 0.97 | 1.00 | 0.17 | 0.67 | 0.25 | 0.76 | 0.71 | 0.71 |
| SVM | 0.67 | 0.79 | 0.22 | 0.17 | 0.25 | 0.12 | 0.52 | 0.58 | 0.58 |
| KNN | 0.67 | 0.97 | 1.00 | 0.08 | 0.00 | 0.00 | 0.64 | 0.66 | 0.66 |
| Cases | Building Height | NDVI | NDWI | NDBI | RF | SVM | KNN |
|---|---|---|---|---|---|---|---|
| Case 1 | mean, max, min, std | mean, max, min, std | mean, max, min, std | mean, max, min, std | 0.75 | 0.86 | 0.76 |
| Case 2 | mean | mean | mean | mean | 0.63 | 0.63 | 0.71 |
| Case 3 | mean, max | mean, max | mean, max | mean, max | 0.69 | 0.71 | 0.68 |
| Case 4 | mean, max, std | mean, max, std | mean, max, std | mean, max, std | 0.71 | 0.58 | 0.66 |
| Case 5 | mean, max, min, std | 0.73 | 0.68 | 0.66 | |||
| Case 6 | mean, max, min, std | mean, max, min, std | mean, max, min, std | 0.72 | 0.76 | 0.69 | |
| Case 7 | mean, max, min, std | mean, max, min, std | 0.69 | 0.77 | 0.71 | ||
| Case 8 | mean, max, min, std | mean, max, min, std | 0.71 | 0.80 | 0.68 | ||
| Case 9 | mean, max, min, std | mean, max, min, std | 0.83 | 0.75 | 0.73 | ||
| Case 10 | mean, max, min, std | mean, max, min, std | mean, max, min, std | 0.73 | 0.81 | 0.72 |
Disclaimer/Publisher’s Note: The statements, opinions and data contained in all publications are solely those of the individual author(s) and contributor(s) and not of MDPI and/or the editor(s). MDPI and/or the editor(s) disclaim responsibility for any injury to people or property resulting from any ideas, methods, instructions or products referred to in the content. |
© 2023 by the authors. Licensee MDPI, Basel, Switzerland. This article is an open access article distributed under the terms and conditions of the Creative Commons Attribution (CC BY) license (https://creativecommons.org/licenses/by/4.0/).
Share and Cite
Lun, N.S.; Chaudhary, S.; Ninsawat, S. Assessment of Machine Learning Methods for Urban Types Classification Using Integrated SAR and Optical Images in Nonthaburi, Thailand. Sustainability 2023, 15, 1051. https://doi.org/10.3390/su15021051
Lun NS, Chaudhary S, Ninsawat S. Assessment of Machine Learning Methods for Urban Types Classification Using Integrated SAR and Optical Images in Nonthaburi, Thailand. Sustainability. 2023; 15(2):1051. https://doi.org/10.3390/su15021051
Chicago/Turabian StyleLun, Niang Sian, Siddharth Chaudhary, and Sarawut Ninsawat. 2023. "Assessment of Machine Learning Methods for Urban Types Classification Using Integrated SAR and Optical Images in Nonthaburi, Thailand" Sustainability 15, no. 2: 1051. https://doi.org/10.3390/su15021051
APA StyleLun, N. S., Chaudhary, S., & Ninsawat, S. (2023). Assessment of Machine Learning Methods for Urban Types Classification Using Integrated SAR and Optical Images in Nonthaburi, Thailand. Sustainability, 15(2), 1051. https://doi.org/10.3390/su15021051