Article

Design for Optimally Routing and Scheduling a Tow Train for Just-in-Time Material Supply of Mixed-Model Assembly Lines

1
School of Management, Shanghai University, Shanghai 200444, China
2
School of Communication, East China University of Political Science and Law, Shanghai 201620, China
*
Author to whom correspondence should be addressed.
Sustainability 2023, 15(19), 14567; https://doi.org/10.3390/su151914567
Submission received: 4 September 2023 / Revised: 24 September 2023 / Accepted: 29 September 2023 / Published: 8 October 2023
(This article belongs to the Special Issue Advances in Industrial Risk Analysis and Management)

Abstract

:
With the increase in product varieties, the combination of supermarkets and tow trains is being adopted by more automobile manufacturers for part feeding, especially in mixed-flow assembly lines. This paper focuses on the routing, scheduling, and loading problems of a single towed train that transports parts from one supermarket to the workstation buffer in a mixed-flow assembly line and aims to optimize the loading of the tow train, the optimal delivery schedule and route, and the appropriate departure time to minimize shipping and line inventory costs. To enable part feeding in line with the just-in-time (JIT) principle, a new mixed-integer mathematical model from nonlinearity to linearity and a novel artificial immune genetic algorithm-based heuristic are proposed. Both methods can provide reasonable solutions compared by minimizing the route length and inventory level in terms of speed, and the genetic algorithm shows better performance on a large scale.

1. Introduction

With the increasing diversification of customer demands and the need to avoid carrying large inventories, mixed-model assembly lines are widely used to meet many automobile manufacturers’ production demands for various products in the contemporary business environment. Although the mixed-model assembly lines have significant advantages in producing cars with the same seed modules, they also bring significant challenges to deal with the problem of material supply, which has become an important issue for both managers and scholars. A suitable material supply system should efficiently meet the requirements of the JIT principle, which means avoiding the shortage of parts and reducing the handling cost at the same time [1].
Under the mixed-model assembly line mode, many automobile workshops have been equipped with supermarkets and tow trains to deliver parts to assembly lines flexibly and in a timely manner. A supermarket is a small logistics area inside a workshop where parts are stored as semi-finished products and then transferred to nearby workstations to alleviate the high inventory problem on the assembly line [2]. In addition, it is assumed that the supermarket always has sufficient inventory. This study focuses on the scheduling and routing problem of the tow train, which is subjected to last-in-first-out constraints in mixed-model assembly lines equipped with supermarkets. Several interrelated decision problems have to be solved:
(1)
Determine the amount of tours.
(2)
Decide the scheduling route for each tour.
(3)
Decide on the delivery schedule of the tow train.
(4)
Determine the wagons to be loaded each tour of the tow train.
The main optimization criteria in the problem are to address the optimal loading of the tow train, the optimal delivery schedule and route, and the appropriate departure time to minimize shipping and line inventory costs.
The remainder of this paper is organized as follows. A brief literature review is presented in Section 2. In Section 3, a new mathematical model is presented, and a novel genetic algorithm based on the heuristic for the context is presented in Section 4. In Section 5, experimental studies of the computational results for both the mathematical model and the algorithm are reported. Section 6 presents conclusions and suggestions for future works.

2. Literature Review

According to the type of assembled product, assembly lines can be classified into two types: simple assembly line and mixed-model assembly line [3]. Mixed-model assembly lines are commonly used to produce various models that belong to the same product segment and different configurations of one model [4].The Assembly Line Part-feeding Problem (ALPFP) is a complex combinatorial optimization problem [5]. All types of decision-making problems in logistics ensure that assembly lines never stop because of a shortage of parts or strategic and operational issues. Kilic and Durmusoglu [6] published a literature review on part-feeding policies, providing part-feeding system components according to feeding policies, objectives, solutions, and application types. Boysen et al. [7] comprehensively discussed some logistics problems and programs of the methods.
According to the actual situation encountered in a significant automobile assembly plant in Spain, Fathi et al. [5] proposed a mixed-integer linear programming model and a heuristic annealing algorithm to minimize the number of tours of the fixed route. Comparing the results of the two methods shows that the algorithm provides a better solution in a shorter computing time. Then, considering the constraints of travel delivery times, Fathi et al. [8] proposed a memetic ant-colony-based heuristic to solve the problem. Fathi et al. [9] solved two subproblems included in the ALPFP: travel scheduling and towed train loading, and an improved particle swarm optimization algorithm was proposed. Zhou and Shen [10] considered energy consumption to develop an energy-efficient scheduling method, which is a Taboo-enhanced particle swarm optimization algorithm to solve the multi-objective problem.
While they found that cycle tours are allowed and each train continuously tours its dedicated route, a routing problem in some papers was solved by delivering directly to the line buffer of the shortage part [11].
Ci Chen [12] presented a multiple-criteria real-time scheduling approach for multiple-load carriers subject to LIFO (last-in-first-out) loading constraints. In order to avoid part shortage and reduce the total inventory and transportation costs, a backtracking method and a hybrid GASA (genetic algorithm and simulated annealing) method are proposed for configurations involving only one target workstation per delivery; the results show that the GASA method is effective even in large instances [13]. Zhou and Peng [14] proposed the point-to-point (P2P) JIT distribution model to ensure the destination station, and developed a modified discrete artificial bee colony metaheuristic to facilitate an effective JIT part supply for minimizing line-side inventory level. Aiming to minimize the inventory holding and total costs of parts handled, Satoglu and Sahin [15] developed a mathematical model and used heuristics to design an internal milk supply system that minimizes total material handling and inventory maintenance costs and solves scheduling and routing problems. Considering that multiple trains visit stations in batches, Weikang et al. [16] proposed a nonlinear multi-objective mathematical model, which combines NSGA-II (Non-dominated Sorting Genetic Algorithm-II) and a hybrid heuristic algorithm of variable neighborhood search to solve the scheduling. István [17] handled daily batch scaling and production scheduling activities by combining traditional manufacturing system simulations with advanced machine learning techniques. According to the characteristics of shipbuilding enterprises and the actual production situation, Song and Zhou [18] set up a workshop virtual assembly production system, realized the lean production of a shipbuilding workshop, and shortened the production cycle. Mouss et al. [19] proposed a scheduling method of workshop manufacturing equipment based on automated guided vehicles (AGV) to shorten production time and improve productivity by considering three aspects that affect machine work, product transportation task allocation, and AGV fleet battery management. Binghai and Zhe [20] studied the dynamic part replenishment scheduling problem under the Kanban system, and proposed a hybrid dynamic scheduling method based on a fuzzy neural network. The goal was to simultaneously optimize a productivity-related goal (throughput of the assembly line) and a cost-related goal (total distribution distance of the automated guided vehicle (AGV)). Wenrui et al. [21] provided an effective solution to the practical problem of production and transportation coordination in the automobile industry. A bi-objective mixed-integer linear programming (MILP) model was established to jointly optimize the total energy consumption and just-in-time (JIT) indicators. Zhou and Zhu [22] studied the scheduling and loading of two trains in a mixed-current assembly line (MMAL). By setting the departure time, the number of parts for each departure and the destination station, they established an in-plant milking and departure model to minimize the total inventory on the line side of all stations during the planning period.
The above studies have only focused on part of the ALPFP. This paper fills this gap by raising multiple subproblems to address the optimal traction train loading problem based on the variable path, optimal distribution plan, route problem, and the optimal departure time problem. For the problem of poor local search ability and low global search efficiency of the genetic algorithm, artificial immune genetic algorithm is combined with immune memory, concentration evaluation, and vaccination of the immune algorithm to improve the local search ability and quality of the solution.

3. Mathematical Model

This study is dedicated to addressing the routing and scheduling problem in mixed-model assembly line combined with a tow train and supermarket. This problem can be described as follows: a tow train and a supermarket supply parts for a series of work-stations in a material-handling area [23]. On the mixed-model line, the parts are required to follow a predetermined assembly sequence, and then the due date is determined based on the initial inventory, bill of materials, and cycle time to avoid shortages of parts. The tow train picks up the corresponding parts in the supermarket and delivers them to the parts buffer in the proper order. Then, the tow train returns to the supermarket. A train’s scheduling and routing determine the destination parts’ buffer, the departure time, and load drop-off of each delivery so that the total delivery distance and line edge inventory are minimized [24,25].

3.1. Details of an Assembly Line

Problem description and an assembly line is shown in Figure 1 in detail. Some premises were adopted, including [26]:
(1)
The traveling distance between the supermarket and a part buffer; the distance between one part’s buffer to another are presupposed.
(2)
No part is allowed to arrive after its due time, i.e., part shortage is not allowed.
(3)
The velocity of a tow train is constant; acceleration and deceleration are not considered.
(4)
The loading time and the unloading time are constant.
(5)
The road cannot be jammed with traffic of trains.
(6)
For each part, a train can load one wagon of each delivery and the capacity of wagons is limited.
(7)
For each delivery, a tow train is allowed to have a limited number of wagons; part of the wagon is loaded last but unloaded first.
(8)
On the mixed-model assembly line, a product will stay at the workstation for a cycle time and can be assembled with one or more kinds of parts that can be consumed once.
(9)
A tugger can tow up to three wagons at a time, i.e., one trip delivered no more than three kinds of parts.

3.2. Mathematical Model

3.2.1. Notations

Sets:
P The set of the parts in the assembly line;
N The set of tours of the tow train;
M The set of products (cars in assembly sequence);
KThe set of wagons of the tow train are loaded in one journey which are in order and meet the part need.
Indices
p The index of the part, p P ;
n The index of the tour, n N ;
m The index of the product, m M ;
kThe index of the wagon in order, k K .
Parameters
Q p The capacity of the wagon of part p ;
c t The cycle time;
l The time to load a container onto the multiple-load wagon;
r The time to unload a container from the multiple-load wagon;
B p m The demand for part p in tour n , the bill of material;
the consumption of part p for assembly of the product m is 1 if it is used, and 0 otherwise;
C The max number of the multiple-load wagons in a tow train;
d i j The distance between part i buffer to part j buffer; i = 0 or j = 0 means the distance between the supermarket and the line-side buffer of part p ;
h 0 p The initial buffer for part p at the beginning of the first tour;
G The largest number;
g The smallest number;
t 0 The beginning of the scheduling period considered;
t e The end of the scheduling period considered.
Decision variables
t n The start time of the tour n ;
t n p The arrival time of part p in tour n ;
t n k The arrival time of wagon k in tour n ;
y n equals 1 if tour n is taken; otherwise, equals 0;
X n p equals 1 if part p is transported; otherwise, equals 0;
T n The total delivery time in tour n ;
Y n p k equals 1 if part p is delivered in tour n which is loaded at wagon k; otherwise, equals 0;
e n p equals 1 if part p is lastly delivered in tour n that is taken; otherwise, equals 0;
V n The number of parts in tour n ;
H m p The inventory of the line-side buffer of part p when the product m is manufactured;
Y p p n Intermediate variable;
T n Intermediate variable;
H n m p The intermediate variable used to calculate inventory;
w m n p equals 1 if part p is delivered in the line-side buffer in tour n when the product m is manufactured; otherwise, equals 0.

3.2.2. Model

M i n   {   α m = 1 M p = 1 P H m p + β n = 1 N T n + γ N }
Subject to:
t 1 t 0   + l p = 1 P X 1 p ,     p P
t n + 1 t n + T n + r p = 1 P X n p + l p = 1 P X n + 1 p   , n = 1,2 N 1
T n = T n y n , n N
t n t 0 ,   n N
t n t e ,   n N
P = 1 P X n p C y n ,   n N
V n = p = 1 P X n p , n N ,   p P
k = 1 K Y n p k = X n p   , n N ,   p P ,   k K
p = 1 P Y n p k 1 ,   n N ,   p P ,   k K
k Y n p k V n ,   n N ,   p P ,   k K
V n k Y n p k 1 e n p · G ,   n N ,   p P
V n k Y n p k + e n p 1 ,   n N ,   p P ,   k K
T n = ( p = 1 P d 0 p · Y n p 1 + i = 1 P j = 1 P k = 1 C 1 d i j · Y n i k · Y n j k + 1 + p = 1 P d p 0 · e n p ) / v ,
n N ,   p P ,   k K
t n 1 = t n + p = 1 P d 0 p · Y n p 1 / v + r ,   n N ,   p P
t n k = t n + ( p = 1 P d 0 p · Y n p 1 + i = 1 P j = 1 P q = 1 k 1 d i j · Y n i q · Y n j q + 1 ) / v + r · k ,
n N ,   p P ,   k = 2 : K
t n p = k = 1 K Y n p k · t n k ,   n N ,   p P
m c t t n p + g w m n p G ,   n N ,   p P ,   m M
t n p m c t 1 w m n p G ,   n N ,   p P ,   m M
H n m p   = X n p   w m n p ,   n N ,   p P ,   m M
H m p = h 0 p + Q p n = 1 N H n m p a = 1 m B p a ,   p P ,   m M
H m p 2 Q p ,   p P ,   m M
H m p 0 ,   p P ,   m M
Expression (1) gives the objective that minimizes the inventory level and delivery distance while the distance is first considered. Expressions (2), (5), and (6) limit the start time of each tour, and the time of loading of the earlier tour must be taken into account. Expressions (3) and (4) obviously limit that a delivery cannot start before the train has returned to the supermarket. Expressions (7) and (8) give the number of parts in tour n. Expressions (9) and (10) provide the limit that the train can only unload one wagon at the appointed buffer devices; the last part to deliver can be obtained by expressions (11)–(13). Expression (14) computes the time of tour n. Expressions (15)–(17) compute the time wagon k is unloaded after arriving at the buffer. Expressions (18)–(21) accumulate the inventory of the line-side buffer. Expressions (22) and (23) prohibit the line out-of-stock time.

Mathematical Model Linearization Treatment

Expressions (4), (14), (16), (17), and (20) show the model is non-linear. To solve the complexity of nonlinearity, the expressions are changed into the following:
T n T n + G 1 y n , n N
T n T n G 1 y n , n N
T n G y n , n N
Y n i 1 + Y n j 2 2 Y i j n   , n N , i P , j P
Y n i 1 + Y n j 2 1 + Y i j n   , n N , i P , j P
Y n i 2 + Y n j 3 2 Y i j n , n N , i P , j P
Y n i 2 + Y n j 3 1 + Y i j n , n N , i P , j P
T n = p = 1 P d 0 p · Y n p 1 + i = 1 P j = 1 P Y i j n   d i j + i = 1 P j = 1 P Y i j n   d i j + p = 1 P d p 0 · e n p / v
n N
t n 2 = t n + p = 1 P d 0 p · Y n p 1 + i = 1 P j = 1 P Y i j n   d i j / v + r · 2 , n N , p P
t n 3 = t n + p = 1 P d 0 p · Y n p 1 + d i j i = 1 P j = 1 P Y i j n   + d i j i = 1 P j = 1 P Y i j n   / v
+ 3 r , n N ,   p P
t n p t n k + G 1 Y n p k , n N , p P , k K
t n p t n k G 1 Y n p k , n N , p P , k K
X n p   + w m n p 2 H n m p , n N , p P , m M
X n p   + w m n p 1 + H n m p , n N , p P , m M

4. Artificial Immune Genetic Algorithm

This problem can be solved by indicating when the train can depart and how the parts are delivered in order. The orders are discrete variables, and time is a continuous variable. This paper provides a special artificial immune genetic algorithm (AIGA) based on the heuristic to solve this combinatorial optimization problem.
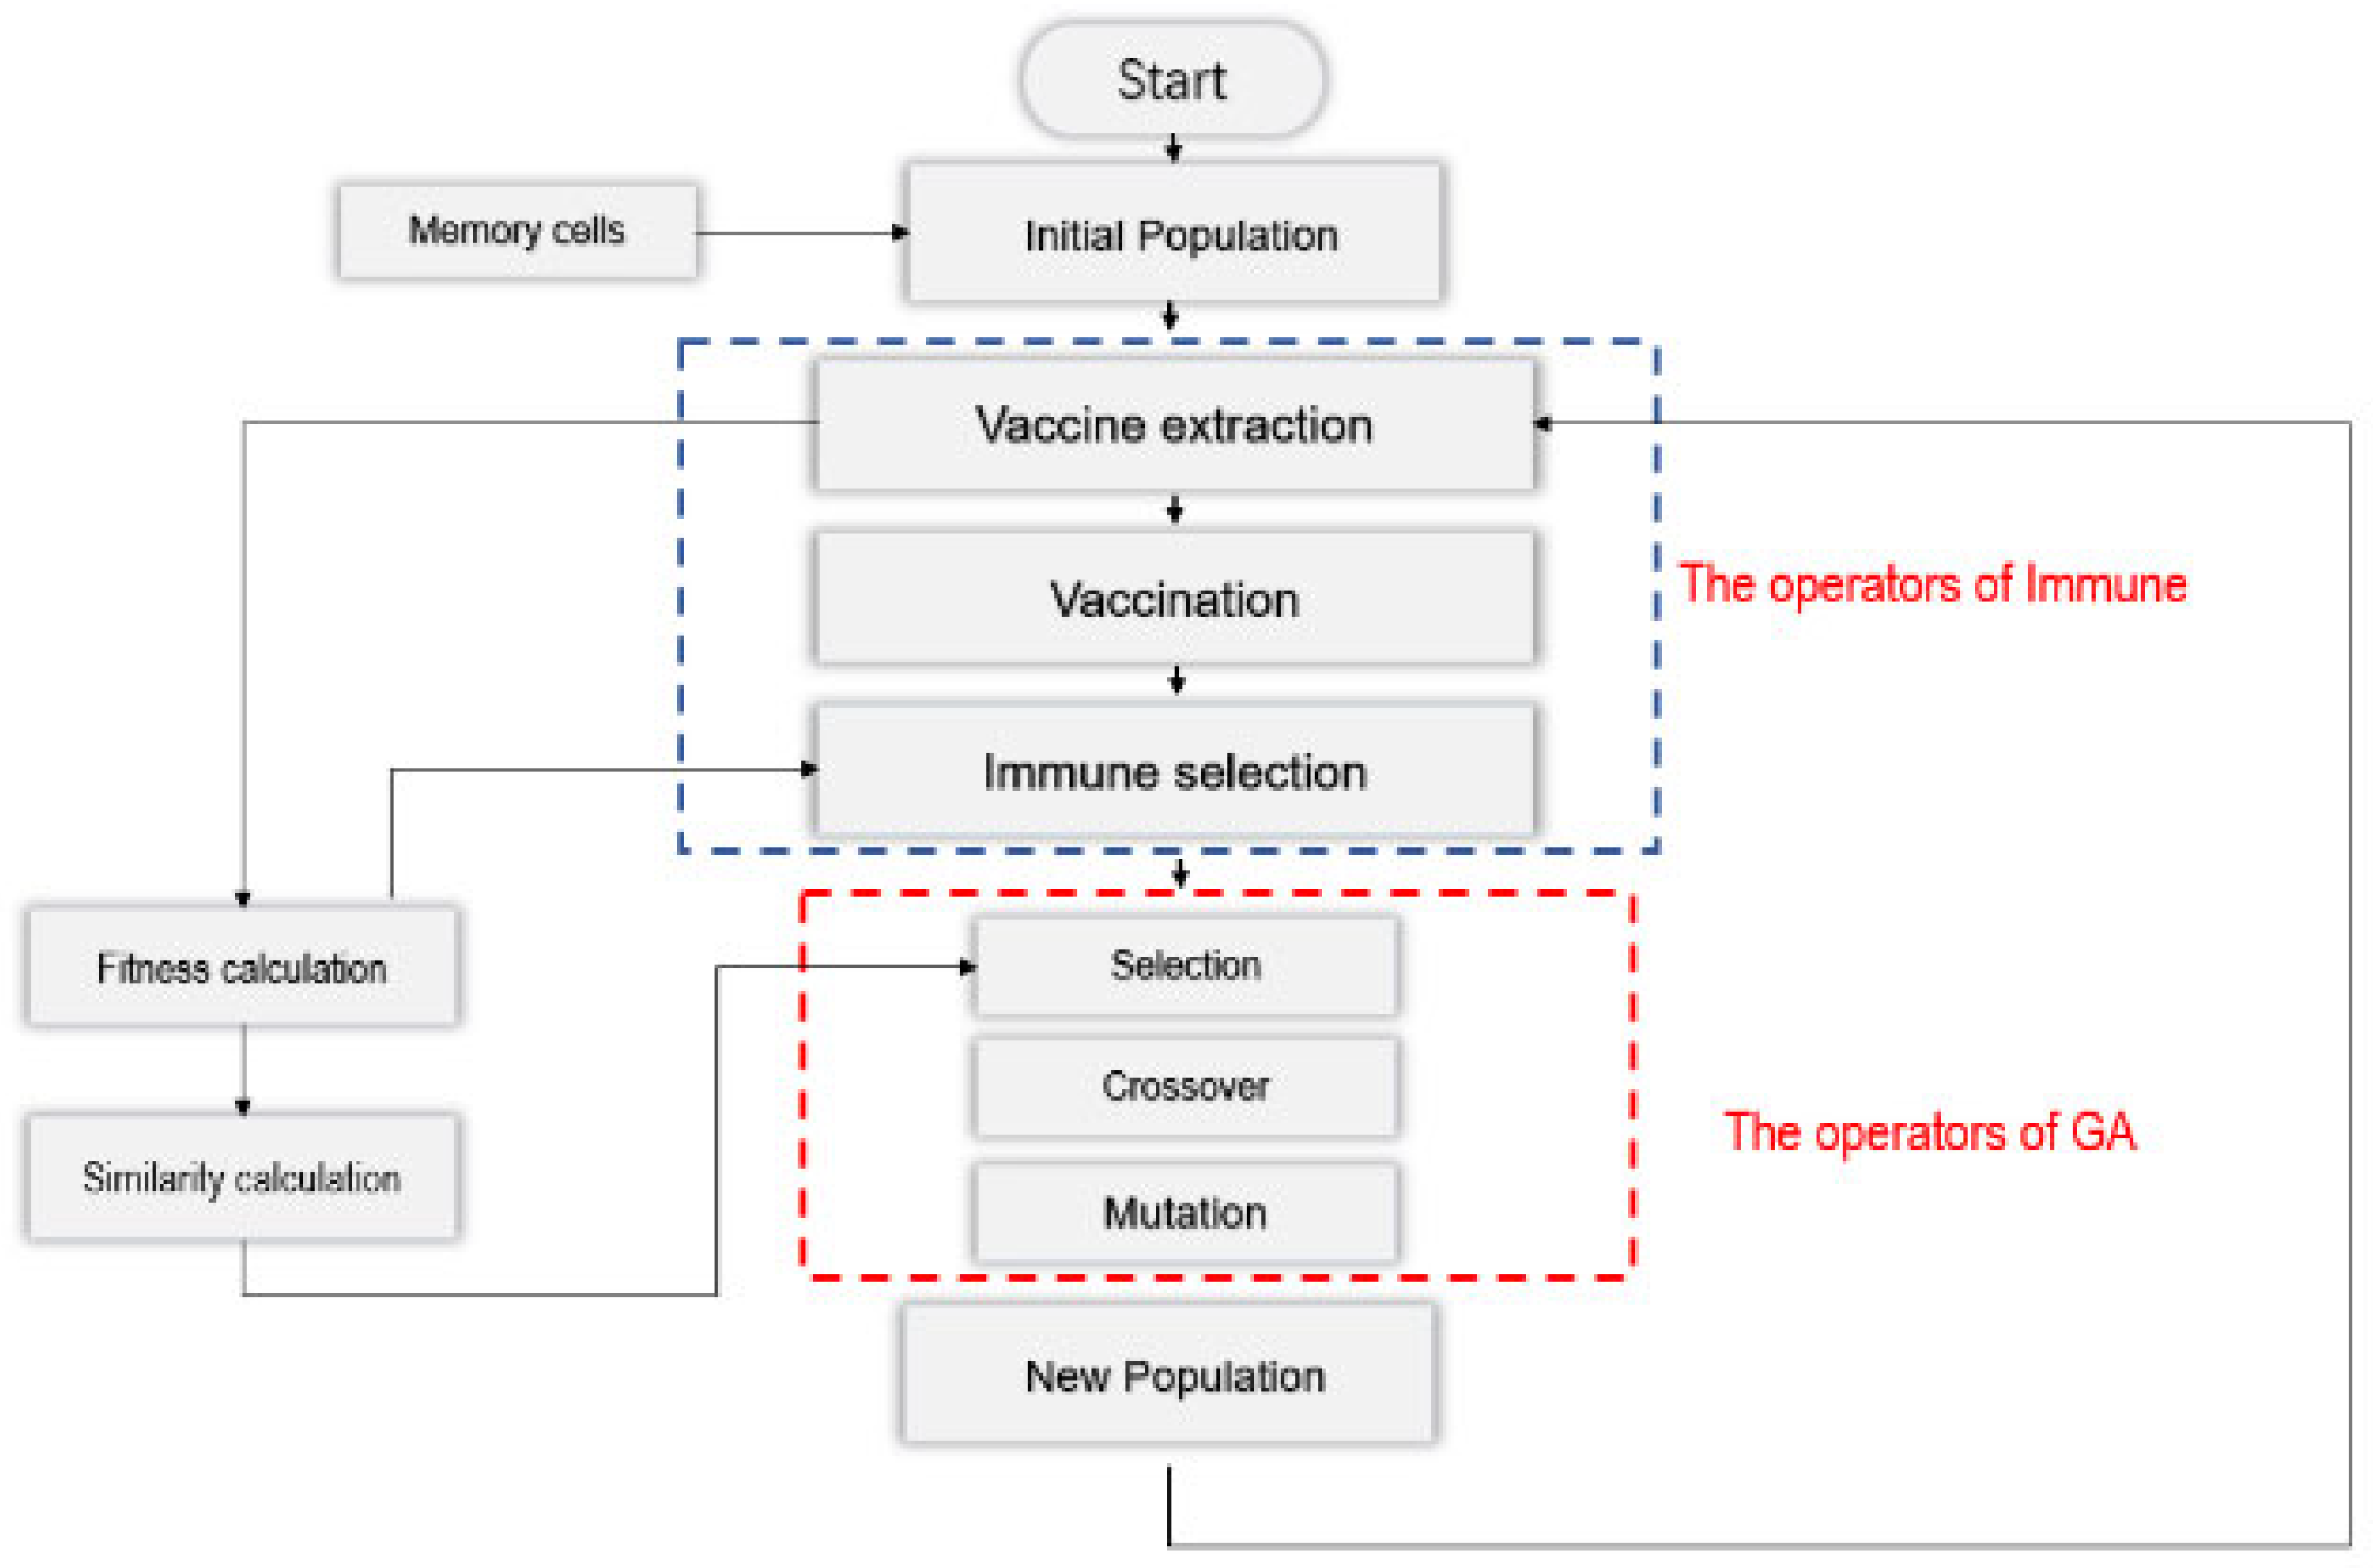
For the problem of the poor local search ability and low global search efficiency of the genetic algorithm, the artificial immune genetic algorithm is combined with immune memory, concentration evaluation, and vaccination of the immune algorithm to improve the local search ability and quality of the solution. Immune memory can help preserve good gene individuals. The concentration evaluation can eliminate similar individuals. Immune selection can maintain the diversity of the population and avoid the algorithm ending prematurely, and improve the algorithm’s performance and stability. The implementation flow of the artificial immune genetic algorithm is as follows (Figure 2):

4.1. Encoding and Decoding

In the AIGA, it is critical to find the applicable encoding of the individual. Chromosomes must correspond to the solutions. This paper creatively describes that the chromosome includes two strings according to real number coding. The first part of gene F1 represents the order of distribution of parts waiting to be moved. The latter part of gene F2 indicates how many times the train can travel and how many parts are delivered on one tour. The train’s capacity is limited to C (C = 3); therefore, the codes of the F2 do not exceed the limit of C . The F2 fragment is a set of random numbers less than 3 whose sum is N of the total number of moving parts in the experiment. As shown in Figure 3, the train travels three times back and forth. For the first journey, it loads Part 2 and Part 3, and then sends them to the buffer, unloads the parts, and then goes back to the supermarket. By the same token, the second time, the train carries Part 7, Part 10, and Part 12 in this tour, and the final time, the train brings Part 5 to the buffer then returns.
The initial population consists of two parts: randomly generated individuals and some high-quality individuals inserted into the initial population to ensure the algorithm’s stability. The first half of quality individuals are sorted according to the out-of-stock time of the parts, and the second half is set to minimize the number of tours.

4.2. Memory Cells

According to the results of continuous experiments, the reasons for the excellent performance of a gene are as follows:
1.
The F2 segment of this gene is expressed with fewer transport times.
2.
The order of moving parts shall be sorted according to the time of shortage as far as possible.
Therefore, the parts we need to carry are arranged into F1 segments by the sequence of the out-of-stock time, and F2 segments are formed by the minimum number of times of handling. Such combinations of genes are called memory cells. The memory cells are then dropped into the initial population of the algorithm. Although the gene represented by memory cells may not be a feasible solution, it can help improve the primary population’s immunity to the problem, and the population can converge to the better solution better and faster. The robustness of the algorithm is also verified in the experiment. An example is shown in Figure 4.

4.3. Fitness

4.3.1. The Time of Shortage

The flex mixed-model assembly line can obtain the production order in advance. Based on the production planning and scheduling of the order, it is possible to obtain the type and quantity of parts to be delivered during the period specified. In order to prevent the shortage from causing the assembly line to stop, it is necessary to record the consumption of each part and determine when each part will be out of stock. The specific steps are as follows:
Step 1: while inputting the set of products in assembly sequence M , the type of parts P to be delivered and the number of material boxes to be carried can be determined, followed by calculating the total material boxes W .
Step 2: depending on parts P and the consumption of each part, the time when the part will be out of stock can be obtained. The next cycle time when the part is used is defined as the due time, called the point of shortage S T n p ; the part P and the due time S T n p correspond one to one.

4.3.2. The Departure Time of the Train

Each part needed to be delivered on one tour has the shortage time S T n p . The distance of every route to the parts’ buffer is D n p . According to the unloading time R , the late departure time   L D n p , of each part on the tour n can be deduced from the shortage time.
L D n p = S T n p D n p v R
Therefore, the final departure time of tour n is S D n .
S D n = m i n L D n p
The time of train back to the supermarket is O B n can be obtained with the last arrival part D n p as follows:
O B n = S D n + D n p + R

4.3.3. Adjust Schedule of the Departure Time

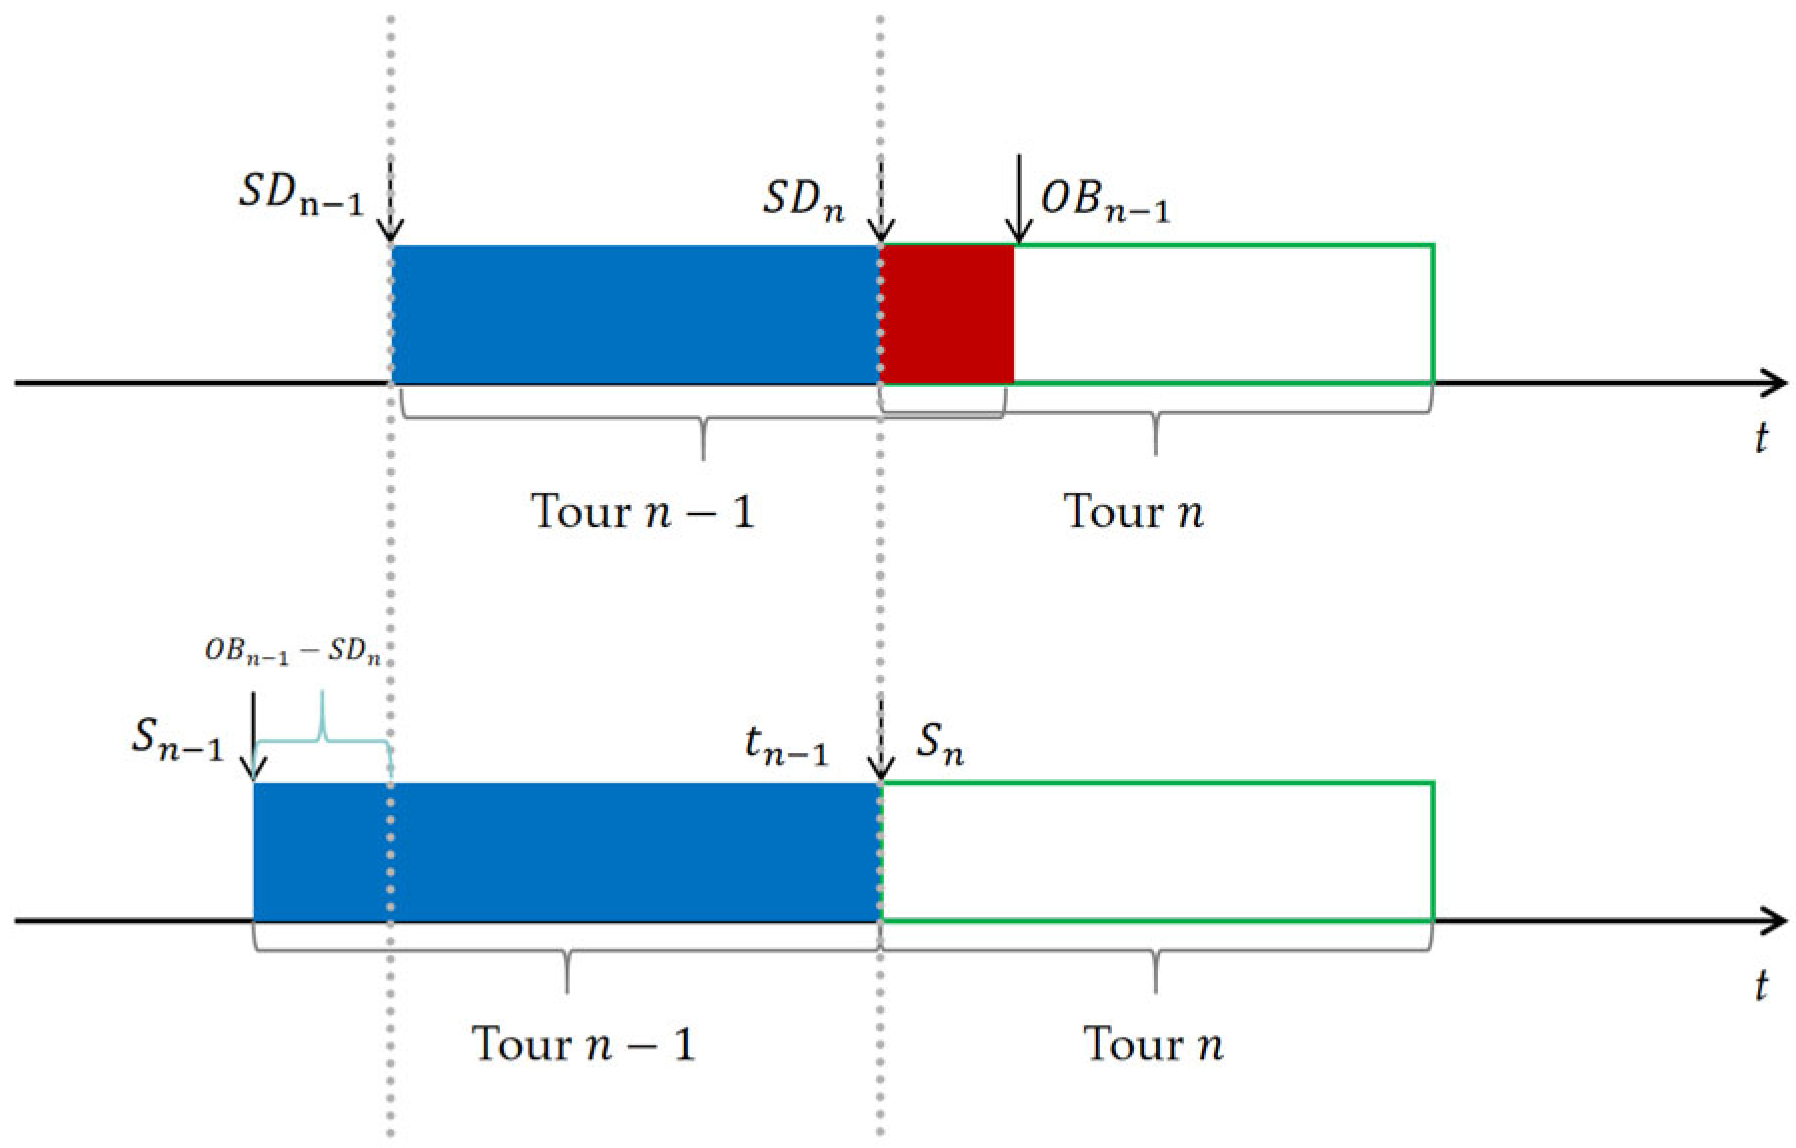
One delivery task may be completed by multiple tours, while there may be a problem in which the next tour begins before the last tour is over. In other words, there is overlap between the two tours. Departure times for tours need to be coordinated. The loading time between two successive tours is L. If O B n 1 > S D n L , the departure time of the tour of n 1 will be advanced (Figure 5).
S n 1 = S D n 1 (   O B n 1 S D n + L )

4.3.4. The Value of Fitness Function

Many chromosomes need to be estimated from two aspects. Firstly, it must meet the distribution constraints, and the departure time of the first tour must be positive. Secondly, according to the distance of the routing and the inventory of the line, the value of the fitness function can be obtained. The coding method in this paper can find the scheduling without shortage and routing with the shortest path, but it cannot guarantee that the first tour can set out in time. Therefore, it is necessary to screen the chromosomes, select the individuals that meet the conditions, and then calculate the distance and inventory values. When S n was obtained, the inventory Hmp of the part p and the distance Dn of the tour n could be calculated using the mathematical model.
f i t a = 1 / ( α m = 1 M p = 1 P H m p + β n = 1 N D n / v )

4.4. The Calculation of Similarity

Similarity calculation is used to compare the differences between individuals in a population. Individuals with high similarities to other individuals and low fitness will be eliminated to maintain the diversity of the population. This algorithm uses the difference between the fitness value of an individual and the average fitness value of the population as the evaluation index of similarity.
φ a = 1 i | f i t a f i t i | 1 j 1 i | f i t j f i t i |

4.5. Selection

In this paper, two operators were used to select the individuals. According to the roulette selection process, each individual is likely to be selected, while the higher the probability, the more likely it is that an individual will survive. The probability of an individual a which is selected consists of fitness value and similarity.
a = 0.8 × f i t a + 0.2 × φ a
Another optimized evolutionary selection is to pick the ones that do well in evolution and put them into this generation by comparing the best chromosomes of the previous generation with the worst chromosomes of the current generation. Experiments can prove through the adoption of two selection operators that the convergence and the convergence speed are significantly improved, which provides a better choice strategy for the application problem of obtaining the optimal solution more quickly.

4.6. Crossover

There are two strings in our chromosomes, the first half of which, F1, is operated with order crossover, and the left of which, F2, is operated with a partially matching crossover (Figure 6):
Step 1: The starting and ending positions of several genes in a pair of chromosomes (the parent) were randomly selected (both chromosomes were selected in the same position) in the first half, F1;
Step 2: Produce a progeny and ensure that the selected gene in the progeny is in the same position as the parent;
Step 3: First, find out the gene’s position selected in the first step in the other parent generation, and then put the remaining genes into the offspring generated in the previous step in order. The other progeny is produced in the same way, only the two parent chromosomes need to be swapped, and the genotype selected in the first step is in the same position;
Step 4: For the last half, F2: swap the second half of two parent genes.

4.7. Mutation

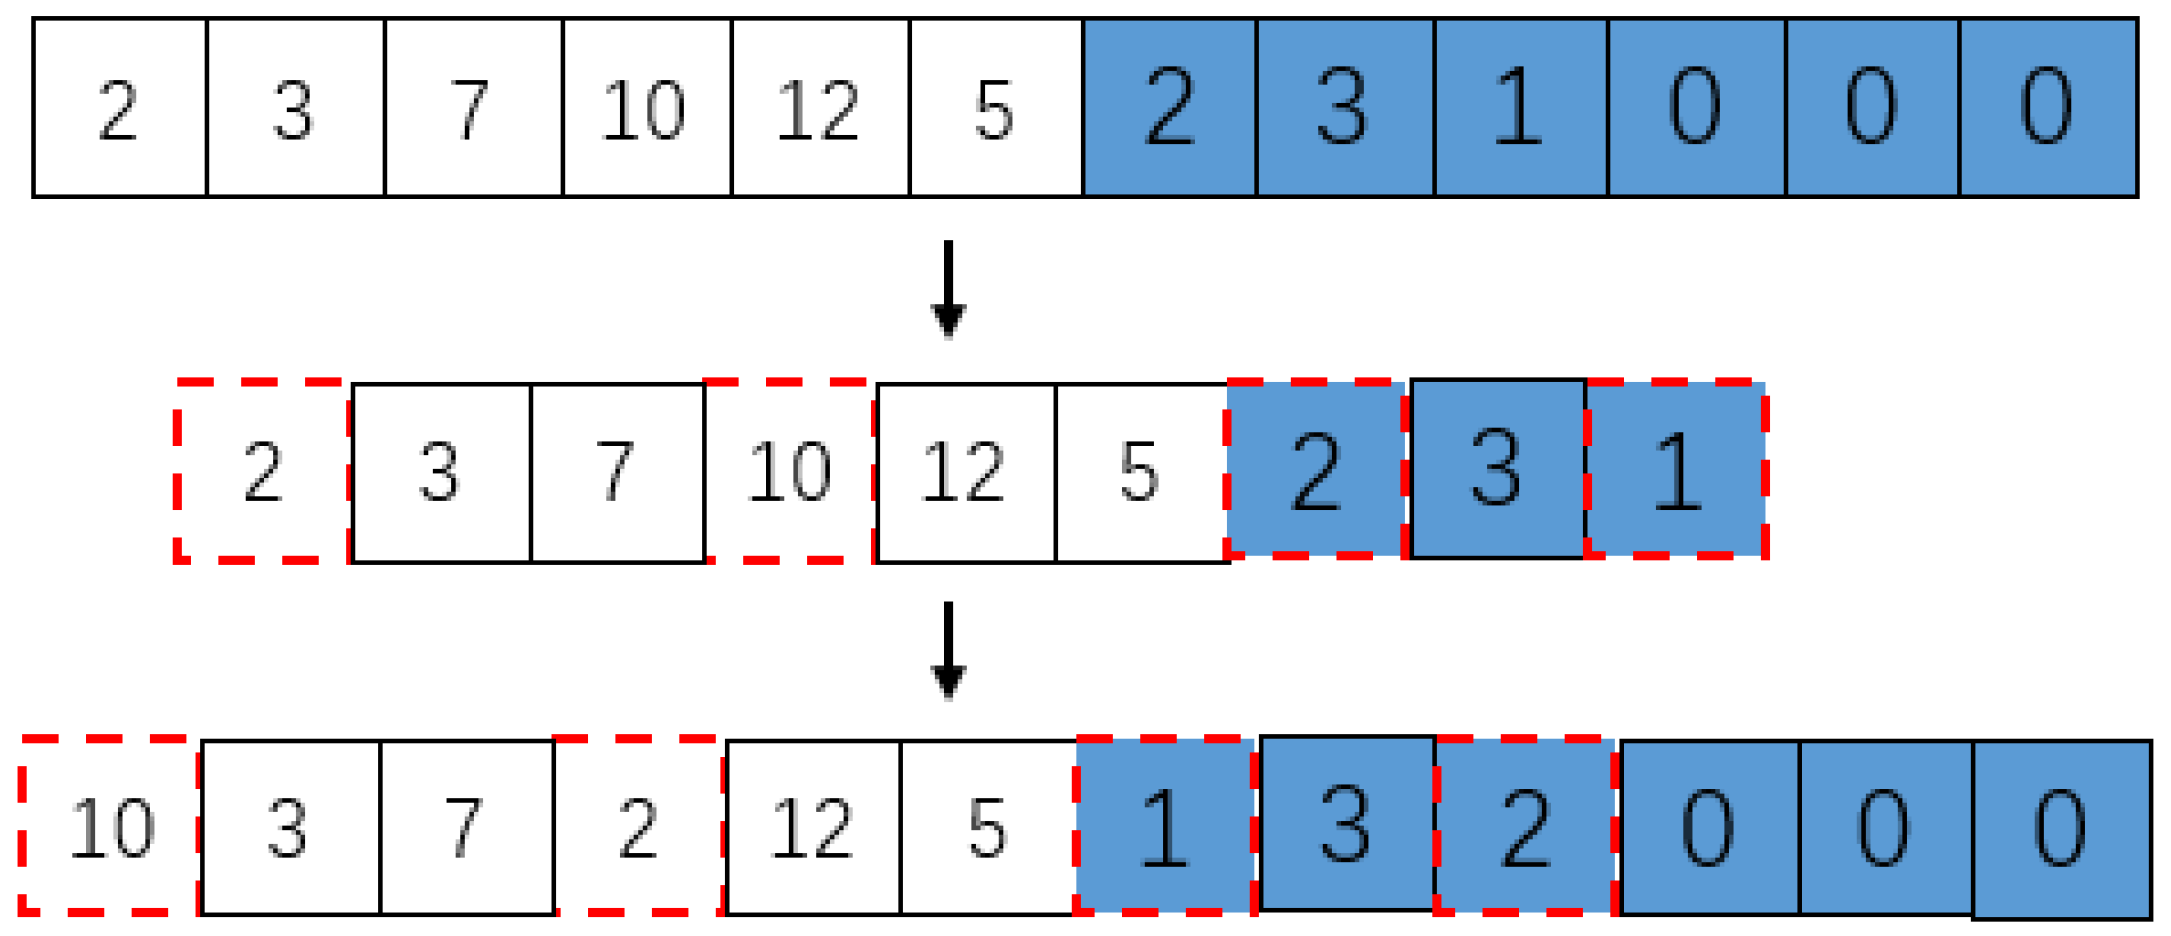
In this paper, a swapping mutation operator was adopted for the F1 and F2 strings. Swapping mutation is a typical process used with randomizing the order for chromosomes. Taking the order of half gene as an example, while the last half can mutate in the same way, the description randomly selects two codes in the F1 part, then switches their positions (Figure 7).

4.8. The Operations of Immunity

4.8.1. Vaccine Extraction and Vaccination

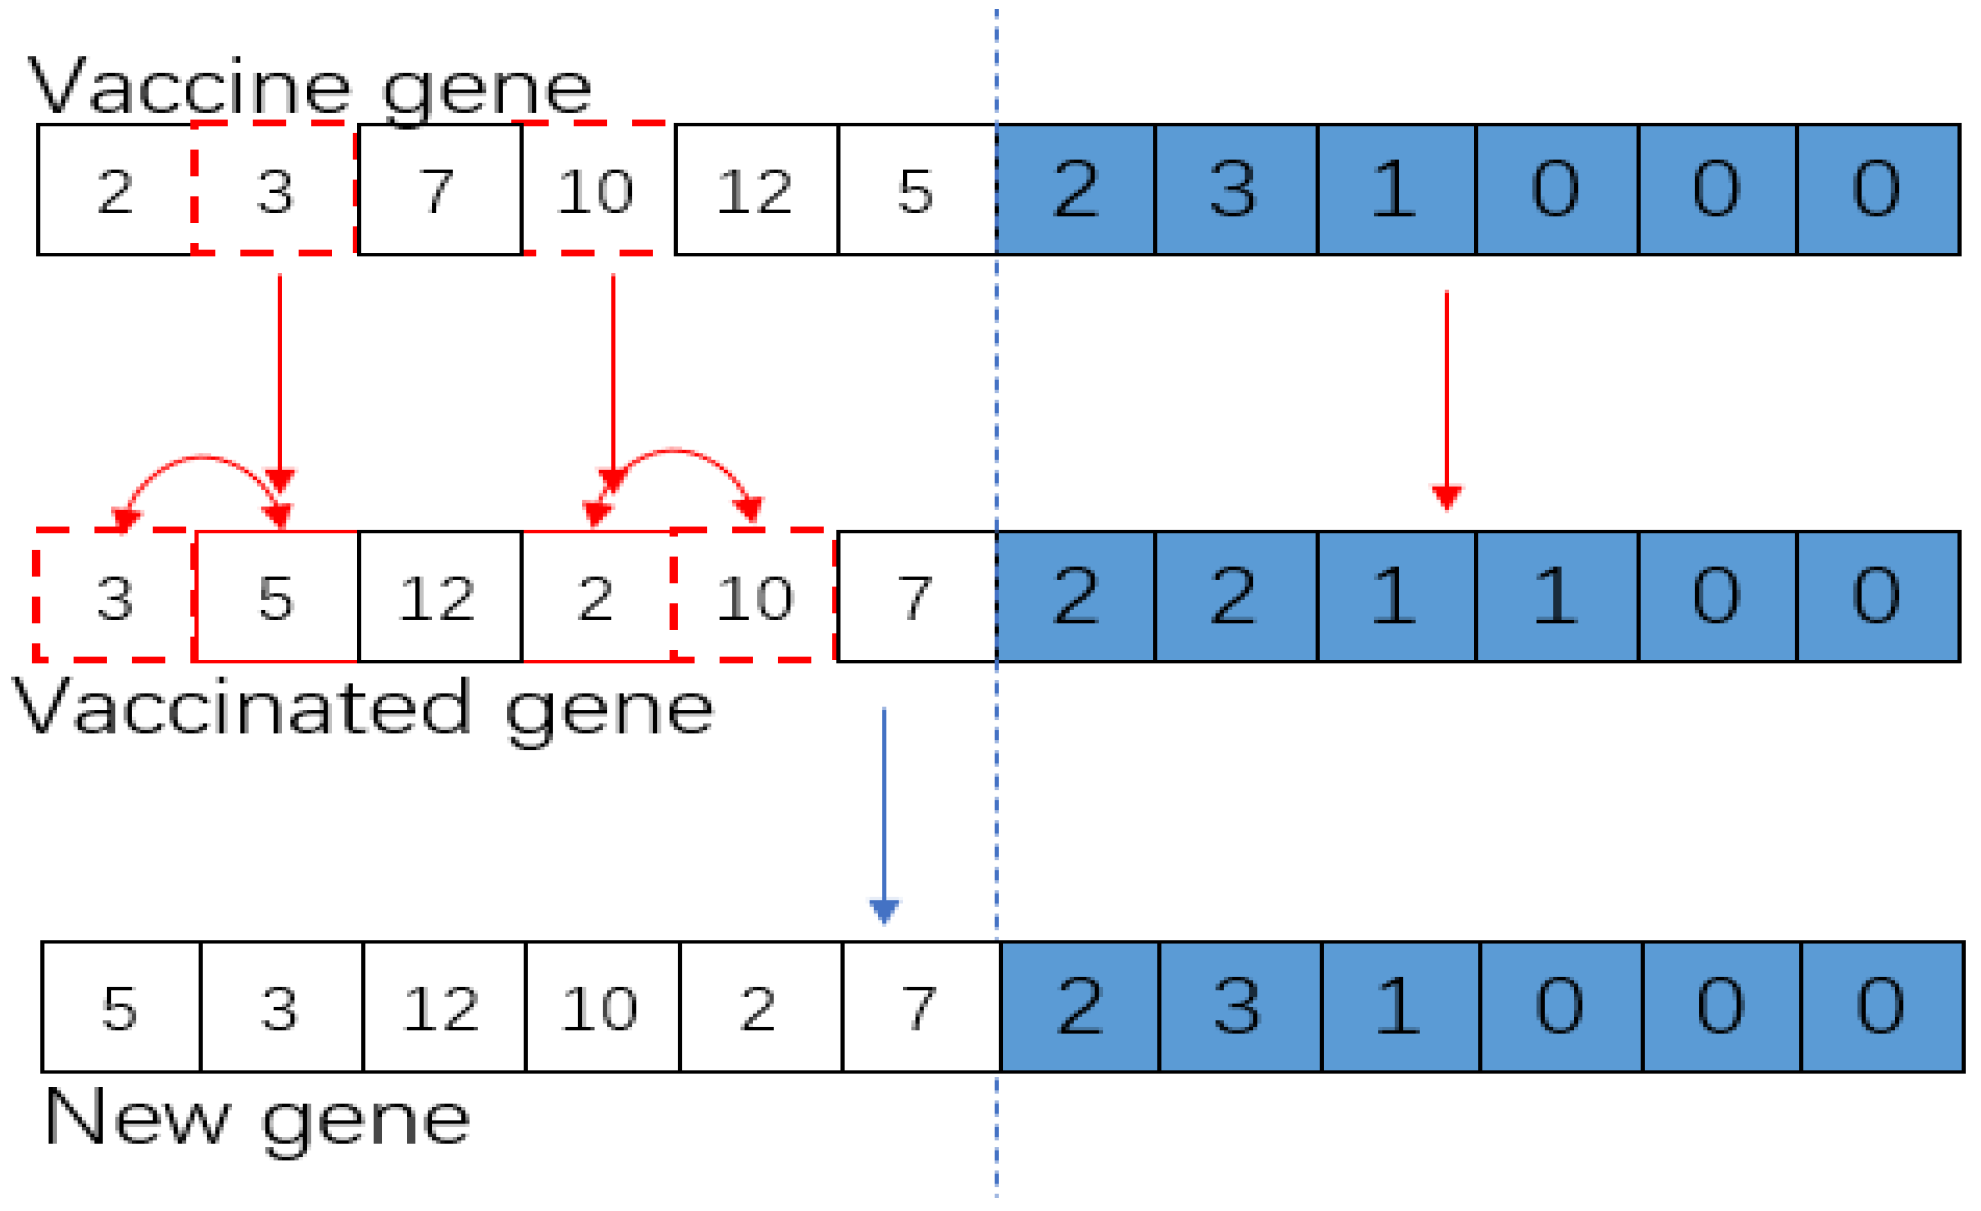
The vaccine gene is the best-performing individual in the current population. The vaccinated gene was inoculated to the individuals with the worst performance in the population (20 genes per population were selected in the experiment) to reproduce the good gene segments of the population.
According to the results of continuous experiments, the reasons for the excellent performance of a gene are as follows: 1. The F2 segment of this gene is expressed with less transport times. 2. The order of moving parts shall be sorted according to the time of shortage as far as possible. In other words, these are why poorly behaved genes have higher fitness. In order to maintain the validity of the gene, the allele values of F1 fragments were inoculated by sequence substitution. The idea is to look for the allele I of the vaccine gene P in turn, look for the P at the adjacent position of the I in the altered gene, and then swap the alleles at the two positions. In the case of the F2 fragment, if the vaccine gene is transported less, the F2 fragment of the modified gene is replaced by it (Figure 8).

4.8.2. Immunity selection

Through vaccination, the poor performance of the original individual is modified, and fitness value is calculated; if the result is good, the original vaccinated gene position is replaced; otherwise, it is discarded. The advantage of vaccination is that helping poorly performing individuals produce better offspring reduces their longevity in the population. It also keeps the number of individuals in each generation constant.

5. Computational Results

In order to evaluate the performance of the model and AIGA-based heuristic, there are 12 instances, distinct from the number of parts out of stock PN (initial inventory of line-side inventory and product sequence are different), so solutions of different sizes are offered. The proposed algorithm was coded in MATLAB 2012(b). Moreover, the mathematical model was coded in CPLEX. The two methods were implemented in a PC with an I5-8250U1.6 GHz CPU and 8.00 GB RAM. In addition, the parameters of AIGA are listed in the Table 1.

5.1. The Assumptions of an Assembly Line

The assumptions of the simulation model for the line are as follows:
The line can assemble three car models (M1, M2, M3), which are put into the line in order. The section of line for the supermarket is comprised of 6 workstations which are responsible for assembling 14 different types of parts. Table 2 shows the different types and quantities required for each product and the Q values for each type of part. The distance between the first line-side buffers and the other line-side buffers is D = [0 3 6 34.5 37.5 61.5 79.5 105 109.5 132 136.5 141 160.5 165]. The assembly line is linear. The distance between the supermarket and the line-side buffer of parts is D0 = [80.35 77.36 74.375 46.11 43.155 19.96 7.515 26.1 30.435 52.535 56.995 61.455 80.845 85.33]. The cycle time of the assembly line is 72 s, and the processing time of each station is 72 s. The velocity of the multi-load carrier is 3 m/s and is assumed to be invariable. For loading and unloading, l = 37 s, r = 43 s, α = 10-3, β = 106, γ = 1 . For the solution of the mathematical model, the number of tour N is the first to take the minimum, and if there is no solution on this basis, the number of the tour will be increased and then solved.

5.2. Results and Discussion

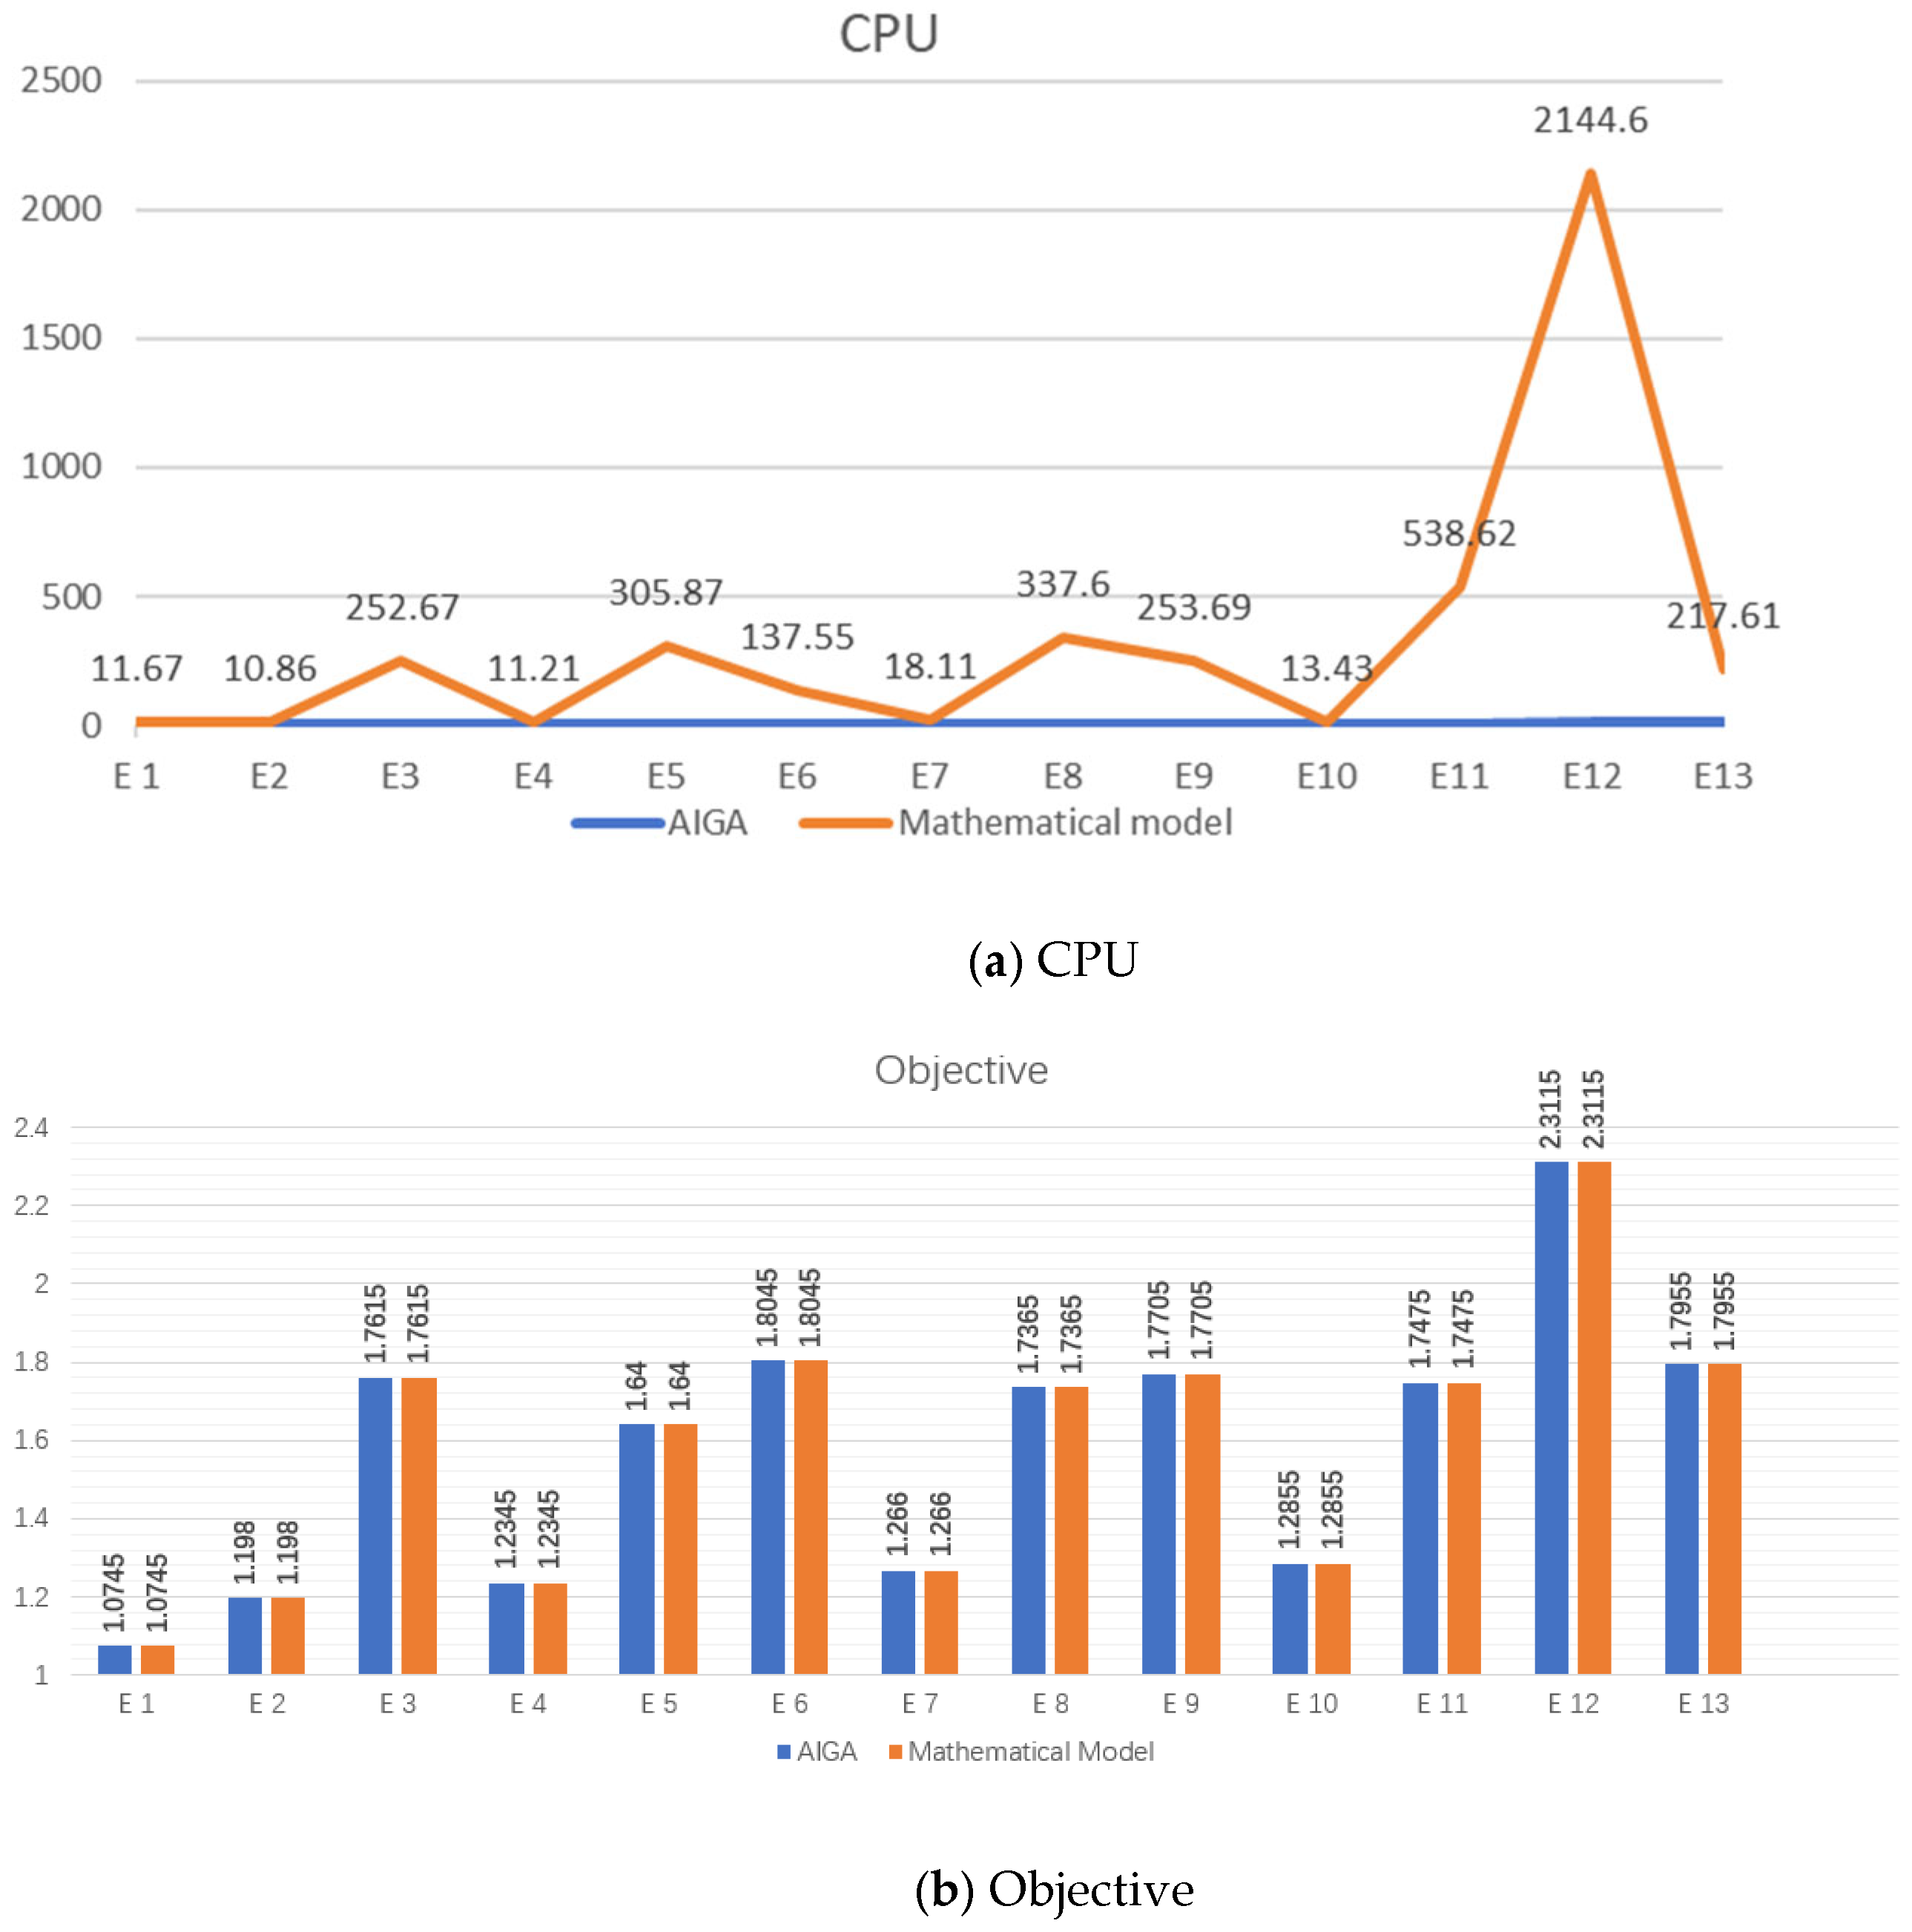
In order to verify the performance of the AIGA and mathematical model, this paper compared them with a genetic algorithm (GA) and selected two indicators: CPU and Objective. Due to the limitation of the slow calculation speed of the mathematical model, some examples with a calculation time of more than one hour are marked. The experiment data of proposed methods and GA are shown in Table 3. It can be observed that while faster than the mathematical model, the AIGA is slower than the GA. The immune genetic algorithm utilizes the immune memory mechanism and introduces the concepts of antibodies and antigens in each generation, making the computational complexity of the algorithm relatively high. In the immune genetic algorithm, the generation and selection of antibodies require the evaluation and matching of a large number of candidate solutions to find the optimal solution. This high computational complexity may result in the large CPU usage of the immune genetic algorithm. In contrast, the genetic algorithm uses operations such as selection, crossover, and mutation in each generation but does not introduce an immune memory mechanism. Therefore, the computational complexity of the genetic algorithm is relatively low and does not require a large amount of matching and evaluation processes, making its CPU usage relatively small.
In terms of objective, all three methods have the same objective value in small scale. However, as the scale increases, the mathematical model is unable to provide results within the specified time. On the contrast, the AIGA method is generally superior to the GA method. Compared with the GA, the AIGA introduces vaccination and immunity selection, making poorly performing individuals produce better offspring and reducing their longevity in the population, which leads to better solutions and minimizes the inventory level and delivery distance as a result.
In order to see the comparison of the two algorithms more intuitively, images were constructed for 13 examples which can calculate the results (Figure 9). In the small-scale examples, the AIGA adopts a strategy of random search, which generates random solutions and performs an optimization search to find the global optimal solution in the search space. In small-scale problems, the search space is relatively small, and random search can find the optimal solution more quickly. Therefore, the AIGA can find the optimal solution faster while maintaining the same objective value as the exact algorithm.

6. Concluding Remarkets and Future Direction

This paper focuses on the optimal traction train loading problem based on a variable path, the optimal distribution plan, route problem, and optimal departure time problem. A static scheduling method based on a mixed-integer linear programming model and artificial immune genetic algorithm is used to solve the problem of multi-truck part replenishment scheduling in the automobile assembly line. Compared with previous work, the proposed approach is improved in the following aspects:
(1)
In this paper, based on the variable path of a mixed-integer nonlinear programming model to optimize the production line in terms of line-side buffering capacity and the number of deliveries at the same time to solve the complexity of the non-linear model, the model is converted into a linear model.
(2)
To make up for the drawback that the integer mathematical model can only solve small-scale problems and the solution period is too long when solving large-scale problems, this paper proposes an intelligent algorithm, the artificial immune genetic algorithm, to ensure that the assembly line does not run out of stock and can obtain a better distribution solution in a short time. Compared to the GA, experiments show that the AIGA has better performance on a large scale, proving that the proposed method can improve the local search ability and quality of the solution.
A limitation of the study is the absence of considering various situations, such as emergency order insertion and machine failure. Future work can include combining algorithms with real-time dynamic scheduling problems to adapt to the uncertain environment of the assembly line. The machine learning method is introduced to make scheduling policy more adaptable.

Author Contributions

Conceptualization, Y.P. and B.X.; methodology, M.Z.; software, Y.G.; validation, B.X. and M.Z.; formal analysis, B.X.; investigation, J.Y.; resources, Y.G.; data curation, M.Z.; writing—original draft preparation, J.Y.; writing—review and editing, B.X.; visualization, J.Y.; supervision, B.X.; project administration, B.X.; funding acquisition, B.X. All authors have read and agreed to the published version of the manuscript.

Funding

This research was funded by Shanghai Pujiang Program grant number [22PJC051].

Institutional Review Board Statement

Not applicable.

Informed Consent Statement

Not applicable.

Data Availability Statement

Data is not disclosed.

Conflicts of Interest

The authors declare no conflict of interest.

References

  1. Halim, N.H.A.; Yusuf, N.; Jaafar, R.; Jaffar, A.; Kaseh, N.A.I.; Azira, N.N. Effective material handling system for JIT automotive production line. Procedia Manuf. 2015, 2, 251–257. [Google Scholar] [CrossRef]
  2. Ağlan, C.; Durmusoglu, M.B. A complete design methodology for lean in-plant logistics to assembly line using ad principles. Int. J. Ind. Eng. 2019, 26, 766–796. [Google Scholar]
  3. Liu, X.; Yang, X.; Lei, M. Optimisation of mixed-model assembly line balancing problem under uncertain demand. J. Manuf. Syst. 2021, 59, 214–227. [Google Scholar] [CrossRef]
  4. Yin, Q.; Luo, X.; Hohenstein, J. Design of mixed-model assembly lines integrating new energy vehicles. Machines 2021, 9, 352. [Google Scholar] [CrossRef]
  5. Fathi, M.; Rodríguez, V.; Fontes, D.B.; Alvarez, M.J. A modified particle swarm optimisation algorithm to solve the part feeding problem at assembly lines. Int. J. Prod. Res. 2016, 54, 878–893. [Google Scholar] [CrossRef]
  6. Kilic, H.S.; Durmusoglu, M.B. Advances in assembly line parts feeding policies: A literature review. Assem. Autom. 2015, 35, 57–68. [Google Scholar] [CrossRef]
  7. Boysen, N.; Emde, S.; Hoeck, M.; Kauderer, M. Part logistics in the automotive industry: Decision problems, literature review and research agenda. Eur. J. Oper. Res. 2015, 242, 107–120. [Google Scholar] [CrossRef]
  8. Fathi, M.; Alvarez, M.J.; Hassani Mehraban, F.; Rodríguez, V. A multiobjective optimization algorithm to solve the part feeding problem in mixed-model assembly lines. Math. Probl. Eng. 2014, 2014, 654053. [Google Scholar] [CrossRef]
  9. Fathi, M.; Rodríguez, V.; Alvarez, M.J. A novel memetic ant colony optimization-based heuristic algorithm for solving the assembly line part feeding problem. Int. J. Adv. Manuf. Technol. 2014, 75, 629–643. [Google Scholar] [CrossRef]
  10. Zhou, B.H.; Shen, C.Y. Multi-objective optimization of material delivery for mixed model assembly lines with energy consideration. J. Clean. Prod. 2018, 192, 293–305. [Google Scholar] [CrossRef]
  11. Li, H.; Zhu, S.; Tolba, A.; Liu, Z.; Wen, W. A Reliable Delivery Logistics System Based on the Collaboration of UAVs and Vehicles. Sustainability 2023, 15, 12720. [Google Scholar] [CrossRef]
  12. Ci, C. A Study on Machine Learning Based Multiple-Load Carrier Real-Time Scheduling Approaches. Ph.D. Thesis, Jiao Tong University, Shanghai, China, 2014. [Google Scholar]
  13. Rao, Y.Q.; Wang, M.C.; Wang, K.P.; Wu, T.M. Scheduling a single vehicle in the just-in-time part supply for a mixed-model assembly line. Comput. Oper. Res. 2013, 40, 2599–2610. [Google Scholar] [CrossRef]
  14. Zhou, B.; Peng, T. Scheduling the in-house logistics distribution for automotive assembly lines with just-in-time principles. Assem. Autom. 2017, 37, 51–63. [Google Scholar] [CrossRef]
  15. Satoglu, S.I.; Sahin, I.E. Design of a just-in-time periodic material supply system for the assembly lines and an application in electronics industry. Int. J. Adv. Manuf. Technol. 2013, 65, 319–332. [Google Scholar] [CrossRef]
  16. Fang, W.; Guan, Z.; Su, P.; Luo, D.; Ding, L.; Yue, L. Multi-Objective Material Logistics Planning with Discrete Split Deliveries Using a Hybrid NSGA-II Algorithm. Mathematics 2022, 10, 2871. [Google Scholar] [CrossRef]
  17. Gödri, I. Improving Delivery Performance in High-Mix Low-Volume Manufacturing by Model-Based and Data-Driven Methods. Appl. Sci. 2022, 12, 5618. [Google Scholar] [CrossRef]
  18. Song, T.; Zhou, J. Research and implementation of lean production mode in shipbuilding. Processes 2021, 9, 2071. [Google Scholar] [CrossRef]
  19. Abderrahim, M.; Bekrar, A.; Trentesaux, D.; Aissani, N.; Bouamrane, K. Manufacturing 4.0 Operations Scheduling with AGV Battery Management Constraints. Energies 2020, 13, 4948. [Google Scholar] [CrossRef]
  20. Zhou, B.; Zhao, Z. A hybrid fuzzy-neural-based dynamic scheduling method for part feeding of mixed-model assembly lines. Comput. Ind. Eng. 2022, 163, 107794. [Google Scholar] [CrossRef]
  21. Jin, W.; He, Z.; Peng, T. A JIT part supply scheduling strategy with electric transport device between central receiving store and supermarkets in the automobile industry considering energy. eTransportation 2021, 9, 100126. [Google Scholar] [CrossRef]
  22. Zhou, B.; Zhu, Z. Optimally scheduling and loading tow trains of in-plant milk-run delivery for mixed-model assembly lines. Assem. Autom. 2020, 40, 511–530. [Google Scholar] [CrossRef]
  23. Boysen, N.; Bock, S. Scheduling just-in-time part supply for mixed-model assembly lines. Eur. J. Oper. Res. 2011, 211, 15–25. [Google Scholar] [CrossRef]
  24. Niekurzak, M.; Lewicki, W.; Coban, H.H.; Bera, M. A Model to Reduce Machine Changeover Time and Improve Production Efficiency in an Automotive Manufacturing Organisation. Sustainability 2023, 15, 10558. [Google Scholar] [CrossRef]
  25. Guerrero, R.; Serrano-Hernandez, A.; Pascual, J.; Faulin, J. Simulation Model for Wire Harness Design in the Car Production Line Optimization Using the SimPy Library. Sustainability 2022, 14, 7212. [Google Scholar] [CrossRef]
  26. Xia, B.; Chen, T.; Wang, C. A method to solve the assembly line parts feeding problem based on variable route. In Proceedings of the 2019 2nd World Conference on Mechanical Engineering and Intelligent Manufacturing (WCMEIM), Shanghai, China, 22–24 November 2019; pp. 631–634. [Google Scholar]
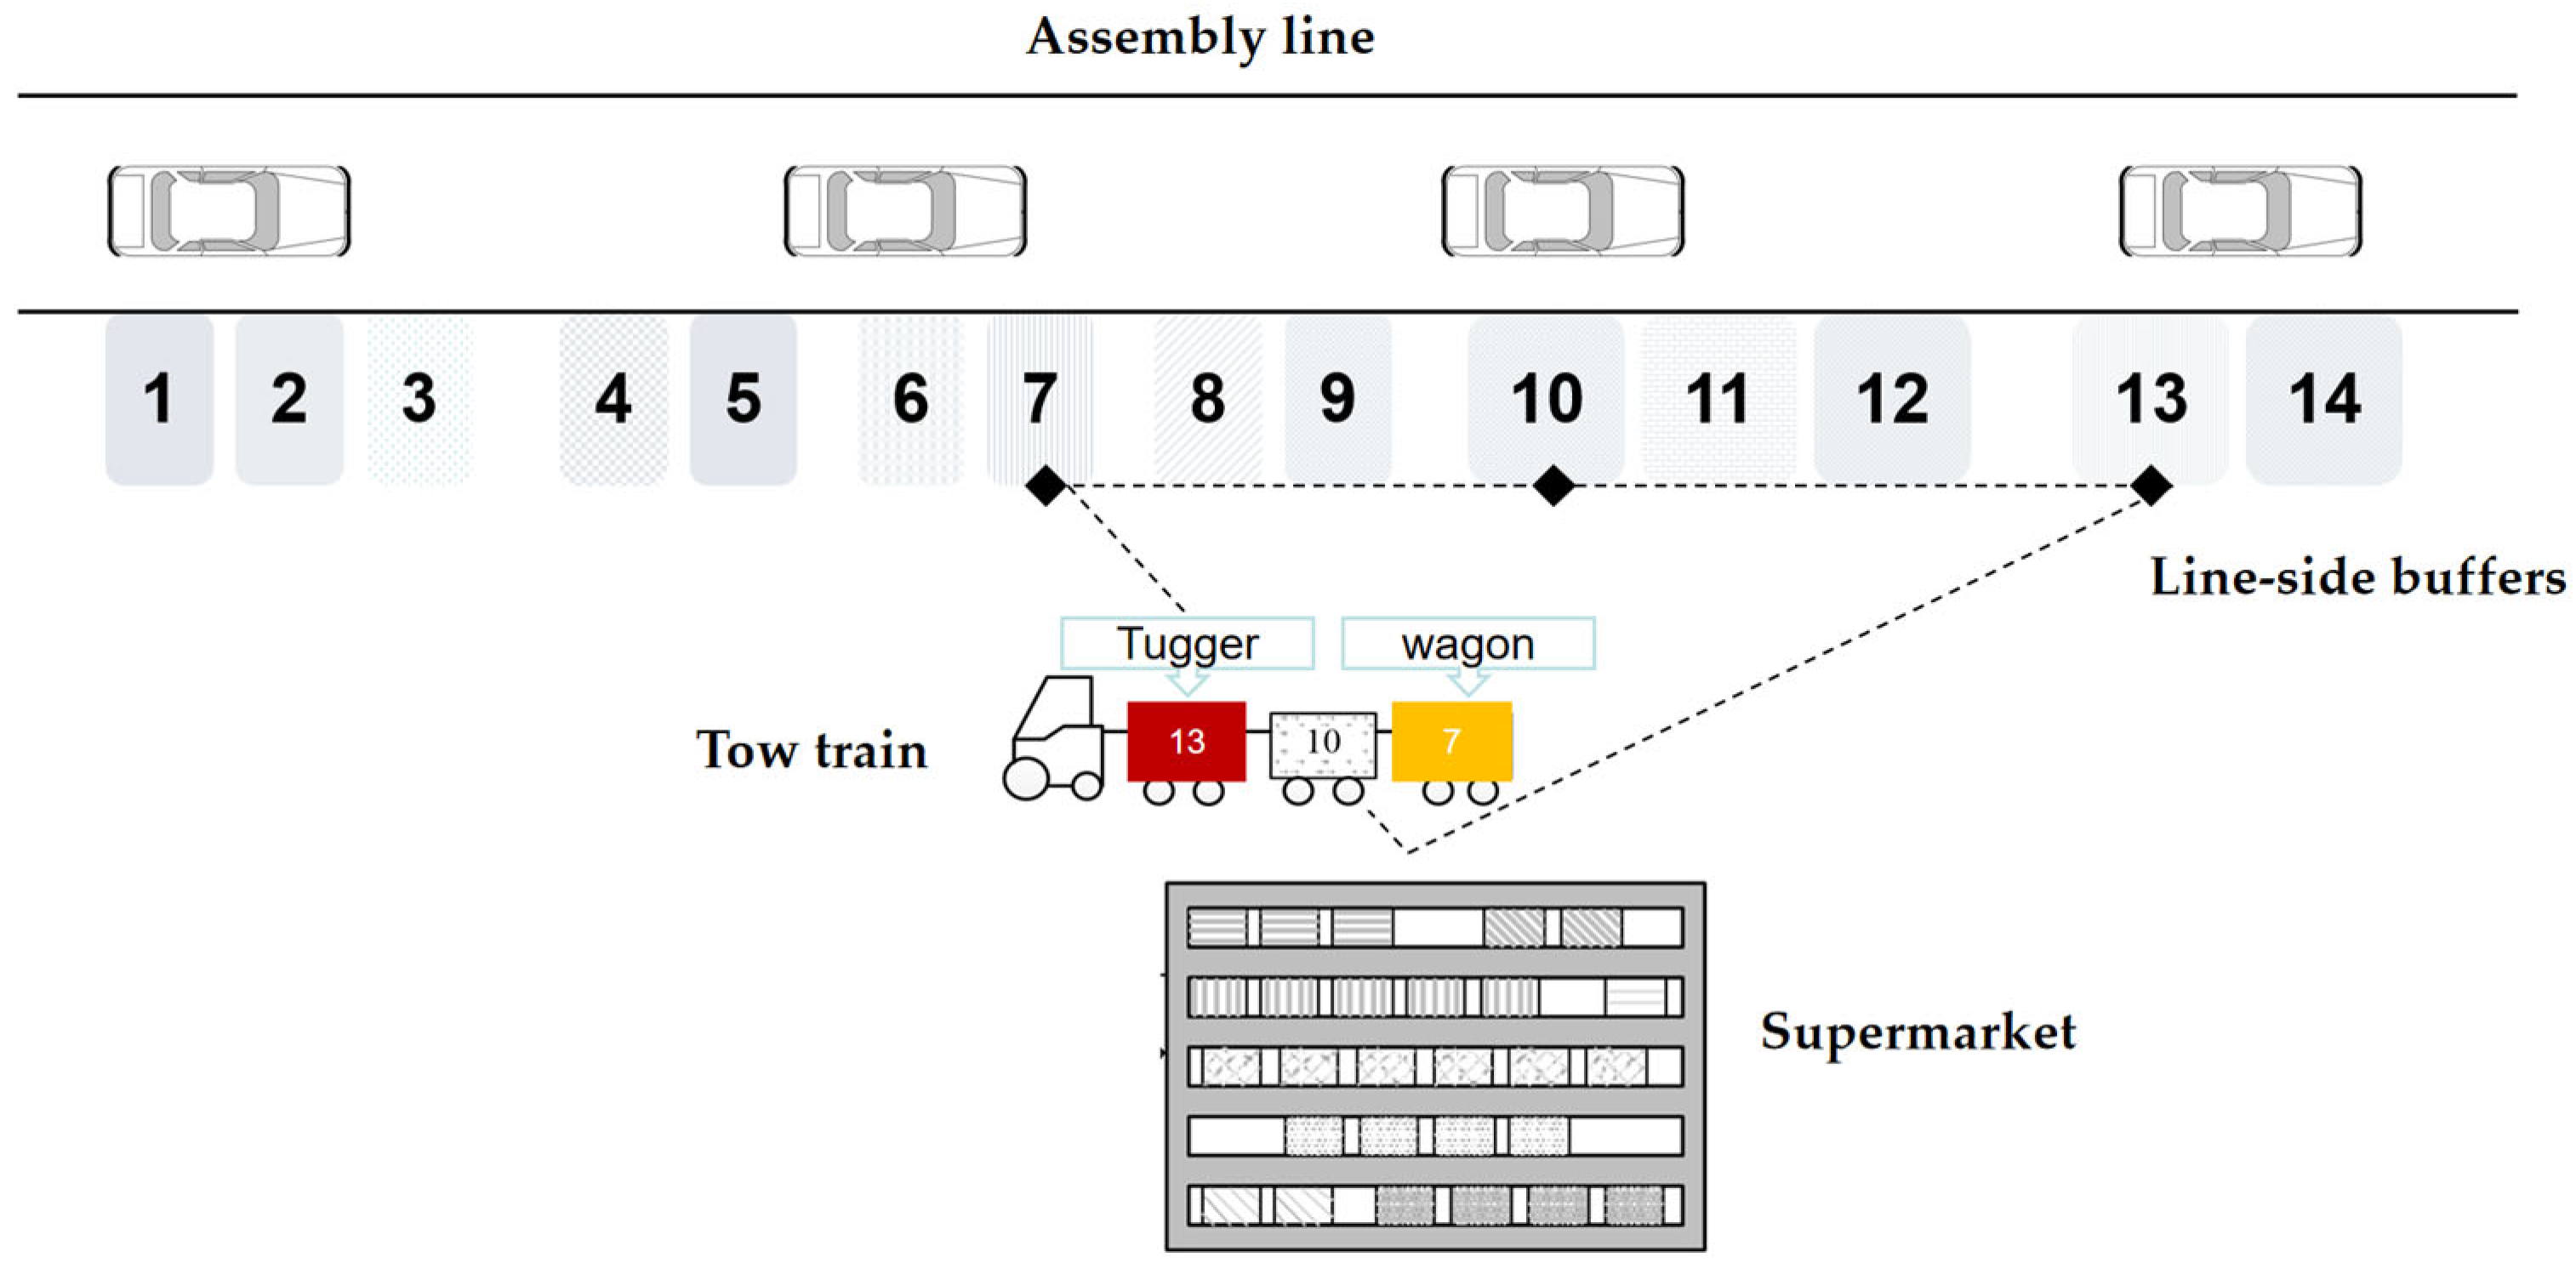
Figure 1. The view of a tow train traveling with a variable path for scheduling.
Sustainability 15 14567 g001
Figure 2. The implementation flow of artificial immune genetic algorithm.
Sustainability 15 14567 g002
Figure 3. An example of an antibody for scheduling.
Sustainability 15 14567 g003
Figure 4. An example of a suitable memory cell.
Sustainability 15 14567 g004
Figure 5. The process of calculating the start time of traveling.
Sustainability 15 14567 g005
Figure 6. The operation steps of crossover.
Sustainability 15 14567 g006
Figure 7. The operation steps of mutation.
Sustainability 15 14567 g007
Figure 8. The operation steps of vaccination.
Sustainability 15 14567 g008
Figure 9. Simulation results of different dispatching methods.
Sustainability 15 14567 g009
Table 1. The parameters of AIGA.
SymbolDescriptionValue
PcProbability of crossover0.9
PmProbability of mutation0.1
MCThe number of memory cells30
GPThe number of iterations of the algorithm80
INThe number of individuals in each generation400
Table 2. BOM and SPQs.
P1234567891011121314
M111110011001001
M210001110100101
M310001011010010
Q3016301845666070805045403650
Table 3. The result of examples.
ExampleMPNAIGAMathematical ModelGA
NCPU/sObjective/108NCPU/sObjective/108NCPU/sObjective/108
130528.451.0745211.671.074524.231.0745
2625.641.1980210.861.198023.821.1980
3836.331.76153252.671.761535.091.7615
440526.841.2345211.211.234524.941.2345
5737.201.64003305.871.640037.201.6400
6937.131.80453137.551.804534.741.8045
750527.361.2660218.111.266024.851.2660
8836.511.73653337.601.736534.741.7365
9937.181.77053253.691.770535.181.7705
1060627.171.2855213.431.285526.781.2855
11837.321.74753538.621.747535.581.7475
1212410.482.311542144.602.311549.282.3250
1370939.331.79553217.611.795535.551.7955
141048.982.1430-3600-46.662.1455
151249.232.2865-3600-45.412.3240
168010410.012.1430-3600-46.712.1480
171149.462.2540-3600-46.212.2695
1813510.152.6710-3600-56.982.7350
199010411.232.1480-3600-46.552.1480
2011410.682.1880-3600-46.732.1880
2113511.512.6920-3600-58.012.6920
2210013511.682.7330-3600-57.002.7980
2315512.632.9205-3600-57.583.0630
2416611.283.3920-3600-68.793.4670
Disclaimer/Publisher’s Note: The statements, opinions and data contained in all publications are solely those of the individual author(s) and contributor(s) and not of MDPI and/or the editor(s). MDPI and/or the editor(s) disclaim responsibility for any injury to people or property resulting from any ideas, methods, instructions or products referred to in the content.