1. Introduction
Despite the huge amount being invested in real estate investment trusts (thereafter, REITs), which is estimated at USD 35 trillion, and half of the global equity market capitalization around the world [
1] the risk emanating from climate change is becoming a major factor to reckon with especially to ensure environmental sustainability for REIT business to thrive. Specifically, climate risks, such as physical risks or transition risks, pose a significant challenge to investors in REITs. While the physical risk constitutes natural disasters arising against sustaining REIT business, which are acute factors (such as flood, drought, and wildfire) and chronic factors (like sea-level rise, temperature rise, and unstable precipitation pattern), transition risks are more congruent to issues relating to a path of maintaining low-carbon economy with attendant impact on dependent sectors as a sustainability measure (see [
2] and various papers cited therein). However, given the varying challenges posed by climate change against environmental sustainability for investors in REITs, it is now suggested that investors with innovative ideas in utilizing emerging technologies are more likely to withstand these challenges, particularly by sustaining the environment to maximize returns from investing in REITs [
1]. By implication, the consideration of utilizing technologies to mitigate the impact of climate change for REITs is becoming crucial for investors in REITs. What remains controversial is the direction or extent to which technological innovation will influence this nexus. As a result, we are interested in investigating the potential relationship between risks associated with climate change and REITs with an extended analysis of the role of technological adoption in the nexus.
There are numerous numbers of empirical studies on the climate change–REITs nexus. In some instances, climate risk is found to have many implications on real estate prices via the discount channel [
3]. The literature has equally provided enough evidence to suggest that temperature patterns can impact the economy via different channels. In particular, temperature changes have a great influence on per capita income (see [
4]), labor productivity and sales volume [
5,
6,
7], manufacturing export [
8], and performance of commercial real estate investment [
9]. Other related studies provide links between climate change and stock returns. News on climate change can significantly influence the stock prices of an energy-related firm that is tied to climate change [
10,
11]. While this evidence has been offered in the literature, studies on how technological adoption will influence the relationship between climate risk and REITs are still missing.
Another research focus has equally explained the behavior of commercial real estate prices, especially in times of crisis, such as in the era of COVID-19 [
12,
13,
14,
15,
16]. Also, in prior studies, real estate investments are found to have a weak correlation with financial assets, in addition to the inflation-hedging nature of investment in real estate (see [
17]). We equally find studies that have addressed the issue of technology shock concerning real estate investment trusts (for example, see [
18]). Particularly, [
18] model technology shock as having a permanent impact on housing prices in the US and UK while they further theorize that a positive technology shock will have a long-run positive and significant impact on housing prices. By this implication and given that housing commodities can either stand as consumption or investment goods, it then becomes suggestive that positive technological innovation might not only increase disposable income but also increase consumption of the housing commodity and encourage investment in this nexus.
One issue of concern becomes discernible from the foregoing. While there are studies on the possible impact of climate change on REITs, and some of those have modeled the efficacy of technological innovation in improving the performance of REITs, the literature is very scarce on how technology-induced climate risk can help to mitigate the risk of climate change on REITs. Hence, our attempt to evaluate this nexus is very necessary and worthy of considerable attention. On the choice of data, our study has a very different dimension from prior studies. Specifically, we utilize recently constructed technology innovation data by [
19], which is derived from the patent rights of the residents. Although other studies (these studies include [
20,
21]) have equally constructed technology shock series that are related to patent rights, they were not as elaborate and encompassing as in the case of [
22] (while [
20] consider a patent right that correlates with stock prices and returns, [
19] take care of all residence patent rights, which are particularly constructed for the US, OECD, countries, and a further group of 164 countries. This makes the data the potential of global outlook and fit for our analysis). One of its main advantages is having a long scope of more than a century, which, in particular, by nature, accommodates long-run analysis. Also, the derivation of the series takes caution by making provision for waiting periods between the time of granting the patent right and the time its impact becomes manifested in the economy. This, in particular, helps to cater to the look-ahead problem that often trails data of this nature. As for REITs, we use both data on equity and mortgage for robustness analysis. In essence, we compute their returns by taking their log difference between the prior year and the current year, which is then modeled in our methodology. Global temperature anomaly from the National Aeronautics and Space Administration (NASA) is employed to capture climate risks. These data measure the variability in weather change at a global level. For robustness evaluation, we make further analysis by considering the index of global real economic activities (GECON) by [
23] instead of technological innovation. The result thereof is expected to be consistent with earlier findings.
The fact that our analysis is viewed from a long-term perspective by employing data from 1968 gives us the chance to show an empirical relationship over a long-term period and also allow us to trace a series of transformation that any concerned economy might have possibly undergone. Further, using historical data provides information on the extent of the time-driven nature of the data (see [
22,
24]). Our choice of methodology is another important contribution to this study. Specifically, we motivate our analysis by using the GARCH-MIDAS model, which allows for mixed data frequencies in predictability analyses. This is highly necessary as the frequency for REITs is available quarterly, while that of technology shock and temperature anomaly are annual. Hence, to accommodate these variables in their natural sense and to avoid information loss due to data slicing or aggregation, the MIDAS approach becomes very crucial. As a matter of emphasis, our evaluation will be global, where consideration is given to both developed and emerging markets that are also inclusive of the US economy.
Arising from the foregoing, we desire to answer the following research questions: To what extent will the risk associated with climate change impact REIT business for the US economy? How will technological innovation moderate this nexus? How, also, rather than through innovation, will global economic expansion moderate the REITs–climate change relationship? While answering these questions, we keenly refer to the rationale of the study, which is essentially to investigate the potential relationship between the risk associated with climate change and REIT business, and determine the possible influence of technological innovation in the nexus. By extension, instead of innovation, global economic expansion is tested in lieu as a way of robustness analysis. Rather than equity returns, our evaluation is further verified by using mortgage REIT returns.
However, our findings suggest that climate change not only exacerbates the risk associated with US equity REITs (i.e., return volatility of US equity REITs), but it also offers some predictive information for the future outcomes of the equity REITs’ volatility. However, technology innovation (shock), when introduced into the model, stems from this cheering impact of climate change on the return volatility of US equity REITs. Likewise, replacing the influence of technology shock with global economic expansion (GECON) in the climate change–equity REITs nexus provides similar results. In other words, our conclusion on the role of TS in the climate change–equity REITs nexus is robust to an alternative measure of economic shock. It is imperative also to note that when these empirical analyses are replicated for mortgage REITs of the US, our previous conclusions for equity REITs remain.
Following this introduction, the rest of the paper is structured thus. In
Section 2, we offer a brief review of related literature. While
Section 3 highlights the framework upon which our analyses are conducted,
Section 4 describes the data and provides summary statistics therefrom. In
Section 5, the main analyses are conducted, and the results are carefully discussed, with some policy implications offered. Finally,
Section 6 concludes the paper.
2. Brief Literature Review: Climate Change, Technology, and REITs
The literature on climate risk concerning REITs is very clear on the direction of impact concerning REITs’ performance. It is documented that climate risk that results from temperature changes has an indirect relationship with REITs’ returns and performance (see [
9]). Importantly, two main risks are associated with climate change with wider implications for REITs on financial performance and investment sustainability. These are physical risks and transition risks. Climate changes that generate physical risks (such as flooding, earthquakes, and wildfires) often increase the vulnerability of REITs to the destruction of property and disruption/seizure of operation, whereby property value falls with higher operational costs. On the other hand, transition risk is associated with the various costs in maintaining minimum energy costs with REITs’ operation [
25]. More importantly, recent studies in the area of climate risks and REITs have documented varying outcomes. Some analyses that have been performed on firm-level climate risk concerning commercial REITs suggest that negative consequences arise from such risks to REITs’ activities (see [
19,
26]). Other findings relate REITs to their possible returns when the climatic condition is rather intense. Such studies give ideas that housing prices are prone to fall in the area with the likelihood of rising sea levels [
27]. In that regard, [
28] warn not to use the sea level effect for factors such as land motion, which may be significantly responsible for low housing prices.
However, concerning real business cycle literature, (neutral) technology shock is found to have a non-negligible impact in explaining output growth and fluctuation. A positive innovation to technology shock is expected to result in a higher output level, consumption, and investment (which is inclusive of those in REITs) (see [
29,
30,
31]). Specifically, with positive technology shock, capital prices are likely to fall while asset return rises, and investors are motivated to work harder, which thus results in higher investment. However, technological innovation has further been linked to economic growth by improving environmental quality (see [
32]). By implication, the quality of the environment degraded by climate change can be improved through technological innovation. Studies have also linked output fluctuation to technology shock, though it is believed to have a relatively lower impact rate (see [
33,
34,
35]. The discussion of technology shock has also taken the dimension of international technology diffusion, where it is believed that most of the innovation in local economies has resulted from innovations that spring from a small handful of rich countries (see [
36]). Technological innovation for information and communication has equally been linked to retail property (see, for example, [
37]). In such studies, it was argued that the sale of retail property is often encouraged through information and communication.
On resource allocation, studies have suggested that technological innovation could have substantial implications for resource reallocation and economic growth (see [
20,
38]). In particular, innovation with a higher spread in any particular sector is likely to result in what Schumpeter terms ‘creative destruction’. By implication, one part of the sector may see some improvement as a result of innovation while the other part becomes a victim of the new innovative knowledge with relatively no impact on productive capacity in the aggregate term. However, when technological innovation spreads across firms and sectors, the growth impact is expected to generate higher output growth at both sector and aggregate levels through investment and consumption channels. In this connection, we aim to propose the extent to which technology-induced climate risk can help to mitigate the impact of climate change on REITs. As the literature on this subject is very scarce (see [
39]), we intend to make our contribution by providing evidence on how technological innovations can mitigate the negative impact of climate change on REITs. Expectedly, where there are technological innovations, REITs are likely to respond in a positive way. However, it becomes an issue as to whether the positive impact of such innovations will tamper the connection between climate risk and REITs. Importantly, where the connection is negative, do we expect technological innovations to moderate this outcome or enhance it if the connection is positive? This is an important question that we seek to answer in this study.
3. Methodology
The theoretical relationship between climate change and real estate investment trusts (REITs) and the impact of technology shocks on this relationship hinges on the Arbitrage Pricing Theory (APT). This theory assumes that an asset’s anticipated return (and, therefore, its level of volatility) can be forecasted based on various macroeconomic factors that capture systematic risk. Climate risk and technology shock are a type of systematic risk, as they affect more than just the environment or industry from which it originates. Therefore, the APT is well suited to explain the connection between climate change and REITs in theory. The differing nature of the scope of our data influences the choice of technique of estimation for this study. Essentially, we use three different data sources. We estimate our model using data for REITs (both equity and mortgage), temperature anomalies, and technological innovation. While the frequency for data for REITs occurs quarterly, data for technological innovation and temperature anomaly originally appear in yearly frequency. However, as a way to capture the information inherent in these data and to avoid the information loss that is associated with data slicing and/or aggregation, we employ the GARCH-MIDAS technique as proposed by [
40] (which, as a method, equally finds root from [
41]). More importantly, the GARCH methodology is very useful when the variance of the error term is serially autocorrelated. Our data exhibit this feature, and a way to deal with it is by using this approach. Additionally, our study emphasizes the predictability of return volatility, which the GARCH model essentially accommodates in time series analyses. Consequently, we set out to test three important hypotheses.
Hypothesis 1 (H1). Risk associated with climate change has no impact on REITs’ return volatility.
Hypothesis 2 (H2). Technological innovation does not influence the nexus between Climate change and REITs for the US economy.
Hypothesis 3 (H3). Global economic expansion cannot moderate the relationship between Climate change and REIT Business for the US economy.
Our models are accordingly formulated in line with these hypotheses. In the first step, we define our REITs’ return series as
, where
is the price on the
ith quarter of the
tth year, for
and
respectively, denote the yearly and quarterly frequencies, while
indicating the number of quarters in a given year
t. The GARCH-MIDAS model usually consists of an equation of conditional variance with two important components: the short-run and long-run components, which are represented in Equations (1) and (2) (In variance to the typical GARCH model, which often has two equations, the mean, and the variance, both of which can accommodate predictor series, which suggests that the investor's intention can be evaluated effectively for long-run analysis):
where
represents the unconditional mean of the return series,
, the short-run component of the conditional variance, and it is of a high (quarterly) frequency that typically follows: the GARCH(1,1) process, and
, the long-run component with a low (yearly) frequency. The disturbance term in Equation (2),
, follows a Gaussian distribution and
denotes information set on the day
of the year
.
The component of short-run conditional variance
is captured in Equation (3) as follows:
where
and
respectively indicate the ARCH and GARCH terms; conditioned to be positive and/or at least zero (
and
) and their sum must be less than unity
. The low (yearly) frequency long-run component
is transformed into quarterly frequency
, without loss of generality (see [
40] for technical and more details). What this implies is that the quarter in the year
is rolled back without keeping track of it, and, in turn, yields the quarterly long-run component defined in (4) as follows:
where the “
” assigned as superscript suggests that a rolling window framework (which allows the secular long-run component to vary quarterly) is implemented;
is the long-run component intercept;
is the MIDAS slope coefficient that indicates the predictive value of the incorporated exogenous predictor
where
is the weighting scheme that must sum to unity for the identification of the model parameters.
Going by the above, we can evaluate the predictability of the exogenous factors, which are (a) temperature anomaly, (b) technology-induced temperature, and (c) global economic condition (which we used for robustness analysis) in the return volatility of REITs where we test for the significance of the MIDAS slope coefficient (This is a measure of the predictive ability of the predictor variables.) as either being different from zero or not. When this slope is significant, it suggests that the predictors do influence the REITs’ return, the associated signs, however, determine the direction of the relationship.
4. Data and Basic Summary Statistics
Going by the focus of this study, we proxy real estate investment trusts (REITs) through both the equity and mortgage prices of REITs obtained from FRED data (These data can be retrieved from
https://fred.stlouisfed.org). The frequency of the data is quarterly and spans the period of 1968 to 2018. While these data extend beyond this period, we are limited to the year 2018 due to the scope of the technological shock variable, which does not go beyond this year. As for climate change, we capture it through temperature changes that are announced regularly by the National Aeronautics and Space Administration (NASA) and Goddard Institute for Space Studies (GISS), and it occurs as yearly data with a wider scope. The provision of these data is intended to provide a time series analysis for the measurement of weather variability across the globe. Just like data for REITs, the end data are justified by the availability of data for technological shock. Lastly, we used the technology shock series by [
22], whose construction follows some specific steps that principally involve the de-trending of growth in patents for the concerned country. It is particularly estimated by taking the natural logarithms of the number of patents, where its growth rate is then de-trended using 5-year rolling windows. This window period accounts for the lag period that is necessary between the registration of technological discovery and the period of approval. However, the series is of three types. While the first is global (computed for a group of 164 countries, GTS_164), the second is mainly for selected 12 OECD countries (GTS_OECD). The last series captures technology shock for the US (TS_US) (for further discussion on the computation of this series, we refer the readers to [
22,
42]. The series is available for over 100 years, but the start date of 1968 is defined by the data available for other independent variables.
For a robustness check, we further our analysis by considering using data on Global real economic activity by [
23]. We denote this as the GECON index, and it occurs as annual data (The data source for The Kilian Index of global real economic activity (REA):
https://www.dallasfed.org/research/igrea, accessed on 28 August 2023). We particularly employ GECON in lieu of the technology shock series to check the extent of agreement between the outcome obtained from when GTS is used and GECON. As a way to have a foreview of the connection between the REITs and GTS, we make a time series plot, and the graph is shown in
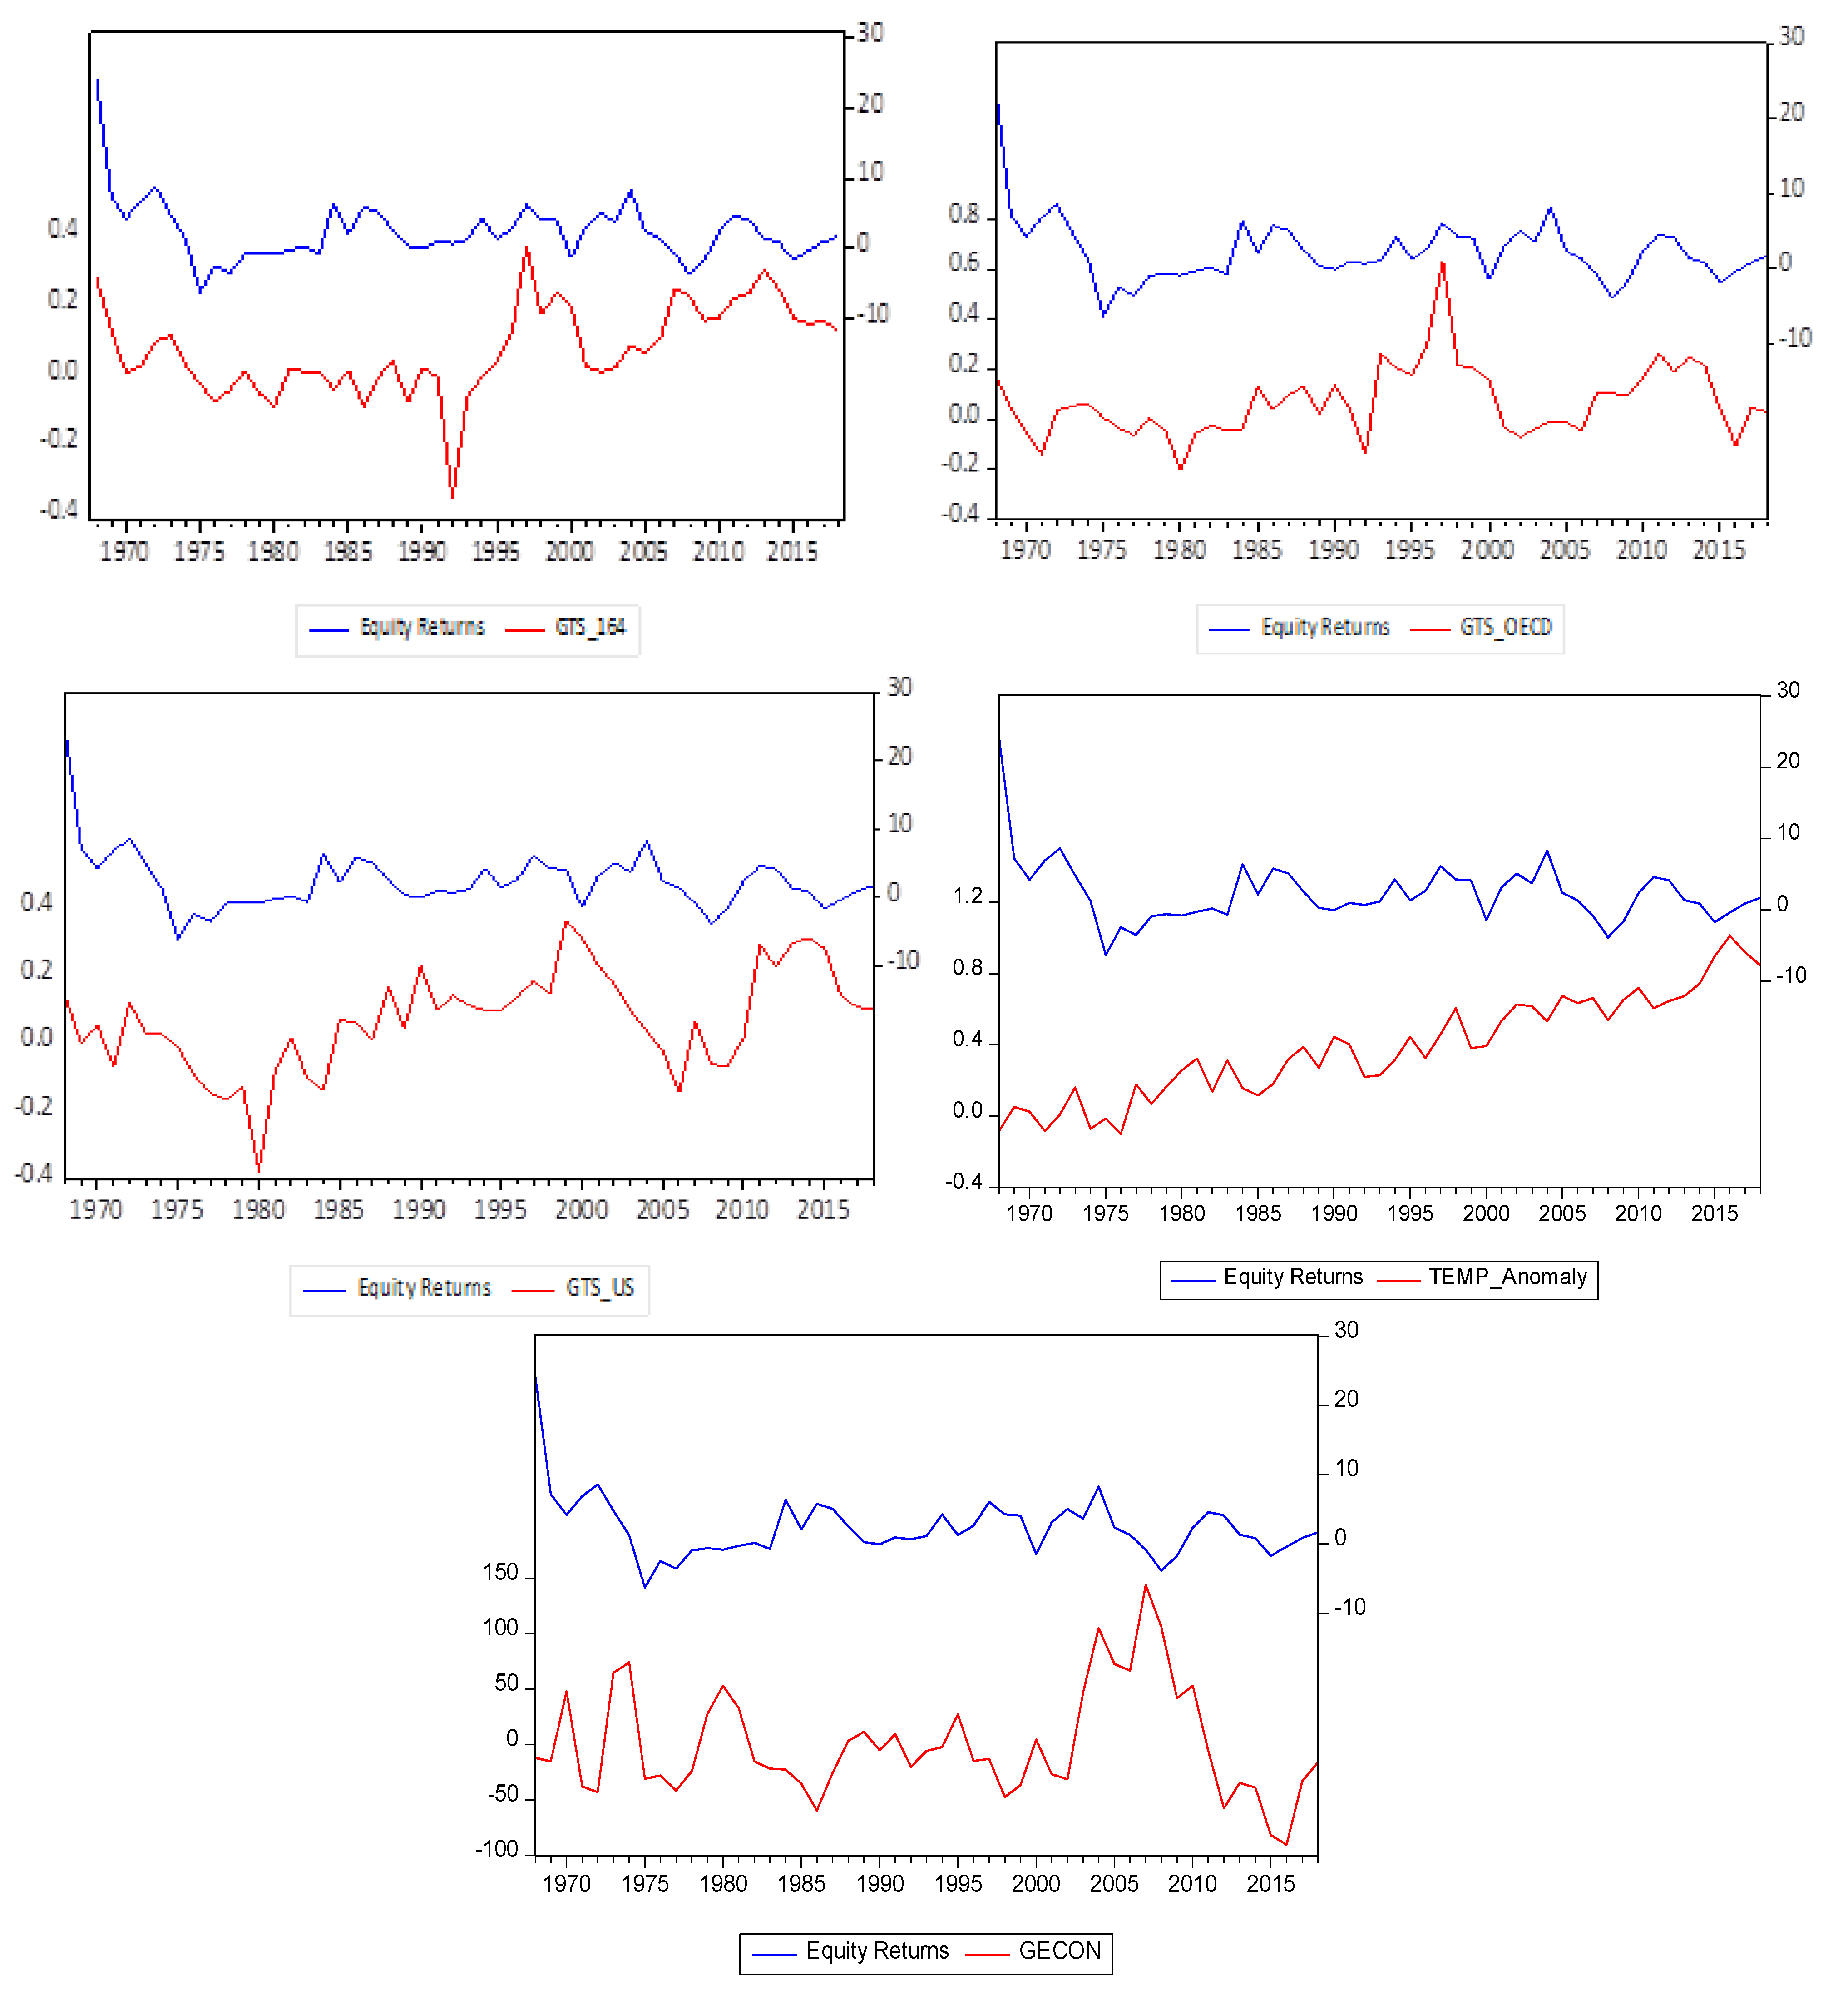
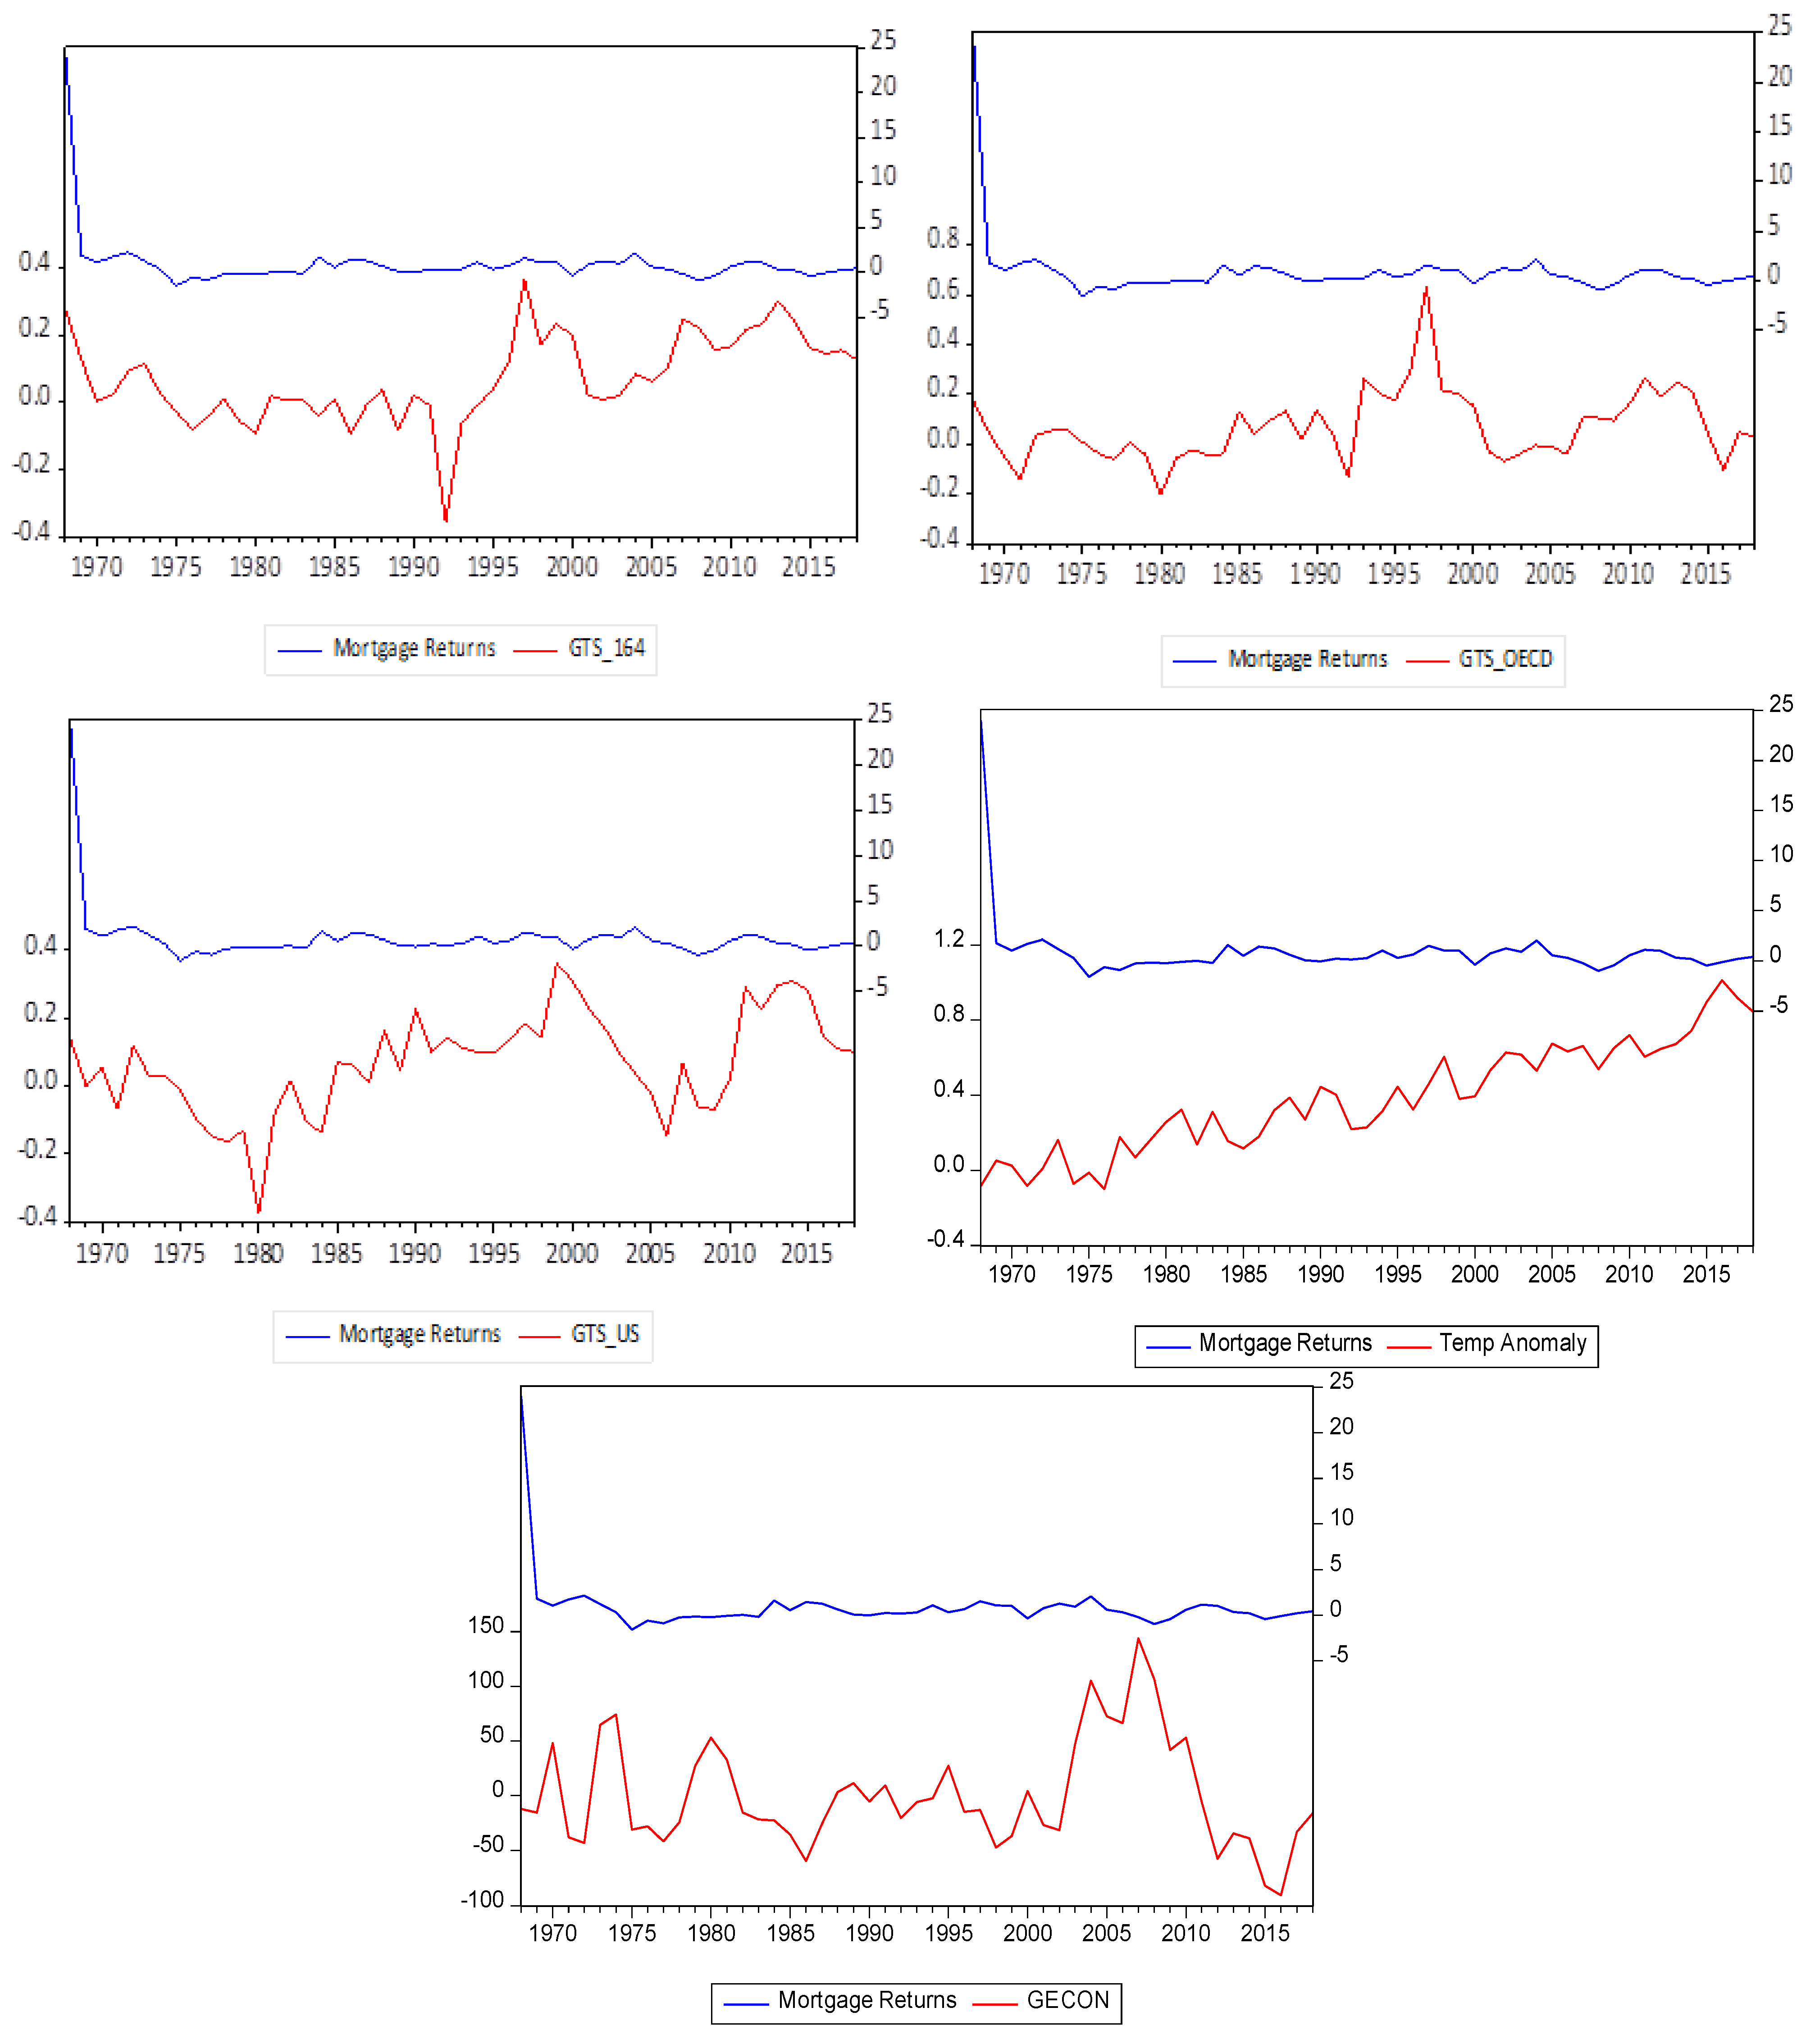
Figure 1 and
Figure 2 for equity and mortgage REITs, respectively (this is equally provided for REITs with temperature anomaly and GECON in the same figures). In these plots, the co-movements between the series of the dependent variable and that of the independent variable indicate some level of indirect relationship between the two variables.
As provided in
Table 1, we make a presentation on the summary of our data as employed by this study. Specifically, we defined our data in this regard by providing information on their mean value, standard deviation, coefficient of variation, kurtosis, and skewness. While the average values for both equity and mortgage REITs slightly differ by a magnitude of only 0.4, the values for standard deviation exceed 4 for both returns, and this gives an indication that the two series are highly volatile. The two series relatively have hump high and tail to the right side. Perhaps due to being an annual series, the technology shock series has a lower standard deviation that is higher than the coefficient of variation. While they are all highly peaked, only GTS_OECD is positively skewed, but both GTS_164 and TS_US are found to have a long tail to the left. The temperature anomaly that captures climate change is an average of 0.375, which is positively skewed and relatively peaked. The lower standard deviation of 0.287 with a coefficient of variation of 0.749 suggests that it is less volatile.
On the other hand, the average value for GECON is low (0.374), while the values for standard deviation and coefficient of variation are respectively high (48.9 and 130.9). In all, the data for REITs have 203 observations (since they are quarterly data), while others have 51 observations for being yearly data. Lastly, we make a formal test for the presence of the ARCH effect and autocorrelation for the dependent variables (see
Table 2). The information thereof suggests the suitability of our method of analysis, which is the GARCH methodology of the MIDAS variant. However, given the frequency of all independent variables, which is an annual series, we expunge the test of ARCH and autocorrelation as they may not necessarily exhibit such features (We conduct this test for each of the series of all independent variables, and the outcome indicates no ARCH effect and autocorrelation).
5. Results and Discussion
In this section, we present the results of the effect and/or the predictability of climate change, proxied by temperature anomaly (high temperature) (Our interest in high temperature as a proxy for climate change risk stems from the fact that Ozone layer depletion, a consequence of climate change, increases the likelihood of frequent fire outbreaks (globally), shifting rain and snow patterns, changes in plant ecosystems, and other climate-related changes, which are likely to have a severe impact on investment in real estate (see also [
43]), on/for the return volatility of US equity. A priori, climate-related hazards can have an impact on REITs’ finances in several ways, including higher insurance costs, greater maintenance and repair costs, and decreased rental income. The cost of capital for REITs can also be impacted by climate-related concerns, which can affect both debt and equity financing, as well as returns and the associated volatility. In essence, in this study, the assessment of the impact of climate change risk on the return volatility of equity REITs is carried out in several steps. One, we capture the climate change with temperature anomalies, a deviation (positive or negative) of actual global temperature from the average temperature. For the assessment of the climate–equity REITs nexus, we consider a positive temperature—where the actual temperature is more intensive than expected—which indicates high temperature. This high temperature, captured by the dummy (This is performed such that negative temperature is assigned zero, and one is for positive. This process is repeated for various degrees (25th, 50th, and 75th)), is further divided into various degrees (25th, 50th, and 75th percentile computed as N
i/100 × S, where N
i is the corresponding percentile, and S is the sample size), to stress the effect of variations in the degrees of temperature on the equity return volatility of REITs. Two, the role of technology shock in the foregoing nexus is equally assessed. We expect improvement in technology (technology innovation) to reverse the depressing effect (if any) climate change might have on US equity REITs’ return volatility. Thus, we consider various proxies of technology innovation, such as global, regional, and US-specific (see [
19]) in our analyses. We further offer some additional analyses by considering the likely impact of global economic expansion on climate change and US equity REITs’ return volatility. There are indications that expansion in the global business cycle is a pointer to an increase in global economic activities. This expansion or improvement in global economic activity is expected to expand the investment options of a typical investor and thus afford them to diversify their investment away from climate-ridden assets such as REITs, thereby reducing the volatility/risk involved in investing in the market. This notion is probed with the interaction of the temperature dummy with the dummy of global economic activities, wherein recession is assigned zero, and one is for expansion (GECON) in our model. We equally take a step further in our analyses to see if technology-induced economic expansion can further reinforce the reduction in return volatility of REITs, while the role of climate change is relaxed. Finally, to see if our results can be generalized for the entire REITs market, we replicate these analyses for the US mortgage REITs.
5.1. Climate Change and US Equity REITs Nexus
Taking a cue from the above, we report the results (as contained in
Table 3) of the effect as well as the predictability of climate change, particularly temperature anomaly, on and for the return volatility of US equity REITs. Given the likely effect of climate-related risk on housing and estate via higher insurance due to an increase in a climate-related disasters such as a flood or fire outbreak, or a reduction in rental income due to land degradation, among others, this section highlights the possible impact of these risks for equity REITs of the US, given the sector’s climate-related experience in recent times in the country and globally (see [
43]). In essence, the estimated parameters in our GARCH-MIDAS framework, as indicated in the referenced table, include the unconditional mean for REITs’ returns (
), which also indicates the average return volatility of REITs in the face of climate change. Similarly,
and
are the ARCH and GARCH terms, respectively, with their sum explaining the degree of volatility persistence in the market; while ‘m’ is the long-run constant term, and ‘w’ explains the role of the weighting parameters in the model. Also, and more germane to the focus of this study (section) is the slope coefficient (
), which explains the effect and predictability of climate change on/for return volatility of US equity REITs.
Akin to the above, the results of the effects of climate change on the return volatility of US equity REITs, as depicted in
Table 3, show not only that climate change, captured by temperature anomaly, increases the volatility (risk) associated with the equity REIT market in the US, owing to the positive relationship (as shown by the slope coefficient—
), but that it also equally contains some salient information necessary for predicting future activity in the market. This latter conclusion is premised on the significance of our slope parameter. Interestingly, the magnitude of the risk portended by temperature anomaly becomes obvious when various degrees of temperature are considered. For instance, a higher temperature of 25 degrees Celsius increases the instability of equity REITs’ return (0.0305) more than it does at higher degrees. These results imply that trading in the REIT market reduces at a higher degree of temperature. In other words, higher risks, aggravated by climate change, in the equity REIT market, limit the trading potential in the market since investors are sometimes more concerned about market stability than the return itself. Our results buttress the existing findings in the literature that stock market volatility significantly responds to climate uncertainty [
44]; climate risk increases the persistence of volatility in the oil market [
45] and that temperature is a source of long-run economic risk [
46]. Our results thus indicate that the housing and estate industry is not exempted from the heat of the campaign against carbon emission and ozone layer depletion, owing fairly to the nature of technologies required in this industry, and the deforestation that usually accompanies the erection of a building, among others. Confirming these results is the presence of high volatility persistence indicated by the sum of the
and
coefficients, which is either close to unity (in the case of high temp and 75 degrees higher) or equal to unity (as in 25 and 50 degrees). This implies that the volatility or climate-induced risk in the equity REIT market is not likely to fizzle out soon, as it tends not to be short-lived. This is similar to the results of the study conducted on the Asian stock market. It is found that long-term stock return volatility of about 60% of the Asian stock market is affected by climate change [
47]. Investors in the equity REITs’ stock are then advised always to take caution while making their investment decisions. In other words, investors should always be wary of REIT assets that are more prone to climate-related risk while making their investment decisions to avert an avoidable loss.
5.2. The Role of Technology Shock in Climate Change and US Equity REITs Nexus
In furtherance to the above results, we examine the role of technology innovation in the climate change–equity REITs nexus. In essence, we interrogate our previous findings to see if climate-related technology advancement can reverse the cheering effect temperature anomaly and the effect that it has on the volatility of the US equity REITs’ return. Thus, we adopt the TS data by [
22] to proxy the role of technology in the nexus. To achieve this, we consider the global technology shock (GTS-164), which takes care of technology innovation across the countries of the world; the GTS-OECD, which represents the regional innovation in technology; as well as technology innovation that is peculiar to the US (TS-US). As with the previous results, we assess this technology’s role in the nexus along multiple degrees of temperature, namely, 25, 50, and 75 degrees. These results are contained in
Table 4. The results show that contrary to the results obtained for the climate change–equity REITs nexus, global technology innovation does reverse the incessant increase in the volatility (risk) associated with the equity REIT market across varying degrees of temperature. This result finds support in the work by [
48], whose finding stresses the significance of technological innovation in alleviating the restraining effect of coal-based energy structures on pollution emissions. Furthermore, this reversal is not only a mere reversal as the sum of alpha and beta across all the degrees considered are significantly close to one, an indication of a permanent reversal. Although the level of predictability, as indicated by the significant sign, cannot be generalized across all the temperature levels, it is indeed instructive to note that high temperature (Temp-GTS-164-STD—the full sample) itself, when augmented by climate technology, contains some predictive information for the equity REIT market. These results suggest that heavy investment in climate-related technology is not only desirable for a green environment but is also a panacea for reducing volatility in the REIT market and by extension, a precondition for investors to reap a high return on their investment in equity REITs. Thus, governments across all strata of the world need to intensify their efforts at formulating policies and support moves that encourage investment in eco-friendly technologies.
At the regional (GTS-OECD-STD) level, our results corroborate those that we observed on the global scene, barring when the temperature is 25 degrees higher. In other words, while it is evident that technology innovation (at the full sample—Temp-GTS-OECD-STD) reverses the impact of temperature anomaly on equity REITs’ volatility and its associated risk, it appears that the OECD countries delayed their intervention/investment in climate technology until higher temperature levels (50 and 75 degrees) when the reversing impact of technology began to be felt in the relationship between climate change and equity REITs. The foregoing submission is also the case in the United States, wherein the role of technology shock in the nexus between climate change and equity REITs starts to manifest at higher degrees of temperature (50 and 75 degrees).
5.3. Additional Analyses
For robustness, we replace the role of technology shock in the nexus between climate change and equity REITs with a positive economic shock (i.e., expansion in the global economic activity—GECON). It is our opinion that improvement in global (aggregate) economic activity would create more investment opportunities for investors to diversify their investment portfolio away from the class of assets that are prone to climate risk such as REITs. Given this, global economic expansion is expected to reduce the increase in volatility of the equity REIT market, as observed in the main analyses. Similarly, we examine if introducing technology innovation in the model that accounts for the role of GECON would enhance our results. Moreover, we replicate all these previous analyses for mortgage REITs’ volatility for probable generalization of our results.
5.3.1. The Role of Global Real Economic Expansion in Climate Change and US Equity REITs
True to our submission, our results, as shown in
Table 5, depict that expansion in the global economy provides a cover for investors to explore other classes of assets for an investment opportunity, thereby upturning the increased volatility effect that climate change has on equity REITs. We can come to this conclusion by relying on the sign on our slope coefficient. Repeating this for varying degrees of temperature anomaly gives us the same results. Other than showing the nature of the relationship that exists between climate change and equity REITs following economic expansion, the results also indicate that, to a large extent, the GECON-aided model equally contains some useful information necessary for predicting the future activity in the equity REIT market, given the statistical significance of our slope values. These results support [
49], who submit that positive shocks on economic activity reduce volatility in the stock market. Furthermore, like what is obtainable when TS is introduced, we equally find evidence of persistence in our results, given the sum of alpha and beta across all the temperature degrees are considered equal, close, or equal to unity. This finding is an attestation to the robustness of our results. In other words, having similar results when we vary our sources of shocks shows that our results are robust to alternative measures of shocks and that investors in the REIT market need not be panicked in the event of the depressing effect of climate change on their REIT-related assets, as expansion in the global economy would provide a necessary cover for them in other class of assets. All they need to be conscious of is diversifying their investment portfolios across an array of assets.
5.3.2. GECON, TS, and Return Volatility of US Equity REITs
Further augmenting the GECON model with technology innovation while we systematically isolate the impact of climate change reinforces the impact of GECON on the return volatility of REITs. In essence, in
Table 6, the presence of technology innovation at a global scale (GECON-EXP-GTS-164-STD) enhances the role of GECON across varying levels of expansion, then without TS and when climate change features in the model (as in
Table 5). We equally observe in our results that the significant effect of TS in the GECON diminishes as the economy becomes more compact. This is because the significance of TS at the global level (GECON-EXP-GTS-164-STD) is more pronounced than at the regional level (GECON-EXP-GTS-OECD-STD), and its significance in the latter is far above the country-specific (GECON-EXP-US-TS-STD) level (see
Table 6). This could suggest that at a lower economic level (such as a country, i.e., the US in this case), technology-induced expansion is not enough for the reduction in volatility experienced in the US equity market. In other words, ensuring technology-induced expansion is a global effort, and global policymakers must ensure that all countries comply with this commitment, especially as it could be anti-emission.
5.4. Replicating the Analyses for Mortgage REITs
For the probable generalization of our results beyond the equity market, we offer similar analyses as previously performed, for the US mortgage REITs’ return volatility. As a form of reminder, we first examine the effect as well as predictability of climate change for US mortgage REITs’ return volatility. Following this, we assess the role of TS in the nexus by using the TS data of [
22]. Furthermore, we replace the TS with GECON for robustness, and finally, we interrogate both TS and GECON data to see their combined impact on the volatility.
5.4.1. Climate Change and US Mortgage REITs Nexus
The effects of climate change on return volatility of the US mortgage REITs (as shown in
Table 7) are similar to those reported in
Table 3 in that they reveal that climate change, as measured by temperature anomaly, not only heightens the volatility (or risk) associated with US mortgage REITs due to the positive relationship (as indicated by the slope coefficient) (see also [
45,
46,
47]), but that it also contains some important information necessary for predicting future mortgage REITs’ outcomes. This latter conclusion is supported by the significance of our slope coefficient, particularly when the RV-based model is taken into account, and the temperature is 25 degrees higher. The occurrence of strong volatility persistence, as indicated by the sum of the alpha and beta coefficients, which is close to unity, supports these findings. Thus, it is safe to state that the impact of climate change on US REITs’ volatility goes beyond the equity REITs, as we can establish the same for the mortgages.
5.4.2. The Role of Technology Shock in Climate Change and US Mortgage REITs Nexus
As we previously performed with equity REITs, we also examined the role of technology shock in the climate change–mortgage REITs nexus. This was equally undertaken across various proxies of TS as well as various degrees of higher temperature. Essentially, our results, as in
Table 8, show that contrary to the results obtained for the climate change–mortgage REITs nexus (see
Table 7), technology innovation does reverse the incessant increase in the volatility (risk) associated with the mortgage REIT market across varying degrees of temperature (see also [
48]). Predictability-wise, the global technology shock predicts the climate-induced volatility of mortgage REITs more than regional (OECD) technology innovation does, even though the same conclusion cannot be made for US-specific technology shock. Consequently, the significance of technology shock in the climate change–mortgage REITs nexus declines as the economy becomes more closed. Additionally, beaming the searchlight of our analyses on whether the role of technology in the nexus is transient or permanent, our results show that the degree of persistence is mixed for different TS proxies and across different degrees of temperature. While the persistence seems to be permanent for the global TS (GTS-164-STD) at both a high degree of temperature and when the temperature is 50 degrees higher, the foregoing also holds for OECD but includes when the temperature is 75 degrees higher. At the US level, the impact only appears to be permanent when the temperature is 50 and 75 degrees higher.
5.4.3. The Role of Global Real Economic Expansion in Climate Change and US Mortgage REITs
As previously justified, we replace the role of TS in the nexus between climate change and mortgage REITs with GECON to see if the same results reported for equity REITs can also be offered for a mortgage. Our results show that the GECON offers a plural role in the nexus (see
Table 9). Put differently, global economic expansion, in some cases, reduces the volatility (see [
49]) in the mortgage REITs’ return, while, in some other cases, it heightens it. This could be attributed to the nature of the expansion in question. If the expansion is coming from the sector that generates high emissions, then the latter result is plausible. Whatever the case, this impact across all degrees of temperature considered cannot persist over a long period given the low persistence indicated by the sum of the alpha and beta, which is less than unity. Here, investors have to be more careful while basing their decision to invest in REITs on economic expansion, as GECON does not impact/predict equity and mortgage REITs the same way. However, the difference in our results is not discernible.
Finally, we interrogate both the TS and GECON data in
Table 10 to see their combined impact on the return volatility of US mortgage REITs. Our results show that isolating the impact of climate change for the interaction between TS and GECON reduces the volatility in the mortgage REITs as against the impact of climate change in the market. This is similar to the results obtained for equity REITs, except that the results for the country-specific mortgage REITs are upturned. Put succinctly, the presence of technology innovation across economic classifications (global, regional, and country-level) enhances the impact of GECON on mortgage REITs’ return volatility across varying levels of expansion, then without TS, and when climate change is observed in the model. It is imperative to state that this impact is apparent for a long period, as indicated by the degree of persistence, which is close to unity across different expansion periods. It is imperative to state that our results here are similar to those that we reported for equity REITs. Thus, the joint role of technology innovation and GECON in stemming the risk associated with the REIT market cannot be overemphasized. Hence, more investment in technology across countries is encouraged to facilitate technology-induced expansion.
6. Conclusions and Implications
In recent times, climate change has become a strong threat to investing in REITs. While a huge amount of money is being invested in the sector, possible returns therefrom cannot be easily predicted given the current climatic condition. Our emphasis is thus to examine the connection between climate change and the return volatility of US equity REITs, using the GARCH-MIDAS approach, and verify the role of technological innovation in suppressing the negative impact arising from climate change in the REITs–climate change nexus. The GARCH-MIDAS approach for this examination is attractive owing to its flexibility in accommodating data that are originally available in different frequencies, as in the case of this study. Before the development of this technique, the aggregation of data to a uniform frequency through splicing was what researchers were compelled to do, and this process usually led to the loss of some salient information. However, GARCH-MIDAS circumvents this by accommodating data in different frequencies into the same model. For our analyses, temperature anomaly—the deviation of average/expected temperature from actual—which we later partitioned into different temperature degrees, is used as a proxy for climate change. Following this, the possible role of technology shock in the nexus is examined. The intuition behind this is to see if technology innovation can reverse the possible turbulent impact of climate change on the equity REIT market. Furthermore, we replace the role of TS with global economic expansion if the same results for TS are upheld. It is believed that an increase in global (aggregate) economic activity would provide investors with more opportunities to diversify their portfolios away from assets such as REITs that are susceptible to climate risk, thus reducing the rising volatility in the equity REIT market. As additional analyses, we examine if introducing technology innovation in the model that accounts for the role of GECON, while climate change impact is completely suppressed, would enhance our results. All these previous analyses are equally replicated for mortgage REITs for plausible generalization of our results.
Our findings show that climate change increases the risk (volatility) associated with US equity REITs, just as it also offers some predictive content for the return volatility of the asset. While the sign of the slope coefficient guides the former conclusion, the latter is premised on the significance of the slope. When our results are compared along varying degrees of temperature, we find that higher risks caused by climate change in the equity REITs market limit the trading potential in the market. However, when technology shock is introduced into the model, the turbulent impact of climate change on equity REITs is completely reversed. This is also the case when TS is substituted for GECON in our model. This confirms our hypothesis that expansion in global economic activity would provide investors with more opportunities to diversify their portfolios away from assets (e.g., REITs) that are vulnerable to climate risk, thus reducing the escalating volatility in the equity REIT market. Thus, our results are robust to different measures of economic shock. Also, when we augment TS with GECON while suppressing climate change in our model, we find that both TS and GECON reduce the risk associated with the equity REIT market across different levels of economic expansion and economic classifications safe country level—US—where the reduction occurs at higher expansion level.
Finally, replicating our analyses for mortgage REITs, we show that climate change has a similar impact on the return volatility of US mortgage REITs, albeit the predictability results only hold when the temperature is 25 degrees higher. When we invoke the role of TS, our results are equally similar to those that are obtainable under equity REITs, as the TS also represses the cheering effect of climate change on return volatility of mortgage REITs across all economic classifications, namely, global, regional, and US. In the same vein, when TS is replaced with GECON, as was performed with equity REITs, the influence of GECON in the relationship between climate change and US mortgage REITs remains, except at certain higher degrees of temperature, such as 25 and 50 degrees. Above all, and to a large extent, our conclusion is also robust to alternative REIT markets/assets.
As a form of policy implication arising from our evaluation, investors should always pay attention to issues around climate change as well as the level of investment in technology that has happened in the REIT market while making their decisions. While sudden climate change could stand as a threat to investing in REITS, technological innovation can be easily used to mitigate the harmful effects of climate change in this nexus. Similarly, the outcome from this finding suggests that investors should be wary of the drivers of economic expansion while forming their decisions, as technology-induced expansion is found to reduce the risk associated with REIT markets. Not just that, the level of economic activities in the country could further explain the extent to which investing in REITs will be beneficial. We suggest future experiment probes into other markets that are equally susceptible to climate change to enhance the generality of our results.


