Article

Appraisal of Provision Structures of Nursing Homes for Old Persons—Illustrated by Cross-Sectional Data for East Tyrol

1
Institute of Spatial Planning, Environmental Planning and Land Rearrangement, University of Natural Resources and Life Sciences Vienna, Peter-Jordan-Straße 82, 1190 Vienna, Austria
2
Institute of Statistics, University of Natural Resources and Life Sciences Vienna, Peter-Jordan-Straße 82, 1190 Vienna, Austria
3
Research Group Cartography, Department for Geodesy and Geoinformation, Vienna University of Technology, Erzherzog-Johann-Platz 1/120-6, 1040 Vienna, Austria
*
Author to whom correspondence should be addressed.
Sustainability 2023, 15(19), 14535; https://doi.org/10.3390/su151914535
Submission received: 1 June 2023 / Revised: 29 September 2023 / Accepted: 29 September 2023 / Published: 6 October 2023

Abstract

:
(1) Background: In Austria, stationary long-term care facilities for old persons in need of care are increasingly at the centre of the discussion on sustainable long-term care for old persons. So far, there is a lack of research addressing problems of fit from a spatial planning perspective. This case study on East Tyrol aims to appraise provision structures of stationary long-term care for old persons focusing on nursing homes (LTC) with regard to any intra-regional disparities. (2) Methods: Catchments and Bradshaw’s taxonomy of social needs serve as the conceptual framework. Real-world data on residents and applicants up to a certain cut-off date in 2022 for four nursing homes are statistically analysed at different spatial reference levels. The GIS mapping of catchments focuses on the intra-regional level. The findings are discussed transdisciplinarily. (3) Results: Intra-regional disparities with regard to the level of provision are evident. There are: 1) LTC-specific differences related to catchments with regard to LTC residents and applicants and travel efforts for visitors; and 2) valley-related differences with regard to nursing home choice. Normatively determined catchments broadly match the actual catchments. (4) Conclusions: This study could serve as a starting point for discussing methodological limitations of waiting lists as a parameter for unmet demand. Shortcomings of provision in relation to (future) demand as well as the significance of longitudinal studies for assessing the stability of catchments and area-wide coverage become apparent.

1. Introduction

Long-term care for old persons has become a focal point in the international debate about how to cope with the consequences of demographic ageing [1]. This is mainly due to the growing proportion of people at old age—“being either 60 years, 65 years or the official national retirement age” [2] (p. 9)—in relation to the total population, limited care and nursing personnel resources [2] and the increasing awareness of the importance of health protection and health promotion of caregiving relatives. Even though the approaches and measures taken by countries to respond to changing needs vary, a common observation is that older people living in rural areas are disadvantaged compared to those living in urban areas [3].
In the context of demographic change, stationary long-term care facilities for old persons in need of care are a valuable infrastructure whenever domestic care is not possible or cannot be adequately provided. At the same time, it should not be neglected that moving to a nursing home is or can be a drastic step for the persons concerned [4,5]. Therefore, the rationale and motivations for moving to a nursing home [6,7], the choice of a certain facility [8] and facility-related factors influencing the residents’ perceptions of the quality [9] have emerged as central topics of empirical research in the medical and social sciences as well as in humanities.
The quality-of-life definition of the WHO [10], the WHO’s health-in-all-policies approach [11] and the key role of spatial planning for sustainable development assigned by the UN [12] are three good reasons to engage with long-term care provision from a spatial (planning) perspective.

2. Epistemological Interest and Purpose of the Paper

In the Austrian context, spatial planning researchers’ interest in achieving or maintaining an area-wide and demand-oriented provision of retirement and nursing homes is derived from (1) the age structure of the population, (2) the guiding principles in spatial planning and (3) the legal framework for demand and location planning.

2.1. People at Old Age in Austria

In Austria, people at old age have already become a key target group of health and social policy [13]. As of 1 January 2023, there were about 1.8 million people aged 65 and older [14], and in 2021, about 44% of the elderly lived in rural municipalities [15].
Since 2021, there have been more people aged 65 and older compared to people aged under 20. Demographic forecasts assume that the share of older people in Austria will grow by 48%, i.e., by about 800,000, by 2040 [16]. As a result of the expected significant increase in the very old, “a correspondingly stronger demand for care services is also to be expected. According to WIFO, expenditure on nursing and care services will increase by 77 percent by 2030” [17] (p. 46). In the context of demographic ageing, dementia will increasingly influence the clinical picture of the old(est) population. According to estimations, in 2021, about 130,000 persons suffered from dementia [18].
In 2021, about 380,000 persons aged 61-plus received federal long-term care allowances [19] and, therefore, were statistically classified as persons in need of care and nursing [20]. The share of women was higher than that of men at all care levels. This difference was most distinct in the two highest care levels [19]. In 2022, about 69,000 persons resided in stationary long-term care facilities (retirement homes, nursing homes) [21].
In 2020, the Task Force on Long-Term Care was set up by the Austrian Federal Government in order to develop the program’s content [22]. The political slogan is “domestic and ambulant care ahead of stationary care”. In this policy framework, promoting the health of caregiving relatives is of particular importance.

2.2. Guiding Principles of Spatial Planning in German-Speaking Countries

Guiding principles in spatial planning are based on the evaluation of real spatial conditions in the mirror of the respective time spirit and define the cornerstones of desirable future spatial conditions, without claiming to create definitive spatial structures [23]. These principles are rooted in societal values as well as in the wants and needs to change them. With regard to the provision of the population with infrastructure, in the German-speaking countries, there is an orientation towards equivalent living conditions, that is, an area-wide provision for the population by granting accessibility to infrastructure in terms of reachability, without striving for an equal level of infrastructure provision at the local level [24]. In this context, in Austria, importance is given to city regions and the regional level of action [25], because Austria is a small-structured country with a small area of about 84,000 km2 [26], consisting of nine federal provinces (in German Bundeslaender) and a population of about 9.1 million (as of 1 January 2023) [14].
The Austrian spatial planning policy approach for achieving and maintaining area-wide provision of long-term care facilities for old persons is based on the following principle: stationary long-term care facilities are considered central commodities and services of medium to large catchments and are, therefore, to be concentrated in cities, town or municipalities of a corresponding centrality [27]. In all other municipalities, (long-term) care for old persons should be maintained via the provision of ambulant care and nursing services [27].
The concept referred to when considering the realisation of equivalent living conditions at the regional level is that of central places developed by Walter Christaller [28]. It constitutes an area-wide, closed hierarchical and complementary system [29], which consists of cities or towns of different degrees of centrality. The centrality of a city or town depends on the number and type of central commodities and services offered there, whereby commodities with a narrow catchment constitute a dense network of locations with a small market area, whereas commodities with a large catchment constitute a wide-meshed network of locations with a large market area. The system of central places is depicted as a hexagonal system [30]. Due to the surplus of commodities and services, the city or town takes the role of a provision hub both for the population of the city or town itself as well as for the population of the (city or town) region [31].
In this sense, it is important to understand that functional regions are spatial entities consisting of municipalities with different attributes and that are interrelated with each other. These relationships must be “significant” in quantitative terms, i.e., in ways made measurable [32]. By considering relevant predefined framework conditions such as accessibility of infrastructure with reasonable (time) efforts as well as the spatial information required and available for this purpose (e.g., the topology), a calculation model can be refined that supports differentiated conclusions on infrastructural problems of fit in terms of over- and undersupply or area-wide coverage [32]. Whether and to what extent central places or urban centres actually contribute to the area-wide provision of the population in the region with particular commodities and services must be empirically verified by analysing the demand structures.
Based on the developments and the changing framework conditions outlined in Section 1, and the epistemological interest in spatial planning research that can be derived from the literature, the purpose of this paper is defined as follows. This article describes and appraises the current (cross-sectional) provision of facilities for stationary long-term care for old persons from a spatial planning perspective and presents findings with regard to the degree of area-wide provision by means of a selected Austrian case study region. Those objectives are achieved by answering the following research questions referring to nursing homes (LTC):
Research question 1: What does the spatial supply structure of nursing homes currently look like, are there any over- or undercapacities with regard to beds and how did the current provision structure evolve?
Research question 2: How do supply and demand match at different intra-regional spatial reference levels and what about the area-wide equity in access to nursing homes with regard to the preferences of those in need of the provision?
Research question 3: What can be inferred from the current situation about the future status of nursing homes in long-term care for old persons?
A discussion the principles of social infrastructure planning as well as the statistical models behind them are not the object of this paper.

2.3. Austrian Legal Framework for Demand and Location Planning of Long-Term Care Infrastructures

The spatial planning laws of the federal provinces (in German, Raumordnungs- oder Raumplanungsgesetze der Bundeslaender) stipulate the obligation of the federal provinces to “take care of … the social, health and cultural needs of the population and the free development of the personality in the community on the basis of the given structural conditions” (see § 1 StROG) [33]. The key figures for infrastructure provision as well as the minimum quality standards of social infrastructures for old persons in need of care, on the other hand, are regulated in other federal and provincial laws:
The Federal Long-Term Care Allowance Act (in German, Bundespflegegeldgesetz) defines eligibility for long-term care allowance and the amount of the monthly allowance (§ 1 BPGG) [34].
The Care Fund Act (in German, Pflegefondsgesetz), also a federal law, stipulates that the federal government supports the federal provinces and municipalities—in Austria, “care” is a competence of the provinces—in securing and improving needs-based care for people in need of care and their relatives with needs-oriented and affordable care and services (§ 1 and 2 PFG) [35].
The Agreement between the Federal Government and the federal provinces according to Art. 15a B-VG on joint measures of the Federal Government and the federal provinces for persons in need of care, including annexes (in German, Vereinbarung 15a B-VG über gemeinsame Maßnahmen des Bundes und der Laender fuer pflegebeduerftige Personen) [36], in turn, regulates the obligation of the federal provinces with regard to existing structures to provide social services (incl. stationary long-term care facilities) in a decentralised and area-wide manner. The quality criteria for new facilities and additions are defined in Annex A. They refer to services that go beyond care and nursing, the provision of medical care and the optimal integration of the facility in the respective location municipality. Annex B describes the minimum components of the so-called demand and development plans (in German, Bedarfs- und Entwicklungsplaene), which serve as the basis for social (infrastructure) planning and the care of older people in the Bundeslaender and include relevant key figures. Consequently, the federal provinces have to conduct structural analyses in order to calculate (future) needs, which, in turn, form the basis for key figure setting. Demographic dynamics, the development of the number of persons in need of care, household structures and housing conditions and other (relevant) societal developments must be considered. The federal provinces, in turn, guarantee on the basis of their (nursing) home laws, the protection of the rights and interests of the residents and those who want to be admitted in the foreseeable future in order to preserve human dignity and to ensure a decent life (see, for instance, Tyrolean Home and Care Services Act (in German, Tiroler Heim- und Pflegeleistungsgesetz)) [37].
Furthermore, with respect to area-wide equity in terms of access, the federal provinces can determine LTC-related catchment areas by defining relating planning unit areas.

3. Conceptual Framework and Related Research

When it comes up to methodological issues concerning spatial analysis of supply structures of (stationary) long-term care for old persons, there is one concept that often comes into play: the concept of catchments. Catchments can be defined as spatial ranges of infrastructures, which, in turn, are the result of a combination of normative specifications (supply parameters, e.g., beds for inhabitants of a certain age group) and demand characteristics (e.g., preferences of the those in need of the provision). The criterion of accessibility by (potential) those in need of the provision [38] is considered particularly important, as it is defined by geographical and socio-organisational aspects [39,40]. The first includes, among other parameters, the accessibility of facilities by public transport or car as well as the time effort; the second includes the predefined general criteria for the utilisation of facilities, such as admission criteria like, for example, a minimum or a maximum care level.
Recent international research on the analysis and geovisualisation of supply and demand structures based on the catchment concept addresses the following topics:
  • The explanation of the evolution of spatial supply structures and the allocation of facilities (see, for instance, ref. [41] for Chile);
  • The assessments of (current) spatial patterns of provision at different spatial reference levels, considering the socio-economic profile and needs of the population—for the city context (city, neighbourhoods), see, for instance, ref. [42] for Tokyo; and for national and regional contexts, ref. [41] for Chile and [43] for the Czech Republic. An overview of the potential of GIS-based approaches recently was provided by Higgs et al. [44], illustrated by the example of Wales;
  • The determination of the size of catchments as well as the assessment of accessibility of LTC considering equity with regard to access ([44] for Wales) and transport ([45] for the Czech Republic).
Due to the lack of and variable availability of reliable real-world data, different statistical and GIS-based models are being applied [44,46]. For the determination of optimal locations for LTC, for example, the so-called TOPSIS model is used as a multi-criteria decision analysis method [47], which calculates the preferences for a particular facility by means of the shortest distance in Euclidian space between the location of the facility and the (former) place of residence of the (potential) person in need of provision. A standard method for assessing equity of access to facilities is the so-called two-step floating catchment area method [44], a gravity model based on the distance-decay approach, i.e., the decreasing importance/attractiveness of a facility with increasing distance from the (previous) place of residence of the (potential) applicant). Since GIS modelling of missing empirical data faces methodological limitations, Donald [40], for example, points out the need for empirical evidence—so-called real-world data [40] for validation.
Following the container logic of Christaller’s Central Place Theory, an area-wide provision is achieved when demand can be met within a defined spatial entity (be it a province, a political district or a planning region) and there is no need to make use of facilities outside the defined spatial entity. Additionally, equity with regard to access is achieved when every potential applicant receives a place/bed in the facility closest to his or her (previous) place of residence.
Relating to the assessment of catchments, demand characteristics are of particular importance. Thus, catchments can be understood as geovisualised assessments of the fit of normatively determined locations and capacities, on the one hand, and articulated needs of those in (potential) need of provision, on the other hand. To clarify the latter, Bradshaw’s taxonomy of social needs [48], developed in the 1970s, has received significant attention internationally in public health [49,50]. Bradshaw [51] distinguishes four types of needs:
  • Normative need (p. 2) is defined by experts, administrators or scientists, e.g., the number beds in a nursing home per persons of a defined age group;
  • Felt need (p. 3) is defined as the needs identified by individuals themselves; felt need can be regarded as a prerequisite for identifying oneself as a potential user of a particular commodity or infrastructure;
  • Expressed need (p. 3) or “felt need turned into action” becomes visible in a concrete demand, which can either already be met or not (yet) met. Nonetheless, waiting lists are “generally accepted as a poor definition of ‘real need’”;
  • Comparative need (p. 3f) is used for a comparative depiction of the satisfaction of felt needs of “people with similar characteristics” (p. 3). An example for this is the share of persons who have already been admitted to a nursing home compared to persons of the same care level and the same (urgent) need for stationary long-term care, but who have not (yet) been admitted. Another example could be the comparison of persons whose wish for accommodation close to their (former) place of residence is fulfilled and those whose wish in this regard could not be fulfilled.
In 2013, public health experts in Germany noted the lack of regionally differentiated analyses of provision structures and their adequacy [52]. Moreover, they emphasized that (1) there is a difference between demand- and need-orientation and (2) “social and spatial factors in planning rarely receive the attention they deserve” [52] (p. 325).
The methodological idea for this paper is to combine the catchment concept following Christaller with Bradshaw’s Taxonomy of Social Needs in the sense of coupling allocation and needs. For Austria, this is relevant because (1) the number of publicly financially subsidised beds in stationary long-term care facilities is normatively determined by the federal states, and (2) with regards to nursing homes, access criteria are specific (e.g., a certain level of care or the duration of residence in the federal state). Therefore, it can be presumed that both aspects (at least theoretically) have an influence on the spatial configuration of catchments.

4. Materials and Methods

This analysis refers to stationary facilities, which are designed for the permanent accommodation of old persons in need of care, who—due to their care level and the given domestic environment—are not (or no longer) able to live autonomously or assisted in their homes [53]. The focus is on facilities that offer round-the-clock nursing, but do not offer particularly specialised medical care for people with specific illnesses or chronic diseases. This article focusses on nursing homes (in German, Pflegeheime), abbreviated LTC, in the following.
A case study design based exclusively on real-world data was chosen. The methodology was as follows: First, the criteria for the selection of the particular case study region were defined and access to the data was organised. Then, the data were statistically analysed and geovisualised, whereby
  • The spatial analysis focused on the regional level, considering any intra-regional disparities. The aspect of (pedestrian) accessibility of LTC within the location municipalities was, therefore, not the subject of the analysis;
  • The spatial range of LTC served to operationalise the catchments and the catchments were defined on the basis of the (former) municipality of main residence of the LTC residents or LTC applicants;
  • Waiting lists were used to operationalise the “expressed needs” according to Bradshaw. The capacities of LTC and the (unsatisfied) need was collectively considered as an expression of an insufficient fit of supply and demand, on the one hand, and the identification of over- and undersupply, on the other;
  • Isochrones by car served to operationalize the travel efforts for (future) visitors who still lived in the same (former) municipality as the residents or applicants—this primarily applied to spouses and life partners;
  • The focus was exclusively on stationary long-term care. Therefore, transient, day care and short-term care were not addressed.
Thereafter, the results were discussed transdisciplinarily and presented on the spatial reference levels of interest.

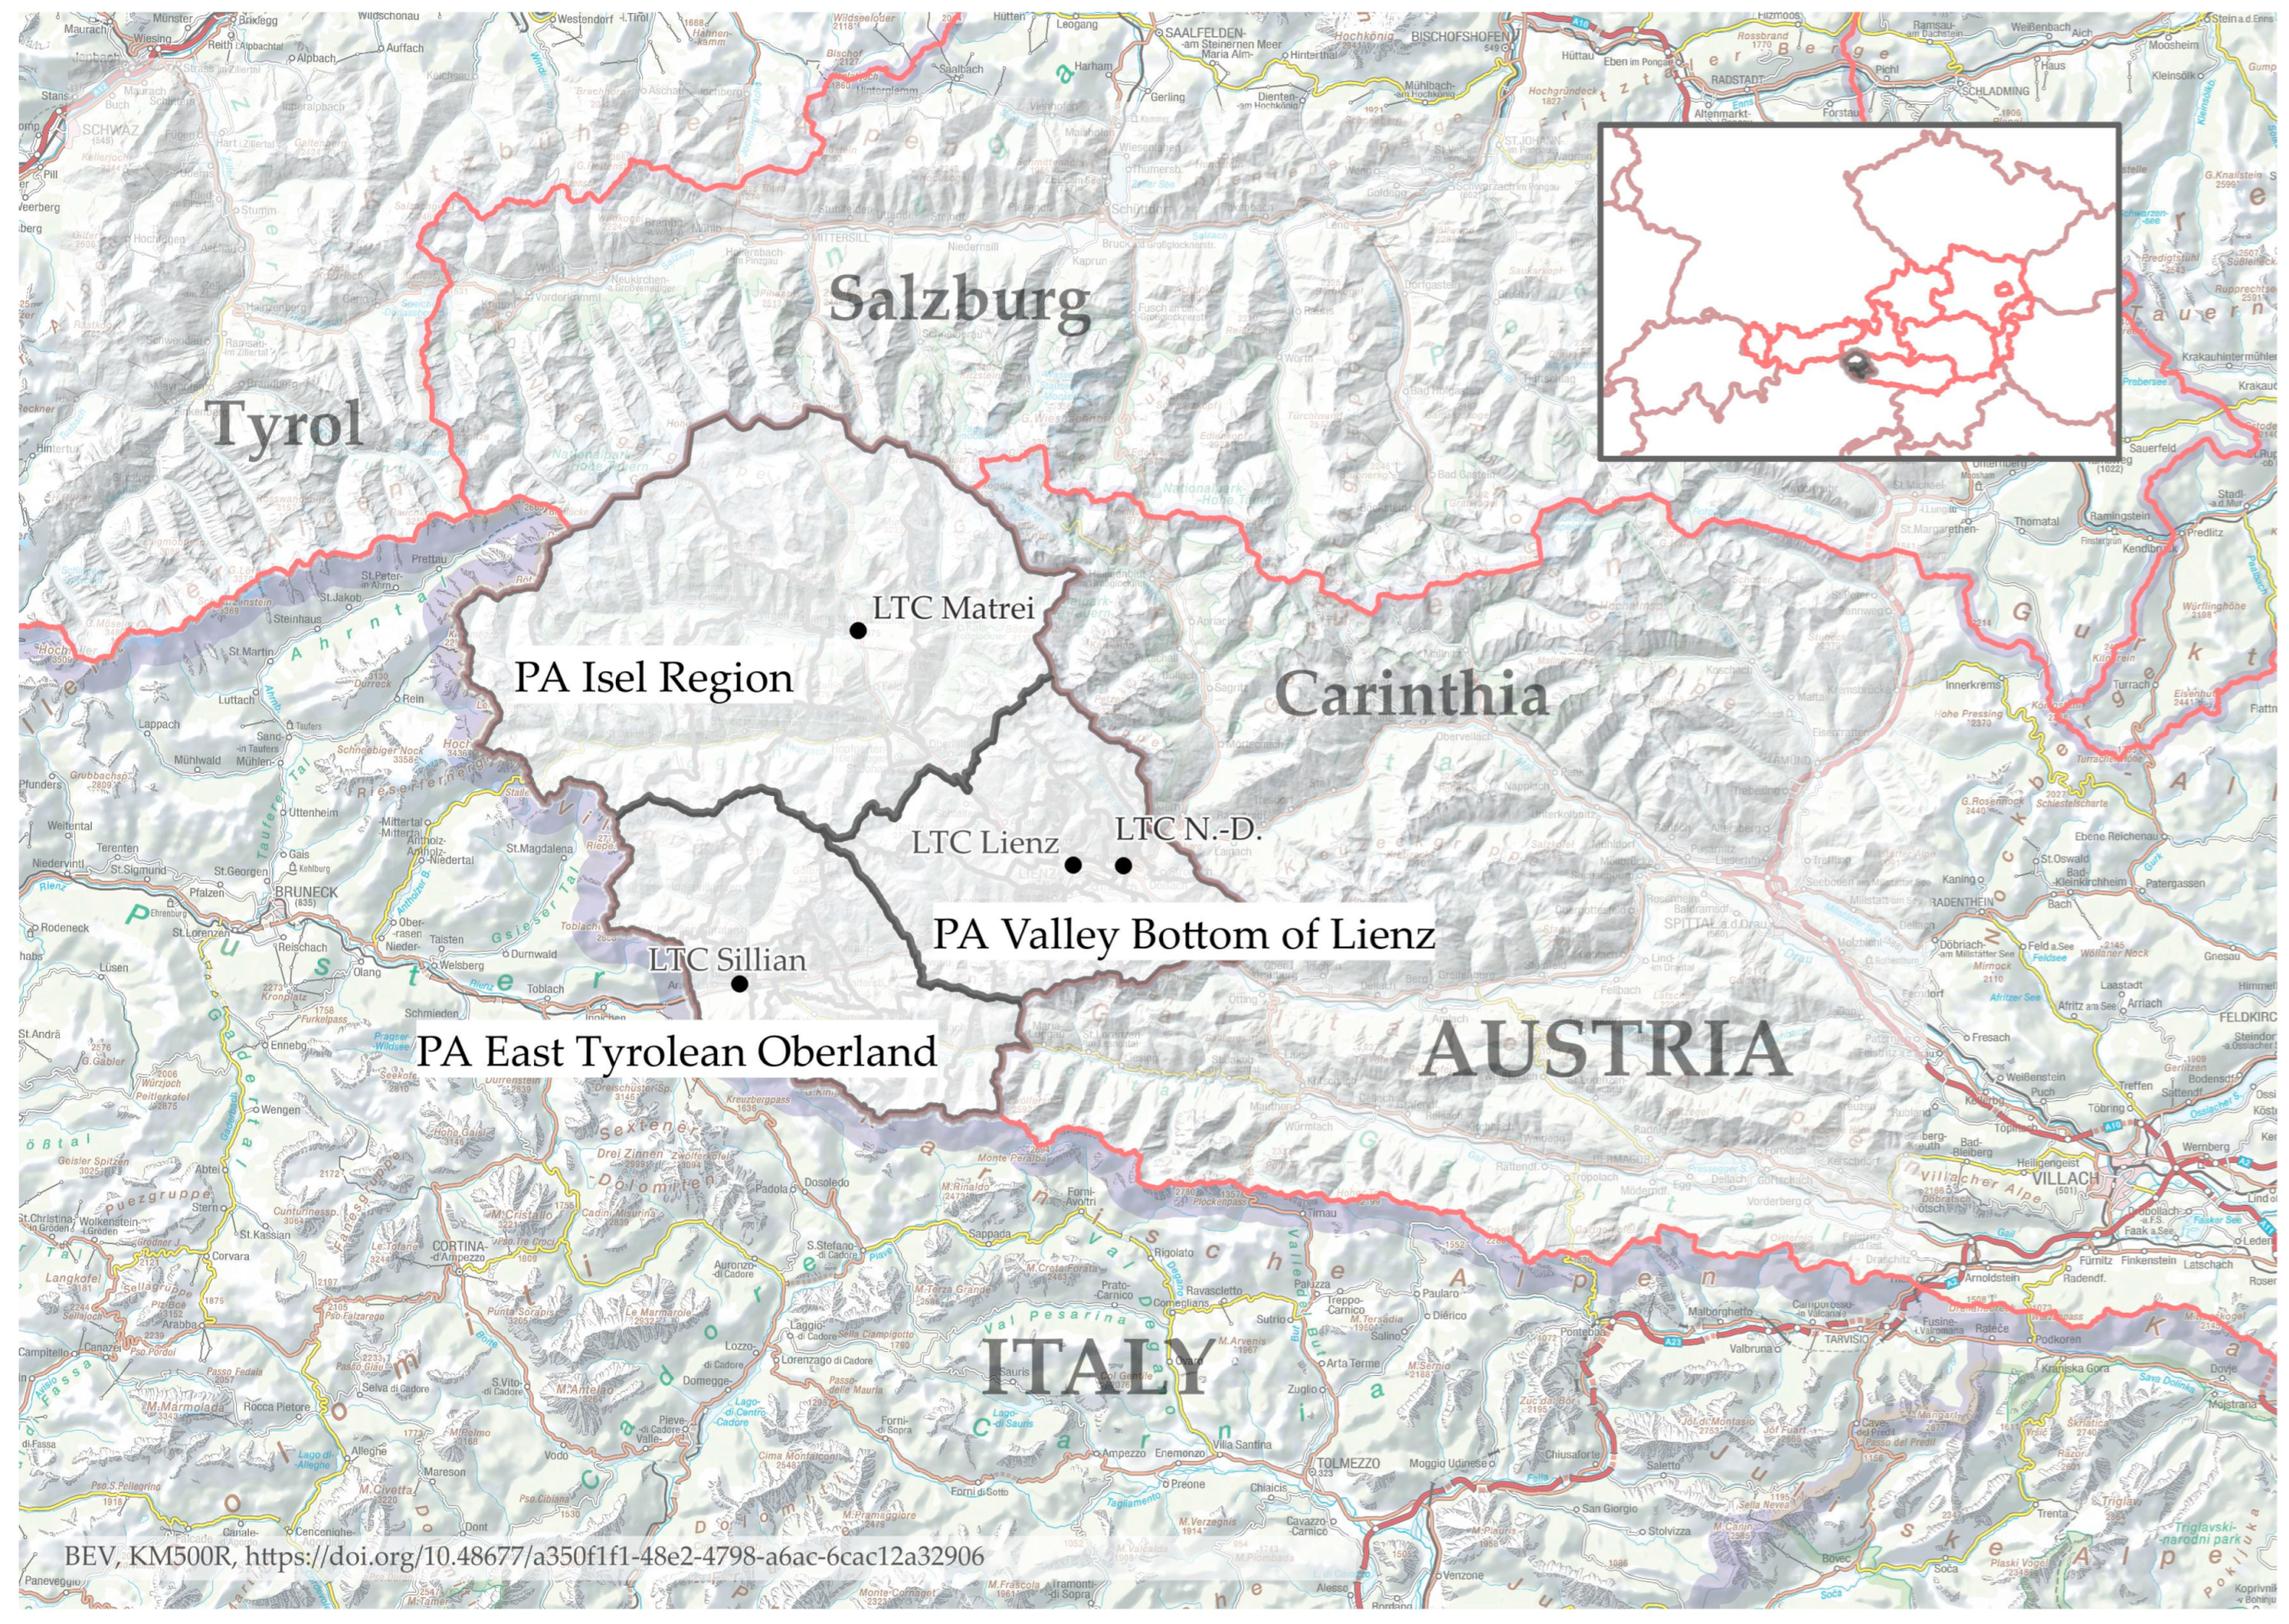
4.1. Rationale for the Choice of a Particular Case Study Region

Rationale 1: East Tyrol is part of the federal province of Tyrol and consists of a single political district, Lienz, which has no internal border with North Tyrol and shares an international border with Italy to the south. To the east, East Tyrol neighbours the federal province of Carinthia, and to the north, the Hohe Tauern mountain range marks the border to the federal province of Salzburg (cf. Figure 1). East Tyrol covers an area of about 2000 km2 and, as of 2022, had a population of about 49,000 [14]. The political district Lienz consists of three planning associations with their eponymous planning unit areas (PAs): planning association no. 34 Isel Region (in German, Planungsverband Nr. 34 Iseltal) (PA Isel Region), planning association no. 35 East Tyrolean Oberland (in German, Planungsverband Nr. 35 Osttiroler Oberland) (PA East Tyrolean Oberland) and planning association no. 36 Valley Bottom of Lienz (in German, Planungsverband Nr. 36 Lienzer Talboden) (PA Valley Bottom of Lienz) [54]. Due to the inner-alpine nature of the political district of Lienz, the normative definition of the planning associations and subsequently the spatial classification of the planning unit areas is oriented towards valleys (cf. Figure 2). These planning associations, which have been normatively defined by the Tyrolean Provincial Government, are responsible for regional planning.
Rationale 2: East Tyrol is one of those regions in Austria particularly affected by demographic ageing and thus receives particular attention with regard to the development of spatial strategies for coping with population decline [56]. In 2022, the share of persons aged 75+ in the total population was about 11% [14] (cf. Table 1).
Rationale 3: There are four LTC, namely LTC Lienz, LTC Nußdorf-Debant, LTC Matrei and LTC Sillian, that are all operated by the same public provider, namely the Gemeindeverband Bezirksaltenheime Lienz [57]. The LTC are organised as so-called municipal association LTC. Since the municipal associations are congruent with the planning associations, the respective catchments of the LTC comprise those persons who have their main residence in one of the municipalities of the respective planning association. However, the LTC are open to persons from outside East Tyrol, as well. In this case, an extra charge is levied [57].
Rationale 4: In terms of spatial planning, the federal province of Tyrol explicitly orients towards the guiding principles of the Central Place Theory. For that reason, a catalogue of criteria for defining the centrality of Tyrolean municipalities—including LTC—was elaborated [58].
All four LTC are located in towns or municipalities that have a certain centrality (cf. Figure 2). LTC Sillian, LTC Matrei and LTC Nußdorf-Debant are located in central places of low level, whereas LTC Lienz is located in the political district capital Lienz, ranked as a central place of intermediate level [59].
Rationale 5: The planning period relating to the strategic development of social infrastructures and the determination of key figures for provision, in 2012–2022, has now ended, and the next one is being prepared by the office of the provincial government of Tyrol. This seemed to present a good opportunity to invite experts from social planning as well as the nursing home provider to engage in a transdisciplinary discussion on the topic of area-wide provision of LTC.

4.2. Science–Practice Collaboration, Data Processing and Data Analysis

The discussion of the results generated by means of GIS-based modelling of missing real-world data is mainly held from a modelling–technical point of view. For that reason, Higgs et al. [44] propose that a discussion of the results with experts is necessary to validate any findings.
This suggestion was considered in the research design of this study, and the following two experts were involved in the study:
  • Expert 1: the operative manager of the East Tyrolean LTC with more than 20 years of experience as a representative of the LTC provider.
  • Expert 2: the (former) expert (up to his retirement in 2022) in charge of social planning in the Department of Social Affairs of the Office of the Tyrolean Provincial Government; he is co-author of the Structural Plan for Care 2012–2022 (in German, Strukturplan Pflege 2012–2022) [60] and the corresponding evaluation report [61].
In summer 2022, an initial enquiry was sent to Expert 1 to sound out his interest in a transdisciplinary discussion of the current LTC provision structures. In the course of a telephone conversation in July 2022, the goal of the planned self-research and the concerns of the care home provider were outlined. Furthermore, the expert was informed about the intended dissemination of the research results. Shortly afterwards, the raw data on residents as well as applicants for the four nursing homes were provided.

4.2.1. Real-World Data

The data ran up to a cut-off date of 1 July 2022. According to Expert 1, this cut-off date is supposed to sufficiently represent the annual average. The following data (PDF format) were provided by email, including comments on capacity utilisation:
  • The number of residents of the four LTC and a list of urgent applications for admission to a home (waiting list) (=applicants). The following information was available for each LTC: number of residents, cost share of residents, in day care or stationary care, care level; municipality of (previous) main residence (“origin”) of residents and applicants by PAs and by valleys.
  • Information on the demographic profile of the residents and applicants overall: sex, age (5-year classes), marital status and religion.
  • According to the home provider, the mid-year data are considered to be representative of the annual average. This applies both to the residents and the applicants.
The raw data were compiled in Excel in order to make them useable for statistical analysis and geovisualisation.
Expert 1 expressed an explicit interest in a valley-related analysis of the data. This was motivated by the fact that (1) valleys transect the administratively defined borders of the planning associations, (2) detailed analyses considering valleys are lacking and (3) it is presumed that admission to LTC close to the (previous) place of main residence contributes to subjective well-being of (future) LTC residents [57].
A written agreement on the use of the data was signed by Expert 1 and the representative of the corresponding author’s institution. Furthermore, the authors of this article agreed to keep the data confidential and not to pass them on to third parties. Expert 1 agreed on being available for further discussions as well as on the interpretation of the findings, and suggested inviting Expert 2 to collaborate (cf. Figure 3).

4.2.2. Statistical Analysis

For the purpose of identifying any intra-regional differences in provision with regard to the proximity of the LTC to the municipalities of main residence of the LTC residents and applicants, a significance test of the differences between the catchments of LTC was carried out. This was based on planning associations, LTC’ location municipalities and valleys.
The following procedure was used for the valley-based analysis: Since valleys and planning associations are not congruent, the principle of nearest neighbours and the criterion of accessibility—measured by the time required for public transport and car transport using Google Maps [62]—were used as the basis for phrasing the questions for the hypothesis testing. If more than one nursing home could be reached with the same time and effort, they were aggregated. If a nursing home was located at the entrance to more than one valley, the respective valleys were aggregated (cf. Figure 4).
Hypotheses were phrased for the LTC residents and LTC applicants. Table 2 provides an overview of the exact wording of the respective questions regarding the LTC residents. The wording of the questions regarding the LTC applicants was analogous.
The following should be noted regarding the statistical analysis of the data: The significance level for all tests was set to α = 0.05. All tests in this context were based on the assumption that the true ratio in the populations was 1:1. As the test statistic, we used χ2, which can be calculated as seen below:
χ 2 = n 1 e 1 2 e 1 + n 2 e 2 2 e 2
where n1 = observed number of people in specific LTC, e1 = expected number of people in specific LTC if hypothesis is valid, n2 = observed number of people in remaining LTC, e2 = expected number of people in remaining LTC if hypothesis is valid.
Answering question 1: n1 = 243, n2 = 14, n = 257. Expected values were derived by multiplying the overall n by the corresponding p-value, assuming that for both groups p = 0.5 (this corresponded to a ratio of 1:1). So, the expected value was calculated as follows: e1 = 257 × 0.5= 128.5, e2 = 257 × 0.5 = 128.5.
Now, we could compute the value χ2 = (243 − 128.5)2/128.5 + (14 − 127.5)2/128.5 = 204.05. The probability that such a high χ2 value may happen by chance (given a true ratio between these two groups of 1:1) is very low (<0.05). So, we did not believe in our hypothesis and rejected it.
Since this calculated χ2 value was only approximately χ2 distributed and seemed to be inappropriate if the expected values were small (ei < 5), the confidence interval of the binomial distribution was used to assess significance (whenever the confidence interval does not include the value 0.5 for a ratio found, a deviation from the ratio 1:1 can be assumed in a statistical sense; if the confidence interval includes the value 0.5, no deviations from this ratio can be detected). This test was an exact one. Since there were no ready-made tables for the given sample sizes, a self-developed computer program was used. If the total number of observations was 5 or 3 (as in questions 4, 6 and 7), a two-sided null hypothesis could not be rejected in principle, as already mentioned above.
The identification of any significant differences in the LTC catchment areas with respect to the planning associations, planning unit areas (PAs) and location municipalities was based on the following questions:
  • Are there significant differences among the four nursing homes with respect to the percentage of residents or applicants who previously lived a municipality belonging to the planning unit area to which the respective LTC is assigned?
  • Are there significant differences among the four nursing homes regarding the proportion of residents or applicants who previously lived in or outside the respective LTC location municipality?
To answer these questions, contingency tables were generated. Pearson’s chi-square test was used as the test procedure.
χ 2 = i , j n ij e ij 2 e ij
where nij = observed value (line i und column j), eij = expected value if our hypothesis is valid. So, for our first question, n11 = 64, n12 = 11, n21 = 20, … Expected values were again derived by multiplying the overall n (136) with the corresponding p-value. These expected values alternatively can be derived as the product of the observation sum of a specific line multipied by the sum of observations of a specific column divided by the overall n. So, for example, (64 + 11) x (64 + 20 + 22 + 11)/136 = 64.52 (expected value for line 1 and column 1). This has to be performed for each of the 8 observation values in the table. After calculating χ2, we would find a p-value of 0.7415. In the following, we were not able to reject our null hypothesis in respect to question 1.
This test again was an approximate one. If the expected values are smaller than 5, the calculated probabilities are generally considered to be too inaccurate. In this case, the much more time-consuming Fisher’s exact test (based on the hypergeometric distribution) was used.
For all described tests here, we assumed a significancy level of 5%.

4.2.3. Fundamental Data Themes for Geovisualisation and Explanation of Procedure

The visualisation makes as much use as possible of Austrian authoritative open data. It is a small proof of concept for the existence of the common dataspace in Austria. A common dataspace is a network of reliable and self-determined exchange of information among known or unknown partners. The level of trust for spatial content within the dataspace can be defined by stewardship of participating parties and their core competencies [63].
The geospatial base layers refer to fundamental data themes. Spatial data and cartography are highly relevant in this information environment because it puts information into a spatial context, mutually connects information pieces and brings in scale-dependent semantics [64]. Along the global fundamental geospatial data themes journey, a set of fundamental data themes have been defined by the United Nations Expert Group of Global Geoinformation Management and cover the global geodetic reference frame, orthoimagery, elevation and depth, buildings and constructions, geographical names as identification of places, geology, land cover and its proposed land use, land parcels and land ownership, transport networks and their connectivity, physical infrastructure including public facilities and functional areas of public life. This set of themes is used for different kinds of administration [65].
The visualisations in this study were created using Austrian authoritative units [66], digital terrain models from airborne laser-scanning surveys [67], a digital landscape model for the transport network [68] and points of interest [69], as well as Open Street Map data [70] via the OpenRouteService [71] for the isochrones of reachability by car. The main tool for analysis, data wrangling and visualisation was Quantum GIS version 3.28.6 LTR, an open-source GIS system [72].
Isochrones for reachability were calculated by the API open route service [71] on the basis of Open Street Map data [70]. Both the API as well as the data have sufficient coverage in the study area compared to the data of the authoritative transport network.
The origin–destination diagrams (O-D) for the numbers of residents and applicants were classified according to closure methods [73] and disaggregation rules [74] of statistical processing in order to prevent privacy issues. Although natural breaks would deliver a more efficient data understanding, that approach highlights individual information needs to be hidden to protect the privacy of individuals.
The origins are represented by the geographical coordinates of the LTC, which were derived based on the addresses in the Austrian authoritative information portal https://adressregister.gv.at/ (accessed on 10 January 2023) [75].
The destinations in the O-D diagrams are geographic centroids of municipalities residents come from. The centroids are located within settlement areas in the valleys, which reflect a more real position within the municipality instead of centroid locations on mountain peaks.

4.2.4. Transdisciplinary Discussion of Findings

After the geovisualisation and statistical evaluations were finished, Expert 1 was contacted to fix a date for a joint discussion of the results of the data analysis. In the meantime, Expert 1 got in touch with Expert 2, who agreed to contribute to the discussion. Subsequently, a date for a virtual meeting was scheduled for February 2023. In order to prepare for the meeting, a questionnaire was developed and sent to each of the two experts by email.
The questionnaire for Expert 1 centred on demand and location planning at the regional level and consisted of 18 open-ended questions on the following topics: relevance and responsibility of planning associations, nursing home provider and operative manager concerning demand and location planning as well as communication between the stakeholders (4 questions); allocation criteria (2 questions); appraisal of the current LTC supply structure and knowledge basis (2 questions); utilisation and adjustability of capacities, planned adjustments of bed capacities and relevant (new) issues in demand and location planning (4 questions); spatial archetype-related differences in current and future needs for LTC (2 questions); prioritisation of admission and ranking on waiting lists as well as reactions to unsatisfied LTC needs (3 questions); and challenges and uncertainties that need to be addressed in LTC-related demand planning (1 question).
The questionnaire for Expert 2 comprised 12 open-ended questions and focussed on the topics of intersectionality in public demand and location planning and the (currently) involved stakeholders (3 questions); the role of the planning associations and the LTC provider in the discussion of needs, political goals and key figures (4 questions); the relevance of spatial archetypes with regard to needs for LTC (2 questions); consideration of geovisualisations in strategic demand planning documents (1 question); opinion on the importance of LTC compared to other care services in the (near) future (1 question); and key uncertainties that LTC-related demand planning must address (1 question)
Whenever appropriate, the questions were introduced with statements from the existing strategic demand planning documents. There were deliberate overlaps in content between the two questionnaires—these related to the importance of stakeholders in demand and location planning, needs for LTC in different spatial archetypes, and uncertainties in strategic LTC demand planning—in order to reveal any differences in the experts’ opinions. The answers were analysed in an inductive–thematic way [76,77], without the assistance of any specific computer programs.
In February 2023, the online meeting via Zoom took place. First, the results of the statistical analyses of the secondary data and the cartographic illustration of the catchments were presented by the authors of this paper. Then, the experts were asked to comment on the factors determining the real catchments and on the statistical significances found. In the course of this, both experts referred to the questionnaires and the process of normative determination of LTC-related needs, and additionally, explained how the present LTC supply structure and the current supply situation evolved. The Zoom meeting was audio recorded with the oral consent of the two experts and transcribed verbatim. In addition, notes were taken during the meeting. The material was analysed according to the method described above. The answers to the questionnaires were provided in written form by both experts on the same day or the day after the Zoom meeting and forwarded by email. Both experts agreed to the use of their substantive statements and agreed to be available for further email correspondence in order to answer any further questions. The requirements of the European Union’s General Data Protection Regulation were met.

5. Results

This section presents the findings alongside the research questions. Research question 1 is answered by explaining the LTC supply structure and supply levels and giving an overview of the profile of LTC residents and LTC applicants. Research question 2 is addressed by presenting the catchments and travel efforts for (future) visitors. Research question 3 is responded to by describing (future) relevant factors and framework conditions for demand and location planning.

5.1. Overview of LTC Supply Structure

The LTC supply structure and the spatial distribution of LTC have developed since the 1960s. The oldest LTC is LTC Lienz, which opened in 1971; the youngest is LTC Nußdorf-Debant (2015/2016) [57]. With regard to the (intra-regional) distribution of capacities and the choice of location, it can be pointed out that the present supply structure is the result of a coordination process between the government of the federal province of Tyrol, the planning associations and the LTC provider, on the one hand, and processes of negotiations among the planning associations as well as among the municipalities of the respective PAs, on the other hand. The supply structure can be characterised as decentralised and depicts normative needs. All LTC are located in municipalities with designated, albeit different, centrality (cf. Figure 2). This can be explained by the minimum requirements defined by the LTC provider for (potential) location municipalities. These include: good accessibility (preferably by public transport), infrastructural provision and an existing need for LTC in the region. The large capacity of LTC Lienz compared to the other three LTC, which are located in rural PAs, results from the higher calculated demand for stationary long-term care calculated in urban municipalities. Referring to location planning at the local level and the choice of a particular plot, good accessibility by public transport and a central location within the location municipality are decisive factors.
LTC are spatially distributed across the three planning associations as follows: The two rural planning associations each have one LTC: PA Isel Region LTC Matrei (87 beds), PA East Tyrolean Oberland LTC Sillian (40 beds) and PA Valley Bottom of Lienz, which is characterised by urban and rural areas and has the largest population of about 28,000 people—LTC Lienz (240 beds) and LTC Nußdorf-Debant (80 beds) [57]. PA Valley Bottom of Lienz, with its 320 beds, comprises about 71% of the capacity in East Tyrol. As of 1 July 2022, a total of 432 beds were available including 1 bed for short-term care.
At the time of the expert consultation, due to the acute staff shortage, a gap was observed between theoretically available beds and beds that could actually be occupied. This was true for two LTC where 8 out of 41 (LTC Sillian) and 12 out of 230 (LTC Lienz) could not be occupied.

5.2. Levels of Provision, Admission Criteria and the Profile of the LTC Residents and Applicants

The normative determination of supply, i.e., the calculation of beds per 1000 inhabitants aged 75+ or the demand for beds for the planning period 2012–2022 was based on a structural analysis by the Department of Social Affairs of the Office of the Tyrolean Provincial Government [60]. In this context, the significant importance of three factors was identified: number of persons aged 75+ at the regional level (planning associations), distance to the LTC next to place of residence and population density. Other relevant, but not statistically significant parameters included: average household size, average usable living space, female employment rate and level of education. In 2010, the average supply level within the political district of Lienz was about 81 beds, in PA Valley Bottom of Lienz about 80 beds, in PA East Tyrolea Oberland 77 beds and about 89 beds in PA Isel Region [60] (pp. 81–90).
As of 1 July 2022, the calculated levels of supply based on official statistical population data provided by Statistics Austria (Quelle) were: an average of 86 beds per 1000 inhabitants aged 75+ in East Tyrol, 42 beds in PA East Tyrolean Oberland, 78 beds in PA Isel Region and 102 beds in PA Valley Bottom of Lienz. From this information, it can be derived that the average level of supply in the political district of Lienz had increased by 6 beds per 1000 inhabitants aged 75+, but at the same time the intra-regional disparities had increased.
As of 1 July 2022, 431 persons resided in the four nursing homes, including 3 persons who did not have their previous main residence in East Tyrol. At the same time, another 136 persons—including 1 person from outside the region—had expressed their need for LTC by applying for admission to a nursing home (cf. Table A1 in Appendix A).
According to Expert 1, any beds that become free are quickly occupied. As a rule, admission to LTC follows the date of registration. In particular “cases of emergencies” (e.g., after strokes), deviations are possible. Due to the given care-friendliness of the rooms, LTC Matrei, Sillian and Nußdorf-Debant only admit people with care level 3 or higher, i.e., people who require more than 120 h of care per month [78]. LTC Lienz, on the other hand, still provides a number of smaller rooms that are not suitable for care, so that persons with lower levels of care can move in or can apply for accommodation in this facility.
As of 1 July 2022, according to the provided cross-sectional real-world data LTC residents—including one short-term care resident—were 73% females. To break down their ages, 50% of the residents were 86 years and older, while 12% were between 51 and 76 years old. Meanwhile, 53% of the residents were widowed, 22% single and 18% married. Furthermore, 97% were Roman Catholics. Finally, 91% had a care level of at least 3, of which the largest share (about 39%) had care level 5, which corresponds to more than 180 h of care per month.
According to the provided cross-sectional real-world data in total, 65% of the LTC applicants were females. To break down their ages, 46% were at least 86 years old, while 15% were between 56 and 76 years old. Meanwhile, 50% of the applicants were widowed, 15% single and 28% married. Furthermore, 97% were Roman Catholics. Finally, 68% of the applicants with an evaluated care level had at least care level 3, of which the largest proportion (around 73%) had care levels 3 and 4.
The waiting lists showed that regarding the capacity, the demand for the two LTC in PA Valley Bottom of Lienz was “by far” the highest compared to the other facilities. While the ratio of applicants to beds for the LTC in PA Valley Bottom of Lienz was about 1:3 (= 102 applicants for 320 beds), it was about 1:4 for the other facilities in the two rural PAs. Both experts explained that these spatial differences relating to the expressed needs were due to the fact that in rural municipalities, the family structures and the availability of living space make domestic care more feasible. On the other hand, a certain anonymity and loneliness in urban communities favour the desire to move to a nursing home.
O the topic of whether applicants are willing to leave East Tyrol if their felt demand is not met, Expert 1 stated that this might be imaginable in single or particular cases. It can be presumed that these persons apply for accommodation in LTC either in North Tyrol or in neighbouring Carinthia. In this context, the expert points out that these facilities also face surplus demand.

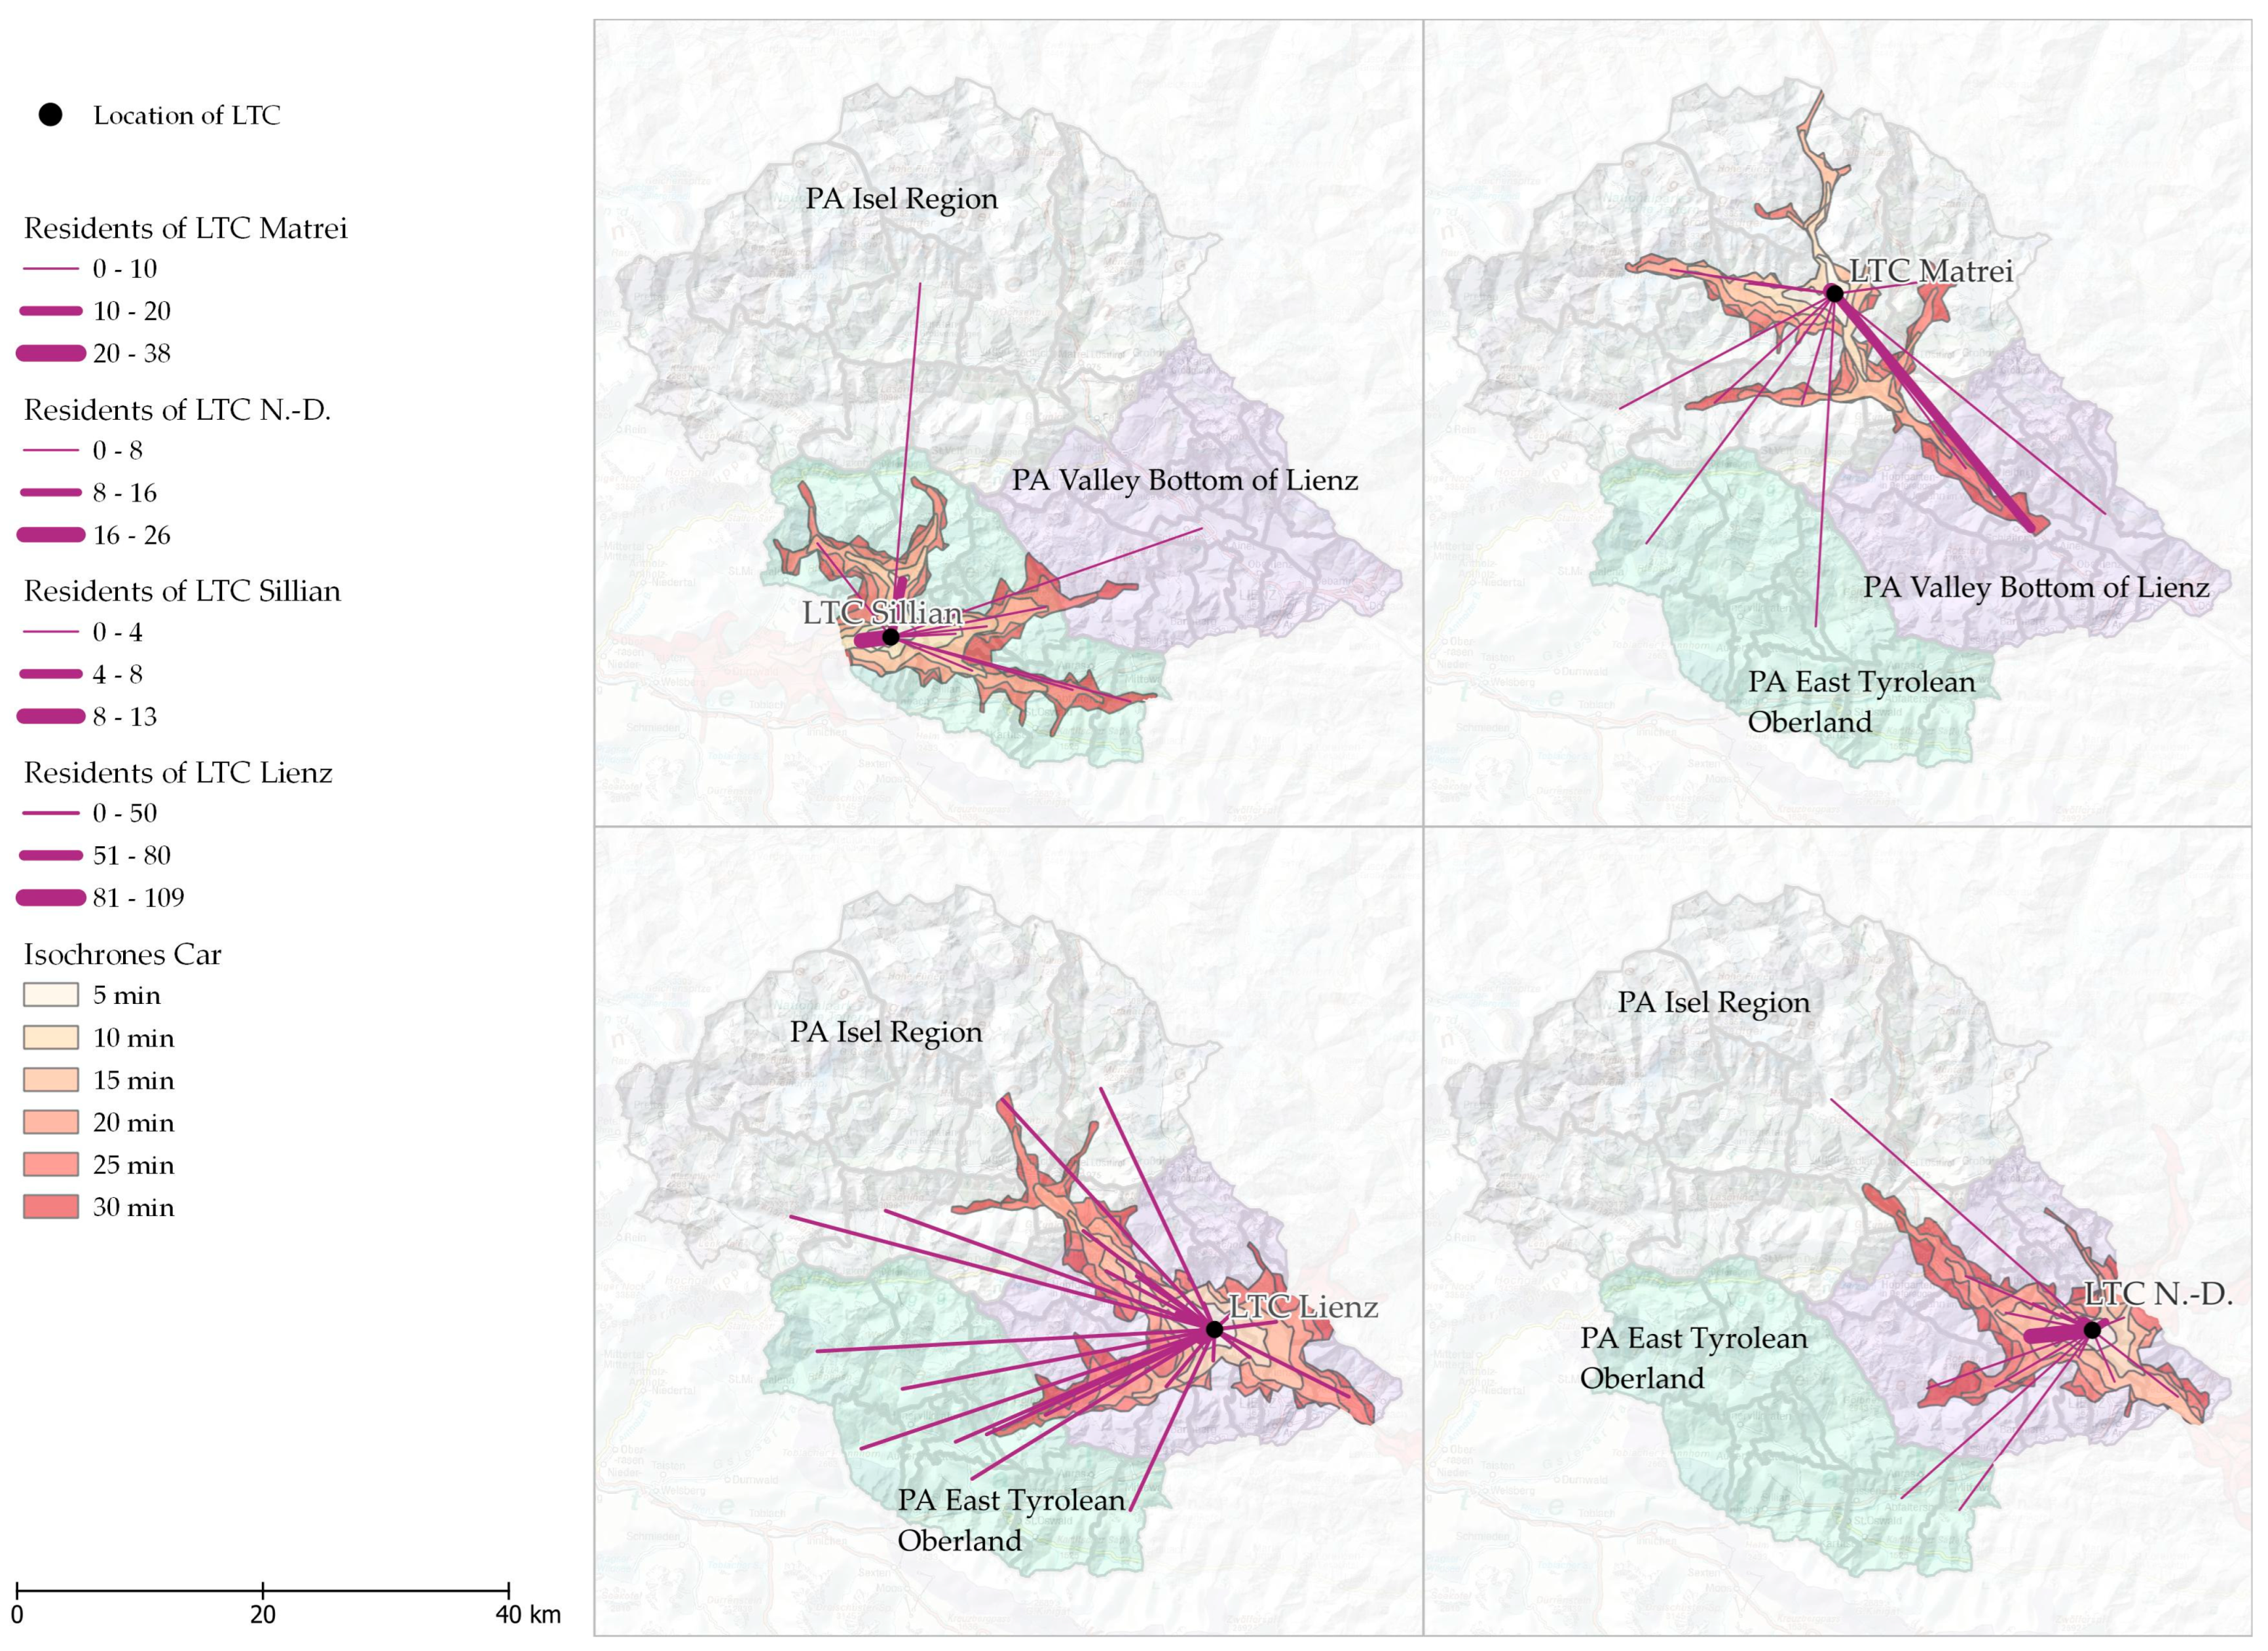
5.3. Catchments Related to LTC Residents

The cartographical representation of the LTC catchments with regard to the residents (cf. Figure 5) highlights the different spatial ranges as well as the different degrees of overlapping of the catchments.
The catchments of all four nursing homes stretch across all three planning associations. However, the catchment of LTC Lienz differs from the others with regard to (1) the diversity of the municipalities as places of “origin” of the residents and (2) the distinct relationships with PA East Tyrolean Oberland and PA Isel Region. Approximately one in two LTC residents from PA East Tyrolean Oberland lives in one of the two LTC of PA Valley Bottom of Lienz; in relation to the “origin” PA Isel Region, it is one in five. LTC Matrei, on the other hand, shows close relationships with PA Valley Bottom of Lienz. According to Expert 1’s opinion, this is due more to cultural affiliation than to spatial distances. The catchment of LTC Nußdorf-Debant, on the other hand, is characterised by a small-scale specificity and the importance of Lienz as the “origin” of the residents. This, in the opinion of Expert 1, can be explained by the proximity to the district capital Lienz.
The descriptive analysis of the “origin” (=municipality of previous main residence) of the LTC residents revealed that about 85% were from a municipality of the respective planning association, about 41% had their previous main residence in the respective location municipality and about 33% were from the municipalities neighbouring the respective location municipality. The number of people from outside East Tyrol was low, with a total of three persons (cf. Table A1 in Appendix A).
The range of PA-related “origin” was between 94% (LTC Sillian) or 93% (LTC Nußdorf-Debant) and 83% (LTC Lienz) or 80% (LTC Matrei). The share of LTC residents who had their previous main residence in the location municipality ranged from 21% (LTC Nußdorf-Debant) to 49% (LTC Lienz). The LTC with the highest share of residents who came from a neighbouring municipality was LTC Nußdorf-Debant with 53%. The corresponding values were 33% for LTC Sillian, 31% for LTC Matrei and 26% for LTC Lienz. The cross-PA catchments resulted from three aspects from the perspective of Expert 1:
  • The resident and the relatives decided to take the first available opportunity to satisfy the (urgent) felt need for LTC, settled in and, therefore, excluded a further move—possibly also due to a changing family environment;
  • The residents’ children moved to a municipality that is part of another planning association and that is why their parent(s) in need of care decided to reside there, to be closer to them;
  • The resident was an “unloved family member” and so the opportunity was taken to place her/him far away.
The statistical analysis related to residents by planning association and municipality of location (cf. Table A2 in Appendix A) found that there were significant differences in the “origin” of LTC residents with regard to the respective planning association (p = 0.0272) as well as the location municipality (p = 0.0001) (cf. Figure 6).
With regard to the municipality of the previous main residence by valleys (cf. Figure 7), it can be seen (cf. Table A3 in Appendix A) that
  • Significantly more persons from the Bottom Valley of Lienz resided in LTC Lienz and LTC Nußdorf-Debant compared to the other two facilities (p < 0.0001).
  • Persons from Virgen Valley resided significantly more often in LTC Matrei compared to the other three LTC (p = 0.0039).
  • LTC residents of Defereggen Valley, Kalser Valley and Virgen Valley had decided significantly more often on LTC Matrei compared to the other three LTC (p = 0.0026).
  • Significantly more persons from the Puster Valley resided in LTC Sillian and LTC Lienz compared to the other two facilities (p < 0.0001).
  • LTC residents who came from the Isel Valley had chosen significantly more often to move to LTC Matrei or LTC Lienz compared to the other two facilities (p < 0.0001).
In summary, it can be said that persons who had their previous main residence in the Virgen Valley, Defereggen Valley, Kalser Valley, Isel Valley, Puster Valley or the Valley Bottom of Lienz were significantly more likely to reside in the LTC located next to the municipality of their previous place of main residence. In comparison, persons from the Villgraten and Tyrolean Gail/Lesach Valley resided more distantly from their previous place of main residence.

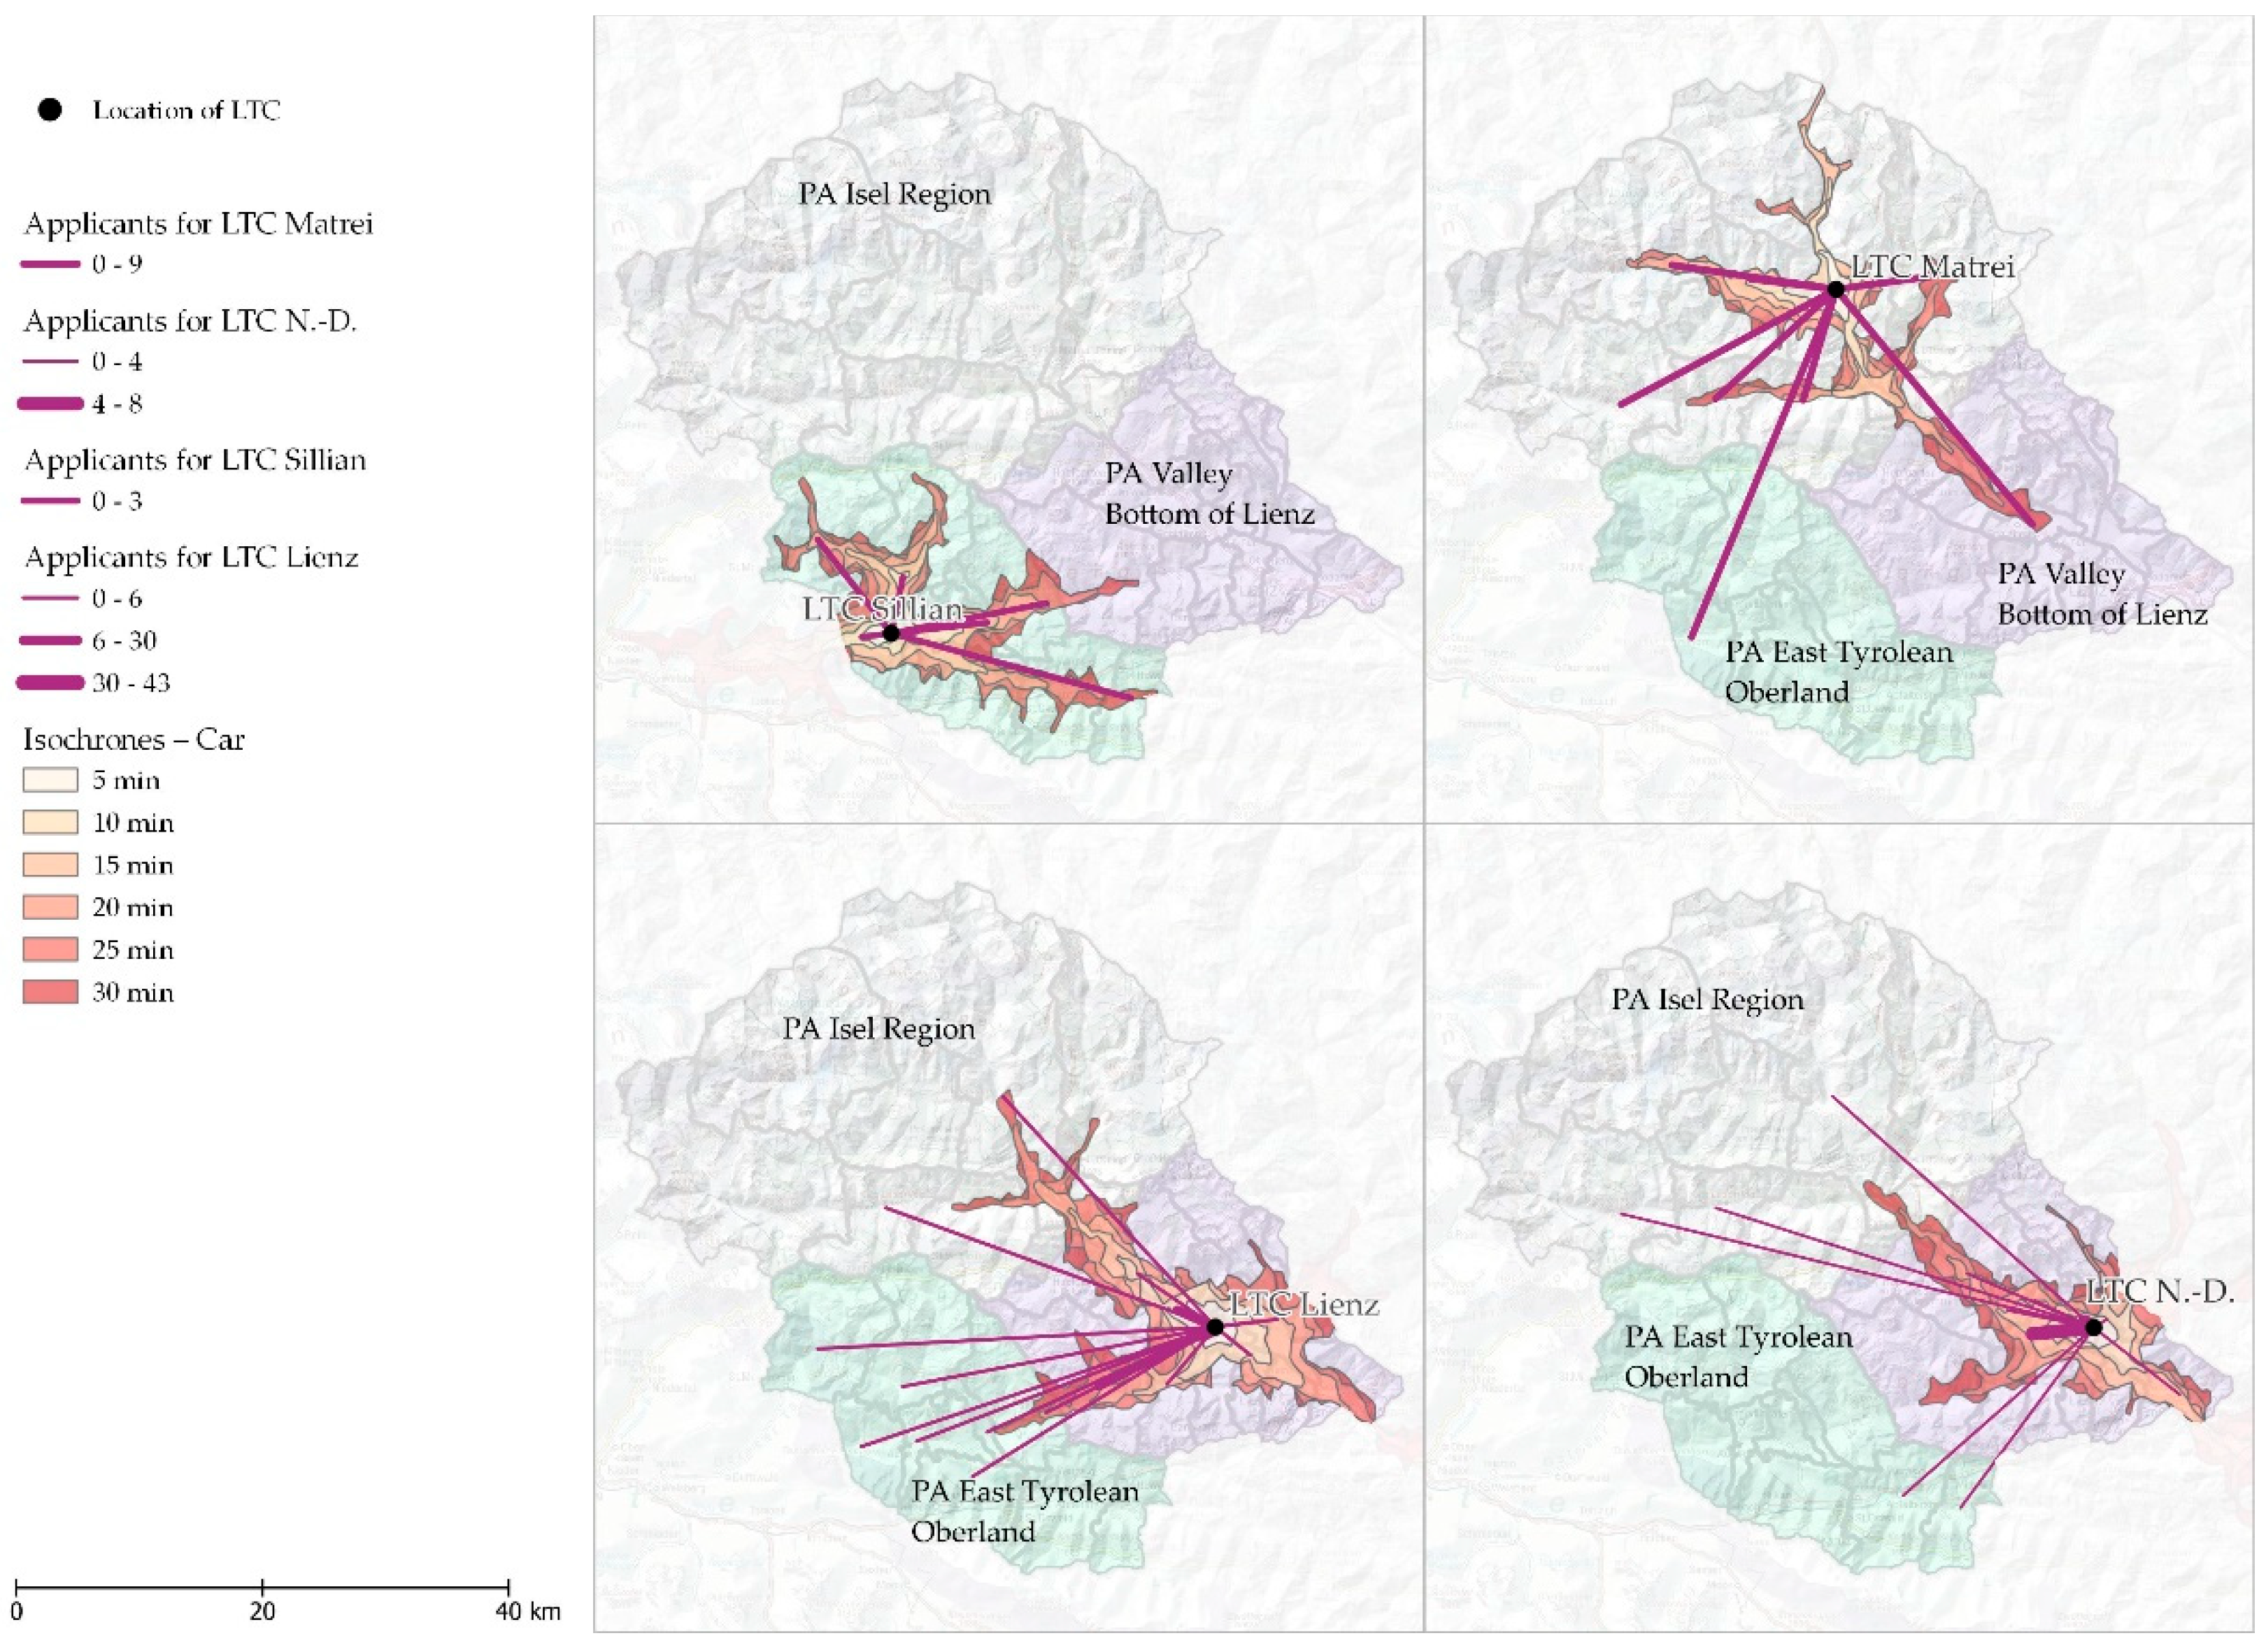
5.4. Catchments Related to LTC Applicants

Except for LTC Sillian, the catchment areas of the other LTC each stretch across all three planning associations (vgl. Figure 8). The catchment area of LTC Sillian is small-scale and limited to PA Oberland. LTC Lienz has the largest spatial range and geographical diversity in terms of the applicants’ municipalities of main residence. The catchment comprises municipalities from all three PAs, whereby except for PA Valley Bottom of Lienz, the tightest relationship to PA East Tyrolean Oberland can be identified.
In quantitative terms, the cross-PA spatial catchment of LTC Nußdorf-Debant is not very significant compared to LTC Lienz and LTC Matrei. In contrast, the intra-PA-relationship with the district capital Lienz is relevant for LTC Nußdorf-Debant, which highlights the importance of this LTC as a complementary facility to LTC Lienz.
The two LTC Lienz and Nußdorf-Debant are the first choice for about one in two applicants from PA East Tyrolean Oberland and for one in five applicants from PA Isel Region.
The descriptive analysis of the origin (=municipality of previous main residence) of the LTC applicants revealed that about 86% lived in a municipality of the respective planning association, about 46% in the respective LTC location municipalities and about 32% in municipalities neighbouring the LTC location municipalities. One person did not live in the political district of Lienz (cf. Table A2 in Appendix A).
The ranges in terms of PA-related origin was between 92% (LTC Sillian) or 91% (LTC Matrei) and 85% (LTC Lienz) or 81% (LTC Nußdorf-Debant). The percentage of applicants who had their main residence in an LTC location municipality was between 25% (LTC Sillian) and 57% (LTC Lienz). In LTC Matrei, Sillian and Nußdorf-Debant, the shares of applicants from the municipalities neighbouring the LTC municipality were similar at 45%, 42% and 41%. For LTC Lienz, this share was about 24%.
The statistical analysis of the origins of applicants (cf. Figure 9) by planning associations and location municipalities showed no dependencies or facility-specific significant differences with regard to applicants from the respective planning association (p = 0.7415). Significance was revealed with regard to the facility-specific catchment areas of applicants who had their previous main residence in the location municipality (p = 0.0725) (cf. Table A5 in Appendix A).
The analysis of the applicants by valleys (Table A6 in Appendix A) revealed the following:
  • Significantly more persons from the Valley Bottom of Lienz applied for admission to LTC Lienz and LTC Nußdorf-Debant compared to the other two nursing homes (p < 0.0001).
  • Significantly more persons from the Puster Valley applied for admission to LTC Sillian and LTC Lienz compared to the other two LTC facilities (p = 0.0001).
  • Significantly more persons from the Isel Valley applied for admission to LTC Matrei and LTC Lienz compared to LTC Sillian and LTC Nußdorf-Debant (p = 0.0126).
To sum up, applicants from Isel Valley, Puster Valley and Valley Bottom of Lienz were looking for urgent admission close to their municipality of main residence (cf. Figure 10). Meanwhile, persons from the Virgen, Kalser, Defereggen and Villgraten Valleys as well as from Tyrolean Gail/Leasachtal Valley applied for LTC located more distant from their municipality of main residence.

5.5. Travel Effort for (Future) Visitors

The travel effort for (future) visitors can be roughly estimated by means of isochrones for accessibility by car (cf. Figure 5 and Figure 8 in Section 5.3 and Section 5.4, as well as the same figures zoomed in—Figure A1 and Figure A2—in Appendix B):
The travel effort of visitors to LTC Sillian ranges from 5 to 30 min. The majority of visitors, however, reach the LTC within 10 min by car. The situation is different for visitors from PA Isel Region and PA Valley Bottom of Lienz. They need more than 30 min in one direction. Since the applicants “originate” exclusively from PA East Tyrolean Oberland, it can be assumed that their future visitors have a maximum travel effort of 30 min per trip.
For LTC Nußdorf-Debant, it can be concluded that most of the visitors have to drive approximately 20 min in one direction. Visitors from outside PA Valley Bottom of Lienz, however, are confronted with far greater efforts of more than 30 min one way. Notwithstanding a spatially concentrated demand from PA Valley Bottom of Lienz, the wider geographical “spread” of applicants compared to the LTC residents indicates a travel time of more than 30 min for future visitors.
A different picture emerges with regard to the travel efforts of visitors to LTC Matrei and LTC Lienz. For LTC Matrei, the travel time for visitors—since the majority of residents “originate” from municipalities in PA Valley Bottom of Lienz—ranges between 20 and 30 min one way, though in individual cases, it goes far beyond that. Since the “origins” of the applicants are similar to those of the LTC residents, the travel efforts of the future visitors can be expected to be comparable to those of the current visitors.
The travel efforts for visitors of persons residing in LTC Lienz and who “originate” from municipalities of PA Valley Bottom of Lienz are up to 25 min in one direction. Due to the large spatial range of LTC Lienz, which goes beyond the PA borders, there are very heterogeneous travel times for the visitors compared to the other LTC, on the one hand; as well, travel times exceed 30 min one way for visitors from PA Isel Region and PA East Tyrolean Oberland, on the other hand. Since the “origins” of the LTC applicants are similar to those of the actual residents, the considerations regarding the travel time may also apply to the future visitors.

5.6. Experts’ Outlook on the Near Future of LTC Provision

Although the experts assume an increasing demand for LTC in both urban and rural regions due to the increasing number of persons in need of care and the shrinking potential for informal support provided by family members, an expansion of the LTC capacities is out of the question from today’s perspective. The experts argue that this is due to the lack of staff, which already causes an under-utilisation of the existing capacities of LTC Sillian and LTC Lienz, which could also happen at any time at the other two LTC. In turn, this is likely to influence the determination of normative needs and consequently might lead to a general reduction in the nursing home capacities in the political district of Lienz, while, at the same time, the demand is rising, even though theoretically all four LTC have the potential to increase their capacities. From a practical point of view, the expansion of LTC Matrei and LTC Nußdorf-Debant—no estimates were made regarding the concrete number of beds—could be realised most easily; meanwhile, LTC Sillian could be expanded by about 20 beds, and a certain potential is also perceived for LTC Lienz.
However, due to the tight personnel situation, there are no intentions to expand the bed capacities in the stationary long-term care sector. It seems the availability of care and nursing staff, as well as general staff such as for the kitchen, will remain the most central determinant of demand and location planning. This is also due to the fact that personnel forecasts are difficult—part-time work is currently favoured—and the measures recently adopted by the federal government to increase the attractiveness of the nursing profession (e.g., decentralisation of nursing education) cannot yet be evaluated. Nonetheless, the availability of personnel as a parameter determining (capacity) planning has taken precedence over the financial viability of nursing homes. Furthermore, importance is also attached to the infrastructure of the existing facilities with regard to their advantages in terms of exploiting synergy effects.
Nevertheless, in the long term, nursing homes are considered to have a firm place in the system of social infrastructures for older people in need of care in East Tyrol, although the (area-wide) establishment of alternatives to stationary long-term care, and the strengthening of family care, are politically favoured. That is why the normative definition of care parameters, therefore, tends to be oriented towards politically defined goals. However, it is questionable whether these measures can contribute to the alleviation of (felt, but) unmet needs since until they are actioned, there is a lack of comprehensive knowledge about the functioning or the actual success, viability and acceptance of alternatives such as assisted living or transient, day and short-term care. Additionally, qualified driving and nursing personnel must be available to a corresponding extent here, as well. Furthermore, the medium- to long-term success of the measures to support family caregivers have not yet been assessed.

6. Discussion and Conclusions

6.1. Strengths and Limitations of this Study

To the best of the authors’ knowledge, this study is the first attempt to conduct a differentiated spatial analysis of stationary long-term care facilities at the small scale for Austria. For this purpose, a case-study-based, cross-sectional and pragmatic approach was chosen, exclusively based on real-world data. For the data analysis, a specific methodology was chosen that is suitable for dealing with small numbers of cases.
The validation of the results was achieved by applying a transdisciplinary approach when it came to the discussion of catchment areas as well as the results of the statistical data analysis. The experts noted that the results of the spatial science data interpretation coincided with their long-standing expertise. Consequently, the results based on the momentary snapshot for the cut-off date of 1 July 2022 can, to a certain extent, be appraised as representative of the long-term average.
The novelty of this study, not only for Tyrol but also for the other federal provinces, lies in the analysis of the LTC catchment areas in relation to the LTC residents and applicants by valleys. The supply structures and provision situations in the strategic planning documents of the Austrian provinces are either exclusively presented in text form or—as in the case of Tyrol—cartographically in relation to the planning associations. In the case of Tyrol, it should be noted that the geovisualisation of the (future) needs, i.e., the catchment areas, was part of the process of preparing the Structural Plan for Care 2012–2022. However, for editorial reasons, these maps were not included in the published version and the cartographic representation was restricted to the supply ratio of beds per 1000 inhabitants aged 75+ in the planning associations [60] (p. 185).
The descriptive character of this study with regard to intra-regional equality in terms of access to LTC was a result of the empirical data basis. Thus, in the absence of more differentiated data such as ZIP codes, centroids were chosen in order to determine the population distribution in the municipalities of the previous main residence (LTC residents) or the current municipalities of main residence (LTC applicants). Consequently, the geovisualisation reached its limits. Moreover, it was not possible to calculate origin–destination matrices in order to quantify the number of persons who were (probably) disadvantaged in terms of (1) being culturally uprooted in the case of being admitted to a stationary long-term care facility far away from the (previous) place of residence and (2) travel efforts as (future) visitors.
A presentation of the comparative needs of persons who wished to be admitted to a particular nursing home was not possible due to the lack of information on felt needs. Therefore, in the presentation of the intra-regional problems of fit with regard to supply and demand, a direct comparison of residents and applicants was not carried out. The identified differences in the catchment areas of the LTC residents and applicants could not be explained with the chosen cross-sectional approach. The same applied to the validity of the ranges of the care levels as an indicator for the derivation of intra-regional differences in LTC provision.
Waiting lists are a common source of data for operationalising unmet need and demand for services [51,79], but they are criticised for their lack of reliability [51]. This is not only a finding from the literature but also from the expert consultation in the context of the respective study.
For the case study region, Expert 1 pointed out that the long waiting lists indicate the urgency, but not the preference for a particular facility. This is because, on the one hand, double registrations are frequent. Furthermore, if it should turn out that there is no longer a need for stationary LTC, it cannot be expected that the (caregiving) relatives will ask to take the name off the waiting list. This can lead to misinterpretations in terms of undersupply or a surplus of demand or unmet need. Therefore, at the end of 2022, the nursing home provider contacted all persons on the waiting lists and asked whether there was still a need for urgent admission and whether a bed available within the next six months would actually be taken up. The response rate was 90%. It turned out that 150 of 180 persons wished to stay on the waiting list. Based on this, the interviewee concluded that it is important to distinguish between pre-registration and an urgent request for admission. More generally speaking, persons who have their names put on the waiting list are those who feel and express a certain need for security. In order to increase the reliability of waiting lists, it is necessary to keep them up to date.

6.2. The Case Study Region as a Container with Shortcomings of Provision

Basing on the statistical analysis and geovisualisation of the provided cross-sectional data on all four nursing homes, it can be seen that
  • LTC location planning (so far) has been oriented towards the concept of central locations;
  • The case study region has the character of a container with regard to the origins of the residents and applicants, i.e., the catchment areas are limited to the political district of Lienz;
  • Normatively determined catchment areas (PAs) broadly match the actual catchments;
  • The disparities in terms of intra-regional supply levels (most probably due to demographic ageing) have increased compared to the reference year 2010;
  • The travel efforts of (future) visitors are heterogeneous and differ between one LTC and another;
  • The current demand is not met by the existing utilisable capacities.
The latter aspect prompts the following thought experiment relating to the additional capacities required. Assuming that
  • The beds of the four nursing homes will continuously be fully occupied—at present 430 of about 450 places can be occupied due to the staff shortage—and that the capacities cannot be adjusted to the increasing demand in the short term—at the time of the study, the waiting time for admission was about one year;
  • Waiting lists are taken as the only source of input for calculating the current need for additional beds.
    Then,
    • If each applicant actually has an urgent need and if each person is only listed once on the waiting list, and it is postulated that all theoretically available beds in the existing nursing homes can actually be occupied, this will result in a theoretical need for 116 additional beds “for now”. Only considering their need, this will mean that at least one additional nursing home will have to be built in the case study region; with regard to the PAs and only considering applicants living in the PA-associated municipalities, this implies a current theoretical need for 15 additional beds in PA East Tyrolean Oberland, 75 additional beds in PA Valley Bottom of Lienz and 25 additional beds in PA Isel Region.
    • If every second applicant is put on more than one waiting list, i.e., 68 persons urgently seek a place in a home, this will result in a theoretical need for 48 additional beds “for now”. Only considering their need, this implies that an additional nursing home of the size of LTC Sillian is needed; with regard to the PAs and only considering the applicants residing in the respective PA, as well as postulated that assumption 2 applies equally to all PAs, this implies a current theoretical need for about 3 additional beds in PA East Tyrolean Oberland, about 31 additional beds in PA Valley Bottom of Lienz and about 12 additional beds in PA Isel Region.
As an alternative, simple calculations to determine the number of future discontented persons (residents and relatives) are not feasible due to the lack of knowledge about the motives for registering on a certain waiting list (cf. also point 3 of Expert 1’s assessment in Section 5.3).
Furthermore, due to the methodological limitations, we could not make a comparison of the provision levels determined in the context of the respective study with those published in the Structural Plan for Care 2012–2022 [60].

6.3. Implications for Further Research

A methodological approach to studying the problems of fit could be to investigate the migration behaviour of those persons who—despite urgent need—could not be admitted to any of the four nursing homes. According to the experts involved in this study, one approach could be to survey the discharge management of the hospitals, social workers and providers of LTC in Northern Tyrol and in the province of Carinthia, as well as the LTC residents themselves. This could also help to shed light on the issue (1) of whether and to what extent the criterion of proximity to one’s own current or previous place of main residence or the place of residence of their adult children is relevant, (2) by whom (people in need of care, (caregiving) relatives, care and nursing staff) the (pre-)selection between facilities that come into question in principle will be made and what effects this could have on the spatial configuration of the future catchment areas.
The results of the experts’ consultation on the future development and the adaptability of the existing capacities of stationary long-term care facilities in the face of the increasing (expected) demand pressure in all spatial archetypes of care suggest that the share of underserved persons will increase from today’s point of view. For a detailed projection of the expected future need or demand for LTC, it, therefore, makes sense to include the clinical picture of the residents in describing the characteristics of the future catchment areas—considering valleys and the planning unit areas. The Austrian Health Information System—provided by Gesundheit Oesterreich [80]—could be used for this purpose (cf. the use-case for envisaged primary health care units [81]).
Since the main residence can be a focal criterion for access to nursing homes in Austria, it is important to know whether this is known to the population and, if so, what influence it has or could have in the future on the (timely) choice of the main residence against the background of multi-local lifestyles and increasingly heterogeneous migration biographies [82]. The case study region would be a good choice for collecting initial empirical findings in this regard, as the existing experience from the science–practice collaboration can be applied directly and specific contact persons in the Office of the Tyrolean Provincial Government have been named in the context of the science–practice collaboration. A first step in this direction could be the presentation of the results of the study in question to the Tyrolean Provincial Government, the planning associations and the nursing home provider in the context of the demand planning for the upcoming planning period.
Furthermore, longitudinal studies could help to identify the stability of the catchment areas over time and to explain any actual differences between the catchment areas of the residents and those of the applicants. For this purpose, the data archive on home occupancy kept by the Tyrolean Provincial Government since 2004 and the data of the nursing home provider could be used.

6.4. Lessons Learned

The real-world data-based transdisciplinary approach to addressing and mapping catchment areas contributed to raising our awareness of the need for a more cautious use of key figures in assessing spatial infrastructure-related disparities, highlighted the relevance of available care and nursing personnel for strategic location planning and demand-oriented infrastructure planning, revealed the reasons for the mismatch of preferences for a particular nursing home and actual admission to a nursing home and, furthermore, with regard to choice showed the importance of proximity to the previous place of residence. This all contributed to our growing consciousness of the limitations of GIS-based modelling when there are missing real-world data and the pitfalls of mapping with problems of fit.

Author Contributions

Conceptualization, T.F.; methodology, T.F., K.M. and M.J.; software, K.M. and M.J.; validation, T.F., K.M. and M.J.; formal analysis, K.M. and M.J.; investigation, T.F.; data curation, T.F. and M.J.; writing—original draft preparation, T.F., K.M. and M.J.; writing—review and editing, T.F., K.M. and M.J.; visualization, T.F. and M.J. All authors have read and agreed to the published version of the manuscript.

Funding

This research received no external funding.

Institutional Review Board Statement

Ethical review and approval were waived for this study due to the exclusive involvement of experts.

Informed Consent Statement

Informed consent was obtained from all subjects involved in the study.

Data Availability Statement

The raw data are unavailable due to the agreement between the data provider and the authors.

Acknowledgments

The authors would like to thank the experts for their time and the frank discussions.

Conflicts of Interest

The authors declare no conflict of interest.

Appendix A

Table A1. Catchments of LTC related to LTC residents.
Residents from …LTC
Lienz
LTC
Matrei
LTC
Nußdorf-
Debant
LTC
Sillian
respective planning unit area184708331
LTC’s location municipality109381913
neighbouring municipalities57274711
outside East Tyrol1020
total222878933
Table A2. Catchments related to LTC applicants by planning associations and location municipalities.
Name of FacilityResidents from Respective Planning Association
N (%)
Residents from LTC’s Location Municipality
N (%)
YesNoYesNo
LTC Lienz184 (82.9)38 (17.1)109 (49.1)113 (50.9)
LTC Matrei70 (80.5)17 (19.5)38 (43.7)49 (56.3)
LTC Nußdorf-Debant83 (93.3)6 (6.7)19 (21.3)70 (78.7)
LTC Sillian31 (93.9)2 (6.1)13 (39.4)20 (60.6)
total368 (85.4)63 (14.6)179 (41.5)252 (58.5)
Chi-Square0.02720.0001
Fisher’s exact test0.0223<0.0001
Table A3. Catchments related to LTC residents by valleys.
Persons from …Residing in East Tyrolean LTC(s)Residing in Next-Neighboured East Tyrolean LTC(s)Chi-Square pConfidence Interval of Binomial DistributionAssessment of Binomial Distribution
YesNo
Valley Bottom of Lienz25724314<0.00010.0301–0.0898significant
Villgraten Valley12840.24820.0992–0.6511
Tyrolean Gail/Lesach Valley10370.20590.0667–0.6525
Defereggen Valley221570.08810.1386–0.5487
Kalser Valley10640.52710.3491–0.9681
Virgen Valley121110.00390.0021–0.3848significant
Villgraten Valley and Tyrolean Gail/Lesach Valley2211111.00000.2822–0.7178
Defereggen Valley, Kalser Valley and Virgen Valley4432120.00260.1496–0.4279significant
Puster Valley49445<0.00010.0340–0.2223significant
Isel Valley56533<0.00010.0112–0.1487significant
Table A4. Catchments of LTC related to LTC applicants.
Applicants from …LTC
Lienz
LTC
Matrei
LTC
Nußdorf-
Debant
LTC
Sillian
respective planning unit area64202211
LTC’s location municipality43983
neighbouring municipalities1810115
outside East Tyrol0001
total75222712
Table A5. Catchments related to LTC applicants by planning associations and location municipalities.
Name of FacilityApplicants from Respective Planning Association
N (%)
Applicants from LTC’s Location Municipality
N (%)
YesNoYesNo
LTC Lienz 64 (85.3)11 (14.7)43 (57.3)32 (42.7)
LTC Matrei 20 (90.9)2 (9.1)9 (40.9)13 (59.1)
LTC Nußdorf-Debant22 (81.5)5 (18.5)8 (29.6)19 (70.4)
LTC Sillian11 (91.7)1 (8.3)3 (25.0)9 (75.0)
total117 (86.0)19 (14.0)63 (46.3)73 (53.7)
Chi-Square0.74150.0275
Fisher’s exact test0.80700.0278
Table A6. Catchments related to LTC applicants by valleys. Note: In this table, we test if the ratio of “yes” to “no” answers = equal (ratio = 1:1), which means that the probability for a “yes resp.”no = 0.5. If one uses confidence intervals based on a binomial distribution, we have to accept the null hypothesis—the true probability value is 0.5—if this value is included within the confidence limits. This is the case in 7 out of 10 tests.
Persons Living in …Applying for Place(s) in East Tyrolean LTC(s)Applying for Place(s) in Next-Neighboured East Tyrolean LTC(s)Chi-Square pConfidence Interval of Binomial DistributionAssessment of Binomial Distribution
YesNo
Valley Bottom of Lienz78771<0.00010.0001–0.0219significant
Villgraten Valley6240.41420.0433–0.7772
Tyrolean Gail/Lesach Valley5140.17970.0051–0.7164
Defereggen Valley8530.47950.0852–0.7551
Kalser Valley3300.08330.0000–0.7076
Virgen Valley3300.08830.0000–0.7076
Villgraten Valley and Tyrolean Gail/Lesach Valley11560.76300.1675–0.7662
Defereggen Valley, Kalser Valley and Virgen Valley141130.03250.0466–0.5080
Puster Valley191810.00010.0013–0.2603significant
Isel Valley131120.01260.0192–0.4545significant

Appendix B

Figure A1. Catchments related to LTC residents by planning associations (PAs).
Sustainability 15 14535 g0a1
Figure A2. Catchments related to LTC applicants by planning associations (PAs).
Sustainability 15 14535 g0a2

References

  1. United Nations. 60+ Counts. The Growing Need for Long-Term Care. Assumptions and Realities. Available online: https://www.un.org/esa/socdev/ageing/documents/un-ageing_briefing-paper_long-term-care.pdf (accessed on 28 May 2023).
  2. Tessier, L.; Wulf, N.; Momose, Y. Long-Term Care in the Context of Population Ageing: Rights-Based Approach to Universal Coverage; International Labour Organization: Geneva, Switzerland, 2022; ISBN 9789220379769. [Google Scholar]
  3. Rahman, M.M.; Rosenberg, M.; Flores, G.; Parsell, N.; Akter, S.; Alam, M.A.; Rahman, M.M.; Edejer, T. A systematic review and meta-analysis of unmet needs for healthcare and long-term care among older people. Health Econ. Rev. 2022, 12, 60. [Google Scholar] [CrossRef]
  4. Richards, S.; Hagger, C. The experiences of older adults from moving into residential long term care. A systematic review of qualitative studies. JBI Libr. Syst. Rev. 2011, 9, 1–23. [Google Scholar] [CrossRef]
  5. Serrano-Gemes, G.; Rich-Ruiz, M.; Serrano-Del-Rosal, R. Reasons for the Place of Care of the Elders: A Systematic Review. Healthcare 2020, 8, 436. [Google Scholar] [CrossRef] [PubMed]
  6. Stiefler, S.; Seibert, K.; Domhoff, D.; Görres, S.; Wolf-Ostermann, K.; Peschke, D. Einflussfaktoren für einen Heimeintritt bei bestehender Pflegebedürftigkeit—Eine systematische Übersichtsarbeit. Z. Evid. Fortbild. Qual. Gesundhwes. 2020, 153–154, 60–75. [Google Scholar] [CrossRef]
  7. Johnson, R.A.; Bibbo, J. Relocation decisions and constructing the meaning of home: A phenomenological study of the transition into a nursing home. J. Aging Stud. 2014, 30, 56–63. [Google Scholar] [CrossRef] [PubMed]
  8. Schmitz, H.; Stroka-Wetsch, M.A. Determinants of nursing home choice: Does reported quality matter? Health Econ. 2020, 29, 766–777. [Google Scholar] [CrossRef] [PubMed]
  9. Johansson, K.; Borell, L.; Rosenberg, L. Qualities of the environment that support a sense of home and belonging in nursing homes for older people. Ageing Soc. 2022, 42, 157–178. [Google Scholar] [CrossRef]
  10. Childs, A. Constitution of the World Health Organization. In WHO Chronicle; World Health Organization: Geneva, Switzerland, 1947. [Google Scholar]
  11. World Health Organization. Regional Office for Europe. Ottawa Charter for Health Promotion. 1986. Available online: https://apps.who.int/iris/handle/10665/349652 (accessed on 27 May 2023).
  12. United Nations Economic Commission for Europe. Spatial Planning. Key Instrument for Development and Effective Governance with Special Reference to Countries in Transition; United Nations: Geneva, Switzerland, 2008. [Google Scholar]
  13. Bundesministerium für Arbeit, Soziales und Konsumentenschutz. Altern und Zukunft. Bundesplan für Seniorinnen und Senioren; Bundesministerium für Arbeit, Soziales und Konsumentenschutz; Altern und Zukunft: Vienna, Austria, 2013. [Google Scholar]
  14. Statistik Austria. Metadaten für Bevölkerung zu Jahresbeginn ab 2002 (Einheitlicher Gebietsstand 2022). Available online: https://statcube.at/statistik.at/ext/statcube/jsf/tableview/tableview.xhtml (accessed on 27 May 2023).
  15. Statistik Austria. Homepage. Gliederung Nach Städtischen und Ländlichen Gemeinden. Tabelle “Urban-Rural-Typologie Statistik Austria—Paket Bevölkerungsstand 2021”. Available online: http://www.statistik.at/web_de/klassifikationen/regionale_gliederungen/stadt_land/index.html (accessed on 28 May 2023).
  16. Statistik Austria. Homepage. Bevölkerungsprognosen. Available online: http://www.statistik.at/web_de/statistiken/menschen_und_gesellschaft/bevoelkerung/demographische_prognosen/bevoelkerungsprognosen/index.html (accessed on 26 October 2021).
  17. Österreichische Raumordnungskonferenz (ÖROK). 16. Raumordnungsbericht. Analysen und Berichte zur Räumlichen Entwicklung Österreichs 2018–2020; Schriftenreihe Band 209; ÖROK: Vienna, Austria, 2021. [Google Scholar]
  18. Bundesministerium für Soziales, Gesundheit, Pflege und Konsumentenschutz. Homepage. Demenz. Available online: https://www.sozialministerium.at/themen/pflege/demenz.html (accessed on 26 October 2021).
  19. Bundesministerium für Soziales, Gesundheit, Pflege und Konsumentenschutz (BSGPK). Österreichischer Pflegevorsorgebericht 2021. Wien. 2022. Available online: https://broschuerenservice.sozialministerium.at/Home/Download?publicationId=42&attachmentName=%C3%96sterreichischer_Pflegevorsorgebericht_2021_pdfUA.pdf (accessed on 30 May 2023).
  20. Statistik Austria. Pflegegeld. Available online: https://www.statistik.at/statistiken/bevoelkerung-und-soziales/sozialleistungen/bundespflegegeld (accessed on 30 May 2023).
  21. Statistik Austria. Personen in Anstaltshaushalten nach Geschlecht 2020 (Tabelle). Available online: https://www.statistik.at/statistiken/bevoelkerung-und-soziales/bevoelkerung/familien-haushalte-lebensformen/anstaltshaushalte (accessed on 30 May 2023).
  22. Republik Österreich. Die Neue Volkspartei. Die Grünen—Die Grüne Alternative. Aus Verantwortung für Österreich. Regierungsprogramm 2020–2024; Wien. 2020. Available online: https://www.dieneuevolkspartei.at/download/regierungsprogramm_2020.pdf (accessed on 26 October 2021).
  23. Stöglehner, G.; Manhart, V. Leitbilder in der Planung. In Grundlagen der Raumplanung 1. Theorien, Methoden, Instrumente; Stöglehner, G., Ed.; Facultas Universitätsverlag: Vienna, Austria, 2019; pp. 121–148. [Google Scholar]
  24. Fischer, T. Räumliche Disparitäten und Gleichwertige Lebensverhältnisse. In Grundlagen der Raumplanung 2. Strategien, Schwerpunkte, Konzepte, 1. Auflage; Stöglehner, G., Ed.; Facultas: Vienna, Austria, 2020; pp. 303–324. ISBN 978-3708917559. [Google Scholar]
  25. Österreichische Raumordnungskonferenz (ÖROK). Die Regionale Handlungsebene Stärken: Status, Impulse & Perspektiven; ÖROK-Schriftenreihe Nr. 208; ÖROK: Vienna, Austria, 2020. [Google Scholar]
  26. Bundesamt für Eich- und Vermessungswesen. Regionalinformation. Available online: https://www.bev.gv.at/services/produkte/kataster-und-verzeichnisse/regionalinformation.html (accessed on 20 October 2022).
  27. Österreichische Raumordnungskonferenz (ÖROK). Aufrechterhaltung der Funktionsfähigkeit ländlicher Räume—Dienstleistungen der Daseinsvorsorge und Regional Governance; ÖROK-Schriftenreihe Band 171; ÖROK: Vienna, Austria, 2006. [Google Scholar]
  28. Christaller, W. Die Zentralen Orte in Süddeutschland. Eine Ökonomisch-Geographische Untersuchung Über die Gesetzmäßigkeit der Verbreitung und Entwicklung der Siedlungen mit Städtischen Funktionen; Fischer: Jena, Germany, 1933. [Google Scholar]
  29. Van Meeteren, M.; Poorthuis, A. Christaller and “big data”: Recalibrating central place theory via the geoweb. Urban Geogr. 2018, 39, 122–148. [Google Scholar] [CrossRef]
  30. Mulligan, G.F.; Partridge, M.D.; Carruthers, J.I. Central place theory and its reemergence in regional science. Ann. Reg. Sci. 2012, 48, 405–431. [Google Scholar] [CrossRef]
  31. Humer, A.; Granqvist, K. The gradual city-ness and town-ness of public service locations: Towards spatially sensitive sector policies. Geoforum 2020, 113, 81–91. [Google Scholar] [CrossRef]
  32. Jobst, M.; Fischer, T. Approaching a Common Conscious Dataspace from a Data Provider Perspective—Requirements and Perspectives. In Computational Science and Its Applications—ICCSA 2022; Gervasi, O., Murgante, B., Hendrix, E.M.T., Taniar, D., Apduhan, B.O., Eds.; Springer International Publishing: Cham, Switzerland, 2022; pp. 333–343. ISBN 978-3-031-10449-7. [Google Scholar]
  33. StROG 2022—Gesetz vom 23. März 2010 über die Raumordnung in der Steiermark (Steiermärkisches Raumordnungsgesetz), LGBl. Nr. LGBl. Nr. 49/2010 idF LGBl. Nr. 84/22. Available online: https://www.ris.bka.gv.at/GeltendeFassung.wxe?Abfrage=LrStmk&Gesetzesnummer=20000069&FassungVom=2023-05-27 (accessed on 27 May 2023).
  34. BFGG 1993—Bundesgesetz, mit dem ein Pflegegeld Eingeführt wird (Bundespflegegeldgesetz), BGBl. Nr. 110/1993 idF BGBl. I Nr. 213/2022. Available online: https://www.ris.bka.gv.at/GeltendeFassung.wxe?Abfrage=Bundesnormen&Gesetzesnummer=10008859&FassungVom=2023-05-27 (accessed on 27 May 2023).
  35. PFG 2011—Bundesgesetz, mit dem ein Pflegefonds Eingerichtet und ein Zweckzuschuss an Die Länder zur Sicherung und zum Bedarfsgerechten Aus- und Aufbau des Betreuungs- und Pflegedienstleistungsangebotes in der Langzeitpflege für Die Jahre 2011 Bis 2023 Gewährt Wird (Pflegefondsgesetz), BGBl. I Nr. 57/2011 idF BGBl. I Nr. 9/2022. Available online: https://www.ris.bka.gv.at/GeltendeFassung.wxe?Abfrage=Bundesnormen&Gesetzesnummer=20007381&FassungVom=2023-05-27 (accessed on 27 May 2023).
  36. Gesamte Rechtsvorschrift für Pflegebedürftige Personen [Bund—Länder]—1993. Vereinbarung Zwischen dem Bund und den Ländern Gemäß Art. 15a B-VG über Gemeinsame Maßnahmen des Bundes und der Länder für Pflegebedürftige Personen Samt Anlagen, BGBl. Nr. 866/1993. Available online: https://www.ris.bka.gv.at/GeltendeFassung.wxe?Abfrage=Bundesnormen&Gesetzesnummer=10001280&FassungVom=2023-05-27 (accessed on 27 May 2023).
  37. Tiroler Heim- und Pflegeleistungsgesetz 2005—Gesetz vom 1. Februar 2005 über Heime für Hilfs-, Betreuungs- Oder Pflegebedürftige, Insbesondere ältere, Menschen, LGBl. Nr. 23/2005 idF LGBl Nr. 205/2021. Available online: https://www.ris.bka.gv.at/GeltendeFassung.wxe?Abfrage=LrT&Gesetzesnummer=20000318&FassungVom=2023-05-27 (accessed on 27 May 2023).
  38. Penchansky, R.; Thomas, J.W. The concept of access: Definition and relationship to consumer satisfaction. Med. Care 1981, 19, 127–140. [Google Scholar] [CrossRef] [PubMed]
  39. Donabedian, A. Models for Organizing the Delivery of Personal Health Services and Criteria for Evaluating Them. Milbank Meml. Fund Q. 1972, 50, 103. [Google Scholar] [CrossRef]
  40. Allan, D.P. Catchments of general practice in different countries—A literature review. Int. J. Health Geogr. 2014, 13, 32. [Google Scholar] [CrossRef] [PubMed]
  41. Villalobos Dintrans, P. Do long-term care services match population needs? A spatial analysis of nursing homes in Chile. PLoS ONE 2018, 13, e0199522. [Google Scholar] [CrossRef] [PubMed]
  42. You, N.; Shen, Z.; Nishino, T. Assessing the Allocation of Special Elderly Nursing Homes in Tokyo, Japan. Int. J. Environ. Res. Public Health 2017, 14, 1102. [Google Scholar] [CrossRef] [PubMed]
  43. Vaňková, I.; Vavrek, R. Evaluation of local accessibility of homes for seniors using multi-criteria approach—Evidence from the Czech Republic. Health Soc. Care Community 2021, 29, e21–e32. [Google Scholar] [CrossRef]
  44. Higgs, G.; Langford, M.; Llewellyn, M. Towards an understanding of inequalities in accessing residential and nursing home provision: The role of geographical approaches. Health Soc. Care Community 2022, 30, 2218–2229. [Google Scholar] [CrossRef]
  45. Vrabková, I.; Ertingerová, I.; Kukuliač, P. Determination of gaps in the spatial accessibility of nursing services for persons over the age of 65 with lowered self-sufficiency: Evidence from the Czech Republic. PLoS ONE 2021, 16, e0244991. [Google Scholar] [CrossRef] [PubMed]
  46. Lyseen, A.K.; Nøhr, C.; Sørensen, E.M.; Gudes, O.; Geraghty, E.M.; Shaw, N.T.; Bivona-Tellez, C. A Review and Framework for Categorizing Current Research and Development in Health Related Geographical Information Systems (GIS) Studies. Yearb. Med. Inform. 2014, 9, 110–124. [Google Scholar] [CrossRef]
  47. Greene, R.; Devillers, R.; Luther, J.E.; Eddy, B.G. GIS-Based Multiple-Criteria Decision Analysis. Geogr. Compass 2011, 5, 412–432. [Google Scholar] [CrossRef]
  48. Bradshaw, J.; Cookson, R.; Sainsbury, R.; Glendinning, C. (Eds.) Jonathan Bradshaw on Social Policy: Selected Writings 1972–2011; University of York: York, UK, 2013; ISBN 978-1-907265-22-8. [Google Scholar]
  49. McGregor, J.A.; Camfield, L.; Woodcock, A. Needs, Wants and Goals: Wellbeing, Quality of Life and Public Policy. Appl. Res. Qual. Life 2009, 4, 135–154. [Google Scholar] [CrossRef]
  50. Scholten, N.; Karbach, U.; Pfaff, H. Bedarfsgerechte Versorgung—Ein Überblick gängiger Definitionen. Public Health Forum 2016, 24, 6–8. [Google Scholar] [CrossRef]
  51. Bradshaw, J.R. A Taxonomy of Social Need. In Jonathan Bradshaw on Social Policy: Selected Writings 1972–2011; Bradshaw, J., Cookson, R., Sainsbury, R., Glendinning, C., Eds.; University of York: York, UK, 2013; pp. 1–11. ISBN 978-1-907265-22-8. [Google Scholar]
  52. Hämel, K.; Ewers, M.; Schaeffer, D. Versorgungsgestaltung angesichts regionaler Unterschiede. Z. Gerontol. Geriatr. 2013, 46, 323–328. [Google Scholar] [CrossRef] [PubMed]
  53. Sanford, A.M.; Orrell, M.; Tolson, D.; Abbatecola, A.M.; Arai, H.; Bauer, J.M.; Cruz-Jentoft, A.J.; Dong, B.; Ga, H.; Goel, A.; et al. An international definition for “nursing home”. J. Am. Med. Dir. Assoc. 2015, 16, 181–184. [Google Scholar] [CrossRef] [PubMed]
  54. Amt der Tiroler Landesregierung. Planungsverbände. Available online: https://www.tirol.gv.at/statistik-budget/statistik/regionsprofile/planungsverbaende/ (accessed on 20 September 2022).
  55. Bundesamt für Eich- und Vermessungswesen—BEV. Kartographisches Modell 1:500 000 Raster Stichtag 1 January 2023. Available online: https://data.bev.gv.at/geonetwork/srv/metadata/a350f1f1-48e2-4798-a6ac-6cac12a32906 (accessed on 27 May 2023).
  56. Österreichische Raumordnungskonferenz (ÖROK). Ergebnisse der ÖREK-Partnerschaft: “Strategien für Regionen mit Bevölkerungsrückgang”. Broschüre der ÖREK-Partnerschaft; Materialien Heft 6; ÖROK: Vienna, Austria, 2018. [Google Scholar]
  57. Gemeindeverband Bezirksaltenheime Lienz. Homepage. Available online: https://www.heime-osttirol.at/live/impressum (accessed on 29 May 2023).
  58. Amt der Tiroler Landesregierung. Zentrale Orte in Tirol. Available online: https://www.tirol.gv.at/fileadmin/themen/landesentwicklung/raumordnung/bilder/tiris/zentrale_orte_2010.jpg (accessed on 27 May 2023).
  59. Amt der Tiroler Landesregierung. Zentrale Orte in Tirol. Karte. Available online: https://www.tirol.gv.at/fileadmin/_migrated/content_uploads/zentrale_orte_2010_01.jpg (accessed on 20 October 2022).
  60. Amt der Tiroler Landesregierung. Strukturplan Pflege 2012–2022. Planungsgrundlage für Die Versorgung Betreuungs- und Pflegebedürftiger Personen in Tirol. 2012. Available online: https://www.tirol.gv.at/fileadmin/themen/gesellschaft-soziales/soziales/Publikationen/Evaluierungsbericht_zum_Strukturplan_Pflege_2012_-_2022.pdf (accessed on 28 May 2023).
  61. Amt der Tiroler Landesregierung. Strukturplan Pflege 2012–2022. Evaluierungsbericht 2017. Available online: https://www.tirol.gv.at/fileadmin/themen/gesellschaft-soziales/soziales/publikationen/evaluierungsbericht_zum_strukturplan_pflege_2012_-_2022.pdf (accessed on 27 May 2023).
  62. Google. Google Maps. Available online: https://www.google.at/maps/preview (accessed on 25 October 2022).
  63. Curry, E. Real-Time Linked Dataspaces; Springer International Publishing: Cham, Switzerland, 2020; ISBN 978-3-030-29664-3. [Google Scholar]
  64. Hadley, C. The Global Fundamental Geospatial Data Themes Journey. United Nations Committee of Experts on Global Geospatial Information Management. Available online: http://ggim.un.org/documents/fundamentaldatapublication.pdf (accessed on 29 May 2023).
  65. Scott, G.P. A National Strategic Geospatial Information Framework to Support the Implementation of the Sustainable Development Goals (SDGs). Available online: https://minerva-access.unimelb.edu.au/items/fa93bcfd-3331-5012-99e6-4d73580fe850/full (accessed on 28 May 2023).
  66. Bundesamt für Eich- und Vermessungswesen—BEV. Verwaltungsgrenzen (VGD) INSPIRE Stichtag 01.04.2022. Available online: https://doi.org/10.48677/bc4c5cb7-8698-4468-acac-39a114e7914e (accessed on 20 October 2022).
  67. Bundesamt für Eich- und Vermessungswesen—BEV. Serie ALS DTM Höhenraster 1m Stichtag 15.09.2021. Available online: https://doi.org/10.48677/63fd20c5-cd34-4d00-829f-a1fd380f6b4b (accessed on 20 October 2022).
  68. Bundesamt für Eich- und Vermessungswesen—BEV. Digitales Landschaftsmodell—Verkehr Stichtag 25.01.2023. Available online: https://doi.org/10.48677/ed8c11ce-c7e4-4d04-bf33-fcaabbaf1158 (accessed on 3 February 2023).
  69. Bundesamt für Eich- und Vermessungswesen—BEV. Digitales Landschaftsmodell—Bauwerke Stichtag 25.01.2023. Available online: https://doi.org/10.48677/0e36cab1-698a-42a7-b72d-9631d2d7ad28 (accessed on 3 February 2023).
  70. OpenStreetMap. OSM History Dump© OpenStreetMap Contributors. Available online: https://planet.openstreetmap.org/planet/full-history (accessed on 20 December 2022).
  71. OpenRouteService. Available online: https://openrouteservice.org (accessed on 10 January 2023).
  72. QGIS. Available online: https://www.qgis.org/en/site (accessed on 15 November 2022).
  73. Handbook on Governance Statistics (N.D.). Available online: https://www.ohchr.org/sites/default/files/Documents/Issues/HRIndicators/handbook_governance_statistics.pdf (accessed on 29 May 2023).
  74. Guidelines on Data Disaggregation for SDG Indicators Using Survey Data. (N.D.). Available online: https://www.fao.org/3/cb3253en/cb3253en.pdf (accessed on 29 May 2023).
  75. Adressregister. Available online: https://adressregister.gv.at/ (accessed on 10 January 2023).
  76. Patton, M.Q. Qualitative Evaluation and Research Methods, 2nd ed.; Sage: Newbury Park, CA, USA, 1990. [Google Scholar]
  77. Braun, V.; Clarke, V. Using thematic analysis in psychology. Qual. Res. Psychol. 2006, 3, 77–101. [Google Scholar] [CrossRef]
  78. Bundesministerium für Finanzen. Höhe des Pflegegeldes. Available online: https://www.oesterreich.gv.at/themen/soziales/pflege/4/seite.360516.html (accessed on 27 May 2023).
  79. Nestorová Dická, J.; Gurová, P. The sustainability of social care in Slovakia: Modelling the existing network of residential social facilities for future senior populations. Morav. Geogr. Rep. 2022, 30, 66–85. [Google Scholar] [CrossRef]
  80. Gesundheit Österreich GmbH. Österreichisches Gesundheitsinformationssystem. Available online: https://www.goeg.at/OEGIS (accessed on 27 May 2023).
  81. Mathis-Edenhofer, S.; Röthlin, F.; Wachabauer, D.; Haneef, R.; Ventura, I.; Fülöp, G. Regional health care profiles—An improved method for generating case studies on the catchment areas of envisaged primary health care units in Austria: A report to the InfAct Joint Action. Arch. Public Health 2022, 80, 50. [Google Scholar] [CrossRef]
  82. Fischer, T. Über die Wohnstandortwahl am altersbedingten Ende der Multilokalität und die Konsequenzen für Stadt und Land: Eine Reflexion anhand empirischer Befunde zu Österreich. In Jahrbuch StadtRegion 2021/2022. Stadt-Land-Relationen. Disziplinäre Spurensuchen; Schmidt-Lauber, B., Othengrafen, F., Pohlan, J., Wehrhahn, J., Eds.; Springer VS: Wiesbaden, Germany, 2022; pp. 89–113. ISBN 978-3-658-38941-3. [Google Scholar]
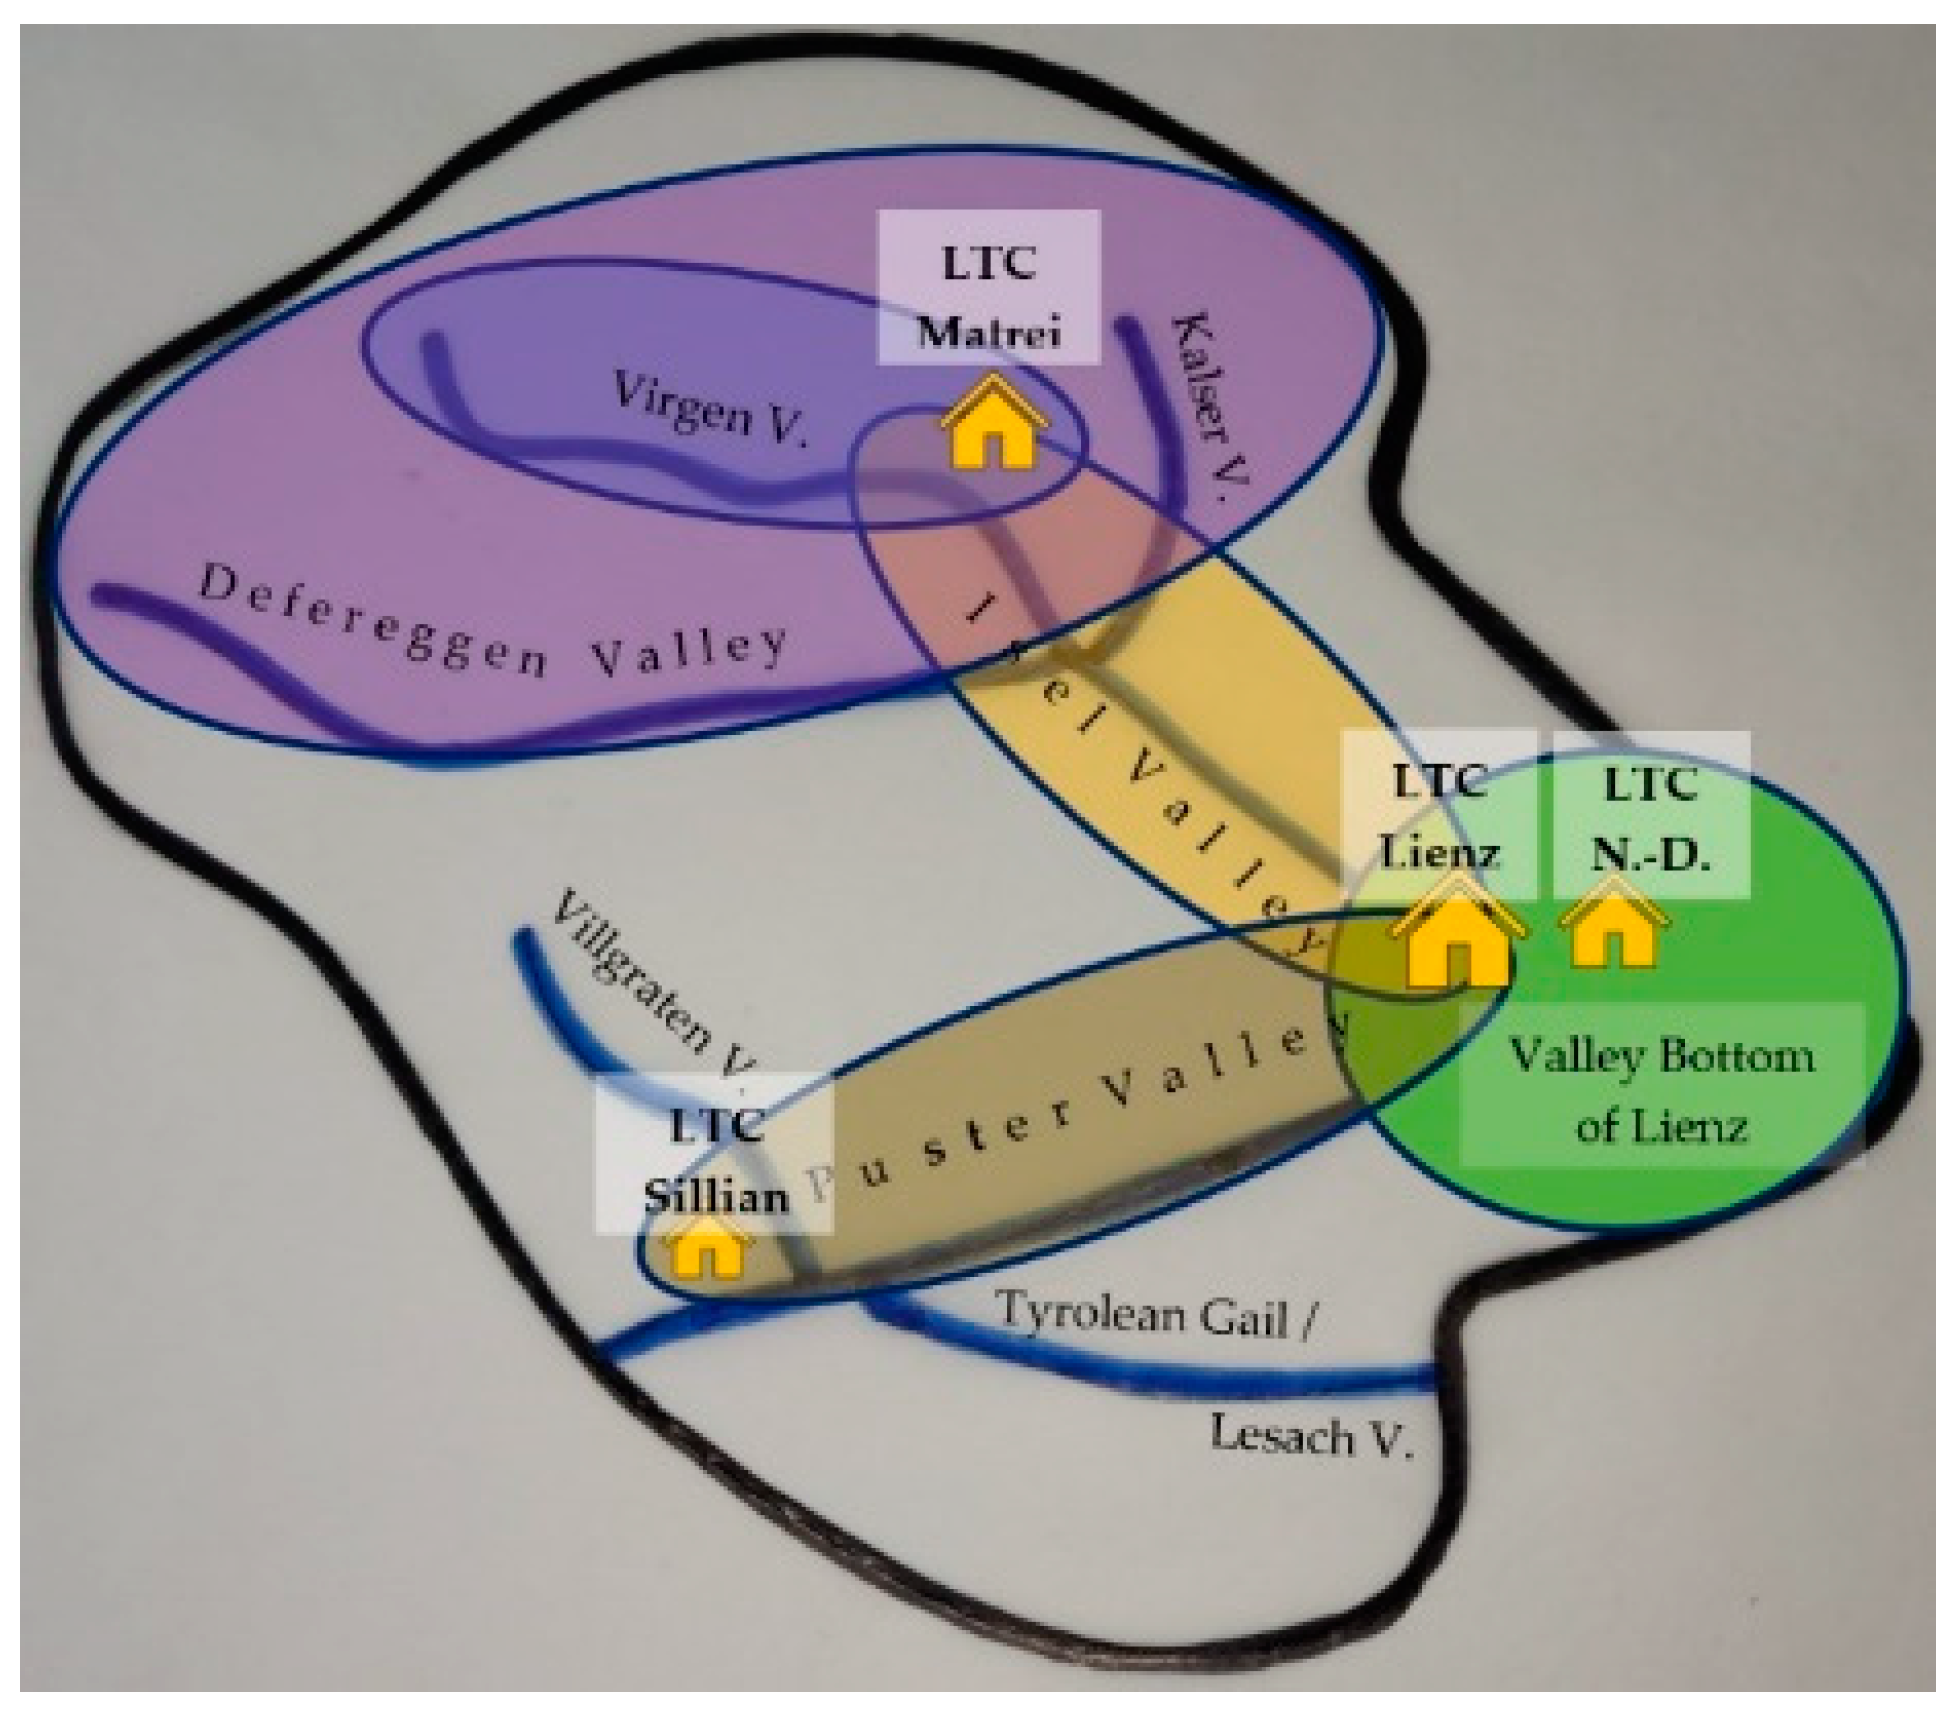
Figure 1. Location of East Tyrol in the wider area and location of the LTC in the case study region, based on BEV [55] (accessed on 27 May 2023).
Sustainability 15 14535 g001
Figure 2. Schematic illustration of the location of the LTC with regard to the centrality of the municipalities in East Tyrol.
Sustainability 15 14535 g002
Figure 3. Science–practice collaboration.
Sustainability 15 14535 g003
Figure 4. Schematic illustration of the hypotheses as a point of departure for the valley-based analysis.
Sustainability 15 14535 g004
Figure 5. Catchments related to LTC residents by planning associations (PAs).
Sustainability 15 14535 g005
Figure 6. Catchments related to LTC residents by (a) planning associations and (b) location municipalities.
Sustainability 15 14535 g006
Figure 7. Schematic illustration of the significant valley-related catchment areas in relation to LTC residents.
Sustainability 15 14535 g007
Figure 8. Catchments related to LTC applicants by planning associations (PAs).
Sustainability 15 14535 g008
Figure 9. Catchments related to LTC applicants by (a) planning associations and (b) location municipalities.
Sustainability 15 14535 g009
Figure 10. Schematic illustration of the significant valley-related catchment areas in relation to LTC applicants.
Sustainability 15 14535 g010
Table 1. The planning associations at a glance. Note: The spatial archetype classification of the municipalities is based on the urban–rural typology from Statistics Austria [15].
Name of Planning Association (PA)Total Number of Inhabitants (75+ in %)Comprises Parts of the Following ValleysNumber of MunicipalitiesSpatial Archetypes of MunicipalitiesName, Spatial Archetype and Centrality of LTC-Location Municipality
PA Isel Region11,542 (9.7)Virgen Valley, Kalser Valley, Defereggen Valley, Isel Valley8rural
(5 out of 8 peripheral)
Matrei
rural
low centrality
PA East Tyrolean Oberland8993 (10.5)Villgraten Valley, Tyrolean Gail/Lesach Valley10rural
(6 out of 10 peripheral)
Sillian
rural, peripheral
low centrality
PA Valley Bottom of Lienz28,283 (11.1)Isel Valley, Valley Bottom of Lienz15urban/rural
(9 out of 15 urban)
Lienz, Nußdorf-Debant
small urban centres
intermediate,
low centrality
Table 2. Overview of hypotheses for valley-based analysis of LTC residents and LTC applicants.
QuestionsExact Wording
question 1 (Q1)Is there a significant difference in the number of people who previously lived in Valley Bottom of Lienz now reside in LTC Lienz and LTC Nußdorf-Debant compared to the other LTCs?
question 2 (Q2)Is there a significant difference in the number of people who previously lived in Villgraten Valley now reside in LTC Sillian compared to the other LTCs?
question 3 (Q3)Is there a significant difference in the number of people who previously lived in Tyrolean Gail/Lesach Valley now reside in LTC Sillian compared to the other LTCs?
question 4 (Q4)Is there a significant difference in the number of people who previously lived in Defereggen Valley now reside in LTC Matrei compared to the other LTCs?
question 5 (Q5)Is there a significant difference in the number of people who previously lived in Kalser Valley now reside in LTC Matrei compared to the other LTCs?
question 6 (Q6)Is there a significant difference in the number of people who previously lived in Virgen Valley now reside in LTC Matrei compared to the other LTCs?
question 7 (Q7)Is there a significant difference in the number of people who previously lived in Villgraten Valley as well as in Tyrolean Gail/Lesach now reside in LTC Matrei compared to the other LTCs?
question 8 (Q8)Is there a significant difference in the number of people who previously lived in Defereggen Valley, Kalser Valley and Virgen Valley now reside in LTC Matrei compared to the other LTCs?
question 9 (Q9)Is there a significant difference in the number of people who previously lived in Puster Valley now reside in LTC Sillian and LTC Lienz compared to the other LTCs?
question 10 (Q10)Is there a significant difference in the number of people who previously lived in Isel Valley now reside in LTC Matrei and LTC Lienz compared to the other LTCs?
Disclaimer/Publisher’s Note: The statements, opinions and data contained in all publications are solely those of the individual author(s) and contributor(s) and not of MDPI and/or the editor(s). MDPI and/or the editor(s) disclaim responsibility for any injury to people or property resulting from any ideas, methods, instructions or products referred to in the content.

