Article

Greener Neighbourhoods Show Resilience to the Spread but Not Severity of COVID-19 Infection in South Africa

Department of Geography, Environmental Management and Energy Studies, University of Johannesburg, Auckland Park 2006, South Africa
*
Author to whom correspondence should be addressed.
Sustainability 2023, 15(19), 14508; https://doi.org/10.3390/su151914508
Submission received: 27 August 2023 / Revised: 22 September 2023 / Accepted: 3 October 2023 / Published: 5 October 2023
(This article belongs to the Special Issue Health, Wellbeing and Environmental Benefits of Contact with Nature)

Abstract

:
The outbreak of COVID-19 quickly spread around the globe, with staggering infection and mortality rates. Given the reported benefits of greenness to human health, we hypothesized that greener neighbourhoods would suffer less from COVID-19 infection and severity than not. We modelled COVID-19 infection and severity in South Africa by fitting Generalized Linear Mixed Effects models to various socio-demographic and greenness data (EVI, i.e., Enhanced Vegetation Index, and tree and grass covers) collected from January 2020 to June 2022 at local municipalities, Wards, and districts scales. We found that income level showed a significant negative association with COVID-19 prevalence at the Ward level, suggesting that poorer neighbourhoods are more susceptible to COVID-19 infection. We also found that EVI and tree cover consistently showed a significant negative correlation with COVID-19 infection rate, irrespective of the scale of analysis, whereas grass cover showed a similar pattern but only at the Ward scale. Finally, we found that neither EVI, grass cover, nor tree cover showed a significant association with COVID-19 severity. Overall, greener neighbourhoods show greater resilience to the spread of COVID-19, suggesting that exposure to greenness may boost natural killer cells in the human body, thus reinvigorating our defence system against infections. Our results re-enforced the need to establish and preserve greens paces particularly in the developing world, given their ability to buffer the spread of COVID-19.

1. Introduction

The COVID-19 pandemic, which, in 2019, had its epicentre in Wuhan, China, quickly spread across the globe with tremendous epidemiological impacts. As of 25 March 2020, half a million of infection cases were confirmed globally, and approximately 20,000 deaths were recorded [1]. By 30 August 2022, the spread and epidemiological impacts had grown exponentially, reaching 599,071,265 confirmed cumulative cases and 6,467,023 cumulative deaths globally [2]. On the 4 June 2022, South Africa, the hardest-hit country in Africa by the pandemic, had recorded 3.9 million COVID-19 cases and a total of 101,313 COVID-19-related deaths [3].
In response to the pandemic, various non-pharmaceutical preventative measures were taken by different countries around the world (e.g., social distancing, lockdown, working-from-home regulations, self-isolation and quarantine, etc.; [4,5,6]). Although these measures showed the expected outcome, which was to curb the spread of the COVID-19 infections [7,8], their implementations could not be indefinitely advocated for, given the associated socio-economic consequences, such as psychological damages [9] and economic losses [10]. These non-pharmaceutical preventative measures also had various negative impacts on human health and wellbeing, such as increased or worsening levels of anxiety and depression or mental health [11]. For example, the confinement or lockdown regulations put in place aggravated the already-poor mental health conditions of low-income communities due to extended periods of social isolation [12]. Additionally, selected demographic groups, including the elderly and people living with comorbidities, showed more vulnerability to COVID-19 severity [13,14]. COVID-19 severity refers to the extreme symptoms or consequences of the disease that result in hospitalisation or even death.
In the current study, we propose that greenness, measured as the quantity of available terrestrial vegetation in a given area, would be linked to COVID-19 infection and severity rates [15,16,17,18]. This expectation is grounded on several services that greenness provides to humans. Firstly, as COVID-19 largely affects the human respiratory system, leading to a poor oxygen provision to the body, the ecosystem services provided by greenness [19,20], particularly, air purification and massive O2 production through photosynthesis, alongside boosted immune systems [21], are expected to maximise the resilience of communities in greener neighbourhoods against COVID-19 infection [16,17,18,19,20,21,22,23] and its severity ([16,24,25]; but see [17]). Secondly, recent studies reported that exposure to high levels of air pollution is linked to developmental defects in new-born babies, and these defects increase the risk of abnormal respiratory functions and cardiovascular diseases, which are some of the major comorbidities that magnify COVID-19 impacts [26]. Also, increased air pollution, particularly from particulate matters (PM2.5) and ozone (O3), subtend a sharp increase in hospitalisations due to cardiovascular diseases [27]. Interestingly, greater greenness has been linked to lower level of air pollution [28]. Furthermore, human exposure to greenness boosts natural killer cells in the human body, thus reinvigorating our defence system against viruses [1,21]. Additionally, greenness is reported to improve our mental health by providing opportunities for socializing, physical, and recreational activities, thus contributing to lowering some of the emotional distresses inherent to the COVID-19 infection. For example, early studies demonstrated that access to greenness through green spaces correlated with the reduction in some of the comorbidities (e.g., [29]) that heightened the severity of COVID-19 impacts, such as mental health, risk of mortality, depression, obesity, diabetes, and cardiovascular diseases (see meta-analysis in [18]).
Although evidence of positive effects of greenness on human health conditions in general is abundant, we know little about the efficacy of its benefits to humans in the context of the ongoing deadly COVID-19 pandemic. Also, what we know today originates mostly from one country [18], the United States of America (USA, [16,17,23,25,30]). For example, Jiang et al. [22] reported that forested neighbourhoods in the USA exhibit lower COVID-19 infection rates, but more so in forested areas outside parks. Also, recent studies quantified the link between greenness and COVID-19 infection in the USA and showed that an increase in NDVI (Normalized Difference Vegetation Index) by 0.1 yielded a decrease in COVID-19 infection rate by 6% [23], or a decrease by 4.1% specifically in the USA urban areas [16]. Interestingly, Russette et al. [25] reported a noticeable reduction in COVID-19-induced mortality rate in greener regions of the USA (see also [17,18]).
Given that most of our knowledge linking greenness to COVID-19 infection, mortality rate, and severity is from the developed world [18], several questions are worth investigating. First, is the reported negative relationship between greenness and COVID-19 infections in urban areas of the developed world similar across the globe, especially in hardest-hit countries or in the developing world? This question is worth investigating since urban planning is not the same from country to country, and human behaviour towards green spaces is not the same, especially in the developed vs. developing world. Second, do the positive effects of greenness reported on human health depend on vegetation metrics used? This too is an important question to investigate, given that different metrics capture different facets of vegetation, and knowing which facets of vegetation (e.g., EVI or tree versus grass cover) exert positive effects on human health in the context of COVID-19 may inform not only the prioritization of green space construction but also the types of green spaces to establish in urban areas. Specifically, greenness metrics were variously defined in different studies. A recent study advocated for UGS spatial pattern metrics as the best approach of reporting greenness [31]. Earlier studies advocated for the use of normalized difference vegetation index (NDVI, [16,23,32]), annual population-weighted vegetation [24], total areas of urban green spaces (UGS) and forests [22], UGS coverage areas (measured as the ratio of UGS area to total area) [33,34,35], street greenness [36], and the ratio of green-blue areas [36]. Studies that employed these greenness metrics at different spatial scales reported negative relationships between greenness and COVID-19 infections. From recent studies, we know that trees rather than any other plant lifeforms are critical in buffering against high infection and mortality rates of COVID-19 [22]. Other studies defined greenness differently, employing, for example, natural area coverage (the ratio of natural area to total area) [37], UGS density [38,39], and Visible Green Index [40], and these studies reported positive correlations with COVID-19 infection rates. The mismatch in the findings across different studies could be the facts of inconsistent metrics and spatial scales of analyses as well as stages of the COVID-19 pandemic [18,31].
Furthermore, the relationships of the spatial patterns or spatial arrangements of greenness with COVID-19 infections are not yet abundantly investigated [31]. For example, some studies reported that exposure to small continuous UGS (parks) correlates with less COVID-19 infection [41], whereas high spatial connections of public UGS correlates with risk of infection [42]. The question of interest in the present study is: Is the effect of greenness on COVID-19 infection rate detectable at administrative spatial scales? Our expectations are that the effects of greenness would be felt more at a finer scale than at a larger scale because studies that used finer spatial scales show stronger correlations of greenness in human health [16,18,43].
Finally, most studies that investigated the associations between greenness and COVID-19 focus heavily on greenness in urban areas and on COVID-19 infection rates (e.g., [12]). Such studies were conducted in the US [22,34,35], China [32,39], South Korea [33], and Hong Kong [38], with very rare studies exploring the associations at a country level [24] and on COVID-19 severity (e.g., [17,18]). It is, therefore, clear that the vast majority of studies that investigated the associations were conducted in countries that have a high levels of economic and technological development. More concerning is the evidence that we know nothing about the potential relationships between greenness and COVID-19 in the less-developed world.
In the present study, we collected countrywide data on COVID-19 infection and severity in South Africa along with relevant socio-demographic variables across the entire country to investigate whether greenness correlates with COVID-19 infection and severity. Specifically, we ask: Does greenness correlate with COVID-19 infection and severity in the context of South Africa? Our hypothesis was that greener areas would be resilient to the spread of COVID-19 infection rate and severity. South Africa was the hardest-hit country in Africa by the pandemic, and, therefore, it provides us with a unique opportunity to investigate the influence, if any, of greenness on the spread of the virus. South Africa is also the epicentre of some variants of the virus, thus making it an excellent case study.

2. Materials and Methods

2.1. Data Collection

Study Area—This study covers the entirety of South Africa. South Africa is an upper middle-income country located at the southern-most tip of the African continent, with an estimated population of 60.6 million people in 2022 [44]. The majority of the population is concentrated in just three of the nine provinces of the country, namely, Gauteng, KwaZulu Natal, and Western Cape. South Africa’s demographic profile is also characterised by dense urban populations that continue to increase due to rural–urban migration [45]. Consequently, the three highly populated provinces, which also serve as the biggest economic hubs of the country, have the highest population densities, especially in and around urban areas.
Greenness in South Africa is unique in several aspects. First, it is exceptionally rich in plant species and biomes. For example, 24,000 vascular plant species are documented in the country [46,47], and this could be ~26,000 [48], which is roughly 10% of the world’s flora. Also, South Africa’s greenness spreads across nine different biomes [49], including Albany Thicket, Desert, Forest, Fynbos, Grassland, Indian Ocean Coast Belt, Nama Karoo, Savanna, and Succulent Karoo biomes [50]. The Savanna, Grassland, and Nama Karoo biomes occupy the largest surface areas. Furthermore, the uniqueness of the greenness of South Africa is in the country hosting not only three biodiversity hotspots (Cape Floristic Region, Succulent Karoo, and Maputaland–Pondoland–Albany hotspot; [46]) but also one of the six world floral kingdoms in its entirety—the Cape Floral Kingdom—which is the smallest but richest floral kingdom of the world [46,51]. Overall, South Africa has enough greenness (vegetation) with which to investigate potential associations between greenness and COVID-19 infection and severity.
Administrative Demarcation System in South Africa—Two administrative units, municipal wards (small) and local municipalities (large), are used to test the impact of spatial scale. A municipal ward (henceforth Ward) is the smallest administrative unit in the South African geo-administrative demarcation system, which is followed, in increasing spatial scale, by local municipality, district municipality, and province. There are currently 4429 Wards, 226 local municipalities, 44 district municipalities (henceforth districts), and 9 provinces in South Africa. The administrative demarcation (shapefiles) and surface area data (in square kilometres) for local municipalities and Wards were obtained from the Municipal Demarcation Board (https://www.demarcation.org.za/, accessed on 11 June 2022).
Socio-demographic Data—We retrieved data describing population size (total number of people in an area), revenue per capita (in Rand per person), and proportion of population over the age of 65 years (percentage). These data were retrieved from the Local Government Handbook: South Africa portal (https://municipalities.co.za/, accessed on 2 July 2022). Population density was calculated by dividing the total population by the total surface area of a given administrative unit. Population density is included as a predictor of COVID-19 infection, assuming that higher population density is more likely conducive to more COVID-19 infections. Annual revenue, however, is included on the basis that COVID-19 infection rate is higher in low-income communities than not [16]. The inclusion of the “proportion of population over the age of 65 years” is justified by the evidence that older people are more likely to experience severe symptoms of COVID-19 than younger people [52].
All these socio-demographic data were extracted at the local municipality level. Some of these variables (i.e., age, revenue per capita, population) are not available at the Ward level. For those variables, we used the local-municipality-level data in the modelling of our response variable at the Ward level, given that local municipality is simply a spatially defined set of Wards.
COVID-19 Data—The COVID-19 data, i.e., number of positive cases as well as infection severity in each local municipality and each Ward, were retrieved from the South African COVID-19 online portal (https://sacoronavirus.co.za/COVID-19-daily-cases/, accessed on 4 June 2022). The number of COVID-19 cases was cumulative over time, and infected individuals were recorded only once (people who tested positive for COVID-19 more than once were not re-counted). The data covered 4351 Wards in 212 local municipalities across 44 districts in 9 provinces. Due to data unavailability for some of these administrative units, 78 Wards and 14 local municipalities were excluded from this study.
COVID-19 infection was measured in three ways: number of positive cases in each administrative unit (local municipality and Wards), number of positive cases per surface area of an administrative unit, and number of positive cases per population of the administrative unit. The number of cases per population was calculated by dividing the number of total COVID-19 cases by the total population in each Ward or each local municipality, and cases per surface area were calculated by dividing the number of COVID-19 cases by the surface area (km2) of the Ward or local municipality. The cases per surface area were then rounded-off to the nearest integer prior to further analysis (modelling).
Severity was defined as hospitalisation rate (see also [17]), assuming that hospitalisation is a proxy of severe infection (not all positive cases need hospitalisation; if one has to be hospitalised, this means that the case is a severe one). Severity data were available at district level and represented the cumulative number of COVID-19 hospitalisations as of 1 June 2022 (https://www.nicd.ac.za/diseases-a-z-index/disease-index-COVID-19/surveillance-reports/daily-hospital-surveillance-datcov-report/; accessed on 4 June 2022). In this study, we measured COVID-19 hospitalisation in three ways: number of hospitalisations in each administrative unit (local municipality and Wards), number of hospitalisations per surface area of the administrative unit, and number of hospitalisations per population of the administrative unit. The number of hospitalisations per population was calculated by dividing the number of total COVID-19-related hospitalisations by the total population in each Ward or each local municipality, and hospitalisations per surface area were calculated by dividing the number of COVID-19-related hospitalisations by the surface area (km2) of the Ward or local municipality. Hospitalisations per surface area were then rounded-off to the nearest integer prior to further analysis (modelling).
Vegetation Landcover or Greenness Data—Landcover data were retrieved from two sources: the South Africa’s Department of Forestry, Fisheries, and the Environment (DFFE) (https://egis.environment.gov.za/data_egis/data_download/current, accessed on 27 June 2022) and from Moderate Resolution Imaging Spectroradiometer (MODIS) imagery (https://ladsweb.modaps.eosdis.nasa.gov/search/, accessed on 26 June 2022). The processing of spatial data was performed in QGIS version 3.26.0 (https://www.qgis.org/en/site/, accessed on 26 July 2023), as explained below.
Department of Forestry, Fisheries, and the Environment (DFFE)—The South African National Land Cover Geographic Dataset, which was published by DFFE in June 2021, contains raster-based landcover data with spatial references. The dataset has a 20 m spatial resolution and represents data that were collected during the period from 1 January 2020 to 31 December 2020. The data were divided into 260 different land cover classes covering nine broad landcover types: forested land, shrubland, grassland, waterbodies, wetlands, barren land, cultivated land, built-up land, and mines and quarries. We reclassified the landcover classes to isolate tree and grass landcovers using the Reclassify by Table function in the Raster Analysis tool in QGIS. This was performed in two ways—firstly, the original dataset was reclassified into two classes, tree cover (coded as “1”) and non-tree cover (coded as “0”). Secondly, the process was repeated using the original dataset to isolate grass cover by reclassifying grassland and shrubland landcover types (coded as “1”) and other classes as non-grass (coded as “0”). To quantify the proportion of tree landcover type (in percentage) in each spatial scale (i.e., local municipality and Ward), the sum of cells that represented tree cover (coded = 1) were divided by the total number of cells in each administrative unit and then multiplied by 100. The process was repeated for grass cover data to obtain the proportion of grass cover type in each spatial unit.
Moderate Resolution Imaging Spectroradiometer (MODIS)—Satellite imagery containing vegetation index, specifically Enhanced Vegetation Index (EVI), with a 250 m spatial resolution was extracted from MODIS. This raster-based satellite imagery contained country-level data about greenness (measured monthly). We extracted data on greenness over a 30-month period from January 2020 to June 2022. This period represented the duration of the pandemic in South Africa up to the date of data collection for the current study (4 June 2022). A layer representing the average greenness for the 30-month period was created by dividing the sum of all the layers by 30 using the raster calculator tool in QGIS. The resultant layer was then multiplied by a scale factor of 0.0001 to obtain EVI values ranging from −1 to +1, as per the product specifications (https://lpdaac.usgs.gov/products/mod13q1v061/, accessed on 26 June 2022). The Zonal Statistics tool in the QGIS platform was used to calculate the mean values for EVI in each administrative unit (local municipality and Ward). The zonal statistics were calculated using vector-based shapefiles for South Africa’s local municipalities and Wards, which were obtained from the Municipal Demarcation Board (https://www.demarcation.org.za/, accessed on 26 July 2023). The data were then saved as an Excel document using the export function in QGIS.
All data collected were included in this manuscript as Appendix A.

2.2. Data Analysis

Data Rescaling—The landcover/vegetation variables (i.e., mean values for EVI, as well as grass and tree covers) along with socio-demographic factors (i.e., age, population density, and revenue per capita) were measured in different scales; therefore, they were rescaled using the following formula before further analysis:
rescaled variables = (observation − mean)/standard deviation.
Rescaling was conducted in Microsoft Excel 2016.
Mixed Effect Modelling—All our analyses were performed in R v.4.1.2 [53] (see R script in Appendix B). Greenness was measured in two ways: mean EVI and vegetation type cover (tree cover versus grass cover).
We modelled COVID-19 infection rates and infection severity. Our response variable “COVID-19 infection rate” was defined in three ways: number of COVID-19 positive cases, number of cases per population (proportion of infection), and number of cases per surface area (density of infection). Our response variable “severity” was measured as number of hospitalisations, defined as number of hospitalised people, proportion of hospitalised people, and number of hospitalised people per surface area (density of hospitalisations). Our models followed a nested and split plot approach [54] to correct for the spatial non-independence of our response variables. In this nested and split plot, local municipality was nested within district, nested within province. Therefore, we modelled COVID-19 infection rate and severity by fitting generalized linear mixed models (GLMMs) and extensions built on Template Model Builder, as implemented in the R library GlmmTMB [55].
To this end, the R function glmmTMB was used for our modelling since this allowed us to specify a wide range of statistical distributions (binomial, beta, negative binomial, …) and zero-inflation [55] depending on the type of response variables. Specifying the appropriate family in a model is meant to account for the errors inherent to the type of data analysed. As such, we specified the family negative binomial in our models while modelling the COVID-19 infection rate as the number of COVID-19 cases (count data; [56]), the family beta while modelling COVID-19 infection as proportion [57], and the family negative binomial while modelling COVID-19 infection as “density of infection”, which was measured as the number of COVID-19 cases per surface area (rounded off to the nearest integer).
In addition to the variable “greenness”, three other variables known to predispose to COVID-19 infection and severity were included in the models as confounders. The first one was population density. This was because COVID-19 infection rate was expected to be higher in densely populated areas due to increased chances of human-to-human contact [58]. The second was the proportion of the population that was over 65 years of age (variable “age”). This was because older people were particularly vulnerable to the disease due to age-driven weakened immune systems [59]. The last one was revenue. We included the revenue per capita in each unit (variable “revenue”) on the basis that low-income communities are naturally more predisposed to COVID-19 than not [16], given their overcrowded living arrangements and limited access to quality healthcare [60]. To test for multicollinearity among predictors, the variance inflation factor (VIF) was calculated, and variables with VIF > 5 (rules of thumb) were considered as highly collinear. For all variables, we found no multicollinearity (VIF < 5), except for age (VIF = 6.94) and population density (VIF = 6.92) only at local municipality. This was addressed by excluding age from the model of our response variables at the local municipality scale.
A total of 27 models were fitted (covering all possible combinations of the predictor and response variables, Table S1). In each analysis, conducted at either a district or Ward scale, age, revenue per capita, and population density were added as confounding variables. At local municipality scale, only revenue per capita and population density were included as confounding variables. Age was excluded to eliminate multicollinearity between the predictor variables. In the proportion of infection data at Ward scale, there were a lot of zeros. Therefore, this was corrected by specifying a zero-inflation extension modelling “proportion of infection” at the municipal ward scale.
Finally, we used the Akaike Information Criterion (AIC) to compare the goodness of fit of all fitted models of the different response variables (i.e., number of infections, proportion of infections, and infections per surface area).

3. Results

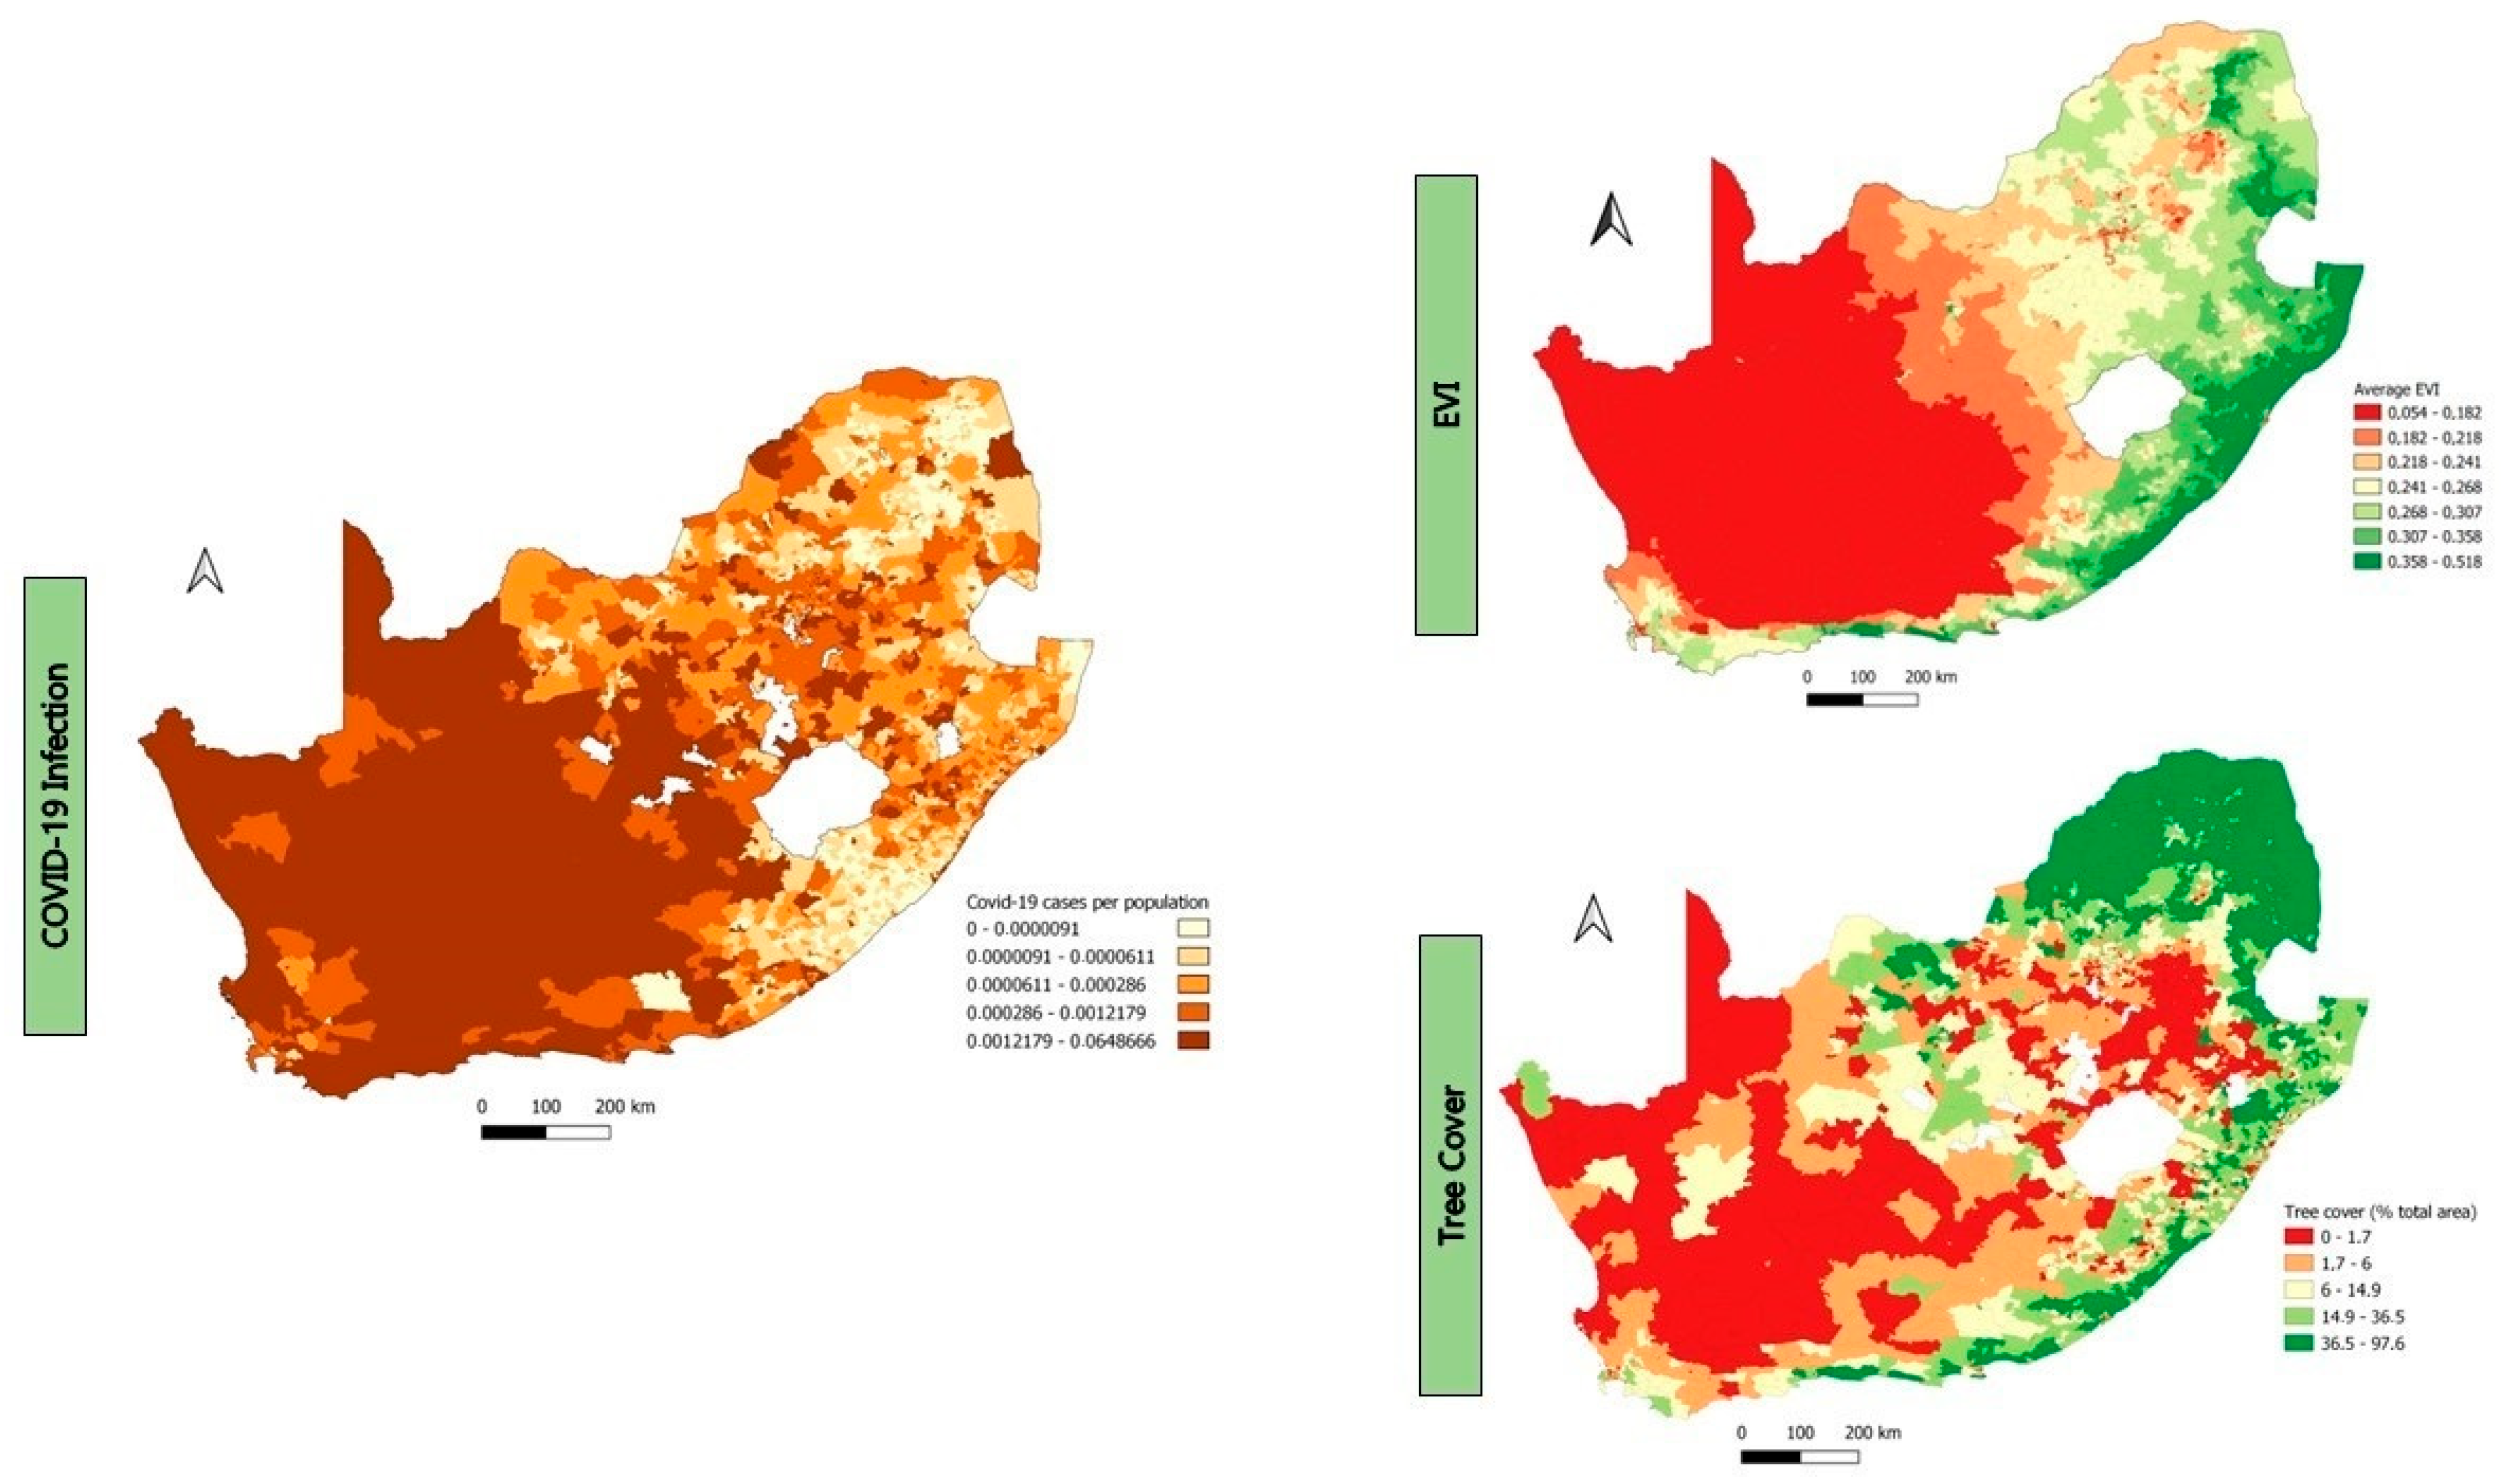
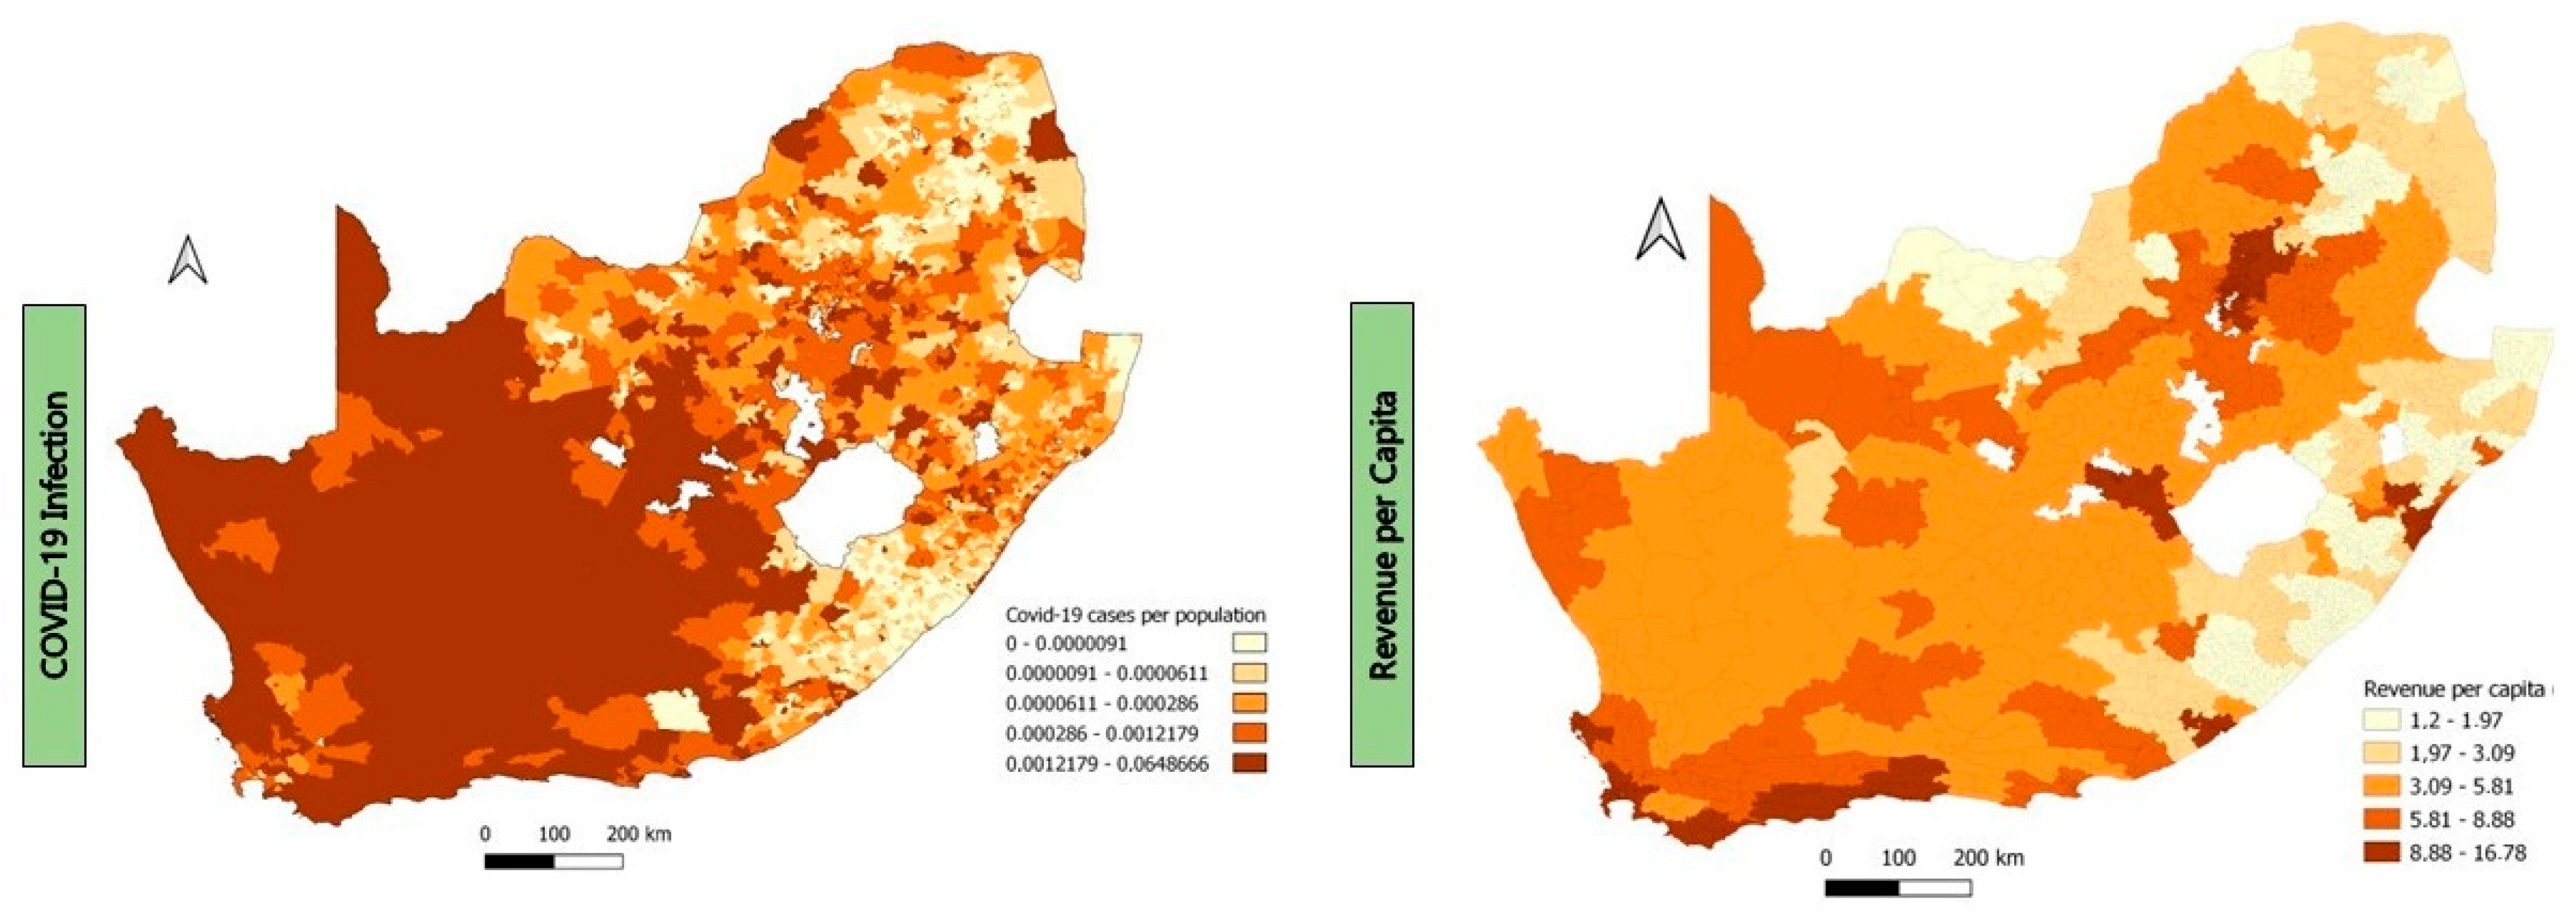
3.1. The Relationship between Greenness and COVID-19 Infection

At the local municipality scale, the AIC values of all models were always the lowest when COVID-19 infection was measured as a proportion of infections (AIC ≤ −1387) compared to the number of infections (AIC ≤ 3707.5) or infections per surface area (AIC ≤ 503) were used (Table S2). We, therefore, report our findings of the models of the proportion of COVID-19 infection here. When measured as EVI, greenness (β = −0.32 ± 0.06, p < 0.001; Table 1) showed a significant negative correlation with infection. Furthermore, when greenness was measured as vegetation type, only tree covers (and not grass cover) predicted infection (β = −0.287 ± 0.065, p < 0.001; Table 1). In each case, revenue per capita was the only confounding factor that significantly predicted infection (p < 0.001).
At the Ward scale (smaller than local municipality), the models of proportion of infection always presented the best fit for our data (AIC ≤ −46921, Table S2) and, therefore, remained the models we focused on. In these models, EVI shows a significant negative relationship with COVID-19 infections (β = −0.219 ± 0.06, p < 0.001, Table 2). In addition, when greenness was measured as vegetation type, both tree cover (β = −0.1 ± 0.05, p = 0.03) and grass cover (β = −0.447 ± 0.06, p < 0.001) correlated strongly and negatively with COVID-19 infections (Figure 1).
Across all models, revenue per capita always strongly correlates negatively with infection (p < 0.001, Figure 2), whereas age never shows a significant correlation with infection. Population density shows a strong association with infections (β = −1.246 ± 0.55, p < 0.02) only when greenness is measured as grass cover.

3.2. The Relationship between Greenness and COVID-19 Severity

We modelled the relationships between greenness and infection severity measured as hospitalisation rate at district municipality level. Again, models of proportion of hospitalisation showed the smallest AIC value (AIC ≤ −373.8, Table S3). We found that neither EVI (β = −0.123 ± 0.09, p = 0.19), tree cover (β = −0.17 ± 0.11, p = 0.11), nor grass cover (β = 0.103 ± 0.11, p = 0.35) correlated significantly with COVID-19 severity (Table 3). However, age consistently showed a strong negative correlation with COVID-19 severity in each model (p < 0.04). Population density had a strong positive association with COVID-19 severity (β = 0.344 ± 0.17, p = 0.038) in the model where greenness was measured as grass cover, whereas revenue per capita strongly correlated with COVID-19 severity (β = 0.352 ± 0.16, p = 0.026) in a model where greenness was measured as EVI.

4. Discussion

4.1. Greenness versus COVID-19 Infection Rate at Local Municipality Level

At local municipality level, we found that EVI significantly correlated negatively with COVID-19 infection. This negative correlation implied greater resilience of greener areas against the spread of infection (see further details below in the discussion of observed patterns at Ward level). Interestingly, we also found a significant negative correlation of tree covers (and not grass cover) with COVID-19 infection, suggesting that the negative relationships between greenness and infection may be driven mostly by trees. Indeed, forested areas were recently reported to correlate with low COVID-19 infection rate (e.g., [16]), most likely due to the capacity of forests to improve environmental quality through reduction in air and noise pollution, heat absorption, etc. [61,62].
However, some studies (two so far) reported significant positive correlations between greenness and infection [5,42]. In those two studies, greenness was simply approximated. For example, Huang et al. [5] estimated greenness as “green space density” which is the proportion of all grass cover, shrubland, and woodland covers in the spatial Unit used in the study, and they correlated this with infection risk measured as “venue density” (number of venues or building visited by confirmed COVID-19 positive cases). In this context, the positive correlation they found simply suggested that green space may attract more visitors, including those tested positive, for outdoor activities, thus leading to a positive correlation [5]. In their study, Pan et al. [42] correlated COVID-19 infections with accessibility of public green spaces, and the positive correlation they found suggested that easy access to green spaces increased the risk of infection spread. In both studies, the total amount of greenness was not directly measured (selected vegetation covers in Huang et al. [5] and green space accessibility in Pan et al. [42]), implying that the proxy of greenness used in those two studies may not fully capture the amount of vegetation required for a negative correlation with infection. In the present study, the total amount of greenness was directly measured (EVI), and the significant negative correlation we found may suggest that it is better to measure the total amount of greenness rather than using proxies if we are to detect any link between greenness and COVID-19 infection rate.

4.2. Greenness versus COVID-19 Infection Rate at Ward Level

At the Ward level, which is our finer spatial scale (compared to local municipalities), what is more interesting is that all sorts of metrics used to define greenness (EVI, tree cover, and grass cover) strongly correlate negatively with COVID-19 infection. The potential role of grass cover in relation to human wellbeing seems controversial. An early study reported that grasses do not predict human health conditions [63], whereas Yu et al. [64] found that grasses in urban environment are actually detrimental to children’s health (e.g., asthma). Our findings in the present study indicate that not only trees but also grass cover is beneficial to humans in the context of COVID-19. The effects of grass cover, if any, may depend on the types of diseases investigated (e.g., asthma, COVID-19, etc.), thus calling for a meta-analysis to clarify the matter.
Our finding that all sorts of metrics used to define greenness correlate with COVID-19 infection rate at Ward level means that greenness seems to be more effective in influencing the patterns of COVID-19 infection at finer scale. Indeed, working at a finer scale in urban areas of the US, Spotswood et al. [16] reported that COVID-19 inflicted the lowest burden on communities living in greener areas (see also [17]). There are several lines of arguments subtending this negative relationship of greenness with COVID-19 infection. First, exposure to greenness improves human health conditions, e.g., physical and mental health as well as human well-being through the provision of opportunities for physical activities and recreations [15,20,65]. Furthermore, greenness may assist human body in the fight against the virus, and this assistance may be mediated through NK (Natural Killers) cells. These are lymphocyte cells of the innate immune system that limit the spread of microbial and viral infections by attacking and eliminating virus-infected cells [66]. Evidence suggests that the efficiency of the NK cells is boosted with human frequent contacts with greenness [21]. Also, higher air pollution and temperature is reported in areas with less greenness and especially with fewer trees, and such polluted and hot environments are hotspots of COVID-19 infection (see [62]). This suggests that greenness is linked to improvement of environmental quality (reduced pollution of air and noise, and reduction in urban heat island effects [61]), which is beneficial to human health.
It is also important to also highlight that greater greenness implies greater oxygen provision through photosynthesis, and this would be beneficial to people living in greener neighbourhoods, given that a lack of oxygen is one of the manifestations of COVID-19 infection. Finally, the absence of greenness, e.g., parks, botanical gardens, etc., may imply less outdoor recreational or physical activities and more indoor activities. In this study, greenness is limited to terrestrial green spaces such as forests, urban parks, street trees, and household gardens. Indeed, green spaces offer opportunities for outdoor activities that make social distancing possible (as opposed to indoor activities [17]), but the benefits of green spaces, from the perspectives of outdoor activities, are contingent upon their level of connectivity and accessibility (see [42]). In the South African context, the use of outdoor greenness may be limited by the rise in insecurity issues [67], especially during the lockdowns, forcing people to prefer indoor activities, which might increase the chance of contamination (unless contacts with non-family members were avoided during the lockdowns). This is because indoor activities increase person-to-person contacts and thus easy transmission of airborne diseases such as COVID-19. Overall, the beneficial services to human health that greenness provides may cause numerous infected people to be asymptomatic or subclinical [16] as a result of boosted NK (Natural Killer) cell activities once a human is exposed to greenness [1,21], resulting in the strong negative correlation that we found between greenness and COVID-19 infection at the Ward scale. Grass cover, which did not correlate with COVID-19 infection at local municipality level, now does at the Ward scale, revealing perhaps the scale dependency aspect of greenness interaction with health.

4.3. Greenness versus COVID-19 Severity

We found no significant association between greenness and COVID-19 severity regardless of whether greenness is measured as EVI, tree cover, or grass cover. Similar to our findings for South Africa, Lin et al. [17] failed to detect a significant association between greenness and COVID-19 severity in the US using the same metric for measuring severity (hospitalizations). Although several studies have investigated the link between greenness and COVID-19 infection rate, we recorded only four studies that explored the link with COVID-19 severity. These studies reported mixed associations between greenness and COVID-19 severity (death rate or hospitalization). Two of them showed no significant association between greenness and COVID-19 severity [17,23]. Russette et al. [25] revealed that the association is rather geography-dependent within the US, whereas Lee et al. [24] reported a negative association. The inconsistent findings may be the results of non-standardized metrics of severity (e.g., death rate, hospitalizations, number of days of hospitalization, and admissions to Intensive Care Units), thus calling for a meta-analysis of all studies that tackle the question. Indeed, in their meta-analysis, Phogole and Yessoufou [18] reported that an increase in greenness resulted in a lower COVID-19 mortality rate ratio, suggesting that the failure to detect a significant negative correlation in the present study may simply imply that hospitalization is not an excellent proxy for COVID-19 severity (see also [17]).

4.4. Revenue Per Capita, Age, Population Density, and Income Levels versus COVID-19 Infection and Severity of COVID-19

Our analysis shows that the impact of confounding factors on the prevalence of COVID-19 is dependent on the spatial scale of measurement. On one hand, we found that revenue, but not age, is a significant predictor of the prevalence of COVID-19 infection, irrespective of the spatial scale used. On the other hand, population density is strongly associated with COVID-19 infection only at the Ward scale and when greenness is measured as grass cover, further supporting the scale dependency of the relationships [16]. At the Ward scale, both the revenue per capita and population density show a significant negative relationship with the prevalence of COVID-19. This means that wealthy and densely populated Wards tend to exhibit fewer infections, perhaps reflecting the negative significant effects of greenness that we have reported in this study on infection rate at Ward scale. The observed negative association between population density and COVID-19 infection contradicts existing studies which found that densely populated areas are more susceptible to infection primarily due to increased chances of person-to-person contact [59,68]. This inconsistency may be attributed to the positive effects of the different restrictive measures put in place by the government (e.g., use of hand sanitizer, social distancing, lockdown, etc.).
We also found that income level showed a significant negative association with COVID-19 prevalence at the Ward level, suggesting a link between poverty and susceptibility to COVID-19 infection. Similar findings were reported in Spain [69], and in the US ([70,71,72]; but see [16]), mirroring what some called “pandemic injustice” [73]. This pandemic injustice may be the consequence of poorer neighbourhoods being less green than wealthier ones [74,75,76]. Various poverty-related factors such as overcrowded human settlements, inadequate personal and environmental hygiene, and limited access to quality healthcare may contribute to high susceptibility to COVID-19 infection, thus explaining our finding. Similarly, in their study, Kim et al. [60] found that high-income groups in South Korea had 0.98-time lower odds of contracting COVID-19 in comparison to their low-income counterparts. In terms of severity, we found a significant positive relationship between revenue per capita or income levels and severity of COVID-19 impacts. This suggests that wealthy communities tend to suffer severe consequences of COVID-19. This could be because wealthy people may have underlying conditions (comorbidity, e.g., obesity) that may predispose them to COVID-19 severity. In support to our claim, Nwosu et al. [77] revealed that South African from wealthy families are more likely to be overweight and obese than not.
The severity of COVID-19 has also been shown to be density-dependent. High population density allows for high transmission of COVID-19 primarily through increased chances of person-to-person contact among individuals [58], which subsequently leads to higher rates of severe COVID-19 cases. In our study, we found that population density is positively associated with COVID-19 severity. Other studies have reported similar patterns [78,79,80]. Altogether, our study shows that densely populated communities suffer less COVID-19 infection but higher COVID-19 severity. Densely populated communities are generally poor communities characterized by overcrowded human settlements, unhygienic environment, limited access to quality healthcare, and unhealthy dietary behaviour, all of which may predispose to severe COVID-19.
Looking at the impact of age on COVID-19 infection (at Ward level), we found no significant association between age and the prevalence of COVID-19 (see also [16]). This suggests perhaps that older people may have followed the recommendations provided to avoid being contaminated scrupulously (social distancing, facemasks, etc.). However, we would expect older people, once contaminated, to suffer severe consequences due to weakened immune systems [59]. Surprisingly, we found that age is negatively associated with COVID-19 severity (but, see [81]), thus supporting perhaps our claim of a scrupulous behaviour of older people.
Our approach has a limitation. Socioeconomic data were not available at the Ward scale, and, therefore, the socio-economic data for a given local municipality were used for the corresponding Wards. This approach may introduce bias in the analysis given that different Wards in the same local municipality may have different socioeconomic profiles. However, we do not think that the differences between Wards data and the data of the corresponding local municipality would be so huge that the bias would cause a dramatic change in our results, given that those Wards shared the same local municipality.

5. Conclusions

In summary, this study provides insights into the association between greenness and COVID-19 infection and severity in the context of a developing country. We found evidence of poor neighbourhoods being more susceptible to COVID-19 infection: pandemic injustice. Similar to emerging patterns in developed countries [18], areas with higher greenness are linked to fewer positive COVID-19 cases. Furthermore, the spatial scale of analysis was found to be an important determinant of the significance of the relationship between greenness and COVID-19. Although higher EVI and tree cover are associated with reduced COVID-19 infection across both the local municipality and Ward levels, the impact of grass cover is significant only at the Ward level. Our results reinforce the need for policy-makers to establish and preserve greenness particularly in developing world, given its ability to moderate the spread and severity of COVID-19 [18].

Supplementary Materials

The following supporting information can be downloaded at: https://www.mdpi.com/article/10.3390/su151914508/s1, Table S1: The definition of all the 27 models fitted in the present study based on the various combinations of predictor and response variables in each model; Table S2: Models’ summary of the relationship between the distribution of greenness and the prevalence of COVID-19 infections at both local municipality and municipal ward scales; Table S3: Comparison of the relationship between greenness and COVID-19-related hospitalisations at district municipality scale.

Author Contributions

Conceptualization, K.Y.; methodology, B.P. and K.Y.; software, K.Y.; validation, K.Y.; formal analysis, B.P.; investigation, B.P. and K.Y.; resources, B.P. and K.Y.; data curation, B.P.; writing—original draft preparation, B.P.; writing—review and editing, K.Y.; visualization, K.Y.; supervision, K.Y.; project administration, K.Y.; funding acquisition, B.P. and K.Y. All authors have read and agreed to the published version of the manuscript.

Funding

This research was funded by National Research Foundation—South Africa, grant number SRUG22051210107 for KY and grant number 131354 for BP.

Institutional Review Board Statement

Not applicable.

Informed Consent Statement

Not applicable.

Data Availability Statement

All data generated or analysed in this study are included in this article (and its Supplementary Information Files). The R code used in this article can be found at: https://github.com/Bopaki01/Greenery_COVID-19.git (accessed on 17 April 2022).

Acknowledgments

We thank the University of Johannesburg—South Africa. We also thank five (05) anonymous reviewers who commented on an initial draft of this manuscript.

Conflicts of Interest

The authors declare no conflict of interest. The funders had no role in the design of the study; in the collection, analyses, or interpretation of data; in the writing of the manuscript; or in the decision to publish the results.

Appendix A

All data analysed in the present study.

Appendix B

R script used for the analysis.

References

  1. WHO (World Health Organisation). Coronavirus Disease 2019 (COVID-19), Situation Report—65. 2020. Available online: https://www.who.int/publications/m/item/situation-report---65 (accessed on 20 February 2023).
  2. WHO (World Health Organisation). WHO Coronavirus (COVID-19) Dashboard. 2022. Available online: https://covid19.who.int/ (accessed on 27 July 2023).
  3. DoH (Department of Health). Update on COVID-19 (Saturday 04 June 2022). 2022. Available online: https://sacoronavirus.co.za/2022/06/04/update-on-covid-19-saturday-04-june-2022/ (accessed on 20 February 2023).
  4. Bonaccorsi, G.; Pierri, F.; Cinelli, M.; Flori, A.; Galeazzi, A.; Porcelli, F.; Schmidt, A.L.; Valensise, C.M.; Scala, A.; Quattrociocchi, W.; et al. Economic and social consequences of human mobility restrictions under COVID-19. Proc. Natl. Acad. Sci. USA 2020, 117, 15530–15535. [Google Scholar] [CrossRef]
  5. Huang, B.; Huang, Z.; Chen, C.; Lin, J.; Tam, T.; Hong, Y.; Pei, S. Social vulnerability amplifies the disparate impact of mobility on COVID-19 transmissibility across the United States. Humanit. Soc. Sci. Commun. 2022, 9, 415. [Google Scholar] [CrossRef]
  6. Jin, J.; Agarwala, N.; Kundu, P.; Harvey, B.; Zhang, Y.; Wallace, E.; Chatterjee, N. Individual and community-level risk for COVID-19 mortality in the United States. Nat. Med. 2020, 27, 264–269. [Google Scholar] [CrossRef] [PubMed]
  7. Prem, K.; Liu, Y.; Russell, T.W.; Kucharski, A.J.; Eggo, R.M.; Davies, N.; Jit, M.; Klepac, P.; Flasche, S.; Clifford, S.; et al. The Effect of Control Strategies to Reduce Social Mixing on Outcomes of the COVID-19 Epidemic in Wuhan, China: A Modelling Study. Lancet Public Health 2020, 5, e261–e270. [Google Scholar] [CrossRef]
  8. Rojas-Rueda, D.; Morales-Zamora, E. Built Environment, Transport, and COVID-19: A Review. Curr. Environ. Health Rep. 2021, 8, 138–145. [Google Scholar] [CrossRef] [PubMed]
  9. Le, K.; Nguyen, M. The psychological consequences of COVID-19 lockdowns. Int. Rev. Appl. Econ. 2020, 35, 147–163. [Google Scholar] [CrossRef]
  10. Škare, M.; Soriano, D.R.; Porada-Rochoń, M. Impact of COVID-19 on the travel and tourism industry. Technol. Forecast. Soc. Chang. 2020, 163, 120469. [Google Scholar] [CrossRef] [PubMed]
  11. Labib, S.; Browning, M.H.; Rigolon, A.; Helbich, M.; James, P. Nature’s contributions in coping with a pandemic in the 21st century: A narrative review of evidence during COVID-19. Sci. Total Environ. 2022, 833, 155095. [Google Scholar] [CrossRef] [PubMed]
  12. Müller, F.; Röhr, S.; Reininghaus, U.; Riedel-Heller, S.G. Social Isolation and Loneliness during COVID-19 Lockdown: Associations with Depressive Symptoms in the German Old-Age Population. Int. J. Environ. Res. Public Health 2021, 18, 3615. [Google Scholar] [CrossRef] [PubMed]
  13. Imam, Z.; Odish, F.; Gill, I.; O’Connor, D.; Armstrong, J.; Vanood, A.; Ibironke, O.; Hanna, A.; Ranski, A.; Halalau, A. Older age and comorbidity are independent mortality predictors in a large cohort of 1305 COVID-19 patients in Michigan, United States. J. Intern. Med. 2020, 288, 469–476. [Google Scholar] [CrossRef]
  14. Hussey, H.; Zinyakatira, N.; Morden, E.; Ismail, M.; Paleker, M.; Bam, J.-L.; London, L.; Boulle, A.; Davies, M.-A. Higher COVID-19 mortality in low-income communities in the City of Cape Town—A descriptive ecological study. Gates Open Res. 2021, 5, 90. [Google Scholar] [CrossRef] [PubMed]
  15. Lu, Y.; Chen, L.; Liu, X.; Yang, Y.; Sullivan, W.C.; Xu, W.; Webster, C.; Jiang, B. Green spaces mitigate racial disparity of health: A higher ratio of green spaces indicates a lower racial disparity in SARS-CoV-2 infection rates in the USA. Environ. Int. 2021, 152, 106465. [Google Scholar] [CrossRef]
  16. Spotswood, E.N.; Benjamin, M.; Stoneburner, L.; Wheeler, M.M.; Beller, E.E.; Balk, D.; McPhearson, T.; Kuo, M.; McDonald, R.I. Nature inequity and higher COVID-19 case rates in less-green neighbourhoods in the United States. Nat. Sustain. 2021, 4, 1092–1098. [Google Scholar] [CrossRef]
  17. Lin, J.; Huang, B.; Kwan, M.-P.; Chen, M.; Wang, Q. COVID-19 infection rate but not severity is associated with availability of greenness in the United States. Landsc. Urban Plan. 2023, 233, 104704. [Google Scholar] [CrossRef]
  18. Phogole, B.; Yessoufou, K. A global meta-analysis of effects of green infrastructure on COVID-19 infection and mortality rates. medRxiv 2023. [Google Scholar] [CrossRef]
  19. Bratman, G.N.; Anderson, C.B.; Berman, M.G.; Cochran, B.; de Vries, S.; Flanders, J.; Folke, C.; Frumkin, H.; Gross, J.J.; Hartig, T.; et al. Nature and mental health: An ecosystem service perspective. Sci. Adv. 2019, 5, eaax0903. [Google Scholar] [CrossRef] [PubMed]
  20. Frumkin, H.; Gregory, N.; Bratman, G.N.; Breslow, S.J.; Cochran, B.; Kahn, P.H., Jr.; Lawler, J.J.; Levin, P.S.; Tandon, P.S.; Varanasi, U.; et al. Nature Contact and Human Health: A Research Agenda. Environ. Health Perspect. 2017, 125, 075001. [Google Scholar] [CrossRef]
  21. Li, Q. Effect of forest bathing trips on human immune function. Environ. Health Prev. Med. 2010, 15, 9–17. [Google Scholar] [CrossRef]
  22. Jiang, B.; Yang, Y.; Chen, L.; Liu, X.; Wu, X.; Chen, B.; Webster, C.; Sullivan, W.C.; Larsen, L.; Wang, J.; et al. Green spaces, especially nearby forest, may reduce the SARS-CoV-2 infection rate: A nationwide study in the United States. Landsc. Urban Plan. 2022, 228, 104583. [Google Scholar] [CrossRef]
  23. Klompmaker, J.O.; Hart, J.E.; Holland, I.; Sabath, M.; Wu, X.; Laden, F.; Dominici, F.; James, P. County-level exposures to greenness and associations with COVID-19 incidence and mortality in the United States. Environ. Res. 2021, 199, 111331. [Google Scholar] [CrossRef] [PubMed]
  24. Lee, W.; Kim, H.; Choi, H.M.; Heo, S.; Fong, K.C.; Yang, J.; Park, C.; Kim, H.; Bell, M.L. Urban environments and COVID-19 in three Eastern states of the United States. Sci. Total Environ. 2021, 779, 146334. [Google Scholar] [CrossRef]
  25. Russette, H.; Graham, J.; Holden, Z.; Semmens, E.O.; Williams, E.; Landguth, E.L. Greenspace exposure and COVID-19 mortality in the United States: January–July 2020. Environ. Res. 2021, 198, 111195. [Google Scholar] [CrossRef] [PubMed]
  26. Parveen, N.; Siddiqui, L.; Sarif, N.; Islam, S.; Khanam, N.; Mohibul, S. Industries in Delhi: Air pollution versus respiratory morbidities. Process. Saf. Environ. Prot. 2021, 152, 495–512. [Google Scholar] [CrossRef]
  27. Yazdi, M.D.; Wei, Y.; Di, Q.; Requia, W.J.; Shi, L.; Sabath, M.B.; Dominici, F.; Schwartz, J. The effect of long-term exposure to air pollution and seasonal temperature on hospital admissions with cardiovascular and respiratory disease in the United States: A difference-in-differences analysis. Sci. Total Environ. 2022, 843, 156855. [Google Scholar] [CrossRef]
  28. Diener, A.; Mudu, P. How can vegetation protect us from air pollution? A critical review on green spaces’ mitigation abilities for air-borne particles from a public health perspective—With implications for urban planning. Sci. Total Environ. 2021, 796, 148605. [Google Scholar] [CrossRef]
  29. Kuo, M. How might contact with nature promote human health? Promising mechanisms and a possible central pathway. Front. Psychol. 2015, 6, 1093. [Google Scholar] [CrossRef]
  30. Nguyen, Q.C.; Huang, Y.; Kumar, A.; Duan, H.; Keralis, J.M.; Dwivedi, P.; Meng, H.-W.; Brunisholz, K.D.; Jay, J.; Javanmardi, M.; et al. Using 164 Million Google Street View Images to Derive Built Environment Predictors of COVID-19 Cases. Int. J. Environ. Res. Public Health 2020, 17, 6359. [Google Scholar] [CrossRef] [PubMed]
  31. Li, W.; Dai, F.; Diehl, J.A.; Chen, M.; Bai, J. Exploring the spatial pattern of community urban green spaces and COVID-19 risk in Wuhan based on a random forest model. Heliyon 2023, 9, e19773. [Google Scholar] [CrossRef]
  32. Peng, W.; Dong, Y.; Tian, M.; Yuan, J.; Kan, H.; Jia, X.; Wang, W. City-level greenness exposure is associated with COVID-19 incidence in China. Environ. Res. 2022, 209, 112871. [Google Scholar] [CrossRef]
  33. Lee, K.-S.; Min, H.S.; Jeon, J.-H.; Choi, Y.-J.; Bang, J.H.; Sung, H.K. The association between greenness exposure and COVID-19 incidence in South Korea: An ecological study. Sci. Total Environ. 2022, 832, 154981. [Google Scholar] [CrossRef]
  34. You, Y.; Pan, S. Urban Vegetation Slows Down the Spread of Coronavirus Disease (COVID-19) in the United States. Geophys. Res. Lett. 2020, 47, e2020GL089286. [Google Scholar] [CrossRef]
  35. Liu, C.; Liu, Z.; Guan, C. The impacts of the built environment on the incidence rate of COVID-19: A case study of King County, Washington. Sustain. Cities Soc. 2021, 74, 103144. [Google Scholar] [CrossRef] [PubMed]
  36. Ciupa, T.; Suligowski, R. Green-Blue Spaces and Population Density versus COVID-19 Cases and Deaths in Poland. Int. J. Environ. Res. Public Health 2020, 18, 6636. [Google Scholar] [CrossRef]
  37. Lata, K.; Thapa, K.; Rajput, A.S. Liveability of Indian Cities and Spread of COVID-19—Case of Tier-1 Cities. Indian J. Public Adm. 2021, 67, 365–382. [Google Scholar] [CrossRef]
  38. Huang, J.; Kwan, M.-P.; Kan, Z.; Wong, M.S.; Kwok, C.Y.T.; Yu, X. Investigating the Relationship between the Built Environment and Relative Risk of COVID-19 in Hong Kong. ISPRS Int. J. Geo-Inf. 2020, 9, 624. [Google Scholar] [CrossRef]
  39. You, H.; Wu, X.; Guo, X. Distribution of COVID-19 Morbidity Rate in Association with Social and Economic Factors in Wuhan, China: Implications for Urban Development. Int. J. Environ. Res. Public Health 2020, 17, 3417. [Google Scholar] [CrossRef] [PubMed]
  40. Zhang, Y.; Chen, N.; Du, W.; Li, Y.; Zheng, X. Multi-source sensor based urban habitat and resident health sensing: A case study of Wuhan, China. J. Affect. Disord. 2021, 198, 107883. [Google Scholar] [CrossRef]
  41. Johnson, T.F.; Hordley, L.A.; Greenwell, M.P.; Evans, L.C. Associations between COVID-19 transmission rates, park use, and landscape structure. Sci. Total Environ. 2021, 789, 148123. [Google Scholar] [CrossRef]
  42. Pan, J.; Bardhan, R.; Jin, Y. Spatial distributive effects of public green space and COVID-19 infection in London. Urban For. Urban Green. 2021, 62, 127182. [Google Scholar] [CrossRef]
  43. Zhang, L.; Tan, P.Y. Associations between Urban Green Spaces and Health are Dependent on the Analytical Scale and How Urban Green Spaces are Measured. Int. J. Environ. Res. Public Health 2019, 16, 578. [Google Scholar] [CrossRef]
  44. Stats SA (Statistics South Africa). 60,6 Million People in South Africa. 2022. Available online: https://www.statssa.gov.za/?p=15601 (accessed on 17 April 2022).
  45. Stats SA (Statistics South Africa). Mid-Year Population Estimates. 2021. Available online: http://www.statssa.gov.za/publications/P0302/P03022021.pdf (accessed on 17 April 2022).
  46. Rouget, M.; Reyers, B.; Jonas, Z.; Desmet, P.; Driver, A.; Maze, K.; Egoh, B.; Cowling, R.M. National Spatial Biodiversity Assessment 2004, Technical Report Volume 1: Terrestrial Component; South African National Biodiversity Institute: Pretoria, South Africa, 2004. [Google Scholar]
  47. SANBI. National Biodiversity Monitoring & Reporting Framework; SANBI: Silverton, South Africa, 2007. [Google Scholar]
  48. Mamathaba, M.P.; Yessoufou, K.; Moteetee, A. What Does It Take to Further Our Knowledge of Plant Diversity in the Megadiverse South Africa? Diversity 2022, 14, 748. [Google Scholar] [CrossRef]
  49. De Beers, J. Natural Capita1: Land and Terrestrial Ecosystem Accounts, 1990 to 2014. 2020. Available online: https://www.statssa.gov.za/publications/D04011/D040111990to2014.pdf (accessed on 17 April 2022).
  50. Dayaram, A.; Harris, L.R.; Grobler, B.A.; Van der Merwe, S.; Rebelo, A.G.; Ward Powrie, L.; Rebelo, A.G.; Powrie, L.W. Vegetation Map of South Africa, Lesotho and Swaziland 2018: A description of changes since 2006. Bothalia 2019, 49, a2452. [Google Scholar] [CrossRef]
  51. Cox, R.L.; Underwood, E.C. The Importance of Conserving Biodiversity Outside of Protected Areas in Mediterranean Ecosystems. PLoS ONE 2011, 6, e14508. [Google Scholar] [CrossRef]
  52. Clark, A.; Jit, M.; Warren-Gash, C.; Guthrie, B.; Wang, H.H.X.; Mercer, S.W.; Sanderson, C.; McKee, M.; Troeger, C.; Ong, K.L.; et al. Global, regional, and national estimates of the population at increased risk of severe COVID-19 due to underlying health conditions in 2020: A modelling study. Lancet Glob. Health 2020, 8, e1003–e1017. [Google Scholar] [CrossRef]
  53. R Core Team. R: A Language and Environment for Statistical Computing; R Foundation for Statistical Computing: Vienna, Austria, 2021; Available online: https://www.R-project.org/ (accessed on 17 April 2022).
  54. Dean, A.; Voss, D.; Draguljić, D. Design and Analysis of Experiments, 2nd ed.; Springer International Publishing AG: Berlin, Germany, 2017. [Google Scholar]
  55. Brooks, M.E.; Kristensen, K.; van Benthem, K.J.; Magnusson, A.; Berg, C.W.; Nielsen, A.; Skaug, H.J.; Maechler, M.; Bolker, B.M. glmmTMB Balances Speed and Flexibility Among Packages for Zero-inflated Generalized Linear Mixed Modeling. R J. 2017, 9, 378–400. [Google Scholar] [CrossRef]
  56. O’Hara, R.B.; Kotze, D.J. Do not log-transform count data. Methods Ecol. Evol. 2010, 1, 118–122. [Google Scholar] [CrossRef]
  57. Ferrari, S.; Cribari-Neto, F. Beta Regression for Modelling Rates and Proportions. J. Appl. Stat. 2004, 31, 799–815. [Google Scholar] [CrossRef]
  58. Sy, K.T.L.; White, L.F.; Nichols, B.E. Population density and basic reproductive number of COVID-19 across United States counties. PLoS ONE 2021, 16, e0249271. [Google Scholar] [CrossRef] [PubMed]
  59. Bajaj, V.; Gadi, N.; Spihlman, A.P.; Wu, S.C.; Choi, C.H.; Moulton, V.R. Aging, Immunity, and COVID-19: How Age Influences the Host Immune Response to Coronavirus Infections? Front. Physiol. 2021, 11, 571416. [Google Scholar] [CrossRef]
  60. Kim, S.Y.; Yoo, D.M.; Min, C.; Choi, H.G. The Effects of Income Level on Susceptibility to COVID-19 and COVID-19 Morbidity/Mortality: A Nationwide Cohort Study in South Korea. J. Clin. Med. 2021, 10, 4733. [Google Scholar] [CrossRef]
  61. Lin, J.; Kroll, C.N.; Nowak, D.J.; Greenfield, E.J. A review of urban forest modeling: Implications for management and future research. Urban For. Urban Green. 2019, 43, 126366. [Google Scholar] [CrossRef]
  62. Chen, Q.X.; Huang, C.L.; Yuan, Y.; Tan, H.P. Influence of COVID-19 event on air quality and their association in mainland China. Aerosol Air Qual. Res. 2020, 20, 1541–1551. [Google Scholar] [CrossRef]
  63. Reid, C.E.; Clougherty, J.E.; Shmool, J.L.; Kubzansky, L.D. Is All Urban Green Space the Same? A Comparison of the Health Benefits of Trees and Grass in New York City. Int. J. Environ. Res. Public Health 2017, 14, 1411. [Google Scholar] [CrossRef] [PubMed]
  64. Yu, H.; Zhou, Y.; Wang, R.; Qian, Z.; Knibbs, L.D.; Jalaludin, B.; Schootman, M.; McMillin, S.E.; Howard, S.W.; Lin, L.-Z.; et al. Associations between trees and grass presence with childhood asthma prevalence using deep learning image segmentation and a novel green view index. Environ. Pollut. 2021, 286, 117582. [Google Scholar] [CrossRef]
  65. Yessoufou, K.; Sithole, M.; Elansary, H.O. Effects of urban green spaces on human perceived health improvements: Provision of green spaces is not enough but how people use them matters. PLoS ONE 2020, 15, e0239314. [Google Scholar] [CrossRef]
  66. Vivier, E.; Tomasello, E.; Baratin, M.; Walzer, T.; Ugolini, S. Functions of natural killer cells. Nat. Immunol. 2008, 9, 503–510. [Google Scholar] [CrossRef] [PubMed]
  67. Cilliers, E.J. Reflecting on Green Infrastructure and Spatial Planning in Africa: The Complexities, Perceptions, and Way Forward. Sustainability 2019, 11, 455. [Google Scholar] [CrossRef]
  68. Wong, D.W.S.; Li, Y. Spreading of COVID-19: Density matters. PLoS ONE 2020, 15, e0242398. [Google Scholar] [CrossRef]
  69. Baena-Díez, J.M.; Barroso, M.; Cordeiro-Coelho, S.I.; Díaz, J.L.; Grau, M. Impact of COVID-19 outbreak by income: Hitting hardest the most deprived. J. Public Health 2020, 42, 698–703. [Google Scholar] [CrossRef]
  70. Finch, W.H.; Finch, M.E.H. Poverty and COVID-19: Rates of Incidence and Deaths in the United States During the First 10 Weeks of the Pandemic. Front. Sociol. 2020, 5, 47. [Google Scholar] [CrossRef]
  71. Weill, J.A.; Stigler, M.; Deschenes, O.; Springborn, M.R. Social distancing responses to COVID-19 emergency declarations strongly differentiated by income. Proc. Natl Acad. Sci. USA 2020, 117, 19658–19660. [Google Scholar] [CrossRef]
  72. Chen, J.T.S.; Krieger, N. Revealing the Unequal Burden of COVID-19 by Income, Race/Ethnicity, and Household Crowding: US County Versus Zip Code Analyses. J. Public Health Manag. Pract. 2020, 27, S43–S56. [Google Scholar] [CrossRef] [PubMed]
  73. McPhearson, T.; Grabowski, Z.; Herreros-Cantis, P.; Mustafa, A.; Ortiz, L.; Kennedy, C.; Tomateo, C.; Lopez, B.; Olivotto, V.; Vantu, A. Pandemic Injustice: Spatial and Social Distributions of COVID-19 in the US Epicenter. J. Extrem. Events 2020, 7, 2150007. [Google Scholar] [CrossRef]
  74. Astell-Burt, T.; Feng, X.; Mavoa, S.; Badland, H.M.; Giles-Corti, B. Do low-income neighbourhoods have the least green space? A cross-sectional study of Australia’s most populous cities. BMC Public Health 2014, 14, 292. [Google Scholar] [CrossRef] [PubMed]
  75. Wüstemann, H.; Kalisch, D.; Kolbe, J. Access to urban green space and environmental inequalities in Germany. Landsc. Urban Plan. 2017, 164, 124–131. [Google Scholar] [CrossRef]
  76. Watkins, S.L.; Gerrish, E. The relationship between urban forests and race: A meta-analysis. J. Environ. Manag. 2018, 209, 152–168. [Google Scholar] [CrossRef]
  77. Nwosu, E.; Fismen, A.-S.; Helleve, A.; Hongoro, C.; Sewpaul, R.; Reddy, P.; Alaba, O.; Harbron, J. Trends in prevalence of overweight and obesity among South African and European adolescents: A comparative outlook. BMC Public Health 2022, 22, 2287. [Google Scholar] [CrossRef]
  78. Rideout, A.; Murray, C.; Isles, C. Regional variation in COVID-19 positive hospitalisation across Scotland during the first wave of the pandemic and its relation to population density: A cross-sectional observation study. PLoS ONE 2021, 16, e0253636. [Google Scholar] [CrossRef] [PubMed]
  79. Chang, D.; Chang, X.; He, Y.; Tan, K.J.K. The determinants of COVID-19 morbidity and mortality across countries. Sci. Rep. 2022, 12, 5888. [Google Scholar] [CrossRef] [PubMed]
  80. Bell, M.; Hergens, M.-P.; Fors, S.; Tynelius, P.; de Leon, A.P.; Lager, A. Individual and neighborhood risk factors of hospital admission and death during the COVID-19 pandemic: A population-based cohort study. BMC Med. 2023, 21, 1–9. [Google Scholar] [CrossRef]
  81. COVID-19 Forecasting Team. Variation in the COVID-19 infection–fatality ratio by age, time, and geography during the pre-vaccine era: A systematic analysis. Lancet 2022, 399, 1469–1488. [Google Scholar] [CrossRef] [PubMed]
Figure 1. Maps showing proportion of COVID-19 infections and greenness measured as EVI and tree cover at Ward scale.
Sustainability 15 14508 g001
Figure 2. Maps showing proportion of COVID-19 infections and revenue per capita at Ward scale.
Sustainability 15 14508 g002
Table 1. Coefficients of the models of COVID-19 infection measured as proportion of infected people at Local Municipality scale. Greenness is measured as Enhanced Vegetation Index (EVI), tree cover, and grass cover. * p < 0.05; ** p < 0.01; *** p < 0.001.
Estimate (β)Std. Error (±)Z ValuesPR (>|Z|)
EVI−0.320.06461−4.95<0.001 ***
Population density−0.0280.03497−0.810.419
Revenue per capita0.5280.0454911.60<0.001 ***
Tree cover−0.2870.06532−4.40<0.001 ***
Population density−0.0360.03643−0.990.322
Revenue per capita0.5040.0452911.12<0.001 ***
Grass cover−0.0120.04988−0.2390.811
Population density−0.0290.03938−0.7400.459
Revenue per capita0.4510.045999.795<0.001 ***
Table 2. Coefficients of the models of COVID-19 infection measured as proportion of infected people at the Ward scale. Greenness is measured as Enhanced Vegetation Index (EVI), tree cover, and grass cover. * p < 0.05; ** p < 0.01; *** p < 0.001.
Estimate (β)Std. Error (±)Z ValuesPR (>|Z|)
EVI−0.2190.05761−3.797<0.001 ***
Age−0.2770.17975−1.5430.123
Population density−0.5610.42749−1.3120.189
Revenue per capita−1.4490.11653−12.436<0.001 ***
Tree cover−0.10.04653−2.1460.032 *
Age−0.0770.18387−0.4190.675
Population density−0.270.39398−0.6850.494
Revenue per capita−1.220.10575−11.534<0.001 ***
Grass cover−0.4470.058825−7.603<0.001 ***
Age−0.0050.190021−0.0240.981
Population density−1.2460.549421−2.2680.023 *
Revenue per capita−1.1250.105906−10.623<0.001 ***
Table 3. Coefficients of the models of COVID-19 hospitalisation measured as a proportion of hospitalised people at district scale. Greenness is measured as Enhanced Vegetation Index, tree, and grass cover. * p < 0.05; ** p < 0.01; *** p < 0.001.
Estimate (β)Std. Error (±)Z ValuesPR (>|Z|)
EVI−0.1230.09355−1.320.188
Age−0.4610.18636−2.470.013 *
Population density0.2670.150661.770.077
Revenue per capita0.3520.157572.230.026 *
Tree cover−0.1720.1080−1.590.111
Age−0.4290.2069−2.080.038 *
Population density0.2580.14801.740.081
Revenue per capita0.3220.18321.760.078
Grass cover0.1030.10980.940.349
Age−0.4330.2067−2.090.036 *
Population density0.3440.16552.080.038 *
Revenue per capita0.2730.15201.790.073
Disclaimer/Publisher’s Note: The statements, opinions and data contained in all publications are solely those of the individual author(s) and contributor(s) and not of MDPI and/or the editor(s). MDPI and/or the editor(s) disclaim responsibility for any injury to people or property resulting from any ideas, methods, instructions or products referred to in the content.

