Article

The Deforestation and Biodiversity Risks of Power Plant Projects in Southeast Asia: A Big Data Spatial Analytical Framework

1
Department of Earth and Environment, Boston University, Boston, MA 02215, USA
2
Global Development Policy Center, Boston University, Boston, MA 02215, USA
3
Center for Remote Sensing, Boston University, Boston, MA 02215, USA
4
Department of Biology, Boston University, Boston, MA 02215, USA
*
Author to whom correspondence should be addressed.
Sustainability 2023, 15(19), 14461; https://doi.org/10.3390/su151914461
Submission received: 25 July 2023 / Revised: 13 September 2023 / Accepted: 21 September 2023 / Published: 3 October 2023

Abstract

:
Ecosystem destruction and biodiversity loss are now widespread, extremely rapid, and among the top global anthropogenic risks both in terms of likelihood and overall impact. Thorough impact evaluation of these environmental abuses—essential for conservation and future project planning—requires good analysis of local ecological and environmental data in addition to social and economic impacts. We characterized the deforestation and biodiversity impacts of energy investments in Southeast Asia using multiple geospatial data sources related to forest cover and loss data from 2000 to 2018, other landcover data, and the location, type, and characteristics of energy investments. This study paid particular attention to different types of power plants and financing sources. We identified critical buffer zones and forest structures impacted by these projects in accordance with IUCN criteria and spatial ecology. The paper introduces a novel, replicable analytical framework that goes beyond earlier studies in which all forests are treated as equivalent. It characterizes forests based on spatial morphological structures such as core forest, edges, islands, and bridges, allowing for a more nuanced understanding of deforestation and its impacts on biodiversity. Preliminary findings suggest that projects financed by Chinese development banks pose different risks compared to non-Chinese financing. The study also reveals significant differences in biodiversity impacts based on the type of energy source, be it coal or hydro. The study offers critical insights into the trade-offs between energy development and biodiversity conservation. It provides actionable metrics and strategies for policymakers, conservationists, and development banks to prioritize forest and habitat preservation in Southeast Asia and globally.

1. Introduction

1.1. Biodiversity and Infrastructure Development in Southeast Asia

Southeast Asia is one of the regions with the world’s highest species richness and endemism [1,2]. Its tropical ecosystems—freshwater, terrestrial, and marine—are characterized by rich biodiversity and complex biotic interactions among their species. Unfortunately, today this region exhibits the world’s highest vertebrate extinction rates, primarily due to severe habitat loss [3]. The countries in this region have seen deforestation rates that are unchecked and higher than in any other major tropical region globally, while forest cover has decreased anywhere from 20% to 70% in the past four decades. Southeast Asia is expected to lose three quarters of its original forests by 2100 and up to 42% of its biodiversity [4,5], a massive rate of species decline and extinction [6]. Anthropological activities such as clear-cutting, illegal logging [6], agriculture, and, most importantly, infrastructure projects, including energy [7], are the underlying drivers of this loss. In addition, there are many other drivers of biodiversity loss, including the harvest of wild species for luxury food, medicine, tonics, horns, and other trophy parts, and captive animals [8].
Prior studies have studied the culprits and mechanisms of deforestation and biodiversity loss, focusing on habitat fragmentation [9], increased roadkill [10], increased wildlife trafficking [11], eroding indigenous populations [12], and biosecurity concerns from the introduction of invasive species [13]. Deforestation often begins with the construction of road networks and fences that have negative direct and indirect impacts on biodiversity [14,15,16,17]. Indirect impacts from illegal logging, poaching, mining, and urban encroachment often accompany or result from road construction [18,19,20,21,22]. Any existing road in a forested area leads to further deforestation; about 5% of deforestation occurs within a five-kilometer buffer of a road network or a one-kilometer buffer of a navigable river [23,24]. The greatest threat to wild orangutan populations in Borneo and Sumatra is the loss of their habitat to road development, which exacerbates agricultural expansion, illegal timber harvesting, mining, and human encroachment. As connectivity within and among remaining forest patches is compromised, the negative impacts to biodiversity accelerate [20]. The infrastructure impacts on existing biodiversity and forests in the area can further weaken ecosystems and increase anthropogenic carbon emissions [25]. Loss of biodiversity also disrupts ecosystem processes, and ecosystem service flows that benefit human well-being [3,26].
The trade-offs between biodiversity conservation and human development activities [27,28,29] can be analyzed at multiple spatial scales from both conservation and sustainable development perspectives (ideally, they should be part of a single, systemic perspective). At the landscape scale, forest loss and fragmentation severely affect biodiversity [30,31]. Deforestation creates patterns of remnant forest fragments and ecologically degraded forest edges. Species richness decreases in fragmented forests because remnants may be too small for species to persist, too exposed to edge effects, or too isolated to be colonized from other remnants [32]. Edge effects and the spill-over of species from secondary habitats [33] impacts species composition in fragmented forests. Thus, there is a growing need to understand the impact of particular spatial patterns of deforestation and degradation, as these areas may be open to strategic modification even if the overall amount of deforestation is challenging to influence. The application of spatial ecology can also establish a strategy for reforestation. All this should be incorporated into relevant environmental impact assessments, environmental education programs, and management plans to strengthen habitat protection and reforestation activities and other efforts to preserve and protect natural habitats and biodiversity [34,35,36].

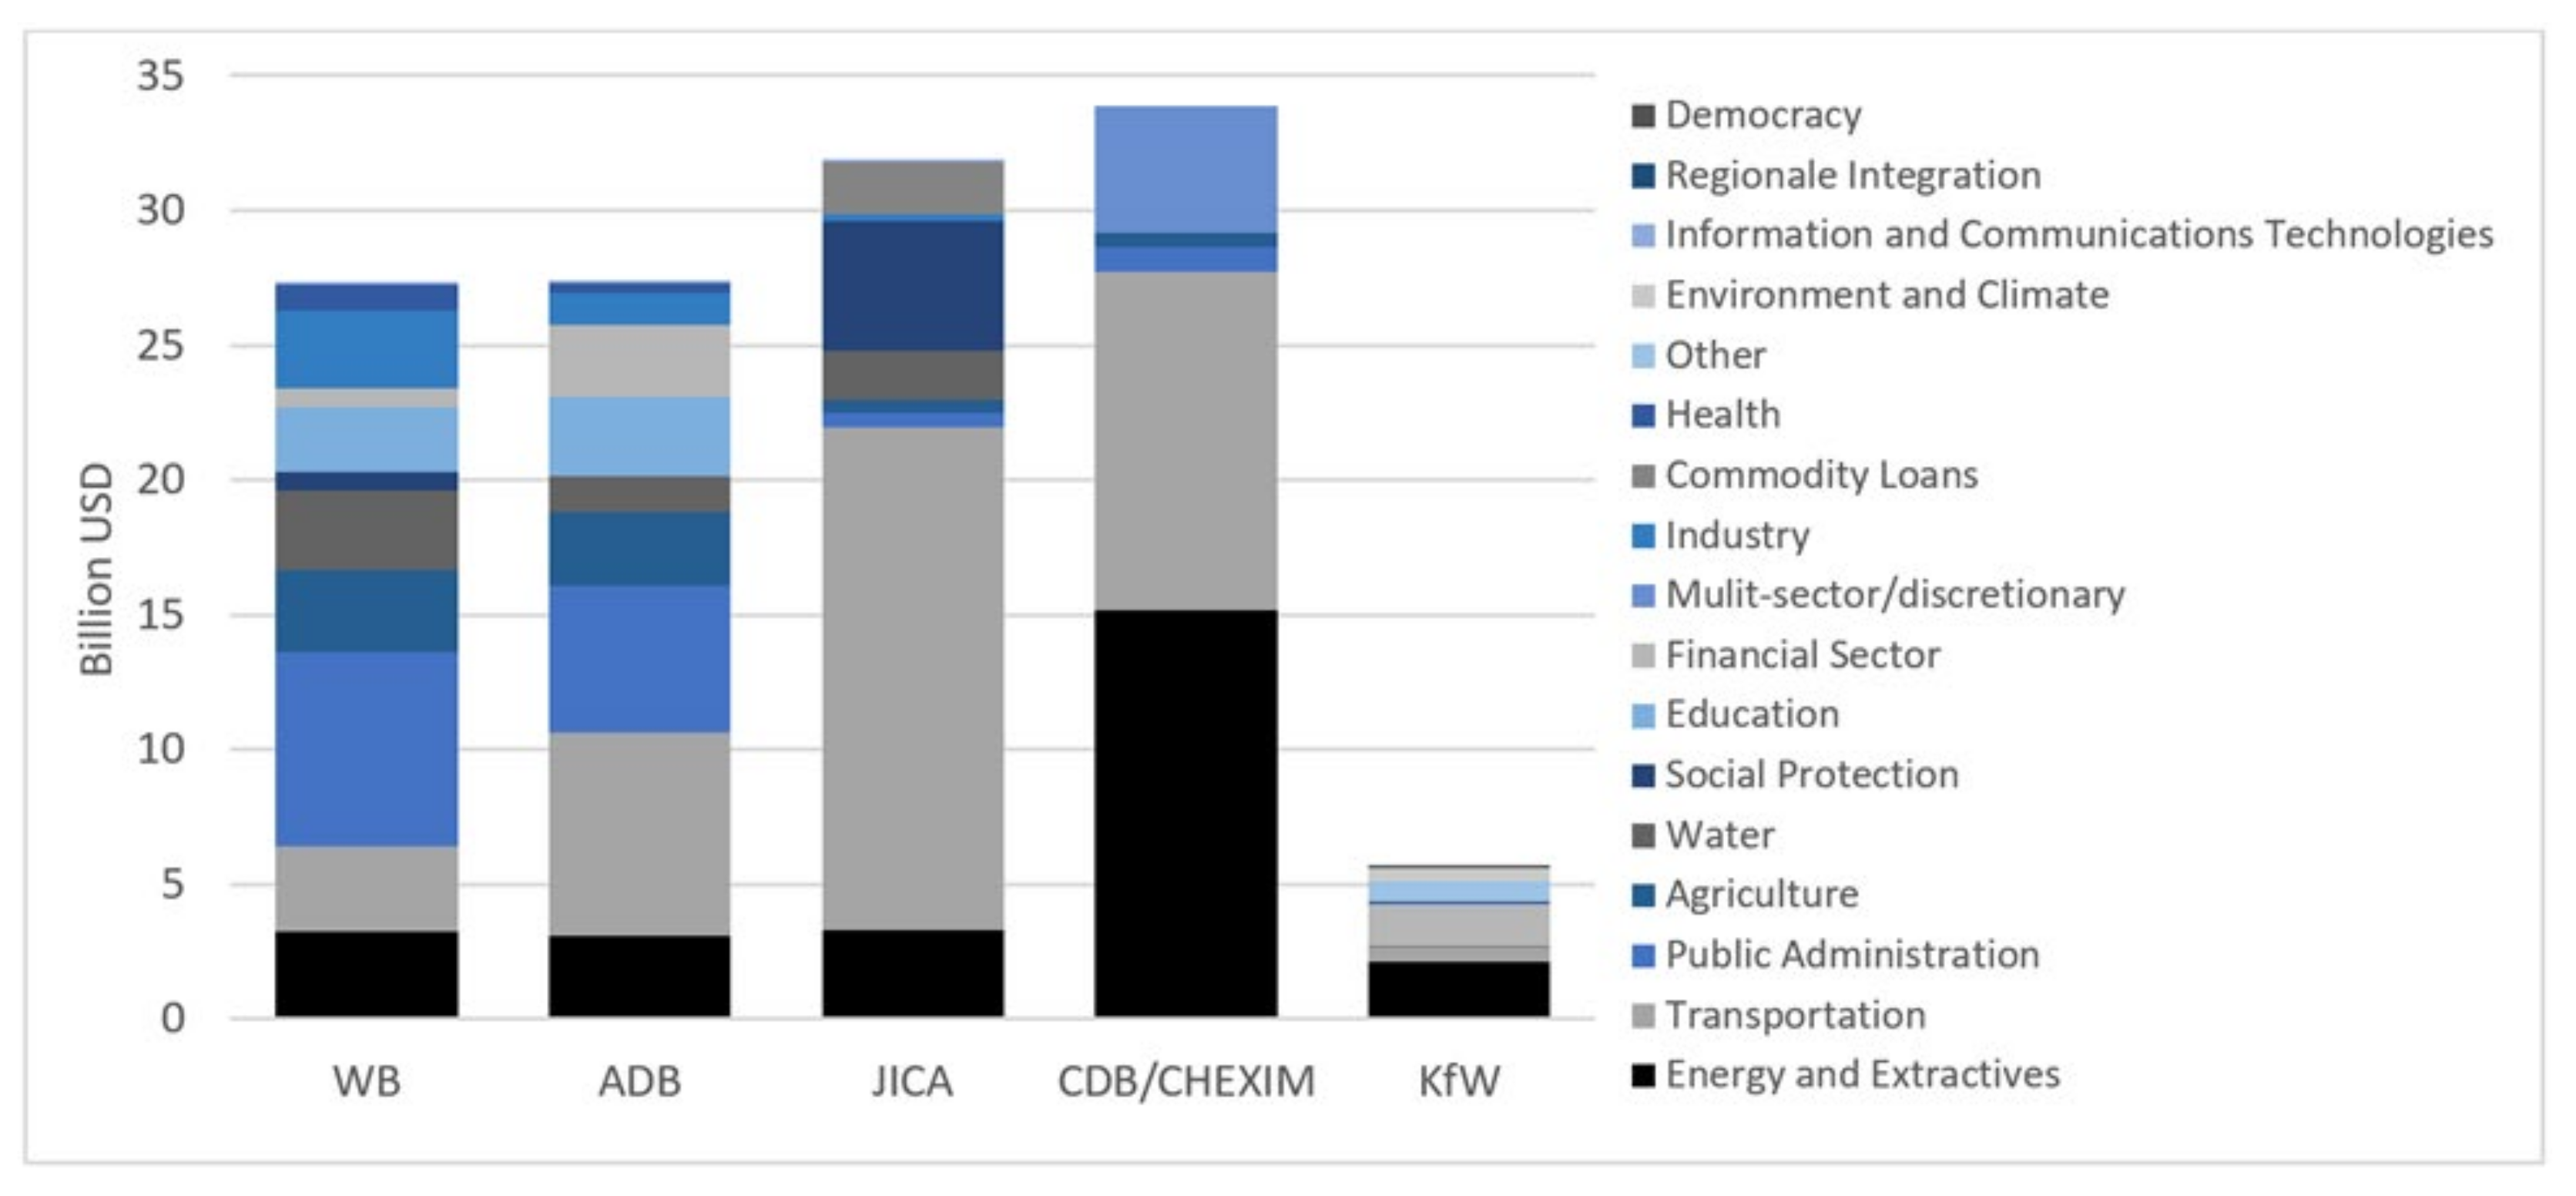
1.2. Development Finance and Energy Investment

Development banks and development finance institutions (DFIs) serve as important channels for infrastructure finance and have adopted safeguards systems to minimize and manage the environmental and social risks associated with their projects [37]. The banks have to address the Sustainable Development Goals (SDGs), laid out by the United Nations in 2015. Different development banks also apply differing levels of safeguards. Development projects have to comply with various national and international biodiversity regulations and protect the vulnerable and indigenous groups’ rights and sustainable harvesting of forest products [38]. However, the effectiveness of these environmental regulations in different countries is open to debate. We need timely and accurate spatial data to analyze the impacts of development projects on biodiversity loss.
In 2013, China introduced the Belt and Road Initiative (BRI) to strengthen infrastructure, trade, and investment links between China and the participating countries. The BRI has reached a vast portion of the world, particularly China’s neighbors in Southeast Asia. All eleven countries in Southeast Asia—Brunei, Cambodia, East Timor, Indonesia, Laos, Malaysia, Myanmar, Philippines, Singapore, Thailand, and Vietnam—have signed BRI cooperation agreements with China. China’s policy banks have emerged as significant players in investing in development projects in Southeast Asia. Figure A1 shows international development finance commitments in the region between 2013 and 2019 (a period when data is available for all the institutions listed). Figure A1 also indicates that in this period, the energy sector received a significant share of China’s development finance in Southeast Asia (specifically, the power sector). Note that this investment amount is greater than the combined amount of all the other major development banks active in the region [36,39,40,41,42,43]. The two Chinese development banks that engage in international businesses are the China Development Bank (CDB) and the Export–Import Bank of China (CHEXIM). The total amount of development finance committed by the two banks over this period has exceeded all other major development financiers in the region, including the World Bank (WB), the Asian Development Bank (ADB), and the Japan International Cooperation Agency (JICA). However, compared with the multilateral development banks and some Western national development institutions, the Chinese development banks have lax internal environmental standards and principles that defer to local regulations. While the trend in the multilateral development banks safeguards is moving toward a country systems approach, local regulations and local execution can be insufficient. Thus, China’s development finance in the energy sector in Southeast Asia is critical in examining changes in biodiversity.
Many parts of the BRI intersect terrestrial and marine biodiversity hotspots, wilderness areas, and critical conservation areas in Southeast Asia, including primary dipterocarp forests and the Coral Triangle [44]. Recent studies have investigated deforestation from the BRI and its impact on biodiversity [45], species interactions, and ecosystem processes in tropical forests [13,46].
Although prior studies have considered how electricity generation impacts other aspects of the environment, few have looked specifically at how much land different energy sources require [47]. Electricity production in the U.S. shows that coal, natural gas, and nuclear power all feature physical footprints of about 4.85 hectares per megawatt installed capacity. Solar and wind power, respectively, take up 17.6 and 28.6 hectares per megawatt installed capacity, while hydroelectricity generated by large dams has a significant footprint of 127.56 hectares per megawatt installed capacity [47]. Land cover changes associated with power projects include the construction of the plant, resource production, and the inundation of forested valleys by reservoirs. Transmission and transportation can also lead to deforestation, fragmentation of habitats and migration routes, as well as pollution that could harm the ecosystems.
The development of hydroelectric dams in the Mekong River basin illustrates the trade-offs and impacts of energy development on biodiversity [48,49]. Hydropower produces relatively cheap and sustainable electricity for the lifetime of a dam (which is often not very long), flood and drought protection [50], and new economic and employment opportunities [51]. However, dam construction impacts water flow and fish migrations [52] and ultimately can cause the loss of traditional livelihoods and a significant reduction in the seasonal monsoon-driven flooding that has long brought nutrient-rich sediments out onto the floodplain. The dams also impede the downstream flow of these sediments [53,54]. Such energy projects spotlight the need for strengthened project evaluation and monitoring and reforestation and conservation plans in any future infrastructure development through ecosystem trade-off analysis.
The previous literature highlights several knowledge gaps. There are no papers that specifically focus on the biodiversity impacts of hydro and coal-fired power plant projects in the different ecoregions of Southeast Asia. While some papers discuss deforestation and environmental damage, they do not isolate the effects of land cover change [55,56,57]. In addition, there is a lack of longitudinal studies that track the long-term impacts of power plants on biodiversity in Southeast Asia. Understanding the impacts on biodiversity can help in the risk assessment required under the UN SDGs. Our framework and analysis address this growing challenge of analyzing biodiversity impacts due to investments in coal and other energy sources.

2. Materials and Methods

2.1. Framework

Our paper examines the increasing deforestation and threat to biodiversity fueled by power generation projects across the region from China and other countries. We adopt a “big data” spatial analytical framework to catalog deforestation and biodiversity changes in different ecoregions that have potentially resulted from power generation projects financed by China and other (including domestic) entities. The study utilizes a time series of forest cover and loss data (2000–2018) derived from Landsat to map the baseline information of forests, biodiversity, and energy investment locations to analyze forested areas bisected by the BRI corridors. Forest cover data are analyzed four years prior to and as of the commission of the project. In contrast to prior studies, our study does not treat all forests as equivalent. We characterized the spatial structure of forest cover distribution using distinctions such as core, edges, and bridges. The spatial data and analysis enable us to investigate the morphological patterns of deforestation impact and the specific biodiversity risks of power generation projects with different financing sources, energy sources, characteristics, and locations. Specifically, this paper attempts to:
  • Based on forest cover and loss data from 2000 to 2018, inspect if deforestation patterns four years prior to and as of the commission of energy projects are different and if the potential impacts of projects financed by Chinese development banks differ from non-Chinese financing.
  • Investigate the biodiversity risks using IUCN criteria within critical buffer distances from power generation investments with and without Chinese development finance. Are there statistical differences?
  • Examine habitat criticality and forest cover changes near different types of power plants (coal or hydro) with and without Chinese development finance in Southeast Asia before and after the project’s commission to estimate if there are significant differences in biodiversity risks and deforestation impacts. Do the biodiversity impacts differ based on energy sources? How can our analysis inform policy on the ground?
  • Using a forest spatial pattern methodology, we identify core, periphery, and other spatial fragmentation metrics to analyze the relationships between forest core and edge effects in more detail for energy investments in Southeast Asia.
  • Our project offers metrics and a replicable analytical framework to identify critical areas where forest and habitat preservation should be most heavily emphasized in Southeast Asia and other regions in the world. In particular, it demonstrates the merit of looking at deforestation in ways that dig deeper into its particular causes and their specific impacts on forest structure and ecological integrity.

2.2. Data

This study’s spatial domain covers eight countries in Southeast Asia—Cambodia, Indonesia, Laos, Malaysia, Myanmar, Philippines, Thailand, and Vietnam—all of which are also signatories of the BRI with China and are fit for comparison. Our methodology requires a selection of biodiversity factors, including habitats, forest boundaries and corridors, locations of power generation facilities, and a list of endangered and threatened species differentiated by ecoregions. China’s Overseas Development Finance Database [58] provides the financial information of projects financed by Chinese development banks. Figure 1 shows the data and methodology framework of the research.

2.2.1. Forest Cover

Infrastructure constructions are likely to erode forest cover and further exacerbate impacts on biodiversity. We performed a time-series analysis characterizing forest extent and change in Southeast Asia based on a published data product, Global Forest Change v1.6 [59], processed using Google Earth Engine. In this product, the variables are defined as follows:
  • Trees are defined as vegetation taller than 5 m in height and are expressed as a percentage per output grid cell using the base year 2000 (denoted as ‘2000 Percent Tree Cover’). Tree cover makes up 25% or more at the Landsat pixel scale (30 m × 30 m spatial resolution) and represents forest cover in this scheme.
  • Forest Cover Loss is defined as a stand-replacement disturbance or a change from a forest to a non-forest state during 2000–2018.
  • Forest Loss Year is a disaggregation of total ‘Forest Loss’ to annual time scales.
Based on forest cover data, it is possible to describe spatial patterns of forests in conjunction with non-forests, including fragmentations occurring within the forest and along its exterior boundaries. These fragmentations have differential impacts on related landscape properties, especially structural connectivity, that can be extracted and evaluated. Figure A2 shows the deforestation loss in different countries. Every country in this region has seen deforestation from 2000 to 2018, the most severe being in Indonesia and Malaysia, at 17% and 28% of their total tree cover, respectively. The smallest amount of deforestation is in Brunei (5.2%), mainly attributable to its leadership, and East Timor (3.8%) in the south, which is dry and has little or no wet forest.

2.2.2. WWF’s Ecoregions

It is vital to interpret biodiversity loss in the context of ecoregions to account for the magnitude and nature of the loss correctly. The World Wildlife Fund (WWF) defines an ecoregion as a “relatively large unit of land or water containing a characteristic set of natural communities that share a large majority of their species dynamics, and environmental conditions” [60]. Each ecoregion has its distinct species, whose populations in an area of interest can be critically endangered or endangered, vulnerable, or relatively intact. We consider twelve ecoregions (Figure A3) in Southeast Asia, identified by WWF ecoregions as varying significantly in population density, type and amount of vegetation cover, biodiversity, and development projects. Thus, it is possible to compare and contrast relatively undisturbed from more disturbed areas. For example, the Cardamom Mountains, a part of the regional Indo-Burma hotspot, represent a rainforest ecoregion. It is (or was) home to several large mammals, including the Asian elephant (Elephas maximus) and tiger (Panthera tigris, now extinct). Its remote location, protected status, and investment in enforcement had until recently prevented deforestation, and have now seen severe degradation.
In contrast, peat swamp and heath forests, characterized by sandy soils, have no large mammals. The peat forest on the islands of Indonesia (Borneo, Belitung, and Bangka) is home to some iconic specialist plants such as carnivorous Nepenthes pitcher plants and myrmecophiles (or ant plants). These peat forests are impacted by two forces: rapid clearing for human settlements and large-scale development projects, resulting in a highly vulnerable ecoregion [61]. Each ecoregion in Southeast Asia, characterized by a different mix of plants and animals, is experiencing different threat levels due to human settlement expansion and logging. Hence, the increasing threats fueled by energy investments across the region by China and other countries further worsen biodiversity in Southeast Asia.
The WWF has produced a global ecoregion map of the world with 867 ecoregions. In the present study, the Global Forest Change (GFC) is overlaid on the ecoregion map to characterize deforestation and morphological spatial pattern trends in Southeast Asia.

2.2.3. The IUCN* Red List of Threatened Species

The world’s most complete inventory of the global conservation status of amphibians, fish, birds, and mammals is the IUCN* Red List of Threatened Species (also known as the IUCN Red List or Red Data List). This global analysis of all species’ status and distributions is based on the best available data and expert analysis for each species. [62,63]. The IUCN Red List classifies species into nine groups, established through criteria such as the rate of decline, population size, area of geographic distribution, and degree of population and fragmentation. The IUCN criteria recognize significant differences between species and the circumstances leading to their extinction risk. This methodology categorizes each species’ threat level based on the available data and the specified quantitative thresholds. The IUCN’s goal is to provide information and analyses on the status, trends, and threats to species to inform and catalyze biodiversity conservation action [64]. The IUCN list can inform global and regional biodiversity targets, aid conservation planning, evaluate conservation actions, and inform legislative frameworks to protect species [65]. IUCN Red List criteria cover three threatened categories—critically endangered, endangered, and vulnerable. Species are allocated to one of the three types of extinction risk based on population size, range area, and decline rate. This allocation can aid in studies of biodiversity. There is also a probability of extinction in the wild associated with these three categories. The Red List has become an increasingly powerful tool for global conservation, management, monitoring, and decision making.

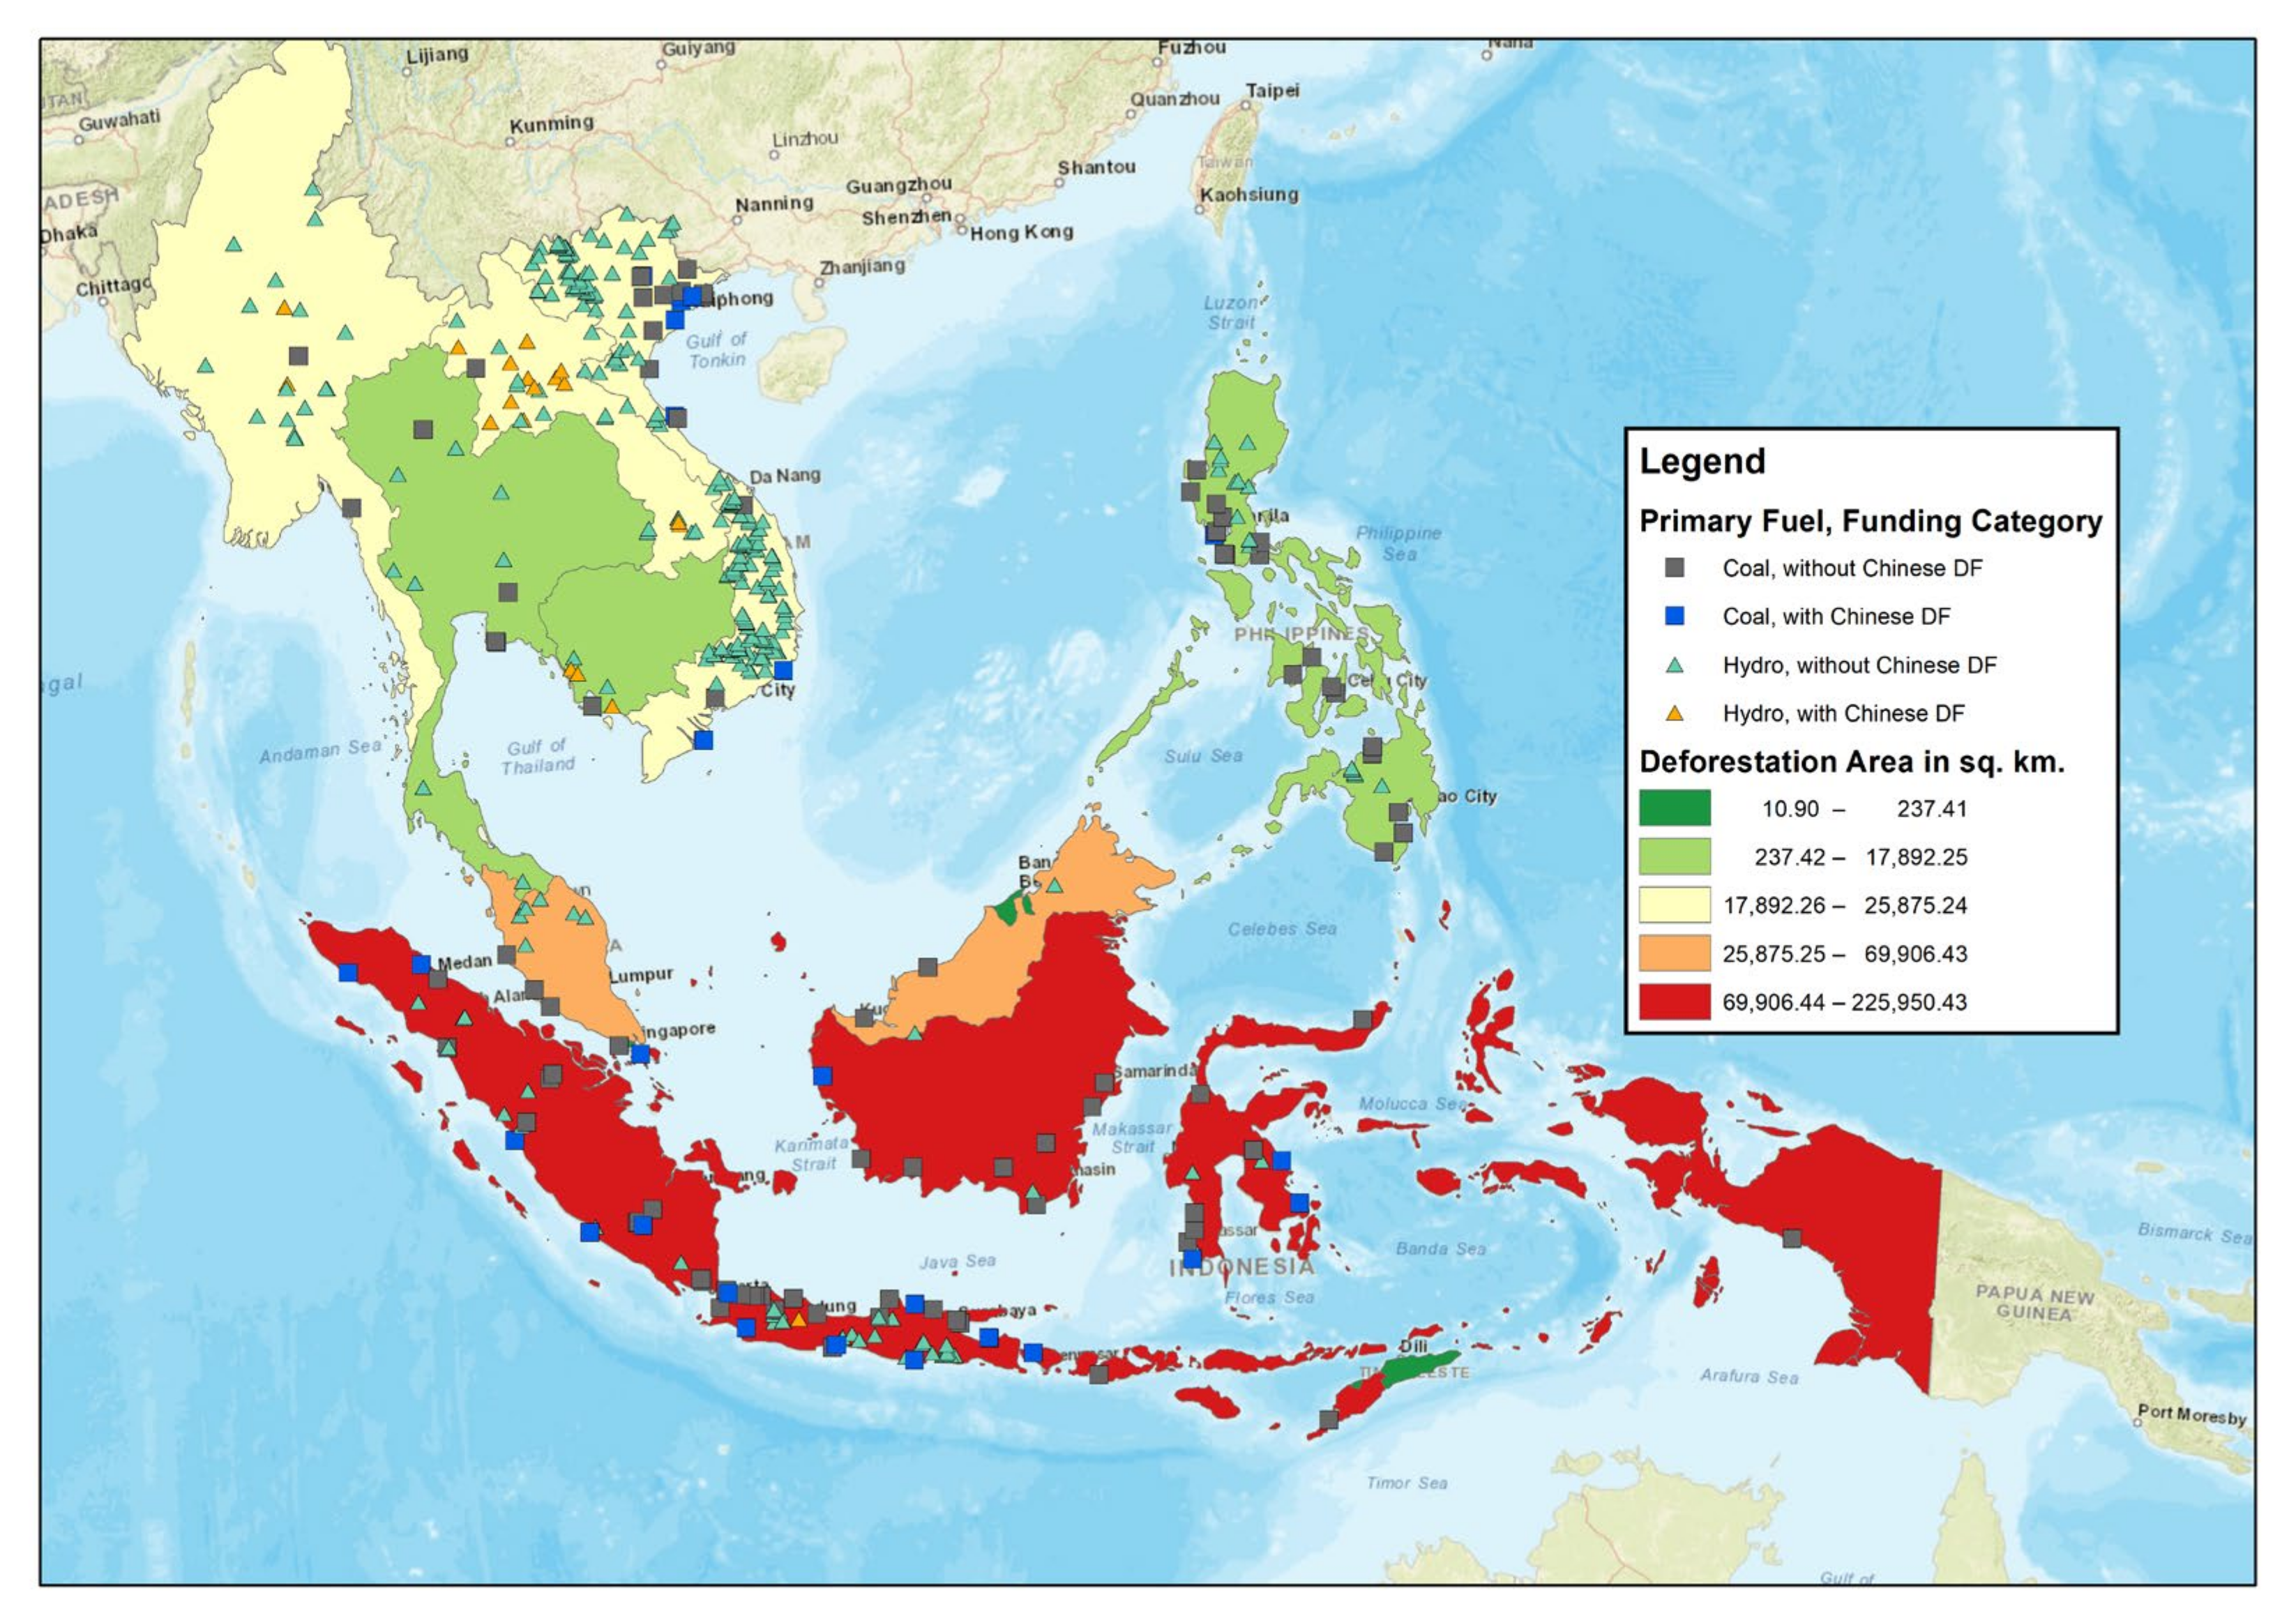
2.2.4. Power Generation Project Locations and Chinese Development Finance

In this paper we compared and combined the Global Power Plant Database published by the World Resources Institute [66], the WEPP (World Electric Power Plant) database [67], and the power generation project information in China’s Overseas Development Finance database [58]. According to the data compiled, as of 2018, Southeast Asia has approximately 184.3 GW of installed power generation capacity. About 59.3% of the current installed capacity is commissioned after 2000. However, the energy mix has remained almost unchanged. Coal, natural gas, and hydropower are the dominant power generation sources in the region (Figure 2). The China Development Bank (CDB) and the Export–Import Bank of China (CHEXIM) are the two major Chinese state-owned development- and policy-oriented banks that engage in overseas development finance (DF). Of the 109.3 GW power generation capacity added between 2000 and 2018 in Southeast Asia, more than 19% have some Chinese development finance involvement. According to China’s Overseas Development Finance database, which is the best available database on the overseas lending of the China Development Bank and Export–Import Bank of China compiled from public sources during this period in Southeast Asia, the Chinese development banks only financed coal and hydropower in the power sector. More than 36.9% of the coal power generation capacity and over 10.2% of the hydropower added over this period in the region have the Chinese development banks’ financial participation. Thus, to make a fair comparison, this study only examines coal and hydropower projects in the region that are the foci of Chinese development finance.
The spatial database also includes relevant spatial data related to forest cover and biodiversity for assessing the impact of the energy investments. There are 398 coal or hydro energy investments without Chinese development finance and 51 with Chinese development finance in this database. The two sets of investments in coal and hydro are shown in Table A1.

2.3. Methods

To visualize Southeast Asia’s biodiversity, we created a species richness map using the IUCN Red List species geographic ranges at a raster resolution of the GFC dataset. The IUCN has assessed terrestrial taxonomic groups and prepared polygon maps. This study’s first step rasterizes the vector IUCN ranges to sum up across all species, resulting in a species richness count representing the number of species potentially occurring in each pixel. Figure 3 shows the IUNC’s species richness in Southeast Asia. Each panel uses a range of colors from red to blue, indicating high to low species richness. Panel 3a displays amphibians, while 6b–6e shows reptiles, mammals, freshwater groups, and marine fish. Each panel shows a different pattern of richness. Mammals (6c) exhibit the highest species richness in peninsular Malaysia, Borneo, Sumatra, northern Vietnam, and eastern Myanmar. Reptiles are similar but are limited to only peninsular Malaysia, Borneo, and Sumatra. Panel 6e shows sharks, rays, and chimaeras with the highest concentration near Taiwan.

2.3.1. Species Richness and Weighted Range Size Rarity

Many studies aimed at identifying high-priority areas have utilized species richness to highlight biodiversity hotspots. As high/moderate-resolution land cover and climate data are more readily available from remote sensing, some studies have suggested rasterizing IUCN geographic ranges with high-resolution cell size. However, doing so would overestimate the actual species richness value due to scale mismatch [68]. Instead of using species richness as a metric for biodiversity, we calculated species weighted range size rarity for each energy investment buffer zone to address the scaling issue. We calculated a weighted range size rarity for buffer zones in R (R Core Team, 2020) based on species range maps of IUCN, which is defined as:
w r s i i = j w j q i j
where w j is the weight assigned to species j in the prioritization and q i j is the fraction of species j ’s range falling within the buffer zone of energy investment i [69]. This measure lowers the contribution of wide-ranging species to overall species richness and highlights areas with a relatively high proportion of narrow-range species.
Our choice of weights assigned to species is guided by the severity level in the IUCN categories (Table A2). We assign the following weights: critically endangered = 8; endangered = 6; vulnerable = 4; near threatened = 2; least concern = 1; data deficient = 2 [70].
A high value of weighted range size rarity within the buffer zone indicates that this buffer zone can have one of the following:
  • High species count overall.
  • High species count with greater weight.
  • Species with narrow geographic ranges.
  • Any of the combination above.

2.3.2. Deforestation Estimation 2000–2018 in Southeast Asia

Deforestation is estimated using Hansen’s Global Forest Change. The Google Earth Engine is utilized to estimate forest loss in every observation year in each Southeast Asia country in the WWF ecoregions and energy investment buffer zones. The year 2000 is selected as our baseline to estimate subsequent yearly forest loss. We also looked at the forest cover changes for each energy investment four years before the commission year. A four-year window was chosen because it is the average time from construction to a typical power plant commission.

2.3.3. Geocoding and Buffering Power Generation Projects

The impact of power generation projects could reach beyond the site of the power plant. For thermal power facilities, transporting fuels and electricity transmission are the main factors that cause land use change; for hydropower, wind, and solar power, the generation facilities are much more land intensive [47]. Meanwhile, indirect impacts such as other road constructions, land clearing for agriculture, human migration, increased poaching, etc., might result from the construction of power facilities. As comprehensive location data are only available for power generation facilities, this study only compares deforestation trends near power plants, using spatial buffer areas to account for the transportation impacts of fuel and electricity transmission.
The power plants have two labels—type of fuel source and whether they involve finance from Chinese development banks. They are geocoded as point information on the map, and each location is buffered at 1, 2, and 10 km distances to estimate the biodiversity or species richness that faces potential impact and deforestation [23]. The World Bank and available local guidelines require buffer distances of within 1 km. We expand the minimum buffer to 1 km for safe estimates. However, past studies find significant differences in disturbance sensitivity between species groups and specific cases. Bird populations seem to be affected within a few hundred meters of infrastructure. In contrast, a reduction in mammal populations has been found at distances of a few hundred meters up to several kilometers from infrastructure [71,72,73,74]. Therefore, larger buffer distances, which may better reflect the impact on different species and footprints of transportation, transmission, or other indirect impacts related to the power generation project, are also used in this study [23].
The section below elaborates the study’s specific methodology. On deforestation trends, we analyzed deforestation in the buffer areas of projects commissioned between 2000 and 2018, four years before the commission of each investment. This scope limitation narrows the number of projects studied in this paper down to 272 projects without Chinese development finance and 30 with Chinese development finance. Past studies found that mammal and bird population densities significantly declined with their proximity to infrastructure from the perspective of biodiversity risks. Bird populations were more impacted at a shorter distance from infrastructure than mammal populations. We categorize three levels of risk based on buffer distances around each energy investment. Each level is selected based on sensitivity to impact. Level 1 impact is defined with a buffer distance of 1 km, considering the IUCN categories in the immediate vicinity, Level 2 impact is a distance of 2 km, while Level 3 impact is a buffer of 10 km. Each IUCN level is examined in each risk buffer, providing insights on conservation risk priorities resulting in a total of 18 combinations (3 risk categories, 6 species groups). We then examine those combinations in each category using multivariate ANOVA (MANOVA) and univariate ANOVA tests. We used MANOVA to extend ANOVA’s capabilities to assess multiple dependent variables simultaneously. MANOVA tests helped differentiate the group significance of energy investments based on five variables, weighted range size rarity, power capacity, and changes in deforestation area, core, and bridge areas during the four-year period. ANOVA enabled us to test the significance of one variable at a time. We used the R (R Core Team, 2020) to derive MANOVA and univariate ANOVA results.

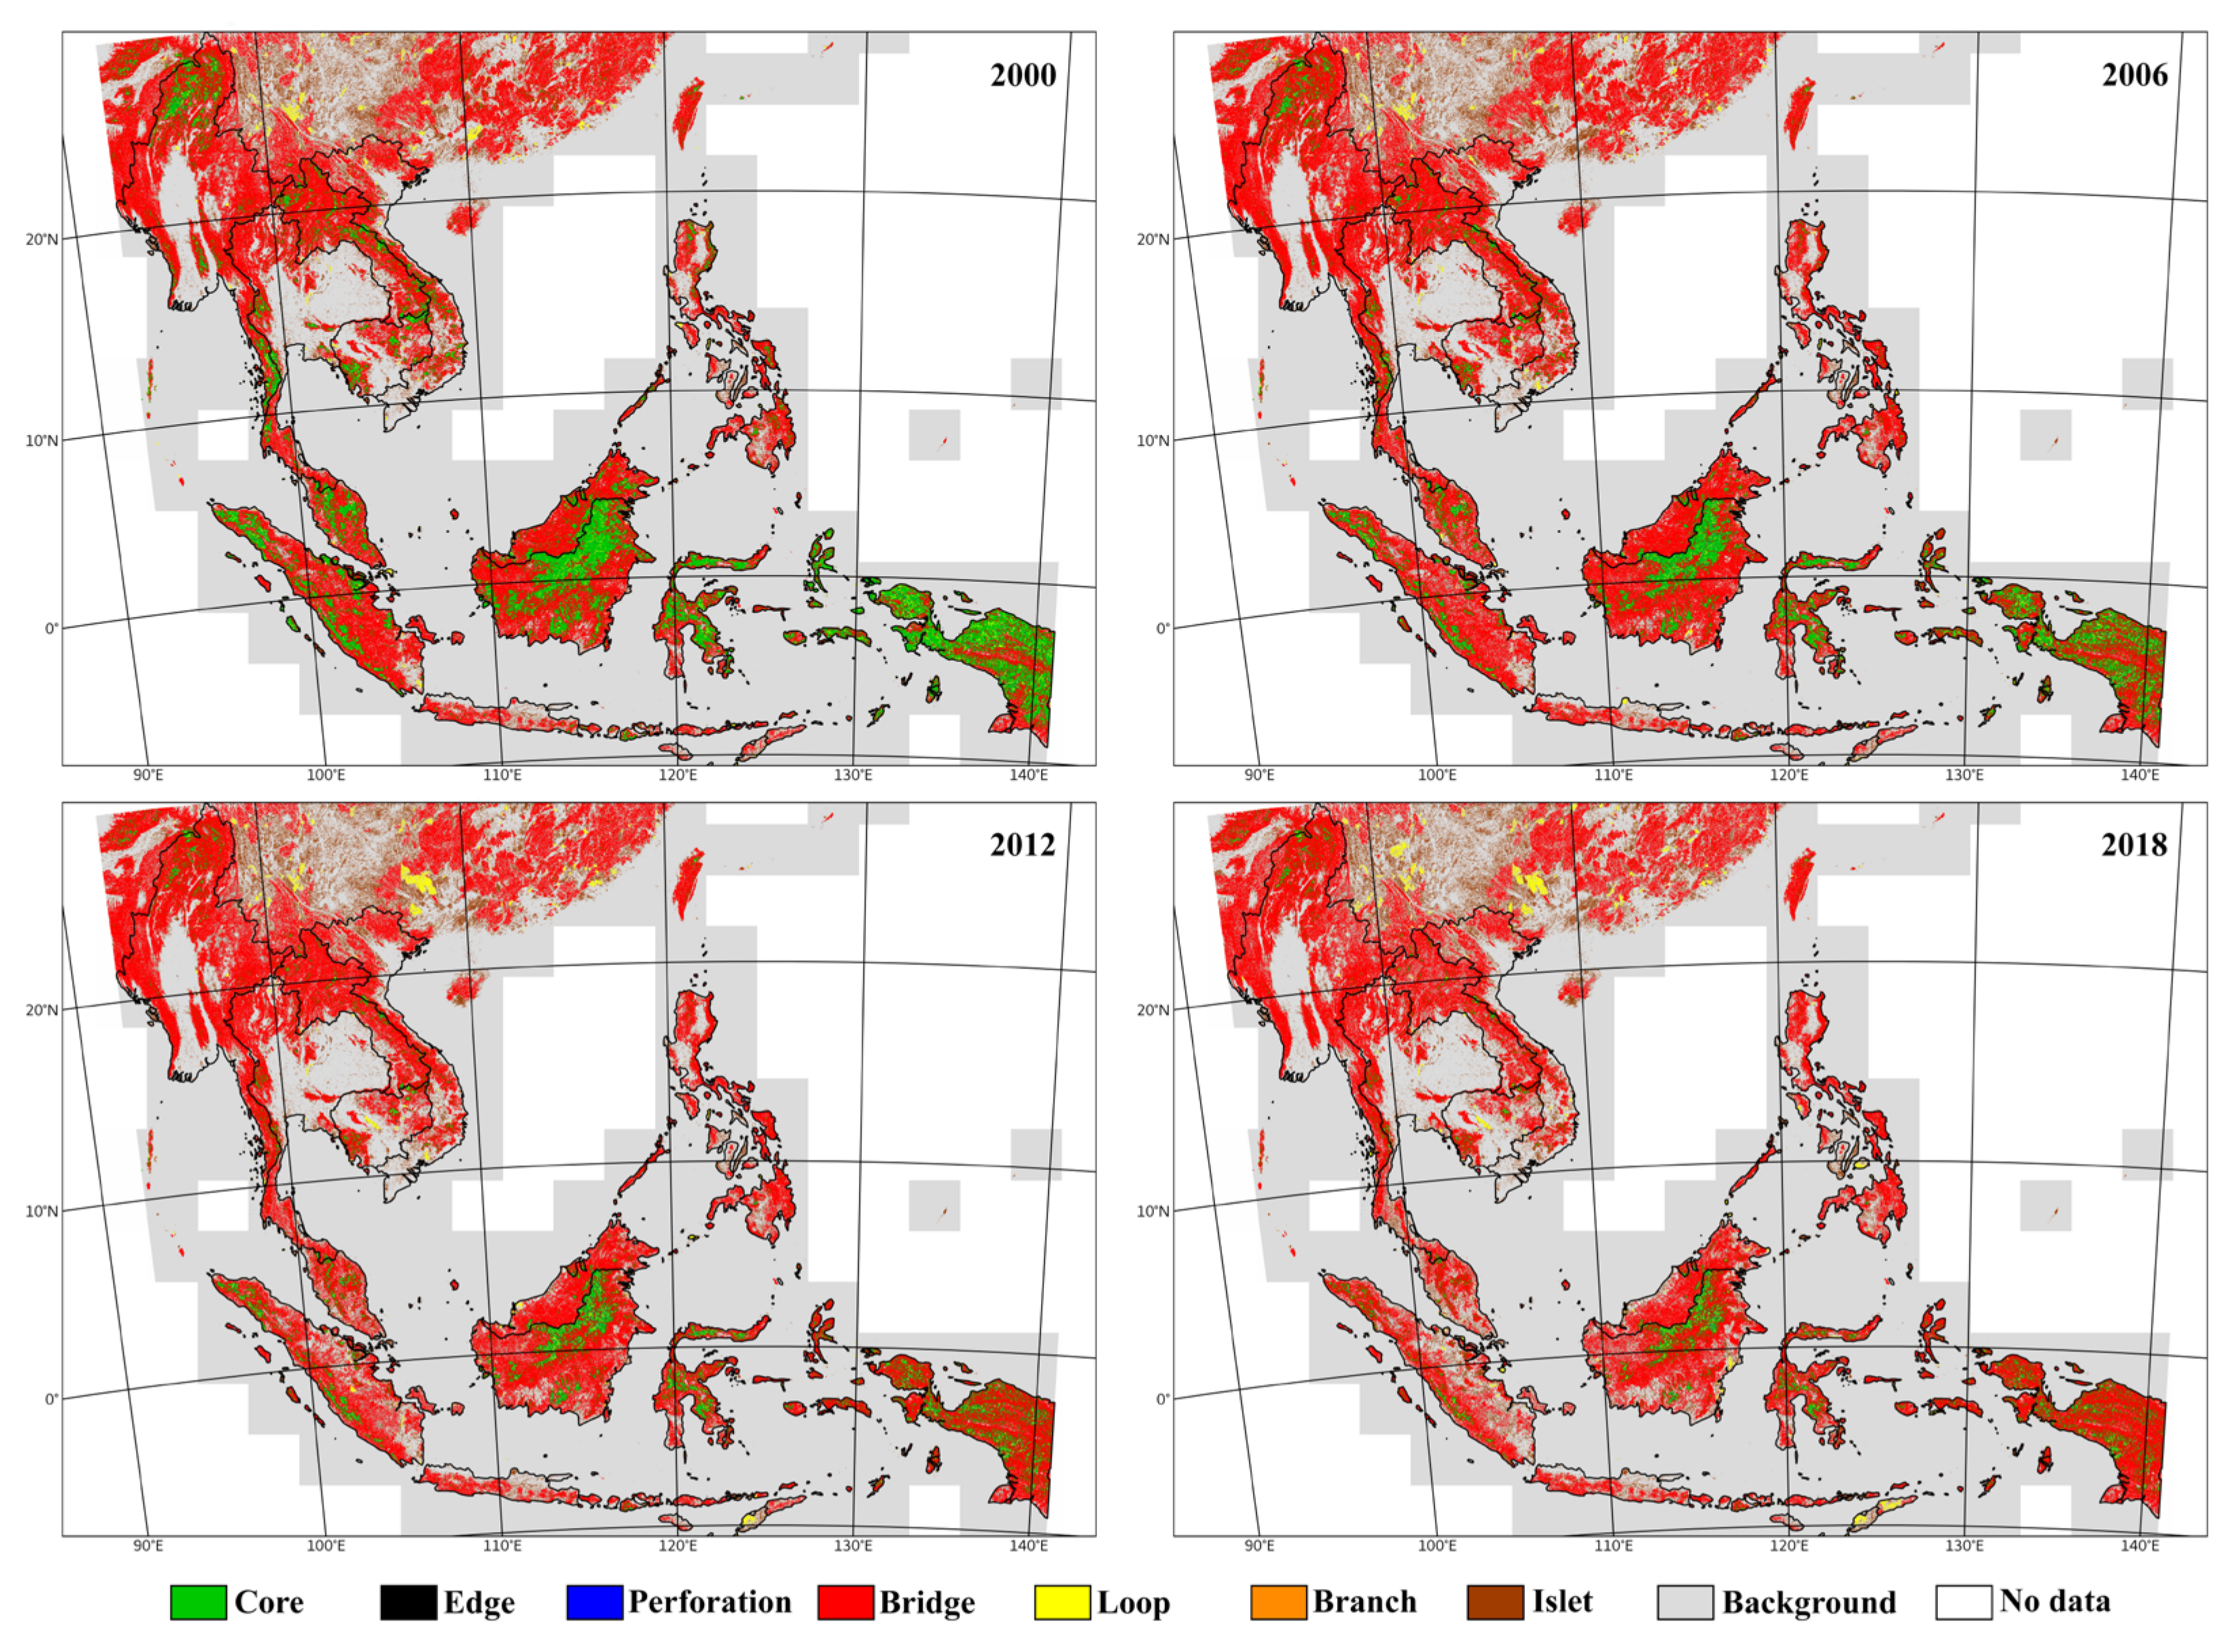
2.3.4. Morphological Analysis

We estimated spatial forest pattern and landscape connectivity using a morphological spatial pattern analysis (MSPA) toolbox (GuidosToolbox 2.6 version 4) [75]. The Global Forest Change was preprocessed into binary foreground/background image (forest/non-forest) for each year from 2000 to 2018. We selected a threshold of 900 m to define intact forest patches, forest corridors, and islet forest-isolated patches. Due to Southeast Asia’s geographic extent, the yearly tree cover image was recoded and split into tiles with dimensions of 9984 pixels (multiple of shardSize, an export parameter of GEE). This tiling process allows for parallel processing and overcomes computing memory constraints (10,000 pixels). The MPSA explicitly addresses the forest’s morphology and segments the image into seven distinct forest landscape elements. Core forest refers to interior areas of forest located at a distance of (≥900 m) from the nearest forest edge, while edge forest refers to external forest perimeter of (<900 m). The 900 m edge distance threshold is the midrange indicator of the potential edge effect on forest patches [76]. Next, a loop refers to a corridor connecting the same core area on either side, while a bridge refers to a corridor connecting different sections of a core-forest patch. Islet refers to disjointed and small locations of intact forest in contrast to a perforation that characterizes an internal object perimeter [75,76]. We deploy the MSPA application to examine the deforestation process and use the segmentation methodology to characterize differential impacts in China and other countries’ energy investments.
Workflow using the GFC dataset:
  • Using the tree cover of 2000 as a baseline, we can determine which forest cover pixels are lost per year based on a simple differencing. Each loss is denoted by the specific loss year.
  • Power plant buffer zones, country boundaries, and ecoregion boundaries were used to generate deforestation areas (for the boundaries mentioned above).
  • The remaining forest cover each year (determined by Tree Cover 2000 and loss year), were used as input for the GuidosToolbox for MSPA analysis.
  • The MSPA analysis results were tabulated with the power plant buffer zones, country boundary, and ecoregion boundary.

2.3.5. Ecoregions

We used the WWF Global 200 ecoregion product and filtered Southeast Asia ecoregions. Figure A4 shows each ecoregion’s distribution based on country boundaries. Indonesia has the largest number of ecoregions. The two largest ecoregions in terms of area are the Borneo lowland and montane forests and the Sumatran Islands lowland and montane forests. An ecoregion can be distributed across one or multiple countries. For instance, the Naga–Manapuri–Chin Hills moist forest is found mainly in Myanmar, while the Indo-China dry forest is located over multiple countries: Vietnam, Thailand, Laos, and Cambodia.

3. Results

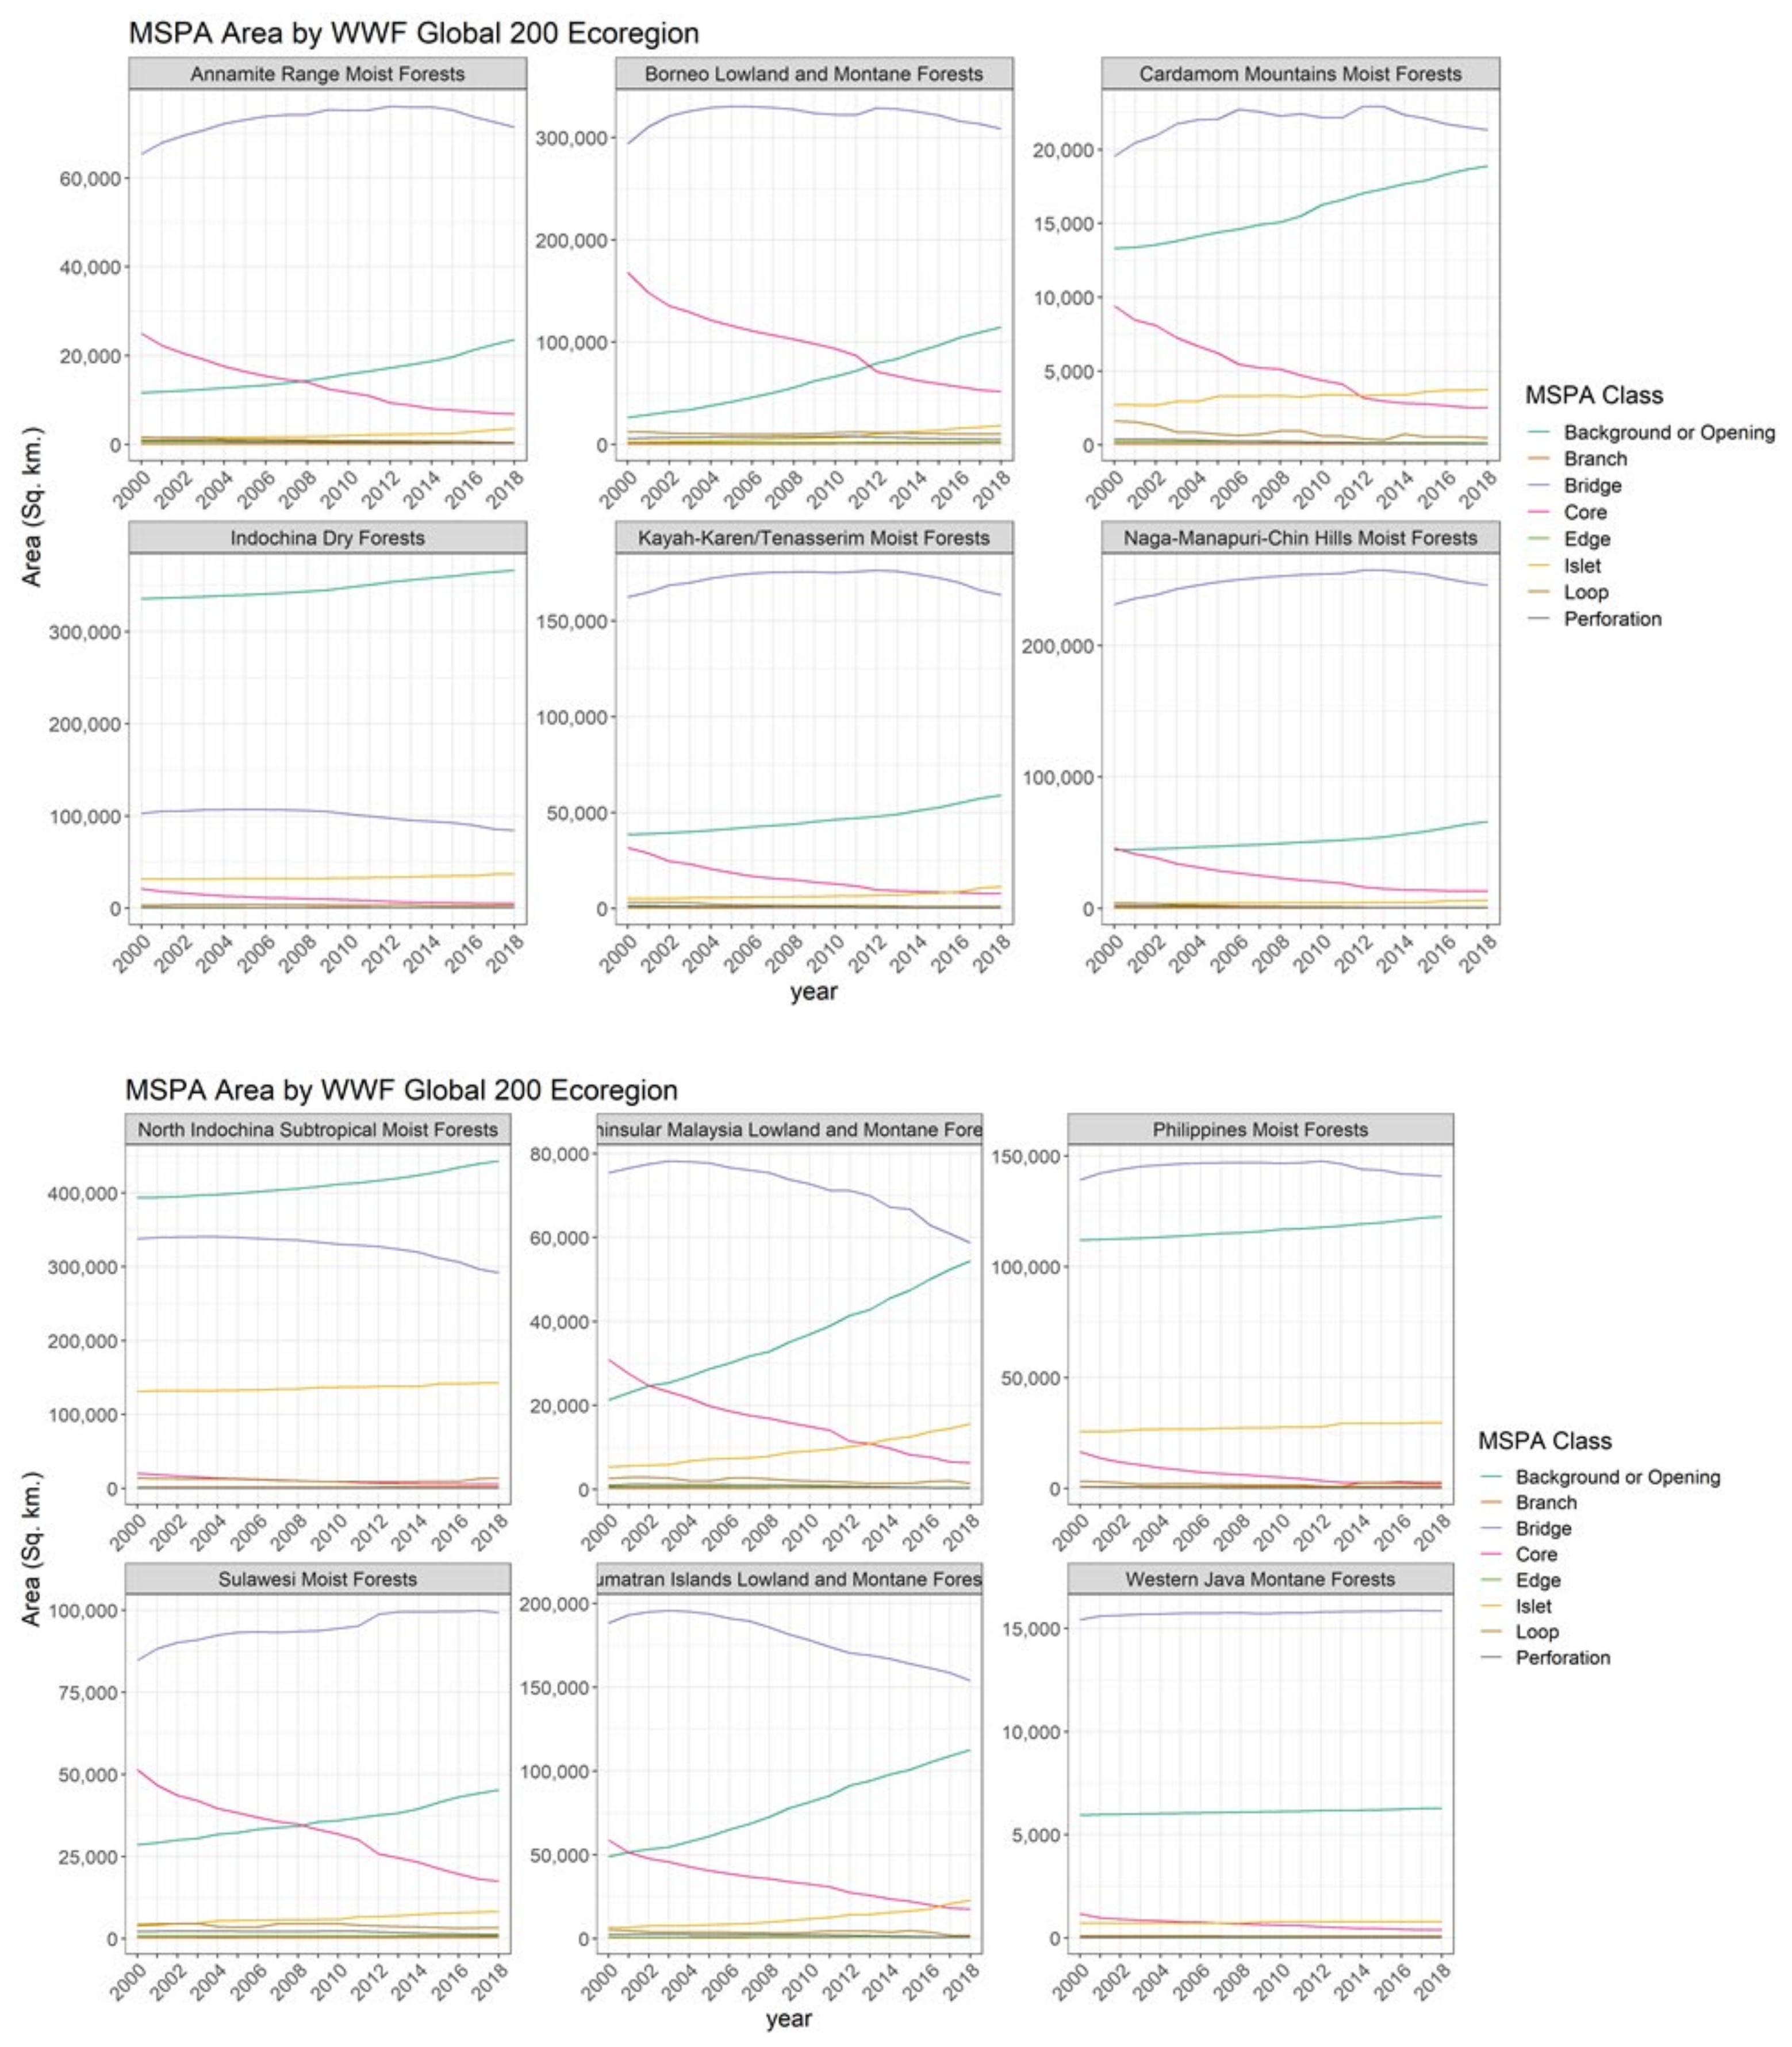
3.1. Characterizing Deforestation Trends in Southeast Asia Based on MSPA

First, we estimate the deforestation areas in countries during this period based on a time series of global forest change, assessing deforestation impacts in forest patch morphology. Most of lowland Southeast Asia was historically covered in hyperdiverse mixed dipterocarp forest of various types, with higher altitudes under a lower stature but still diverse montane forest. Nearly all of the original forest cover is already gone [77], with bridges and loops the dominant deforestation morphological structures. Bridges connecting different core areas (shown in red) are usually somewhat degraded and strongly modified by edge effects. A single core forest patch can be broken up into smaller areas, connected by loops (shown in yellow). Other morphological structures such as perforations or islets are often not visible at this scale due to their small sizes. The net result is a degraded forest in which only minimal areas are free of edge effects from some or all directions. We have yet to examine the impact of this pattern of erosion on tree species loss, but it could have a major impact on the current forest structure and its future trajectory. For example, tree species that require deep shade to germinate and mature are likely to be at higher risk than sun-tolerant forms. These tree species’ composition shifts will likely have knock-on consequences for animal communities as well as structurally dependent plant life forms such as lianas and epiphytes, with multiplicative impacts on all other taxa. Figure 4 shows the MSPA analysis for Southeast Asia in 2000 and 2018 with an edge distance of 900 m. Figure A5 shows that deforestation is consistently increasing within the region, particularly in Cambodia, Indonesia, Vietnam, and Laos, as viewed from the perspective of a rapidly expanding matrix (green line) of non-forested land use. Core forest loss, shown in pink, has been phenomenal, particularly in Indonesia in the last two decades. There were very few intact core areas (shown in green) left in Indonesia during this time. The MSPA analysis shows other countries, including Cambodia, Laos, Malaysia, and Vietnam, as having experienced core and edge forest losses over the last decade. These are to varying degrees but uniformly alarming with respect to the implications for biodiversity loss.
Next, we examine the types of significant differences in the morphological patterns of deforestation in various ecoregions. The core forest in the Sulawesi moist forest and the Sumatran lowland and montane forest has been roughly halved, dropping from around 50,000 km2 to less than 25,000 km2 in the last two decades. Even more dramatic is the core forest loss in the Borneo lowland and montane forest ecoregion, which have dropped from 190,000 to 50,000 km2. The Cardamom Mountains moist forest has similarly lost core forest from 100,000 to less than 50,000 km2 within the last two decades—this despite periods of relative stasis when conservation measures were episodically effective.
The patch morphology called “bridge” is of critical importance for wildlife highways, preserving the value of diminishing core forest patches by connecting them and maintaining gene flow and population viability. Here changes in forest bridge habitat are shown in purple. In some countries (Myanmar, Cambodia, Indonesia, Laos, Malaysia, Philippines), forest bridges increase at first and then decrease, indicating forest encroachment, followed by development and rising or total deforestation. The feature called “edge” is too small to be displayed in these graphs but plays a vital role in the forest disturbance and recovery regimes. Such morphological changes in deforestation have impacts on animal ranges and habitats. Orangutans once lived in large contiguous areas of intact rainforest, both in Borneo and Sumatra, but are now increasingly found at the edges of agricultural (oil palm) plantations and forest fragments, placing them at considerable risk. Another iconic species is the loris (Loris tardigradus), living in human-modified landscapes in Java, needing to use bridges to move from one patch of forest to another. Increasing human expansion [78] results in forest fragmentation, leading to an ever-greater reliance on bridges connecting the population fragments of forest-dependent species. The morphological change in the forest may have altered the loris’ habitat, and now the loris is on the IUCN critically endangered list.
Figure A6 shows the MSPA results by ecoregion from 2000 to 2018, profiling temporospatial change in forest patch morphology. The Cardamom Mountains rain forest’s ecoregion (top right first row) spans 44,288.8 km2 of rain forest plus some drier dipterocarp forest, a part of the Indo-Burma global biodiversity hotspot. It contains or until recently had included many rare, threatened, and endemic species, including the Asian elephant (Elephas maximus), tiger (Panthera tigris), and clouded leopard (Pardofelis nebulosa). It is also home to 450 birds and reptiles, such as the Cardamom Mountains wolf snake (Lycodon cardamomensis) and the Cardamom Mountains bent-toed gecko (Cyrtodactylus cardamomensis). Waterways in the Cardamoms are some of the last strongholds of many critically endangered freshwater species, including the Asian arowana (Scleropages spp.) and Siamese crocodile (Crocodylus siamensis). Its remote location and rugged terrain offered some protection in prior decades, but now this region is experiencing rapid and rampant deforestation. Its core forest has decreased from 9500 to around 2500 km2. Another ecoregion, the Borneo lowland and montane forests have experienced a loss in core forests from close to 170,000 to less than 52,000 km2 in this period [79]. This core forest loss has impacted several endangered and iconic species, including the Bornean orangutan, twelve other primate species, the Bornean bearded pig, and the Bornean yellow muntjac deer [76,80]. While these species vary in their degree of dependence on intact primary forest, its rapid loss and the drivers responsible for this loss pose an imminent existential risk to them all.

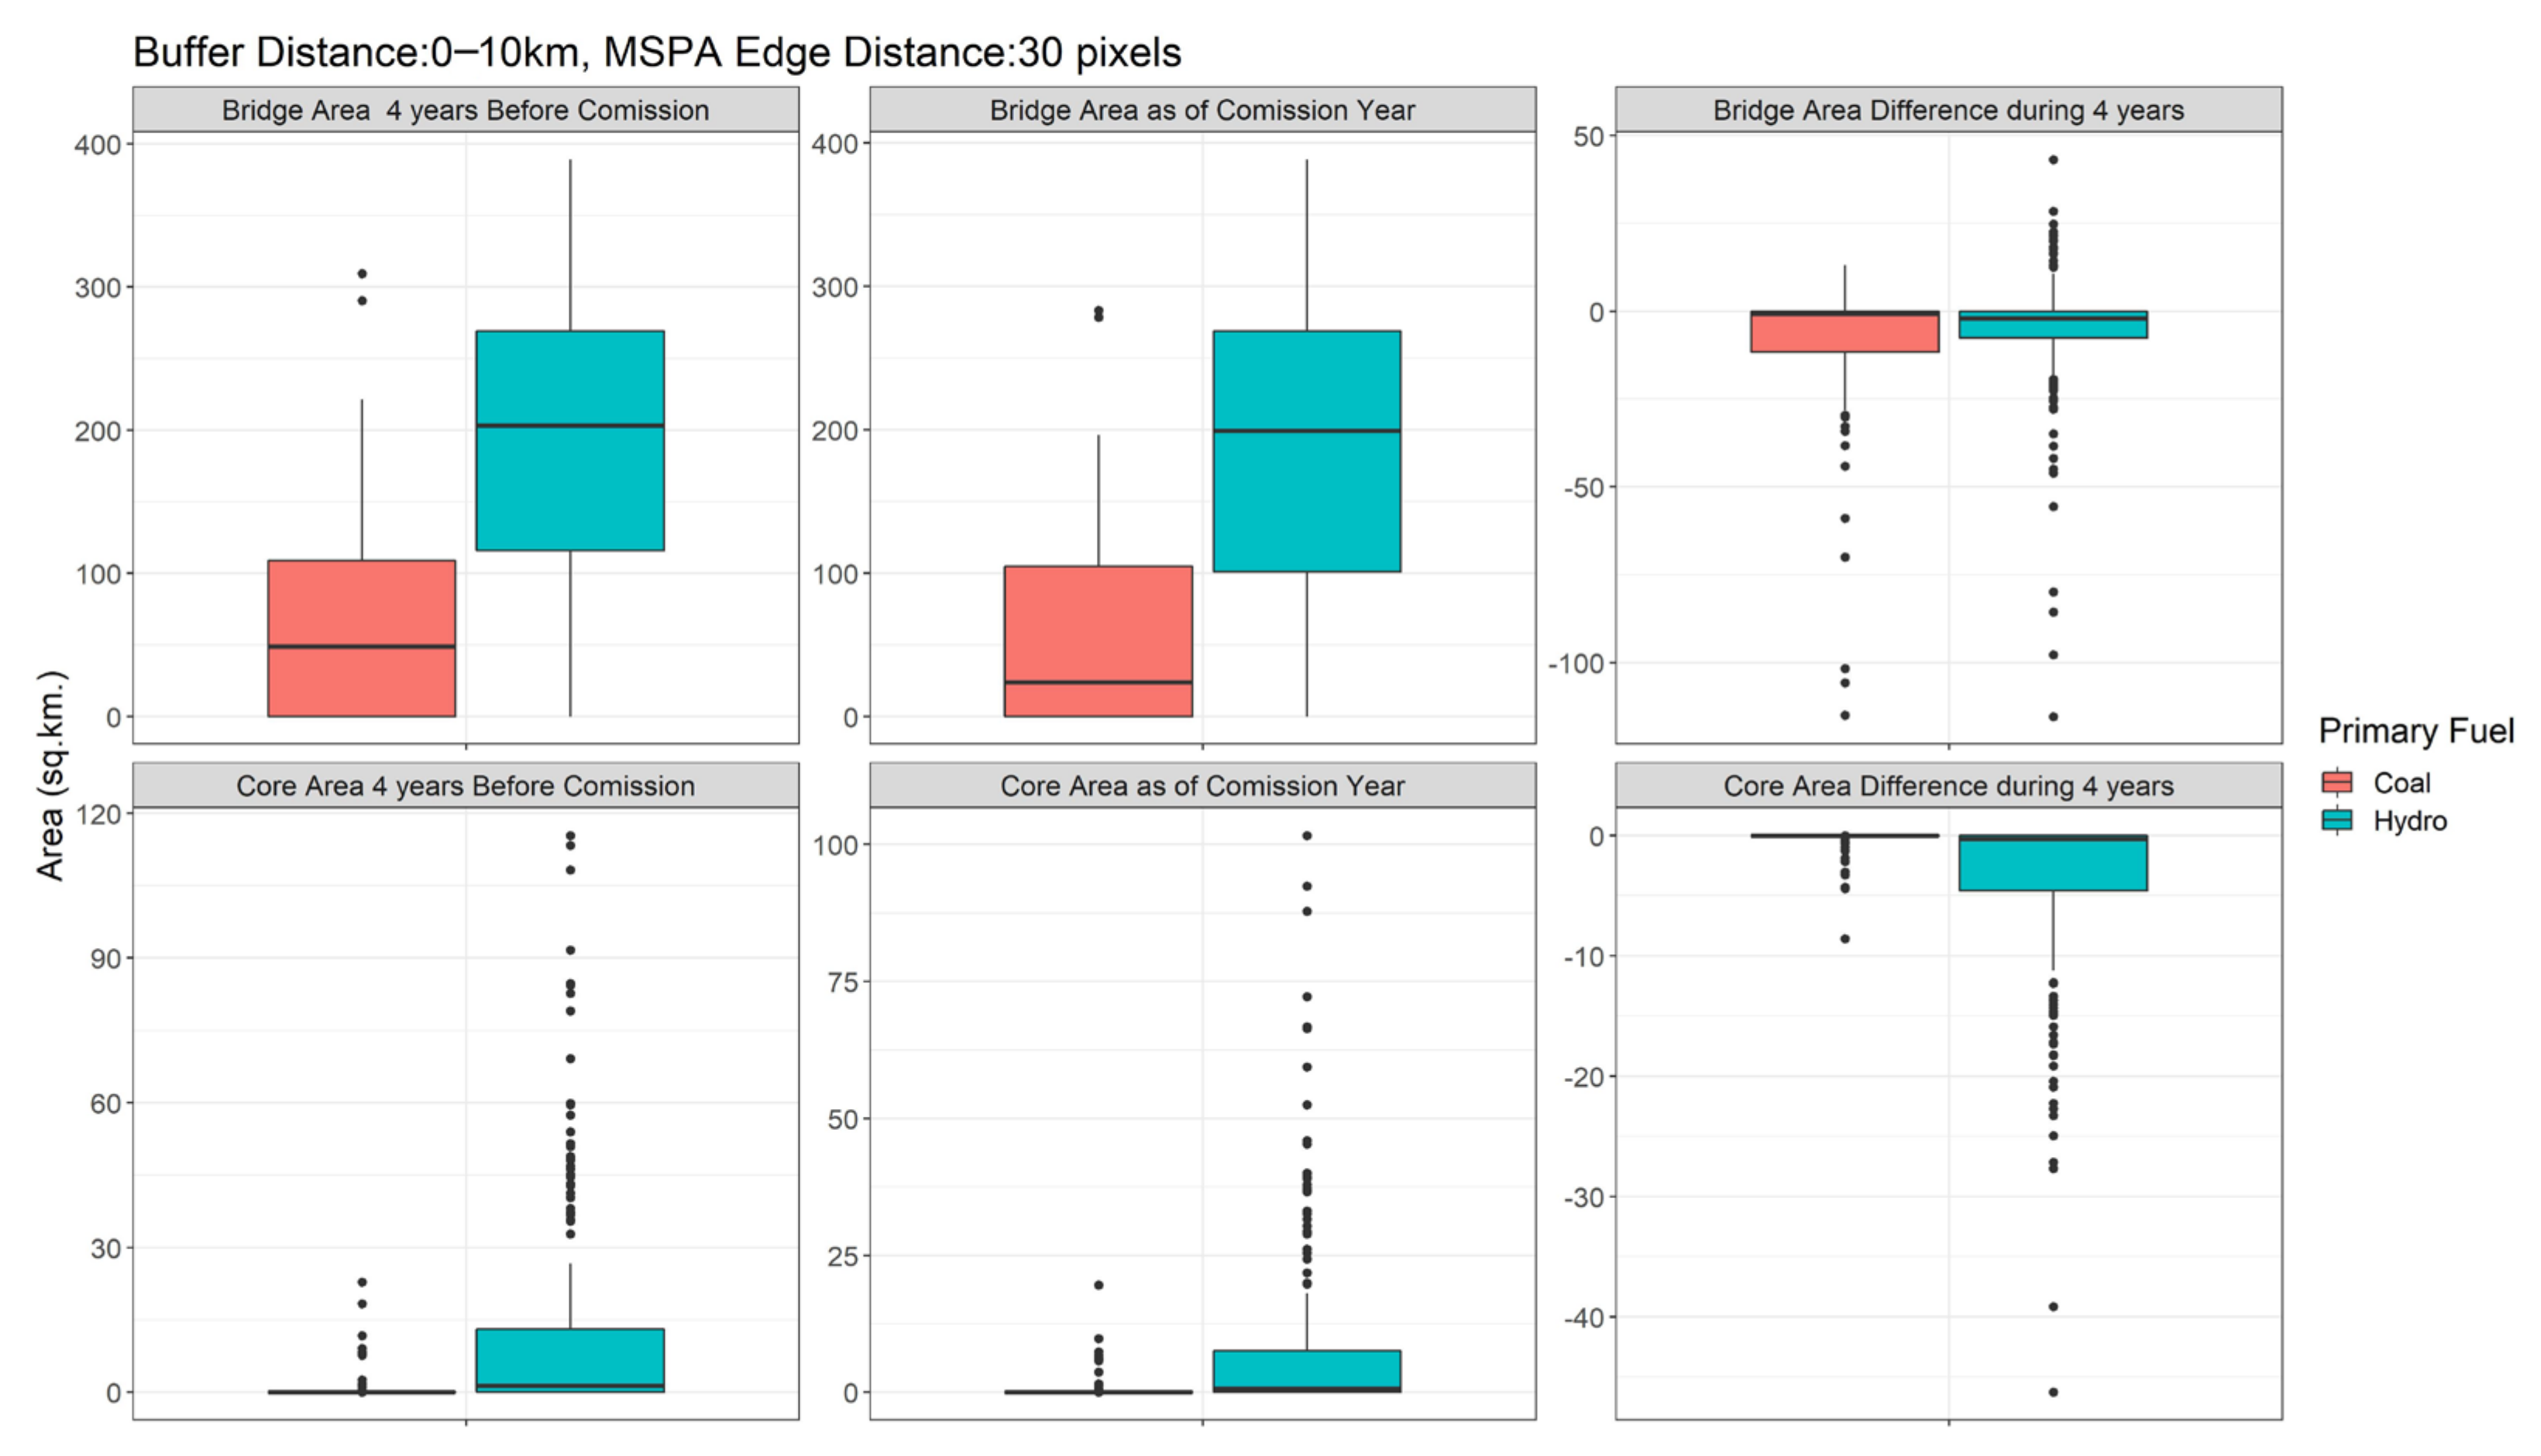
3.2. Differences between Coal and Hydro Power Plants in Southeast Asia

We ran a similar MANOVA and ANOVA test on coal and hydro power plants to determine if the corresponding differences emerge as with the previous tests. We found no significant differences in deforested areas during the four years before commissioning. However, there are critical differences between coal and hydro energy power plants with regard to the changes occurring in the core and bridge areas in the same period (Table A3). For hydroelectric investments, the morphological differences (Figure 5 and Figure 6) are noticeable in larger buffer zones (10 km). In general, flooding areas associated with a hydroelectric reservoir result in the loss of core forest in the dam’s buffer zones. For example, Nam Ngum 2 Dam, located on the Nam Ngum River, one of the major tributaries to the Mekong, is a Chinese-financed hydroelectric project in Laos. The forest cover decreased by 7.3 square kilometers within the 10 km buffer area. Interestingly, the loss of bridge forest in buffer zones of hydroelectric and coal energy investments is similar, but some hydroelectric investment buffer zones lead to an extensive bridge area. Increasing forest area may be related to tree plantations, including non-native species such as rubber, eucalyptus, and acacia [81,82].
These patterns need to be understood based on the differences between coal and hydropower projects. Coal power plants generally have greater power capacity. However, four of the top five power plants in terms of power generation in Southeast Asia are hydroelectric. Some morphological differences in the energy investments may stem from the variation in coal and hydro power plants’ site selection factors. Coal power plants are located in relatively densely populated areas with high end-use demand nearby. Since large hydroelectric energy investments are constrained by proximity to rivers, they tend to be situated in forested or unpopulated areas that would “only” directly impact the indigenous population.
There are significant statistical differences in weighted range size rarity for amphibians as well as for marine bony fishes, sharks, rays, and chimaeras. The weighted range size rarity is much higher in the buffer zones of coal power plants than for hydro plants (Figure 6). That is perhaps due to coal power plants’ location near major population centers and major cities in Southeast Asia, mainly near the coasts.

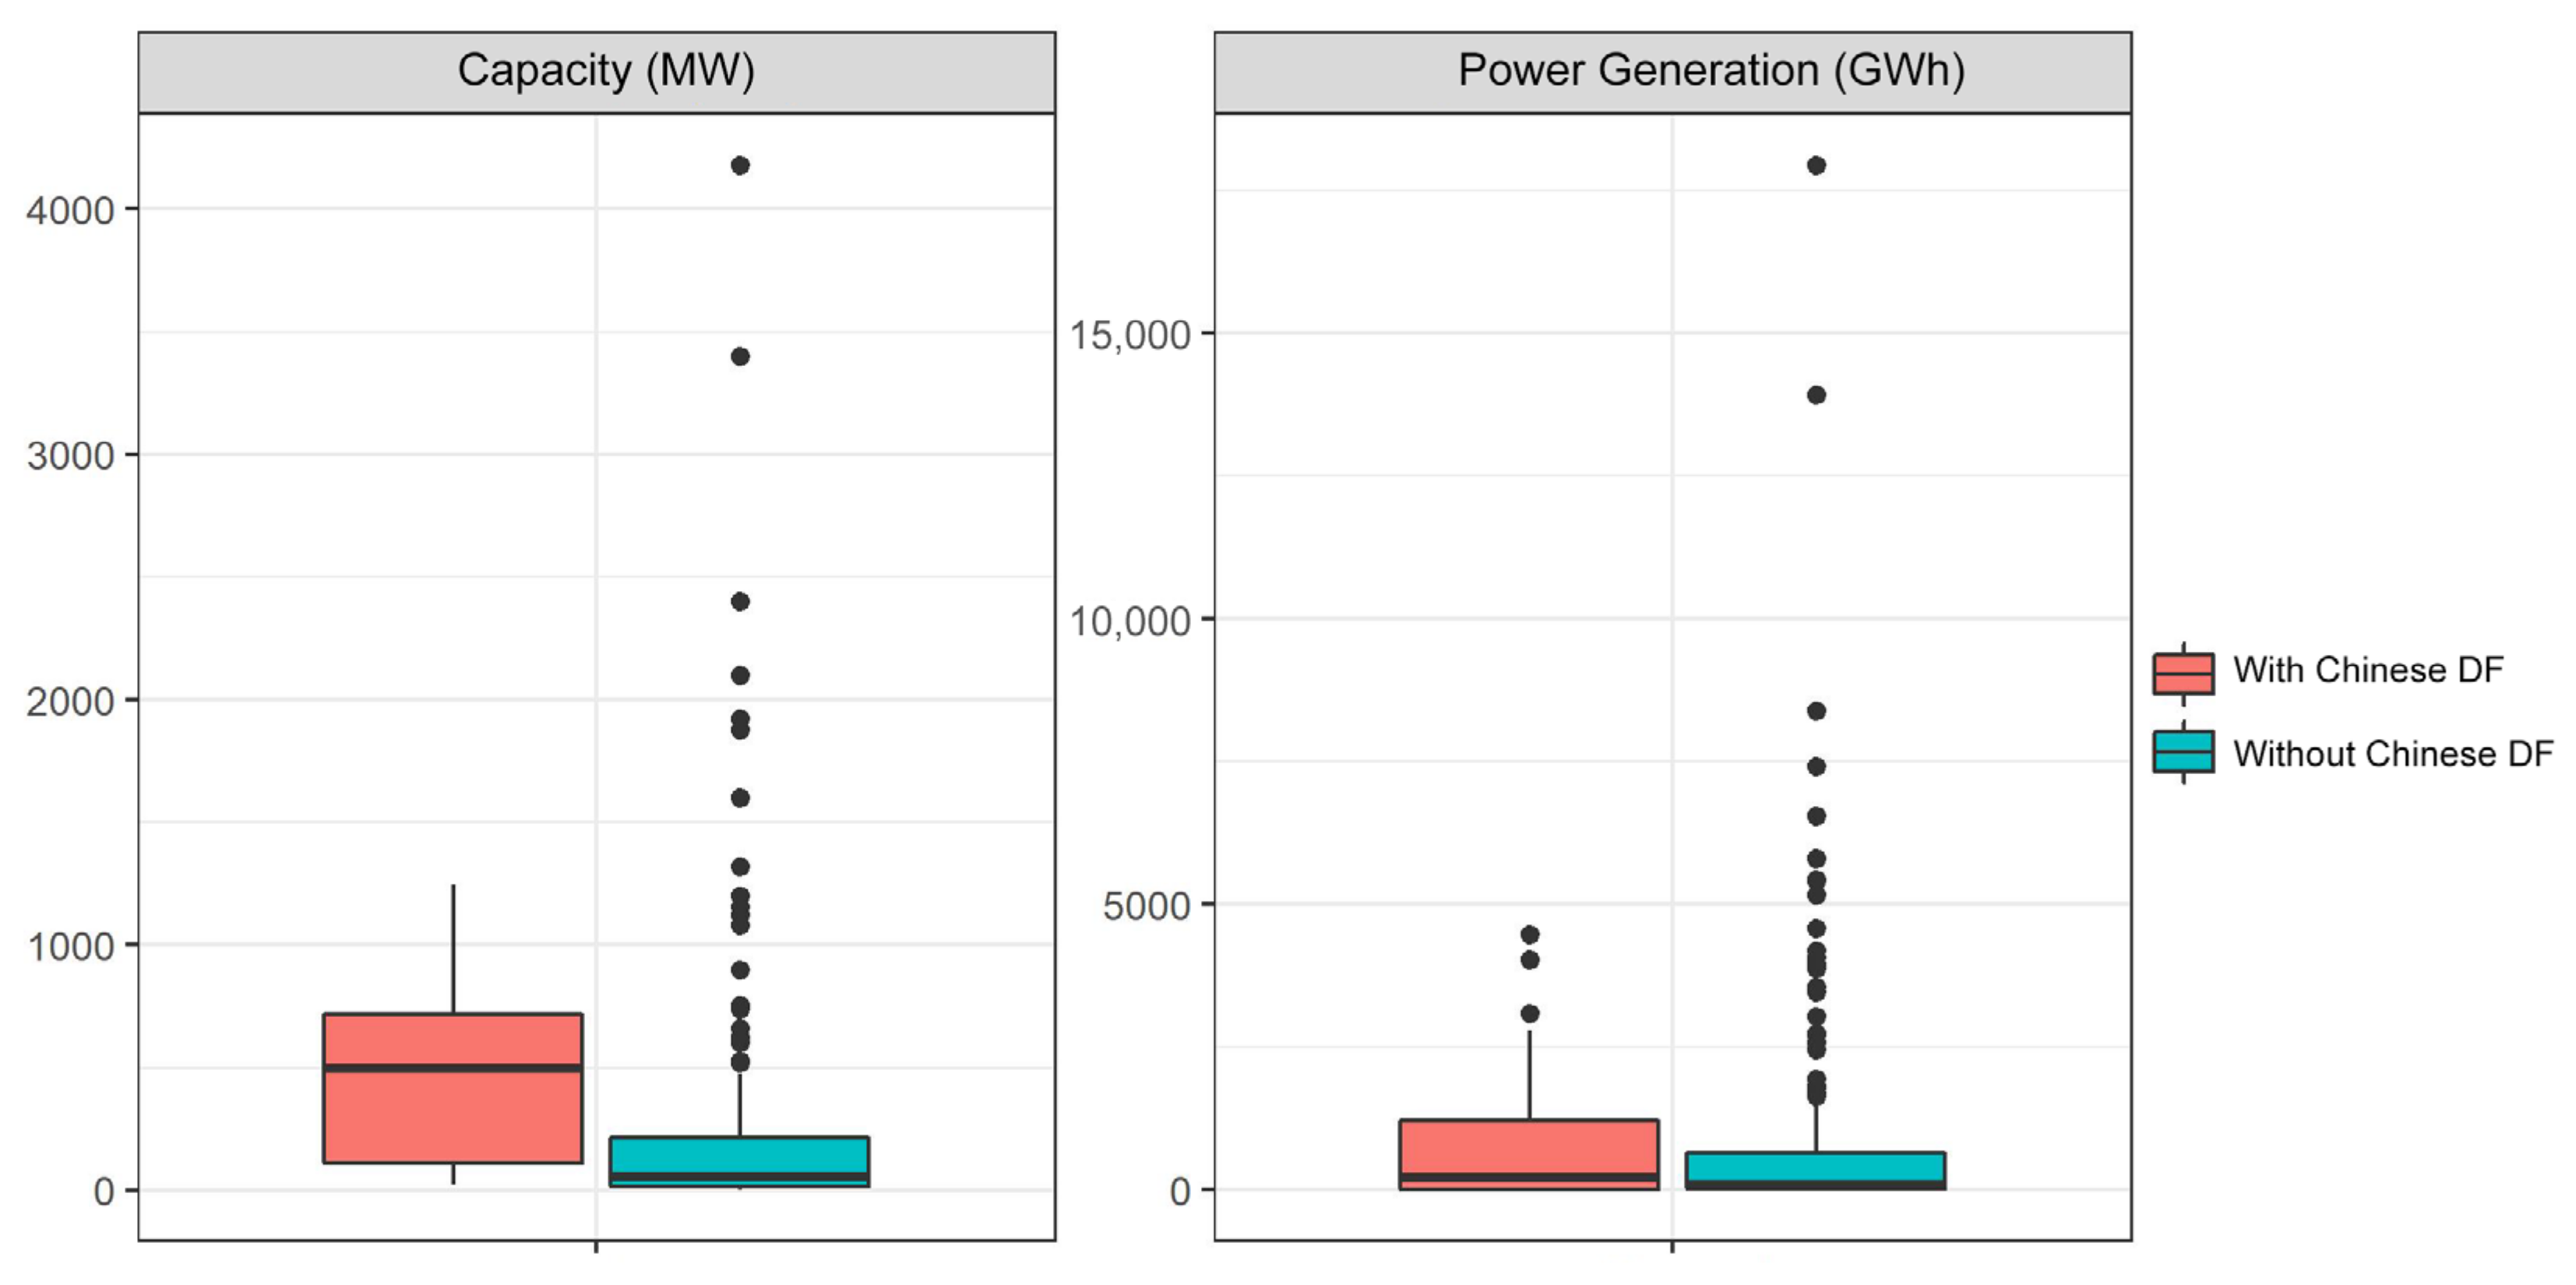
3.3. Differences between Power Plants with and without Chinese Development Finance in Southeast Asia

Next, we examine the differences between the impacts of power plants with and without Chinese development finance. The number of coal power plants with Chinese development finance is slightly higher (19 vs. 11), while for hydro investments, Chinese investments are lower (63 vs. 209). Chinese coal energy investments have greater power generation capacity on average (661 MW) than their counterparts (501 MW). Similarly, Chinese hydro investments have a greater average power generation, around 234 MW, compared with the hydro plants without Chinese development finance (average around 110 MW). Chinese-invested power plants consistently have the same power generation capacity. However, it is worth noting that power plants (coal or hydro) with the largest capacity are non-Chinese investments. The maximum capacity of the Chinese-invested coal and hydro energy power plants in Southeast Asia is 1244 MW and 790 MW; the corresponding non-Chinese-invested coal and hydro energy project capacities in Southeast Asia are 4180 MW and 2400 MW, respectively. Figure 7 shows the total power plant capacity in MW and GWh power production of power projects with Chinese investment (in red) and projects without Chinese investments (blue). The breadth in the range of plant capacity of the latter group is visible.

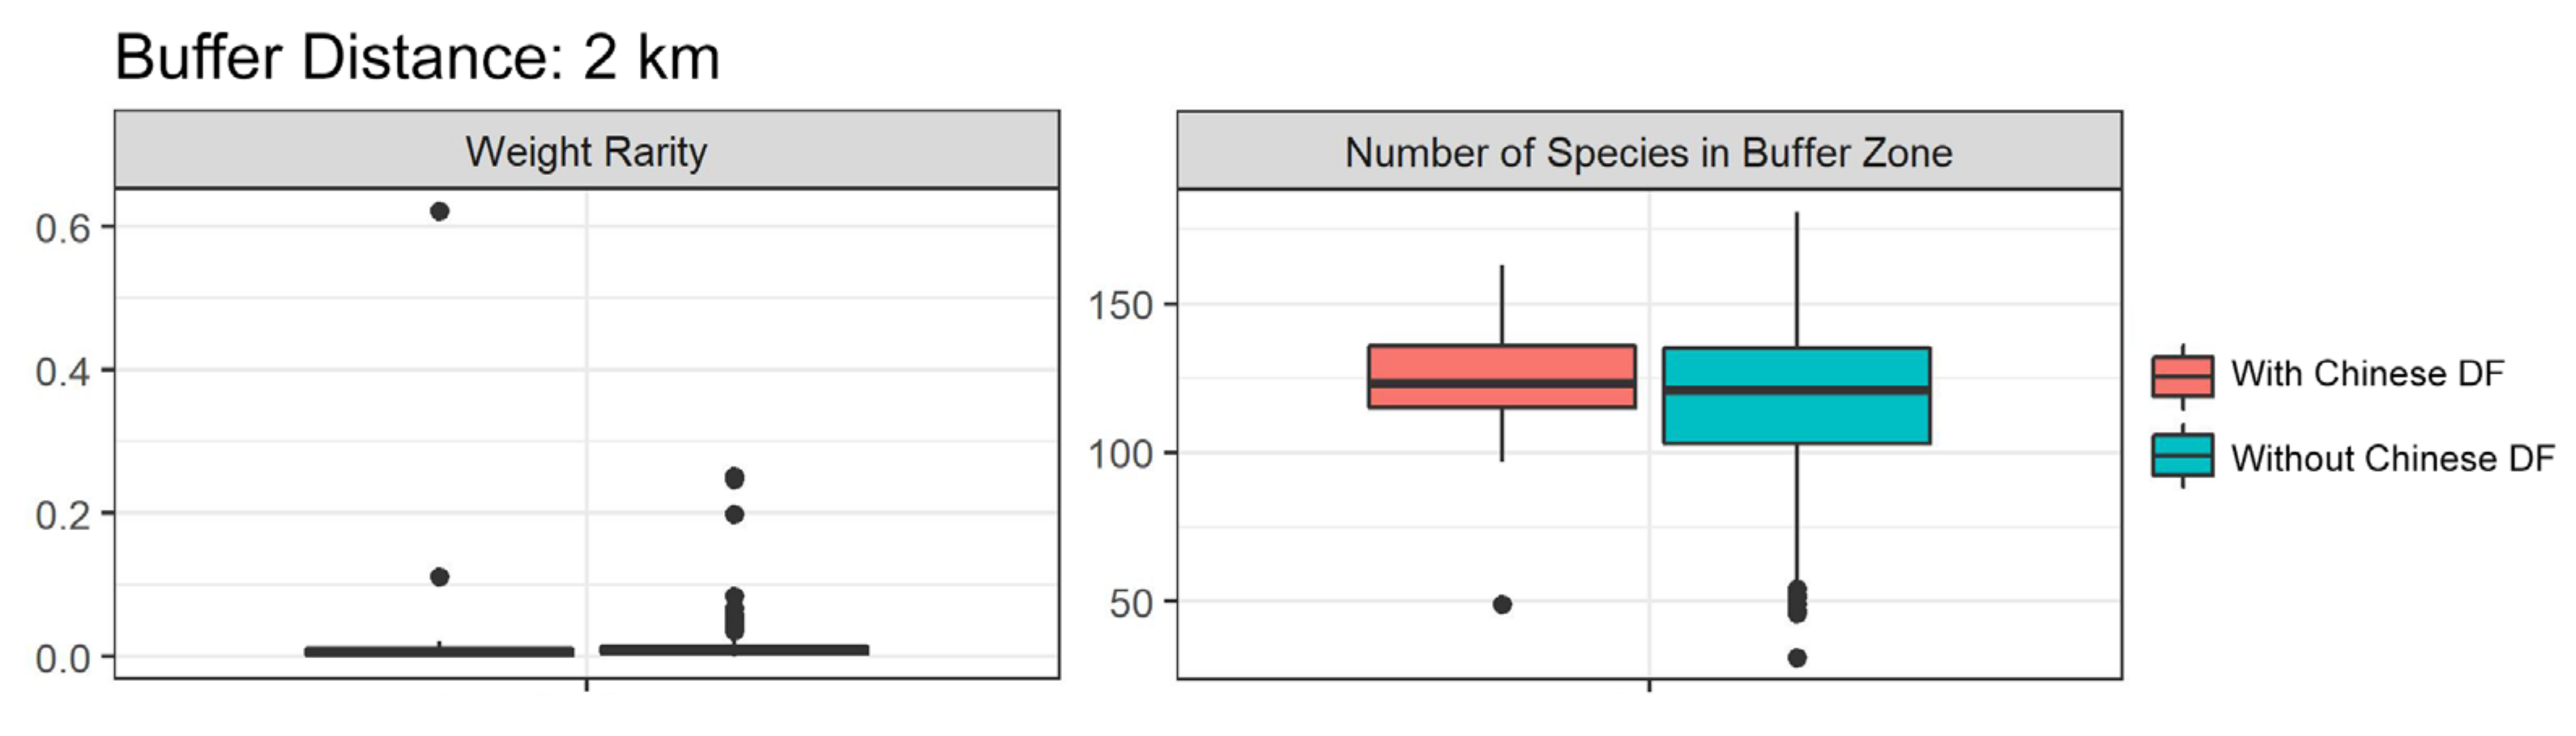
3.3.1. Significance Testing of Differences in the Impact of Power Plant Projects at Different Buffer Distances

We conducted MANOVA analyses to test if the impact of power plants with and without Chinese development finance within critical buffer distances are significantly different, with variables representing power plant characteristics and biodiversity metrics. Table 1 shows differences in statistical significance between the two investments in terms of buffer distances and species. We find that all three IUCN categories differ significantly in Chinese vs. non-Chinese financing at various buffer distances. This signifies differences between Chinese and non-Chinese energy investments, probably attributable to differences in investment strategy and location.
ANOVA tests for marine fish like vertebrates are significant at all buffer distances. The number of species in the buffer zone is also higher for power plants with Chinese development finance (shown in Figure 6). This is probably because Chinese-invested power plants are closer to the coast compared to their counterparts.
The weighted rarity for mammals in 1 km and 2 km buffer zones is significant, mainly because of one Chinese-funded power plant with a relatively high weighted range size rarity, the highest point in Figure A7. For example, PLTU Tanjung Kasam in Indonesia is a coal plant with a power capacity of 110 MW. Although the 2 km buffer zone of this plant overlaps with 49 mammal species, the weights based on the IUCN categories are high, resulting in a biased estimate for the weighted rarity for mammals resulting from Chinese coal investment. PLTU Tanjung Kasam is the highest point in Figure A7, and its weighted range size rarity value is more than twice as large as the second highest power plant in the lower right panel.
The deforested area is significant within the 10 km buffer in this analysis. Since the capacity of Chinese-invested power plants is on average consistent and higher than non-Chinese-invested power plants, this could explain that the deforested area is significant in larger buffer zones.

3.3.2. Significance Testing of Differences in the Deforestation Impacts of Power Plants with and without Chinese Development Finance

We used ANOVA tests to find significant discrepancies between the two groups of investments four years before and after the commission year. Figure A8 displays the statistical differences in the size of the forested area impacted by Chinese and non-Chinese investments at a 10 km buffer distance. We compare the top left panel in Figure A8 with the lower right panel. The range in the size of the forest area before and during the commission years is higher for Chinese than non-Chinese power investments. Also, both groups show deforestation during the four-year period. The rate of deforestation and the area of deforestation are greater for energy investments without Chinese development finance. The proportion of hydro power plants is likely higher in the non-Chinese investment group. Since Chinese-invested coal power plants are closer to the coast and population centers, the available forest in their buffer zones is lower.

4. Discussion and Conclusions

Our study in Southeast Asia provides a big data spatial framework to analyze the impact of energy investments on deforestation and biodiversity throughout Southeast Asia. We use the Global Forest Change—an extensive remote sensing dataset to estimate deforestation at 30 m resolution enabling us to examine yearly deforestation trends in every location. We further enriched our analysis by capturing the forest’s morphological structure through MSPA analysis. We utilized the IUCN data to analyze further biodiversity risk, a proxy for the complex biotic interactions among component species in Southeast Asia’s twelve ecosystems. Our study is one of the few studies to analyze deforestation highlighting the forest’s morphological structure, a key to understanding the impact of biodiversity loss in each ecoregion. Our study metrics would be relevant to developing robust, smart conservation plans in each country as they grapple with energy development and biodiversity trade-offs, the focus of a future study.
The path to sustainable development in Southeast Asia emphasizes energy investments. China’s energy investments in Southeast Asia are compared with other countries’ investments to understand and compare the risk to biodiversity in both coal and hydroelectricity. We analyzed the energy investments in terms of specific locations, power production, and impacts at various buffer distances. There are statistical differences in energy investments with and without Chinese development finance, mainly driven by the capacity differences and the locations of the two investment groups. We show the differential impact of the forest core and edge relationships of each power plant type on weighted species richness and species richness, based on statistical significance tests.
The rapid rate of tropical forest loss poses such a great and immediate threat to global biodiversity that most authors have gone for the throat and looked exclusively at total forest area lost. Operationally, however, the morphology of forest loss is of enormous biological importance and is also the scale at which policy modifications could make a big difference in species conservation, even independent of deforestation rates per se. The total forest area remaining tells only half the story: if core forest vanishes and corridor habitats are amputated, the days are numbered for all obligately forest-interior species. Prior studies in biodiversity and energy development rarely consider either the extraordinary diversity of forest types in Southeast Asia or their spatial disposition and morphology. A lack of accurate representation of ecosystem processes or proxies for them at a regional scale is the primary source of uncertainty in these studies. Our approach identifies the deforestation and biodiversity risk at a regional ecosystem scale. We are able to differentiate biodiversity impacts in the Borneo montane rain forest from the peat swamp ecosystem in Borneo using existing data sources for species richness and the weighted rarity of species. While there is ubiquitous globally relevant earth-observation data, challenges remain in translating the resulting analysis into biodiversity strategies on a regional scale. In this paper, we analyzed the morphological structure of the forest to further differentiate the impacts of the loss of core and edge forests in each ecoregion. The loss of core forests is critical in many regions. The apparent regeneration or restoration of corridor and bridge forests can look good superficially, but if the trees involved are exotic species, this can result in the substitution of weedy species for a large fraction of the native biota.
The tropical forest land of Southeast Asia is very close to ruin. However, the remaining pockets and protected areas still provide a basis for maintaining much of the indigenous biodiversity and for restoring viable tracts of forest habitat that could then be self-sustaining, along with all of their contained wildlife, once again. For this to happen, in addition to a development plan, each country and every major development initiative—particularly the Belt and Road Initiative—must also have a rigorous conservation plan. First, they must consider alternative development scenarios so that initial impacts can be minimized. Second, they must include an aggressive restoration program and timeline complete with the full extent of both remote and on-the-ground monitoring required for accountability and adaptive management in the development process. We propose that deforestation and afforestation morphology analysis, in conjunction with regular on-the-ground biodiversity survey work, can be a valuable tool in providing the much-needed accountability to provide metrics in assessing such trade-offs.
Our study underscores the importance of in-depth data analysis to reveal the environmental consequences linked to investments. As of now, no verifications have been made. From a theoretical standpoint, previous research by Lechner et al. [83], Ruland [84], and Gallagher et al. [85] provides insights into environmental sustainability and Chinese energy investments, offering context for the prevailing conditions. Gallagher et al. [85] observed that none of the Southeast Asian countries receiving Chinese investments have adopted environmental policies mandating cleaner or more efficient energy facilities. Our research offers both theoretical and methodological insights into the effects of energy investments on deforestation and biodiversity in Southeast Asia. We specifically focused on the biodiversity implications of land cover changes from power plant construction projects, employing an extensive big data approach and a multifaceted analysis. This analysis considers deforestation, encompassing the forest’s morphological structure across various ecoregions, and its impact on biodiversity. Our study contrasts China’s energy investments in Southeast Asia with those of other nations, introducing a methodological framework for gauging the relative threats to biodiversity. This methodology resonates with the Sustainable Development Goals, especially when evaluating the trade-offs and complementarities among various goals such as clean energy, health, and biodiversity.

Author Contributions

Conceptualization, S.G., K.G. and L.K.; methodology, Y.M.; software, Y.M.; formal analysis, Y.M.; investigation, Y.M. and X.M.; data curation, Y.M. and X.M.; writing—original draft preparation, Y.M. and S.G.; writing—review and editing, S.G., X.M., L.K. and M.K.; visualization, Y.M.; supervision, S.G.; project administration, S.G.; funding acquisition, K.G. All authors have read and agreed to the published version of the manuscript.

Funding

This research was funded by support from the Climate and Land Use Alliance (G-1812-55950) and the David and Lucile Packard Foundation (2020-68743) for the Global Development Policy Center at Boston University. And National Science Foundation (NSF) Grant No. NSF-OCE, 2209284.

Institutional Review Board Statement

Not applicable.

Informed Consent Statement

Not applicable.

Data Availability Statement

Data available on request.

Conflicts of Interest

The authors declare no conflict of interest.

Appendix A

Figure A1. Development finance commitment from the main DFIs in Southeast Asia (2013–2019). Compiled from development finance institution project databases and China’s Overseas Development Finance Database. Global Development Policy Center, Boston University. WB: World Bank; ADB: Asian Development Bank; JICA: Japan International Cooperation Agency; CDB: China Development Bank; CHEXIM: Export-Import Bank of China.
Sustainability 15 14461 g0a1
Figure A2. Map showing deforestation between 2000 and 2018 where red indicates the highest area of deforestation.
Sustainability 15 14461 g0a2
Figure A3. WWF Global 200 Terrestrial Ecoregions in Southeast Asia.
Sustainability 15 14461 g0a3
Figure A4. Spatial distribution of ecoregions in Southeast Asia. Area (Sq Km) by country.
Sustainability 15 14461 g0a4
Figure A5. MSPA Results from 2000 to 2018 showing changes in forest morphology in the eight countries of Southeast Asia.
Sustainability 15 14461 g0a5
Figure A6. MSPA Results from 2000 to 2018 showing changes in forest morphology in the 12 ecoregions of Southeast Asia.
Sustainability 15 14461 g0a6
Figure A7. Differences in weighted range size rarity and number of species of mammals in 2 km buffer zones of power plants with and without Chinese Development Finance.
Sustainability 15 14461 g0a7
Figure A8. Forest area four years prior to investment and deforestation area during and four years after the commission year of the power plants.
Sustainability 15 14461 g0a8
Table A1. Energy investments in Southeast Asia with and without Chinese development finance.
CountriesPrimary Fuelwith Chinese DFwithout Chinese DF
CambodiaCoal02
Hydro32
IndonesiaCoal1959
Hydro141
LaosCoal01
Hydro1315
MalaysiaCoal07
Hydro09
MyanmarCoal02
Hydro217
PhilippinesCoal122
Hydro017
ThailandCoal05
Hydro010
VietnamCoal1215
Hydro0174
SumCoal32113
Hydro19285
Table A2. The total weighted rarity of species at PLTU Tanjung Kasam in Indonesia.
IUCN CategoriesSpecies CountWeight
Least Concern241
Near Threatened42
Vulnerable74
Endangered36
Critically Endangered18
Data Deficient102
Table A3. Statistical significance testing at various buffer intervals between coal and hydro power plants. * p < 0.1; ** p < 0.05; *** p < 0.01.
BufferSpeciesMANOVAWeighted RarityDeforested AreaCore area ChangeBridge area ChangeCapacity
1 kmAmphibians2.47 × 10−11 ***0.025 **0.5880.4650.9899.22 × 10−14 ***
Freshwater groups1.38 × 10−11 ***0.145
Mammals2.03 × 10−11 ***0.358
Marine Fish9.47 × 10−25 ***6.02 × 10⁻¹⁹ ***
Reptiles5.10 × 10−11 ***0.319
Sharks/Rays/Chimaeras5.56 × 10−16 ***2.61 × 10⁻¹¹ ***
2 kmAmphibians5.83 × 10−12 ***0.029 **0.3720.090 *0.618
Freshwater groups3.35 × 10−12 ***0.189
Mammals5.84 × 10−12 ***0.548
Marine Fish4.06 × 10−29 ***4.50 × 10⁻²⁴ ***
Reptiles9.43 × 10−12 ***0.248
Sharks/Rays/Chimaeras3.01 × 10−19 ***9.25 × 10⁻¹⁵ ***
10 kmAmphibians1.58 × 10−14 ***0.029 **0.225 *1.49 × 10−5 ***0.021 **
Freshwater groups1.52 × 10−14 ***0.434
Mammals4.11 × 10−14 ***0.939
Marine Fish9.47 × 10−38 ***3.02 × 10⁻³¹ ***
Reptiles9.05 × 10−15 ***0.003 ***
Sharks/Rays/Chimaeras4.41 × 10−15 ***6.78 × 10⁻¹⁹ ***

References

  1. Mittermeier, R.A.; Myers, N.; Mittermeier, C.G.; Robles Gil, P. Hotspots: Earth’s Biologically Richest and Most Endangered Terrestrial Ecoregions; CEMEX: Mexico City, Mexico, 1999. [Google Scholar]
  2. Duckworth, J.W.; Batters, G.; Belant, J.L.; Bennett, E.L.; Brunner, J.; Burton, J.; Challender, D.W.S.; Cowling, V.; Duplaix, N.; Harris, J.D.; et al. Why South-east Asia should be the world’s priority for averting imminent species extinctions, and a call to join a developing cross-institutional programme to tackle this urgent issue. Surv. Perspect. Integr. Environ. Soc. Surv. 2012. [Google Scholar]
  3. Sodhi, N.S.; Koh, L.P.; Clements, R.; Wanger, T.C.; Hill, J.K.; Hamer, K.C.; Clough, Y.; Tscharntke, T.; Posa, M.R.C.; Lee, T.M. Conserving Southeast Asian Forest Biodiversity in Human-Modified Landscapes. Biol. Conserv. 2010, 143, 2375–2384. [Google Scholar] [CrossRef]
  4. Sodhi, N.S.; Koh, L.P.; Brook, B.W.; Ng, P.K.L. Southeast Asian Biodiversity: An Impending Disaster. Trends Ecol. Evol. 2004, 19, 654–660. [Google Scholar] [CrossRef] [PubMed]
  5. Estoque, R.C.; Ooba, M.; Avitabile, V.; Hijioka, Y.; DasGupta, R.; Togawa, T.; Murayama, Y. The Future of Southeast Asia’s Forests. Nat. Commun. 2019, 10, 1829. [Google Scholar] [CrossRef] [PubMed]
  6. Schipper, J.; Chanson, J.S.; Chiozza, F.; Cox, N.A.; Hoffmann, M.; Katariya, V.; Lamoreux, J.; Rodrigues, A.S.L.; Stuart, S.N.; Temple, H.J.; et al. The Status of the World’s Land and Marine Mammals: Diversity, Threat, and Knowledge. Science 2008, 322, 225–230. [Google Scholar] [CrossRef]
  7. Drollette, D. Gold Rush in the Jungle: The Race to Discover and Defend the Rarest Animals of Vietnam’s “Lost World”, 1st ed.; Crown Publishers: New York, NY, USA, 2013; ISBN 978-0-307-40704-7. [Google Scholar]
  8. Van Uhm, D.P. The Illegal Wildlife Trade: Inside the World of Poachers, Smugglers and Traders; Studies of Organized Crime; Springer International Publishing: Cham, Switzerland, 2016; ISBN 978-3-319-42128-5. [Google Scholar]
  9. Hughes, A.C. Have Indo-Malaysian Forests Reached the End of the Road? Biol. Conserv. 2018, 223, 129–137. [Google Scholar] [CrossRef]
  10. Coffin, A.W. From Roadkill to Road Ecology: A Review of the Ecological Effects of Roads. J. Transp. Geogr. 2007, 15, 396–406. [Google Scholar] [CrossRef]
  11. Bush, E.R.; Baker, S.E.; Macdonald, D.W. Global Trade in Exotic Pets 2006–2012. Conserv. Biol. 2014, 28, 663–676. [Google Scholar] [CrossRef]
  12. AIIB Environmental and Social Framework—Framework Agreements—AIIB. Available online: https://www.aiib.org/en/policies-strategies/framework-agreements/environmental-social-framework.html (accessed on 28 December 2020).
  13. Liu, X.; Blackburn, T.M.; Song, T.; Li, X.; Huang, C.; Li, Y. Risks of Biological Invasion on the Belt and Road. Curr. Biol. 2019, 29, 499–505.e4. [Google Scholar] [CrossRef] [PubMed]
  14. Forman, R.T.T.; Alexander, L.E. Roads and Their Major Ecological Effects. Annu. Rev. Ecol. Syst. 1998, 29, 207–231. [Google Scholar] [CrossRef]
  15. Forman, R.T.T.; Sperling, D.; Bissonette, J.A.; Clevenger, A.P.; Cutshall, C.D.; Dale, V.H. Road Ecology: Science and Solutions; Island Press: Washington, DC, USA, 2002; ISBN 978-1-61091-317-1. [Google Scholar]
  16. Van der Ree, R.; Smith, D.J.; Grilo, C. Handbook of Road Ecology; John Wiley & Sons: Hoboken, NJ, USA, 2015; ISBN 978-1-118-56818-7. [Google Scholar]
  17. Borda-de-Água, L.; Barrientos, R.; Beja, P.; Pereira, H.M. Railway Ecology; Springer: Berlin/Heidelberg, Germany, 2017; ISBN 978-3-319-57496-7. [Google Scholar]
  18. Wilkie, D.; Shaw, E.; Rotberg, F.; Morelli, G.; Auzel, P. Roads, Development, and Conservation in the Congo Basin. Conserv. Biol. 2000, 14, 1614–1622. [Google Scholar] [CrossRef]
  19. Laurance, W.F.; Croes, B.M.; Guissouegou, N.; Buij, R.; Dethier, M.; Alonso, A. Impacts of Roads, Hunting, and Habitat Alteration on Nocturnal Mammals in African Rainforests. Conserv. Biol. 2008, 22, 721–732. [Google Scholar] [CrossRef] [PubMed]
  20. Laurance, W.F.; Goosem, M.; Laurance, S.G.W. Impacts of Roads and Linear Clearings on Tropical Forests. Trends Ecol. Evol. 2009, 24, 659–669. [Google Scholar] [CrossRef] [PubMed]
  21. Ali, R.; Barra, A.F.; Berg, C.; Damania, R.; Nash, J.; Russ, J. Highways to Success or Byways to Waste: Estimating the Economic Benefits of Roads in Africa; World Bank Publications; International Bank for Reconstruction and Development/The World Bank: Washington, DC, USA, 2015; ISBN 978-1-4648-0654-4. [Google Scholar]
  22. Bebbington, A.J.; Humphreys Bebbington, D.; Sauls, L.A.; Rogan, J.; Agrawal, S.; Gamboa, C.; Imhof, A.; Johnson, K.; Rosa, H.; Royo, A.; et al. Resource Extraction and Infrastructure Threaten Forest Cover and Community Rights. Proc. Natl. Acad. Sci. USA 2018, 115, 13164–13173. [Google Scholar] [CrossRef] [PubMed]
  23. Benítez-López, A.; Alkemade, R.; Verweij, P.A. The Impacts of Roads and Other Infrastructure on Mammal and Bird Populations: A Meta-Analysis. Biol. Conserv. 2010, 143, 1307–1316. [Google Scholar] [CrossRef]
  24. Barber, C.P.; Cochrane, M.A.; Souza, C.M.; Laurance, W.F. Roads, Deforestation, and the Mitigating Effect of Protected Areas in the Amazon. Biol. Conserv. 2014, 177, 203–209. [Google Scholar] [CrossRef]
  25. Zadek, S. Financing a Just Transition. Organ. Environ. 2019, 32, 18–25. [Google Scholar] [CrossRef]
  26. Turner, I.M. Species Loss in Fragments of Tropical Rain Forest: A Review of the Evidence. J. Appl. Ecol. 1996, 33, 200–209. [Google Scholar] [CrossRef]
  27. Adams, W.M.; Aveling, R.; Brockington, D.; Dickson, B.; Elliott, J.; Hutton, J.; Roe, D.; Vira, B.; Wolmer, W. Biodiversity Conservation and the Eradication of Poverty. Science 2004, 306, 1146–1149. [Google Scholar] [CrossRef]
  28. Redford, K.; Fearn, E. Protected Areas and Human Livelihoods; Wildlife Conservation Society: New York, NY, USA, 2007. [Google Scholar]
  29. Reed, J.; Vianen, J.V.; Deakin, E.L.; Barlow, J.; Sunderland, T. Integrated Landscape Approaches to Managing Social and Environmental Issues in the Tropics: Learning from the Past to Guide the Future. Glob. Chang. Biol. 2016, 22, 2540–2554. [Google Scholar] [CrossRef] [PubMed]
  30. Morris, R.J. Anthropogenic Impacts on Tropical Forest Biodiversity: A Network Structure and Ecosystem Functioning Perspective. Philos. Trans. R. Soc. B Biol. Sci. 2010, 365, 3709–3718. [Google Scholar] [CrossRef] [PubMed]
  31. Alroy, J. Effects of Habitat Disturbance on Tropical Forest Biodiversity. Proc. Natl. Acad. Sci. USA 2017, 114, 6056–6061. [Google Scholar] [CrossRef] [PubMed]
  32. Gillespie, T.W.; Lipkin, B.; Sullivan, L.; Benowitz, D.R.; Pau, S.; Keppel, G. The Rarest and Least Protected Forests in Biodiversity Hotspots. Biodivers. Conserv. 2012, 21, 3597–3611. [Google Scholar] [CrossRef]
  33. Vetter, D.; Hansbauer, M.M.; Végvári, Z.; Storch, I. Predictors of Forest Fragmentation Sensitivity in Neotropical Vertebrates: A Quantitative Review. Ecography 2011, 34, 1–8. [Google Scholar] [CrossRef]
  34. Quintero, J.P. Mainstreaming Conservation in Infrastructure Projects: Case Studies from Latin America; International Bank for Reconstruction and Development/World Bank: Washington, DC, USA, 2007. [Google Scholar]
  35. Buntaine, M.T. Does the Asian Development Bank Respond to Past Environmental Performance When Allocating Environmentally Risky Financing? World Dev. 2011, 39, 336–350. [Google Scholar] [CrossRef]
  36. Buchanan, G.M.; Parks, B.C.; Donald, P.F.; O’Donnell, B.F.; Runfola, D.; Swaddle, J.P.; Tracewski, Ł.; Butchart, S.H.M. The Impacts of World Bank Development Projects on Sites of High Biodiversity Importance; AidData: Williamsburg, VA, USA, 2016. [Google Scholar]
  37. Morgado, N.C.; Taşkın, Ö. Managing Environmental Risks in Development Banks and Development Finance Institutions–What Role for Donor Shareholders? OECD Development Co-operation: Paris, France, 2019. [Google Scholar]
  38. Vardon, M.; Burnett, P.; Dovers, S. The Accounting Push and the Policy Pull: Balancing Environment and Economic Decisions. Ecol. Econ. 2016, 124, 145–152. [Google Scholar] [CrossRef]
  39. Gallagher, K.P. China’s Global Energy Finance. Available online: http://www.bu.edu/gdp/ (accessed on 15 February 2021).
  40. ADB Projects and Tenders. Available online: https://www.adb.org/projects (accessed on 15 February 2021).
  41. Japan International Cooperation Agency ODA Loan Project DATA|Our Work|JICA|Japan International Cooperation Agency. Available online: https://www2.jica.go.jp/en/yen_loan/index.php (accessed on 15 February 2021).
  42. KfW Promotes Development Programmes in Africa, Asia, Latin America and South East Europe on Behalf of the Federal Government. Available online: https://www.kfw-entwicklungsbank.de/International-financing/KfW-Development-Bank/Projekte/ (accessed on 15 February 2021).
  43. World Bank Projects. Available online: https://projects.worldbank.org/en/projects-operations/projects-list (accessed on 15 February 2021).
  44. Lechner, A.M.; Chan, F.K.S.; Campos-Arceiz, A. Biodiversity Conservation Should Be a Core Value of China’s Belt and Road Initiative. Nat. Ecol. Evol. 2018, 2, 408–409. [Google Scholar] [CrossRef]
  45. Hughes, A.C. Understanding and Minimizing Environmental Impacts of the Belt and Road Initiative. Conserv. Biol. 2019, 33, 883–894. [Google Scholar] [CrossRef]
  46. Schleuning, M.; Farwig, N.; Peters, M.K.; Bergsdorf, T.; Bleher, B.; Brandl, R.; Dalitz, H.; Fischer, G.; Freund, W.; Gikungu, M.W.; et al. Forest Fragmentation and Selective Logging Have Inconsistent Effects on Multiple Animal-Mediated Ecosystem Processes in a Tropical Forest. PLoS ONE 2011, 6, e27785. [Google Scholar] [CrossRef] [PubMed]
  47. Stevens, L.; Anderson, B.; Cowan, C.; Colton, K.; Johnson, D. The Footprint of Energy: Land Use of US Electricity Production; STRATA: Logan, UT, USA, 2017. [Google Scholar]
  48. Ascensão, F.; Fahrig, L.; Clevenger, A.P.; Corlett, R.T.; Jaeger, J.A.G.; Laurance, W.F.; Pereira, H.M. Environmental Challenges for the Belt and Road Initiative. Nat. Sustain. 2018, 1, 206–209. [Google Scholar] [CrossRef]
  49. Shi, X.; Yao, L. Prospect of China’s Energy Investment in Southeast Asia under the Belt and Road Initiative: A Sense of Ownership Perspective. Energy Strategy Rev. 2019, 25, 56–64. [Google Scholar] [CrossRef]
  50. Hecht, J.S. Making Multi-Stakeholder Water Resources Decisions with Limited Streamflow Information. Ph.D. Thesis, Tufts University, Medford, MA, USA, 2017. [Google Scholar]
  51. Sabo, J.L.; Ruhi, A.; Holtgrieve, G.W.; Elliott, V.; Arias, M.E.; Ngor, P.B.; Räsänen, T.A.; Nam, S. Designing River Flows to Improve Food Security Futures in the Lower Mekong Basin. Science 2017, 358, eaao1053. [Google Scholar] [CrossRef]
  52. Wild, T.B.; Loucks, D.P.; Annandale, G.W.; Kaini, P. Maintaining Sediment Flows through Hydropower Dams in the Mekong River Basin. J. Water Resour. Plan. Manag. 2016, 142, 05015004. [Google Scholar] [CrossRef]
  53. Baird, I.G. Non-Government Organizations, Villagers, Political Culture and the Lower Sesan 2 Dam in Northeastern Cambodia. Crit. Asian Stud. 2016, 48, 257–277. [Google Scholar] [CrossRef]
  54. Middleton, C.; Elmhirst, R.; Chantavanich, S. Living with Floods in a Mobile Southeast Asia a Political Ecology of Vulnerability, Migration and Environmental Change; Routledge: Abingdon, UK, 2019; ISBN 978-0-367-37695-6. [Google Scholar]
  55. Pratiwi, S.; Juerges, N. Review of the Impact of Renewable Energy Development on the Environment and Nature Conservation in Southeast Asia. Energy Ecol. Environ. 2020, 5, 221–239. [Google Scholar] [CrossRef]
  56. Bartan, A.; Kucukali, S.; Ar, I. Environmental Impact Assessment of Coal Power Plants in Operation. E3S Web Conf. 2017, 22, 00011. [Google Scholar] [CrossRef]
  57. Oyewo, T.; Magret Olarewaju, O.; Bernice Cloete, M.; Tijani Adenuga, O. Environmental Costs Estimation and Mathematical Model of Marginal Social Cost: A Case Study of Coal Power Plants. Environ. Econ. 2021, 12, 90–102. [Google Scholar] [CrossRef]
  58. Ray, R.; Pitts, J.; Simmons, B.A. Geolocated Dataset of Chinese Overseas Development Finance. Nat. Sci. Data 2021. [Google Scholar] [CrossRef] [PubMed]
  59. Hansen, M.C.; Potapov, P.V.; Moore, R.; Hancher, M.; Turubanova, S.A.; Tyukavina, A.; Thau, D.; Stehman, S.V.; Goetz, S.J.; Loveland, T.R.; et al. High-Resolution Global Maps of 21st-Century Forest Cover Change. Science 2013, 342, 850–853. [Google Scholar] [CrossRef]
  60. Olson, D.M.; Dinerstein, E. The Global 200: Priority Ecoregions for Global Conservation. Ann. Mo. Bot. Gard. 2002, 89, 199. [Google Scholar] [CrossRef]
  61. Dohong, A.; Aziz, A.A.; Dargusch, P. A Review of the Drivers of Tropical Peatland Degradation in South-East Asia. Land Use Policy 2017, 69, 349–360. [Google Scholar] [CrossRef]
  62. Lamoreux, J.; Resit Akçakaya, H.; Bennun, L.; Collar, N.J.; Boitani, L.; Brackett, D.; Bräutigam, A.; Brooks, T.M.; da Fonseca, G.A.B.; Mittermeier, R.A.; et al. Value of the IUCN Red List. Trends Ecol. Evol. 2003, 18, 214–215. [Google Scholar] [CrossRef]
  63. Rodrigues, A.S.L.; Pilgrim, J.D.; Lamoreux, J.F.; Hoffmann, M.; Brooks, T.M. The Value of the IUCN Red List for Conservation. Trends Ecol. Evol. 2006, 21, 71–76. [Google Scholar] [CrossRef] [PubMed]
  64. Mace, G.M.; Collar, N.J.; Gaston, K.J.; Hilton-Taylor, C.; Akçakaya, H.R.; Leader-Williams, N.; Milner-Gulland, E.J.; Stuart, S.N. Quantification of Extinction Risk: IUCN’s System for Classifying Threatened Species. Conserv. Biol. 2008, 22, 1424–1442. [Google Scholar] [CrossRef] [PubMed]
  65. Hoffmann, M.; Hilton-Taylor, C.; Angulo, A.; Böhm, M.; Brooks, T.M.; Butchart, S.H.M.; Carpenter, K.E.; Chanson, J.; Collen, B.; Cox, N.A.; et al. The Impact of Conservation on the Status of the World’s Vertebrates. Science 2010, 330, 1503–1509. [Google Scholar] [CrossRef] [PubMed]
  66. Byers, L.; Friedrich, J.; Hennig, R.; Kressig, A.; Li, X.; McCormick, C.; Valeri, L.M. A Global Database of Power Plants; World Resources Institute: Washington, DC, USA, 2019. [Google Scholar]
  67. Platts, S.G. World Electric Power Plants Database, 2018; McGraw-Hill: New York, NY, USA, 2018. [Google Scholar]
  68. Hurlbert, A.H.; Jetz, W. Species Richness, Hotspots, and the Scale Dependence of Range Maps in Ecology and Conservation. Proc. Natl. Acad. Sci. USA 2007, 104, 13384–13389. [Google Scholar] [CrossRef]
  69. Moilanen, A.; Arponen, A.; Leppänen, J.; Meller, L.; Kujala, H. Zonation: Spatial Conservation Planning Framework and Software Version 3.0 User Manual. Available online: http://www.helsinki.fi/bioscience/consplan/software/Zonation/ZONATION_v3_Manual_111124_v2.pdf (accessed on 15 February 2021).
  70. Montesino Pouzols, F.; Toivonen, T.; Di Minin, E.; Kukkala, A.S.; Kullberg, P.; Kuusterä, J.; Lehtomäki, J.; Tenkanen, H.; Verburg, P.H.; Moilanen, A. Global Protected Area Expansion Is Compromised by Projected Land-Use and Parochialism. Nature 2014, 516, 383–386. [Google Scholar] [CrossRef]
  71. McLellan, B.N.; Shackleton, D.M. Grizzly Bears and Resource-Extraction Industries: Habitat Displacement in Response to Seismic Exploration, Timber Harvesting and Road Maintenance. J. Appl. Ecol. 1989, 26, 371–380. [Google Scholar] [CrossRef]
  72. Cameron, R.D.; Reed, D.J.; Dau, J.R.; Smith, W.T. Redistribution of Calving Caribou in Response to Oil Field Development on the Arctic Slope of Alaska. Arctic 1992, 45, 338–342. [Google Scholar] [CrossRef]
  73. Ortega, Y.K.; Capen, D.E. Effects of Forest Roads on Habitat Quality for Ovenbirds in a Forested Landscape. Auk 1999, 116, 937–946. [Google Scholar] [CrossRef]
  74. Nellemann, C.; Vistnes, I.; Jordhøy, P.; Strand, O.; Newton, A. Progressive Impact of Piecemeal Infrastructure Development on Wild Reindeer. Biol. Conserv. 2003, 113, 307–317. [Google Scholar] [CrossRef]
  75. Vogt, P.; Riitters, K. GuidosToolbox: Universal Digital Image Object Analysis. Eur. J. Remote Sens. 2017, 50, 352–361. [Google Scholar] [CrossRef]
  76. Alamgir, M.; Campbell, M.J.; Sloan, S.; Suhardiman, A.; Supriatna, J.; Laurance, W.F. High-Risk Infrastructure Projects Pose Imminent Threats to Forests in Indonesian Borneo. Sci. Rep. 2019, 9, 140. [Google Scholar] [CrossRef] [PubMed]
  77. Grantham, H.S.; Duncan, A.; Evans, T.D.; Jones, K.R.; Beyer, H.L.; Schuster, R.; Walston, J.; Ray, J.C.; Robinson, J.G.; Callow, M.; et al. Anthropogenic Modification of Forests Means Only 40% of Remaining Forests Have High Ecosystem Integrity. Nat. Commun. 2020, 11, 5978. [Google Scholar] [CrossRef]
  78. Birot, H.; Campera, M.; Imron, M.A.; Nekaris, K.A.I. Artificial Canopy Bridges Improve Connectivity in Fragmented Landscapes: The Case of Javan Slow Lorises in an Agroforest Environment. Am. J. Primatol. 2020, 82, e23076. [Google Scholar] [CrossRef] [PubMed]
  79. Cushman, S.A.; Macdonald, E.A.; Landguth, E.L.; Malhi, Y.; Macdonald, D.W. Multiple-Scale Prediction of Forest Loss Risk across Borneo. Landsc. Ecol. 2017, 32, 1581–1598. [Google Scholar] [CrossRef]
  80. Cheyne, S.M.; Sastramidjaja, W.J.; Muhalir; Rayadin, Y.; Macdonald, D.W. Mammalian Communities as Indicators of Disturbance across Indonesian Borneo. Glob. Ecol. Conserv. 2016, 7, 157–173. [Google Scholar] [CrossRef]
  81. Holt, T.V.; Binford, M.W.; Portier, K.M.; Vergara, R. A Stand of Trees Does Not a Forest Make: Tree Plantations and Forest Transitions. Land Use Policy 2016, 56, 147–157. [Google Scholar] [CrossRef]
  82. Ingalls, M.; Diepart, J.-C.; Truong, N.; Hayward, D.; Neil, T.; Phomphakdy, C.; Bernhard, R.; Fogarizzu, S.; Epprecht, M.; Nanhthavong, V.; et al. State of Land in the Mekong Region; Bern Open Publishing: Bern, Switzerland, 2018; ISBN 978-3-906813-79-0. [Google Scholar]
  83. Lechner, A.M.; Tan, T.; Tritto, A.; Horstmann, A.; Teo, H.C.; Owen, O.; Campos-Arceiz, A. The Belt and Road Initiative: Environmental Impacts in Southeast Asia; ISEAS Publishing: Singapore, 2019; ISBN 978-981-4881-43-2. [Google Scholar]
  84. Rüland, J. The Long Shadow of the Developmental State: Energy Infrastructure and Environmental Sustainability in Southeast Asia. Third World Q. 2023, 44, 1269–1287. [Google Scholar] [CrossRef]
  85. Gallagher, K.P.; Kamal, R.; Jin, J.; Chen, Y.; Ma, X. Energizing Development Finance? The Benefits and Risks of China’s Development Finance in the Global Energy Sector. Energy Policy 2018, 122, 313–321. [Google Scholar] [CrossRef]
Figure 1. Research data and framework. Abbreviations used in this figure: GFC, Global Forest Change; IUCN, The International Union for Conservation of Nature; GEE, Google Earth Engine; R, a free software environment for statistical computing and graphics. WWF, World Wildlife Fund; MSPA, morphological spatial pattern analysis; MANOVA/ANOVA, (multivariate) analysis of variance.
Sustainability 15 14461 g001
Figure 2. (a) Energy mix and Chinese development finance involvement of the electricity sector in Southeast Asia, compiled from the Global Power Plant Database, World Resources Institute, the Platts World Electric Power Plant Database, and China’s Overseas Development Finance database. Note: (b) does not include projects whose commission year is not available. The power generation capacity with Chinese development finance does not include project expansion of older projects commissioned before 2000.
Sustainability 15 14461 g002
Figure 3. Species richness of (a) amphibians; (b) reptiles; (c) mammals; (d) freshwater groups; (e) marine fish; and (f) sharks, rays, and chimaeras.
Sustainability 15 14461 g003
Figure 4. MSPA for 2000, 2006, 2012, and 2018 with edge distance of 900 m; green represents core forest area (interior intact forest) while red represents the bridges connecting different core areas, often fragmented or deforested areas.
Sustainability 15 14461 g004
Figure 5. Bridge area and core area summaries in 10 km buffer shown four years before commission years, at commission years, and differences during the construction of coal and hydro power plants.
Sustainability 15 14461 g005
Figure 6. Biodiversity statistics of marine fish and sharks/rays/chimaeras for coal and hydro power plants.
Sustainability 15 14461 g006
Figure 7. Power plant capacities of energy investments with and without Chinese development finance.
Sustainability 15 14461 g007
Table 1. Statistical significance testing at various buffer intervals between power plants with and without Chinese development finance. * p < 0.1; ** p < 0.05; *** p < 0.01.
BufferSpeciesMANOVAWeighted RarityDeforested AreaCore Area ChangeBridge Area ChangeCapacity
1 kmAmphibians0.010 *0.1960.4450.6920.7854.94 × 10−4 ***
Freshwater groups0.013 *0.540
Mammals0.002 **0.027 *
Marine Fish0.004 **0.028 *
Reptiles0.013 *0.556
Sharks/Rays/Chimaeras3.85 × 10−5 ***6.79 × 10⁻⁶ ***
2 kmAmphibians0.016 *0.2310.9740.4540.744
Freshwater groups0.018 *0.514
Mammals0.002 **0.035 *
Marine Fish0.005 **0.015 *
Reptiles0.017 *0.485
Sharks/Rays/Chimaeras3.36 × 10−6 ***1.59 × 10⁻⁷ ***
10 kmAmphibians0.003 **0.2330.044 *0.8000.093
Freshwater groups0.004 **0.373
Mammals0.003 **0.214
Marine Fish0.001 ***0.003 **
Reptiles0.001 **0.066
Sharks/Rays/Chimaeras5.09 × 10−10 ***7.22 × 10⁻¹² ***
Disclaimer/Publisher’s Note: The statements, opinions and data contained in all publications are solely those of the individual author(s) and contributor(s) and not of MDPI and/or the editor(s). MDPI and/or the editor(s) disclaim responsibility for any injury to people or property resulting from any ideas, methods, instructions or products referred to in the content.

