Article

Variation in the Ecological Carrying Capacity and Its Driving Factors of the Five Lake Basins in Central Yunnan Plateau, China

1
Faculty of Geography, Yunnan Normal University, Kunming 650500, China
2
Key Laboratory of Resources and Environmental Remote Sensing for Universities in Yunnan, Kunming 650500, China
3
Center for Geospatial Information Engineering and Technology of Yunnan Province, Kunming 650500, China
4
College of Geographic Sciences, Fujian Normal University, Fuzhou 350117, China
*
Author to whom correspondence should be addressed.
Sustainability 2023, 15(19), 14442; https://doi.org/10.3390/su151914442
Submission received: 19 July 2023 / Revised: 12 September 2023 / Accepted: 28 September 2023 / Published: 3 October 2023

Abstract

:
The Five Lakes Basin of Central Yunnan Plateau (FLBOCYP) is located in the core area of Yunnan Province and has a developed economy, but the ecological and environmental problems in the basin are serious and the sustainable economic development is threatened. The analysis of ecological carrying capacity change and the study of influencing factors in the basin is conducive to protecting the ecology of the basin and maintaining the sustainable development of the social economy. Ecological carrying capacity is an important indicator for the quantitative assessment of regional sustainable development, and the assessment of regional ecological carrying capacity based on grid scale can more accurately and vividly reflect the regional sustainable status and provide reference for regional coordinated development. With the support of GIS technology, based on the unique ecosystem characteristics of the river basin itself, the research method of quantifying the ecological carrying capacity from the three perspectives of ecological function elasticity, resource and environmental capacity and socio-economic coordination was carried out, and a relatively complete comprehensive evaluation index system of ecological carrying capacity was constructed. The ecological carrying capacity of the five major lake basins of Qilu Lake and Yangzonghai from 2000 to 2018 was evaluated, and the temporal and spatial changes and driving mechanisms of ecological carrying capacity were analyzed. The results show that: (1) The FLBOCYP has an overall moderate ecological carrying capacity (average of ~0.5). The temporal trend in ecological carrying capacity was an initial rise followed by a fall, but there was an overall increasing trend at a rate of 0.019. (2) Areas with a strong ecological carrying capacity were mainly distributed in the mountainous and semi-mountainous regions outside of the lake area, whereas areas of weaker ecological carrying capacity were mainly distributed in the plain area around the lake. The ecological carrying capacity gradually increased from the area around the lake to the periphery. (3) At a basin scale, the ecological carrying capacities of the Dian, Fuxian, and Yangzong lake basins were relatively high, whereas those of the Xingyun and Qilu lake basins were relatively low. The greatest increase in ecological carrying capacity of Fuxian Lake has occurred since 2000. (4) The spatial pattern of ecological carrying capacity showed clear agglomeration. This agglomeration has been continuously enhanced but remained relatively stable over the past 19 years. The main agglomeration modes were identified as “high-high” (HH), “low-low” (LL), and “not obvious agglomeration”. (5) Among the many driving factors, ecological elasticity, biological abundance index, proportion of forest land, and degree of human disturbance showed the greatest explanatory power for spatial differentiation of ecological carrying capacity, and the interaction of any two factors affected the spatial analysis of ecological carrying capacity even more. In summary, the overall ecological environment of the FLBOCYP has experienced significant improvement since 2000, whereas that of the plain area has deteriorated more seriously in recent years.

1. Introduction

Although the 21st century has seen massive social and economic progress, this has come at the cost of various environmental crises. These crises include a short supply of land resources and reduced biodiversity. The greater emphasis on regional sustainable development in China has resulted in a government focus on the construction of ecological civilization land, and space planning is an important measure. “Double evaluation” refers to the evaluation of resources and environmental carrying capacity and land and space adaptability. It is a key work in land and space planning. The accuracy of data generated by “double evaluation” can provide scientific and effective guidance for land planning. Ecological carrying capacity is the carrying capacity of the ecological environment, which is an objective reflection of the regulatory capacity of the natural system, and different levels of natural systems on the Earth have the function of self-maintaining ecological balance. Ecological carrying capacity is an effective measure of the status of regional sustainable development and can act as a reference for the restoration and improvement of regional ecological environmental quality and regional land planning. Ecological carrying capacity can also be used to identify basin functionality, to optimize the land development scheme [1,2], and to realize the sustainable development of the region. Therefore, the evaluation of regional ecological carrying capacity is of great practical significance for government planning policies and regional ecological protection.
Studies into ecological carrying capacity have expanded in scope from population ecology [3,4,5,6] to the land [7,8], resources [9,10], environment [11,12,13], and other single elements, to the ecosystem as a whole [14,15]. Studies on regional ecological carrying capacity have diversified after the United Nations proposed the concept of sustainable development in the 1980s. This is because ecological carrying capacity is an important indicator of sustainable development. Methods used in research into regional ecological carrying capacity have included net primary productivity (NPP) [16,17,18], the ecological footprint method [19,20,21,22], the state space method [23,24,25], and the comprehensive index method [26,27,28,29,30]. Among these methods, the comprehensive index method is the most comprehensive, is of certain relevance for the selection of factors, and is suitable for areas with more complex ecological and environmental conditions. However, past studies using this method tended to be static evaluations, with relatively few studies conducting long-term dynamic monitoring. In addition, most of these studies were mainly based on mathematical statistics and were conducted at a low spatial resolution, and relatively few studies have been conducted at the pixel scale. Therefore, data for the detailed expression of spatial differences within a region are lacking. The development of geographic information system (GIS) and remote-sensing (RS) technology provides more diversified and mature quantitative evaluation methods for the study of ecological carrying capacity. Using these technologies, studies can evaluate ecological carrying capacity at a fine grid scale, thereby increasing the theoretical knowledge of ecological carrying capacity and providing a reference for further fine-scale related research.
The ecological carrying capacity of the five lake basins of the Dian, Fuxian, Xingyun, Qilu, and Yangzong lakes in Central Yunnan Plateau (hereinafter referred to as the Five Lakes Basin of Central Yunnan Plateau (FLBOCYP)) has a profound impact on the ecological environment and social and economic development in the region. However, in recent years, due to frequent drought disasters caused by natural and man-made factors, soil erosion, water pollution, biodiversity reduction and other ecological and environmental problems are serious. It is of great significance to quantitatively assess the sustainable development of the FLBOCYP by using ecological carrying capacity and to understand the regional ecological problems and their spatiotemporal dynamics for balancing the economic and social development and ecological protection of the region.
Many scholars have carried out studies on ecological carrying capacity in central Yunnan [31,32,33,34,35]. From the perspective of research methods and modes of expression, the ecological footprint model was used to evaluate and dynamically monitor the ecological carrying capacity of the Kunming, Yuxi, and Dianchi river basins in central Yunnan, respectively. However, the above studies all took the city, county-level administrative region, or the whole river basin as the evaluation unit, and the ecological carrying capacity data of the whole evaluation unit in each phase included only one value. Therefore, only the overall ecological carrying capacity of the region can be understood, but the distribution of ecological carrying capacity within the specific region cannot be known. Therefore, it is very meaningful to study the ecological carrying capacity of fine units with visual spatial distribution and change characteristics. From the perspective of time series length and timeliness, the relevant research needs to be further increased and improved in order to better support the current territorial spatial planning work.
In summary, this paper proposes to use a comprehensive evaluation method, combined with RS and GIS technology, to evaluate and dynamically monitor the ecological carrying capacity of the FLBOCYP from 2000 to 2018 based on a 100 m × 100 m grid scale, analyze the continuous changes of ecological carrying capacity on a spatial–temporal scale, conduct spatial pattern differentiation and driving factors analysis, and put forward relevant improvement suggestions. It provides the basis for regional ecological civilization construction and sustainable development.

2. Study Area and Data Sources

2.1. Study Area

Yunnan Province, China, contains many plateau lakes, including the nine representative plateau lakes, the Dian, Fuxian, Xingyun, Qilu, Yangzong, Erhai, Lugu, Yilong, and Chenghai lakes. Lakes provide certain important ecological and human services, including the provision of water sources, regulation of regional climate, maintaining regional ecological health, and providing good background conditions for the economic development of the basin. Among the nine lakes, five lakes, the Dian, Fuxian, Xingyun, Qilu, and Yangzong lakes, are concentrated in Kunming and Yuxi City in Central Yunnan Plateau, which is the core area of economic development of Yunnan Province and a region with a strong economic influence in Southeast Asia and South Asia. The ecological carrying capacity and ecosystem service functions of this region have played an irreplaceable supporting role in the socio-economic development of central Yunnan Province. However, frequent drought disasters driven by natural and anthropogenic factors have resulted in multiple ecological environment problems, including soil erosion, water pollution, and biodiversity reduction. Therefore, the evaluation of ecological carrying capacity is of great significance for quantitatively assessing the sustainable development of the FLBOCYP, for recognizing regional ecological challenges, and for understanding their temporal and spatial changes. Thus, understanding ecological carrying capacity is of great significance for balancing economic and social development and the ecological protection of the region.
The study area is in central Yunnan Province (Figure 1) and encompasses the Dian, Fuxian, Xingyun, Qilu, and Yangzong Lake basins, with a cumulative lake surface area of ~628.54 km2. Table 1 provides a summary of each lake and its basin.

2.2. Data Sources and Data Preprocessing

2.2.1. Data Sources

The data used in the present study included RS data, land-use data, meteorological data, socio-economic data, and some other datasets. As summarized in Table 2, the datasets were mainly obtained from the Geospatial Data Cloud, the Resource and Environment Science and Data Center, and the meteorology and statistics departments in central Yunnan, etc. The years include 2000, 2005, 2010, 2015, and 2018. In order to ensure the comparability of data, the remote-sensing data are all data in February.

2.2.2. Data Preprocessing

RS images were preprocessed to reduce the error of the sensor itself and the influence of atmospheric light, large area water bodies, and other factors. Image preprocessing included labeling the image by radiation, atmospheric correction, stitching and cutting, rejection of water bodies, and extraction of the lake basin boundary using a digital elevation model (DEM). Land-use data were reclassified according to a first-level classification system according to the needs of the present study. All data were unified under the WGS_1984_UTM_Zone_48N coordinate system. The data were analyzed at a spatial grid scale of 100 m and all meteorological and statistical data were rasterized using spatial interpolation methods.

3. Methods

3.1. Selection of Evaluation Indicators

3.1.1. Principles for Selection of Indicators

Constructing an index system is a key step in the evaluation of regional ecological carrying capacity and the index system will affect the validity and accuracy of the evaluation results [40]. Therefore, the following principles should be followed in the selection of indicators: (1) Indicators should be scientific, practical, objective, effective, and based on reliable data sources. (2) Indicators should comprehensively consider multiple elements of the ecosystem. (3) Indicators should be accessible and operable and based on accessible data that can be quantified and visualized. (4) Indicators should facilitate sustainable development research by highlighting the statuses of the ecology, resources, and environment.

3.1.2. Construction of the Indicator System

Ecological carrying capacity is multi-dimensional and considers ecological conditions, production and life, and social and economic development. The present study referred to the quantitative evaluation framework model of ecological carrying capacity proposed by Ji X P [25] to effectively evaluate the ecological carrying capacity of the FLBOCYP. This framework considers ecological function elasticity, resource and environmental supply capacity, and socio-economic coordination capacity. During construction of the indicator system, the present study followed the principle of indicator selection, considered the availability of data for the study area, and referred to the Technical Criterion for Ecosystem Status Evaluation (for trial implementation) of the Ministry of Ecology and Environment of the People’s Republic of China (2015) (hereafter referred to as “the criterion”), and the land and space planning. The evaluation indicators were then adjusted by referring to related studies. As shown in Table 3, the comprehensive evaluation indicator system for ecological carrying capacity constructed in the present study was composed of 1 target layer, 3 criterion layers, and 22 indicator layers.

3.2. Construction of the Evaluation Model

3.2.1. Ecological Carrying Capacity Evaluation Model

The present study used a comprehensive index evaluation model to evaluate ecological carrying capacity:
E = i = 1 n A i × W i
In Equation (1), E is the ecological carrying capacity and Ai and Wi represent the indicator value and weight value of the i-th item in the evaluation unit, respectively.

3.2.2. Index Space Rasterization

The various indicators were calculated and spatially expressed using ENVI and GIS software to produce final indicators in a raster data format with a spatial resolution of 100 m. Table 4 summarizes the calculation and implementation methods used.

3.2.3. Indicator Weighting

The present study adopted the combined weighting method to balance the difference between subjective and objective weighting methods. This approach combined the mean square deviation decision method and analytic hierarchy process (AHP) to assign a weight to each indicator. The combined weight was calculated using the linear weighting method. The specific formula used was:
w = k = 1 q a k w k
In Equation (2), ak is the weighting parameter of the k-th weighting method (0.5) and wk is the combined weight vector.
(1)
The Mean Square Deviation Decision Method
The realization of the mean square error decision method [48] involves treating each indicator as a random variable, treating the non-quantitative outline values in each indicator as random variable values, and calculating the mean value and mean square deviation of the random variable. Finally, the resulting mean variance is normalized and the weight coefficient of each rating indicator is obtained. The specific steps followed are outlined below:
The first step is to standardize the raw data. For positive indicators:
X X m i n / X m a x X m i n
For negative indicators:
X m a x X / X m a x X m i n
The second step is to calculate the average value of the indicator:
E ( F j ) = 1 m i = 1 m Y i j
The third step is to calculate the mean square error of each indicator:
σ ( F j ) = i = 1 m Y i j E ( F j ) 2 n
The fourth step is to calculate the weight coefficient of each indicator:
W ( F j ) = σ ( F j ) i = 1 n σ ( F j )
In the above formula, Xmax and Xmin represent the maximum and minimum values of the index value, respectively; Yij represents the standardized value of the jth index; E(Fj) represents the average value of the jth index; m represents the number of indicators; σ(Fj) represents the mean square deviation of the jth index; and W(Fj) represents the weight coefficient of the jth index.
(2)
Analytic Hierarchy Process (AHP)
Under AHP [49,50], the relevant indicators of evaluation decision-making are broken down from top to bottom into three layers: (1) target layer; (2) standard layer; (3) indicator layer. These layers are qualitatively and quantitatively analyzed. Finally, the weights of the evaluation indicators are obtained. The main steps include analyzing and constructing a hierarchical structure, constructing an assessment matrix, confirming consistency, calculating weights, and sorting.
The combined weighting method was used to obtain the final weight coefficient (Table 3). The above comprehensive index evaluation model was then used to evaluate the ecological carrying capacity of the study area. The grid results of each index and weight were superimposed to obtain the comprehensively evaluated ecological carrying capacity.

4. Results

4.1. Temporal and Spatial Changes in Ecological Carrying Capacity

4.1.1. Characteristics of Temporal Change in Ecological Carrying Capacity

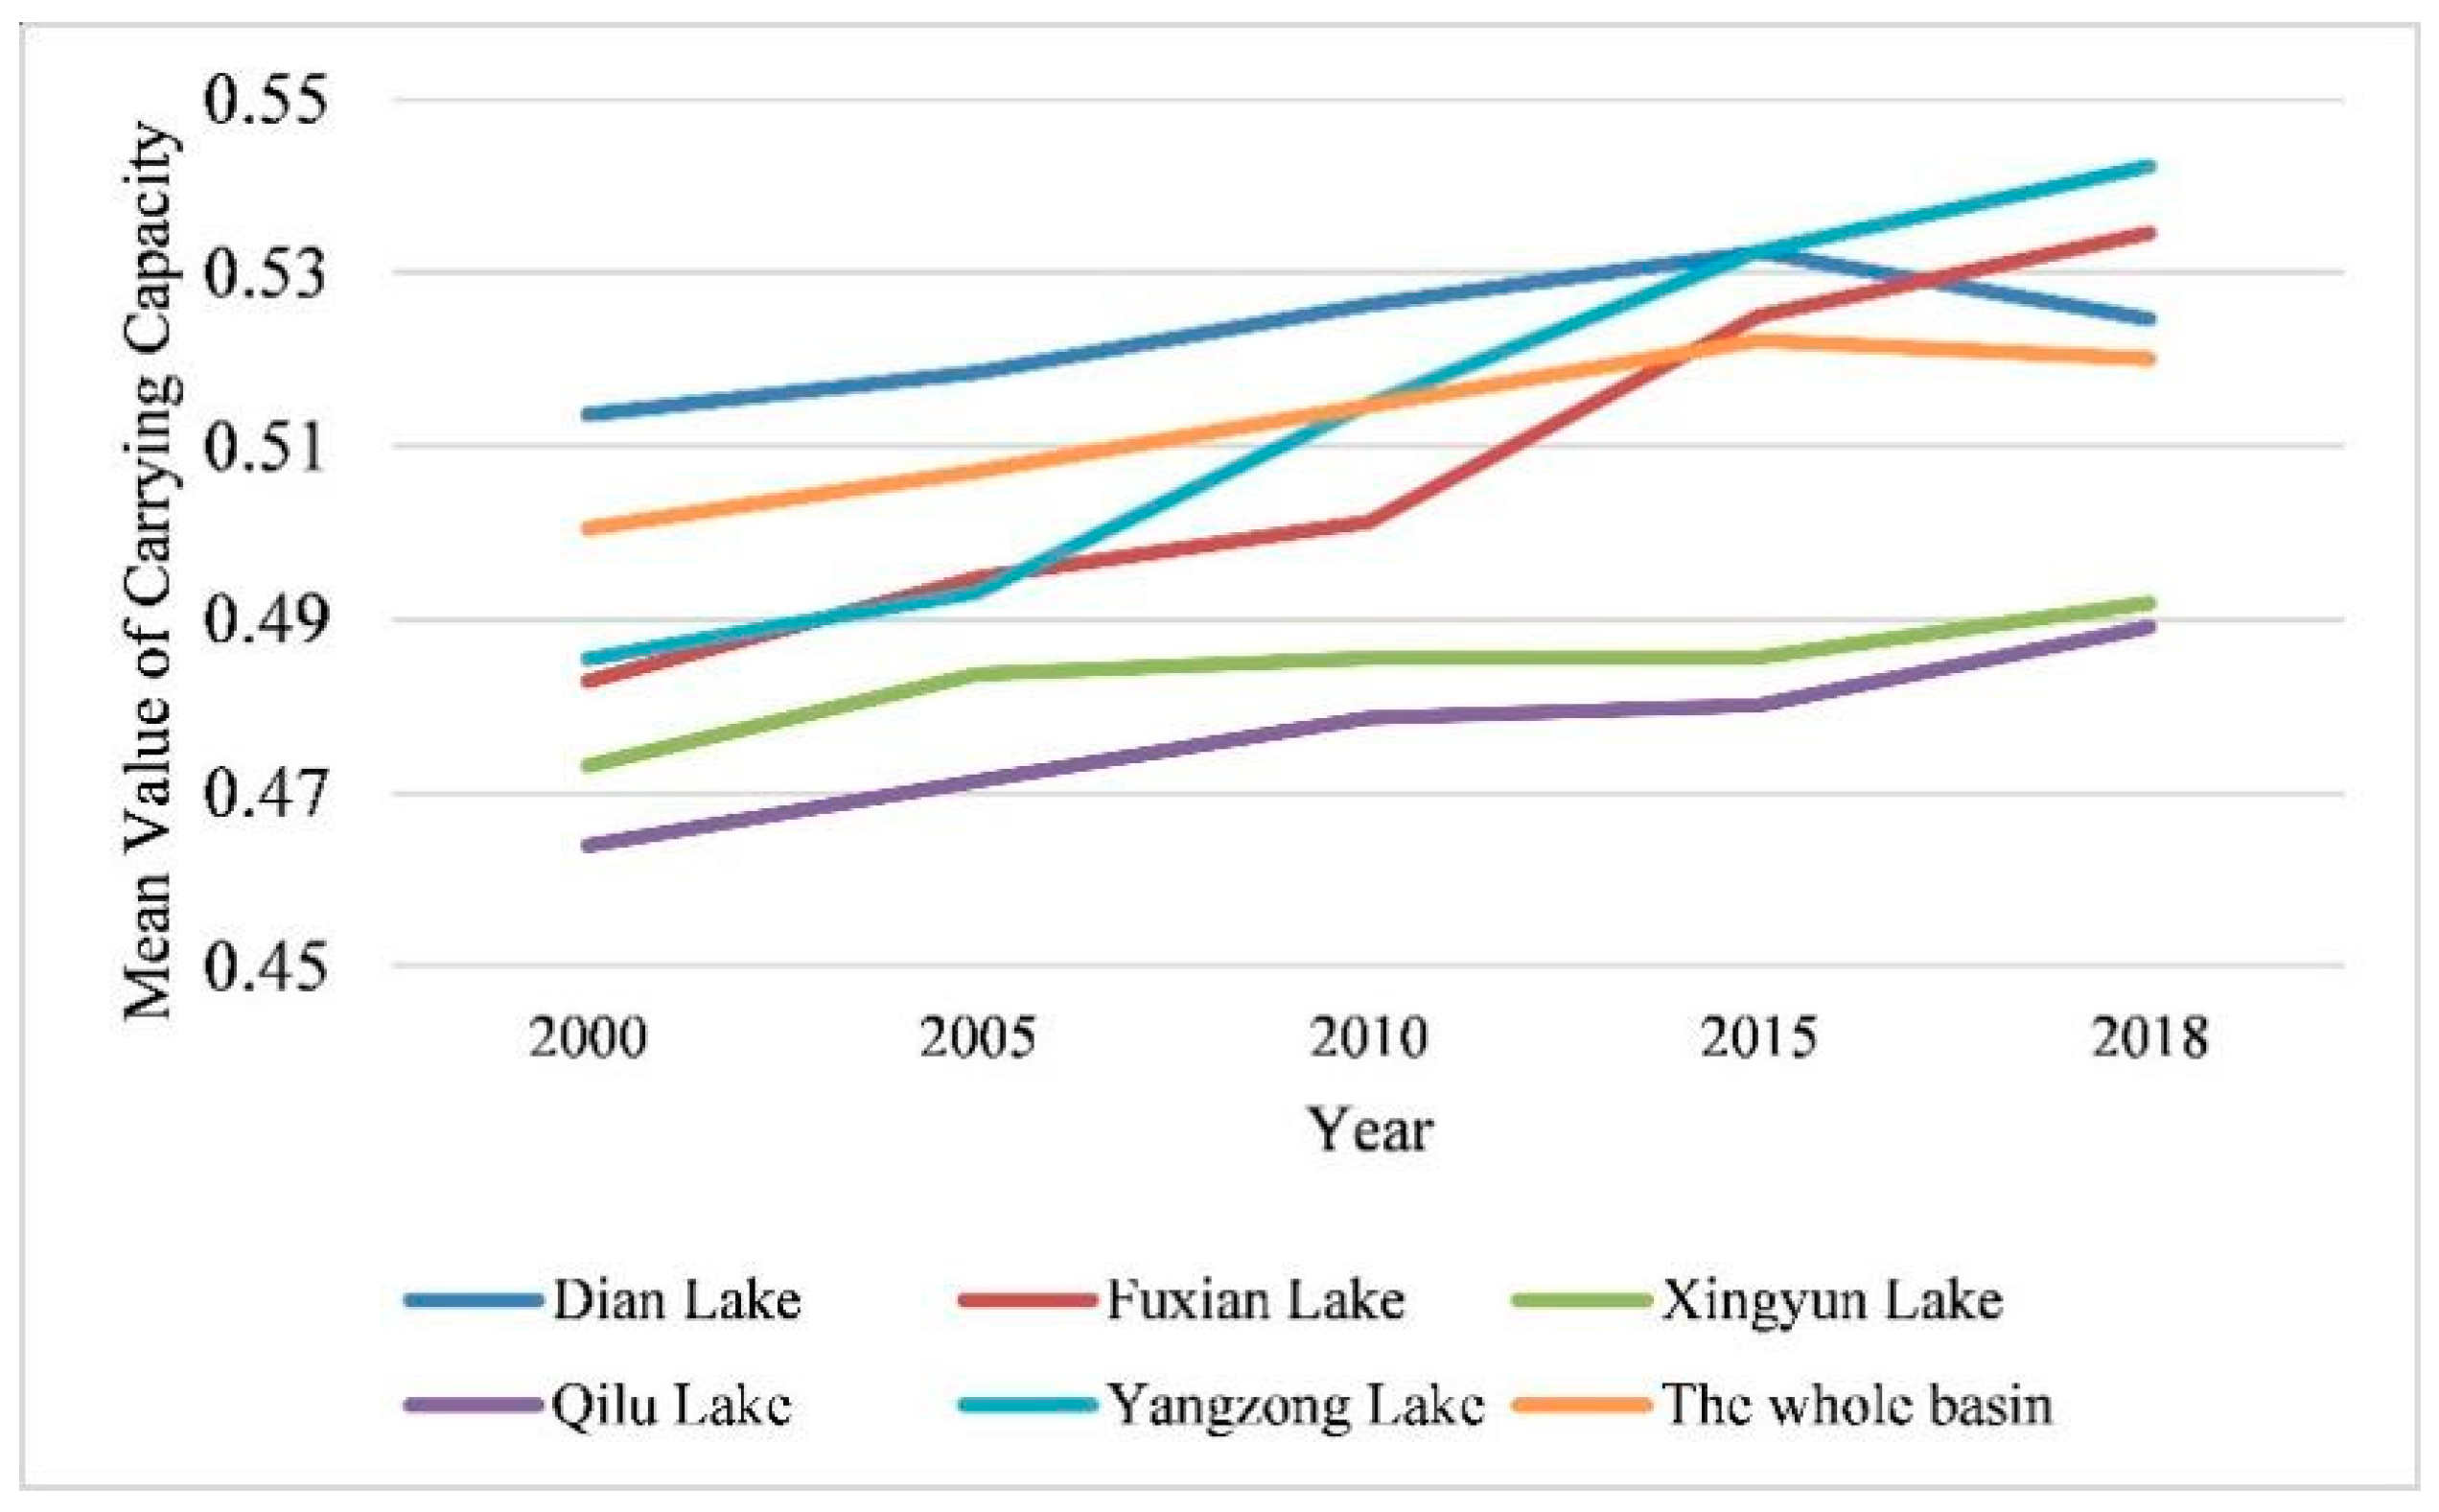
The present study enumerated the average ecological carrying capacity within the study area for different years, with Figure 2 showing the results as a time series chart.
The average ecological carrying capacity of the FLBOCYP was at a moderate level of ~0.5 over an extended period, indicating scope for improvement. There was an overall upward trend in the ecological carrying capacity of the FLBOCYP from 2000 to 2018, with the specific trend first increasing and then decreasing. The upward trend in ecological carrying capacity occurred from 2000 to 2015, with the average ecological carrying capacity increasing from 0.501 to 0.522 and reaching a peak. In contrast, the ecological carrying capacity showed a decreasing trend from 2015 to 2018, with an overall decrease of 0.002 over this period.
Within the different lake basins, the ecological carrying capacities of the Dian, Fuxian, and Yangzong Lake basins were relatively high, whereas those of the Xingyun and Qilu Lake basins were relatively low. There were increasing trends in the ecological carrying capacities of the five lake basins from 2000 to 2018. Among the five lake basins, the Fuxian and Yangzong Lake basins showed relatively faster growth in ecological carrying capacity and the Dian Lake basin showed a gradual growth before 2015, after which the ecological carrying capacity declined. Although there was gradual growth in the ecological carrying capacities of the Xingyun and Qilu Lake basins, their overall carrying capacities remained low.

4.1.2. Characteristics of the Spatial Distribution of Ecological Carrying Capacity
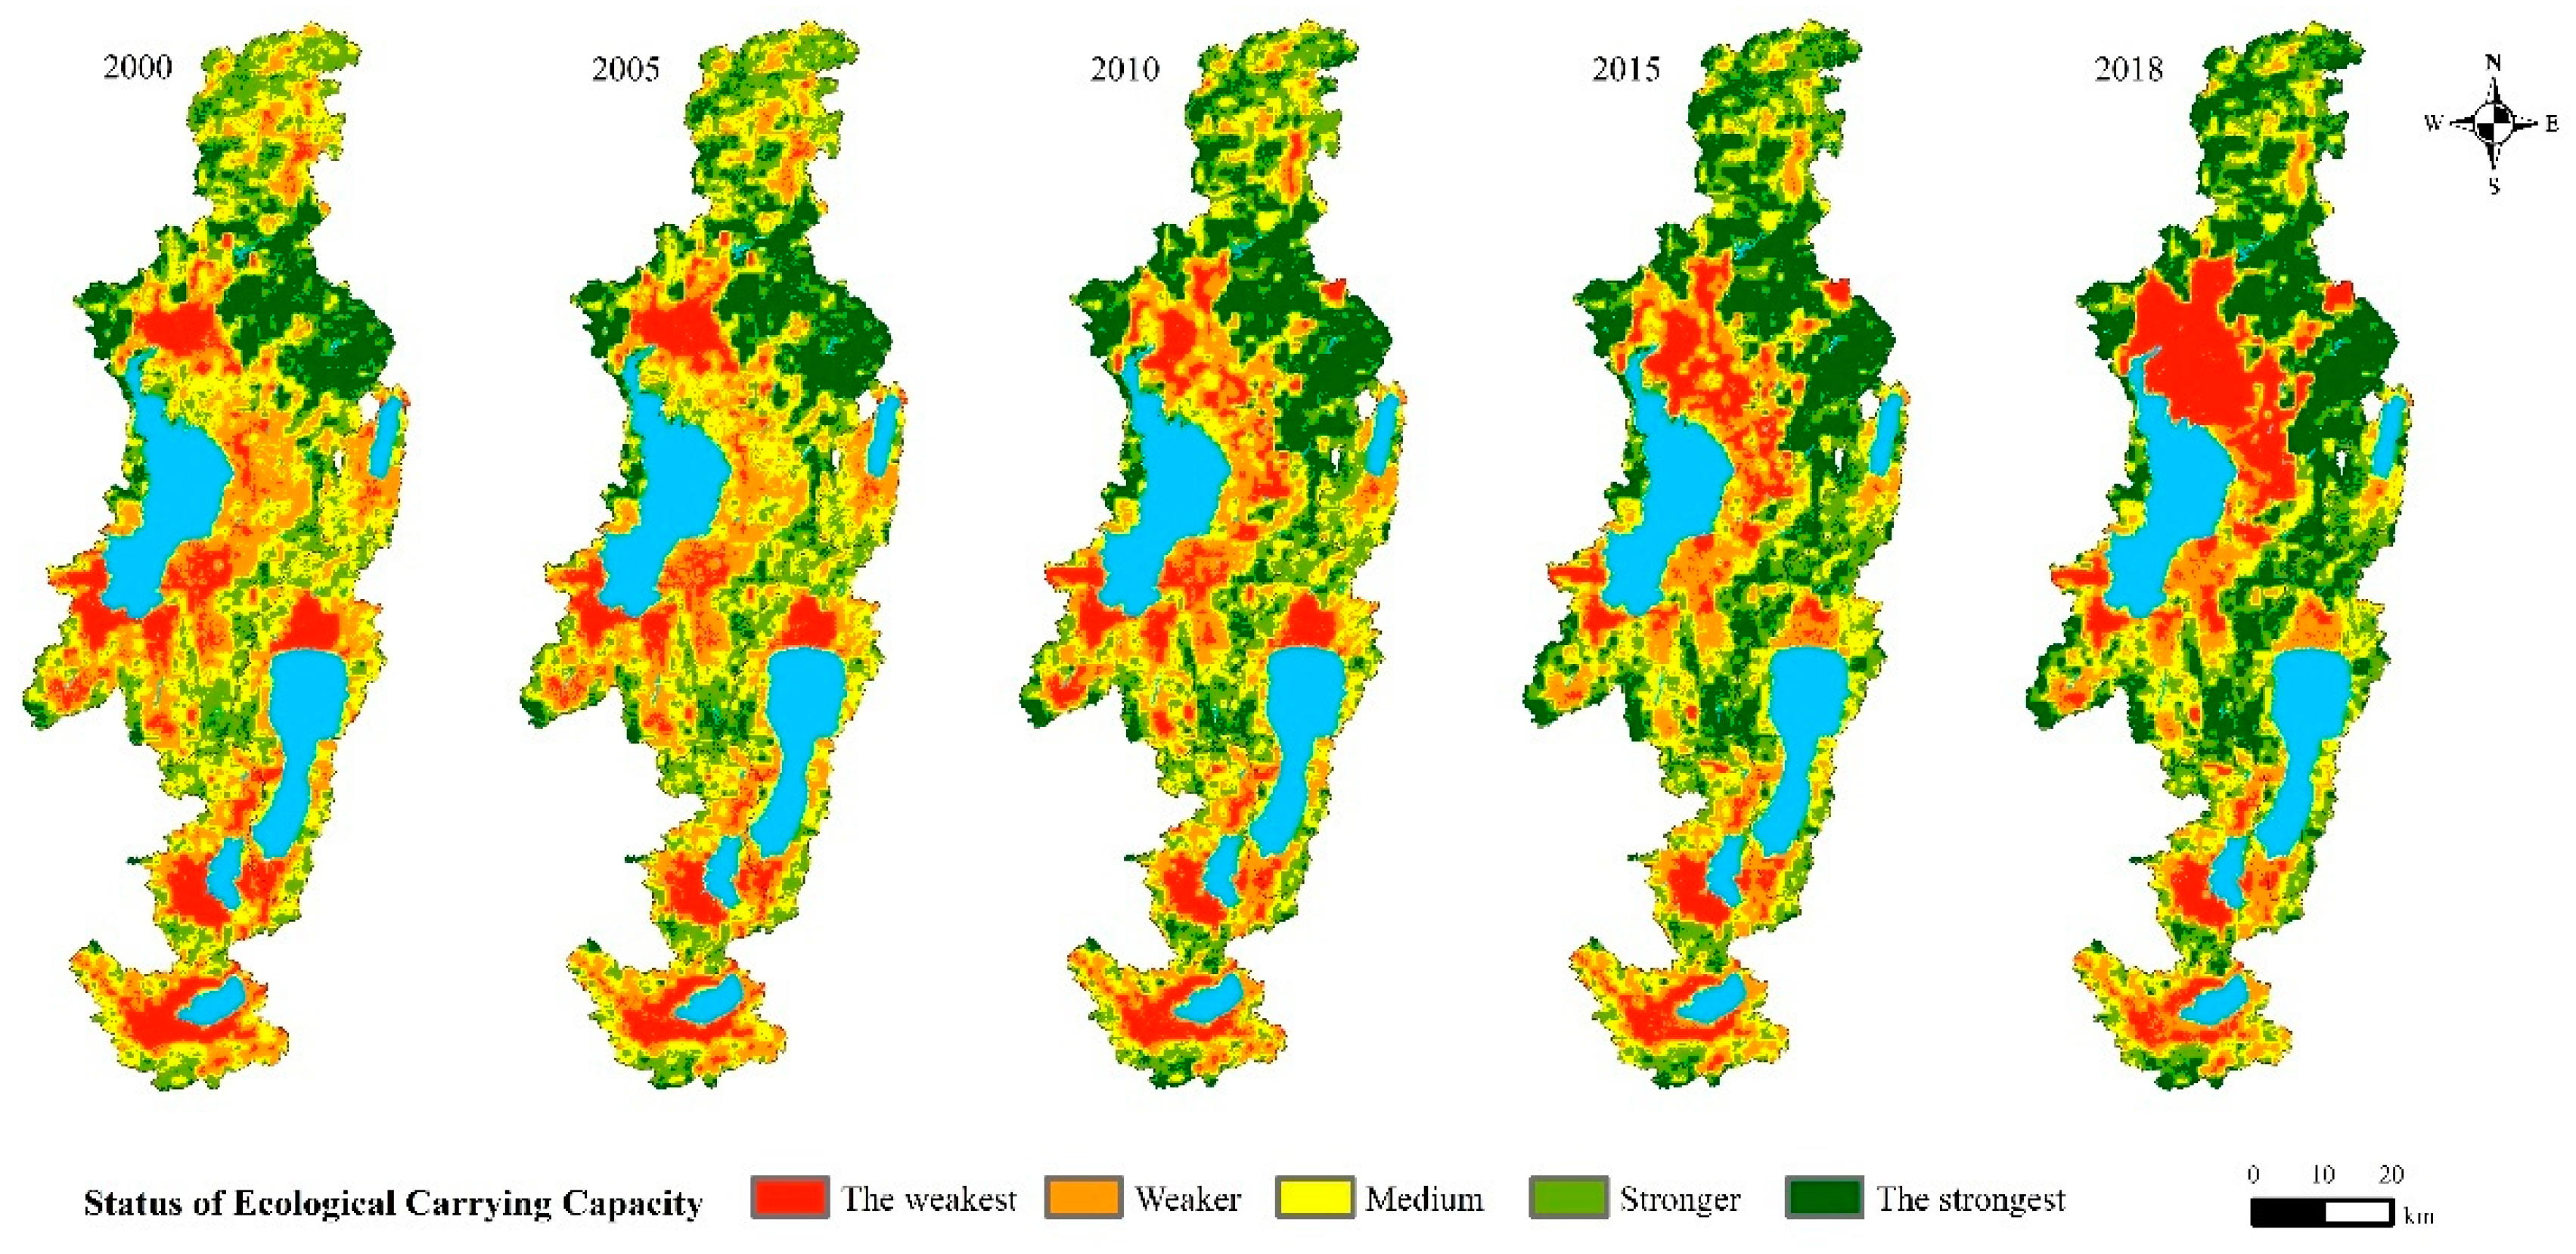
As shown in Figure 3, the present study divided ecological carrying capacity into five categories using the natural breakpoint method (Figure 3) to analyze the spatial distribution and changes in ecological carrying capacity.
The results showed a clear spatial variation in ecological carrying capacity. Areas with a weak carrying capacity were mainly distributed in the plain area of the lake, whereas areas with “stronger” and “the strongest” capacity were mainly distributed in the mountainous regions surrounding the basin. The areas of “weaker” and “medium” ecological carrying capacity in the mountainous areas were distributed between “the weakest” and “stronger” grades, showing a gradient change in ecological carrying capacity.
More specifically, areas with a low ecological carrying capacity were mainly distributed north of Dian Lake, including the main urban area of Kunming, to the east of Dian Lake, to the west of Chenggong county, in the urban area of Jinning County, in Chengjiang County north of Fuxian Lake, in the Jiangchuan urban area southwest of Xingyun Lake, and in the Qilu Lake nearshore ring zone. The dominant land-use types in areas with a low ecological carrying capacity experienced strong human activities and included urban land, transportation land, and rural land. Areas with a high ecological carrying capacity were mainly distributed to the east and north of the Dian Lake basin, and in the junction area of the Fuxian and Dian Lake basins. Areas of high ecological carrying capacity had higher vegetation coverage, more undulating terrain, less human interference, and stable ecosystems.

4.1.3. Characteristics of Spatial Changes

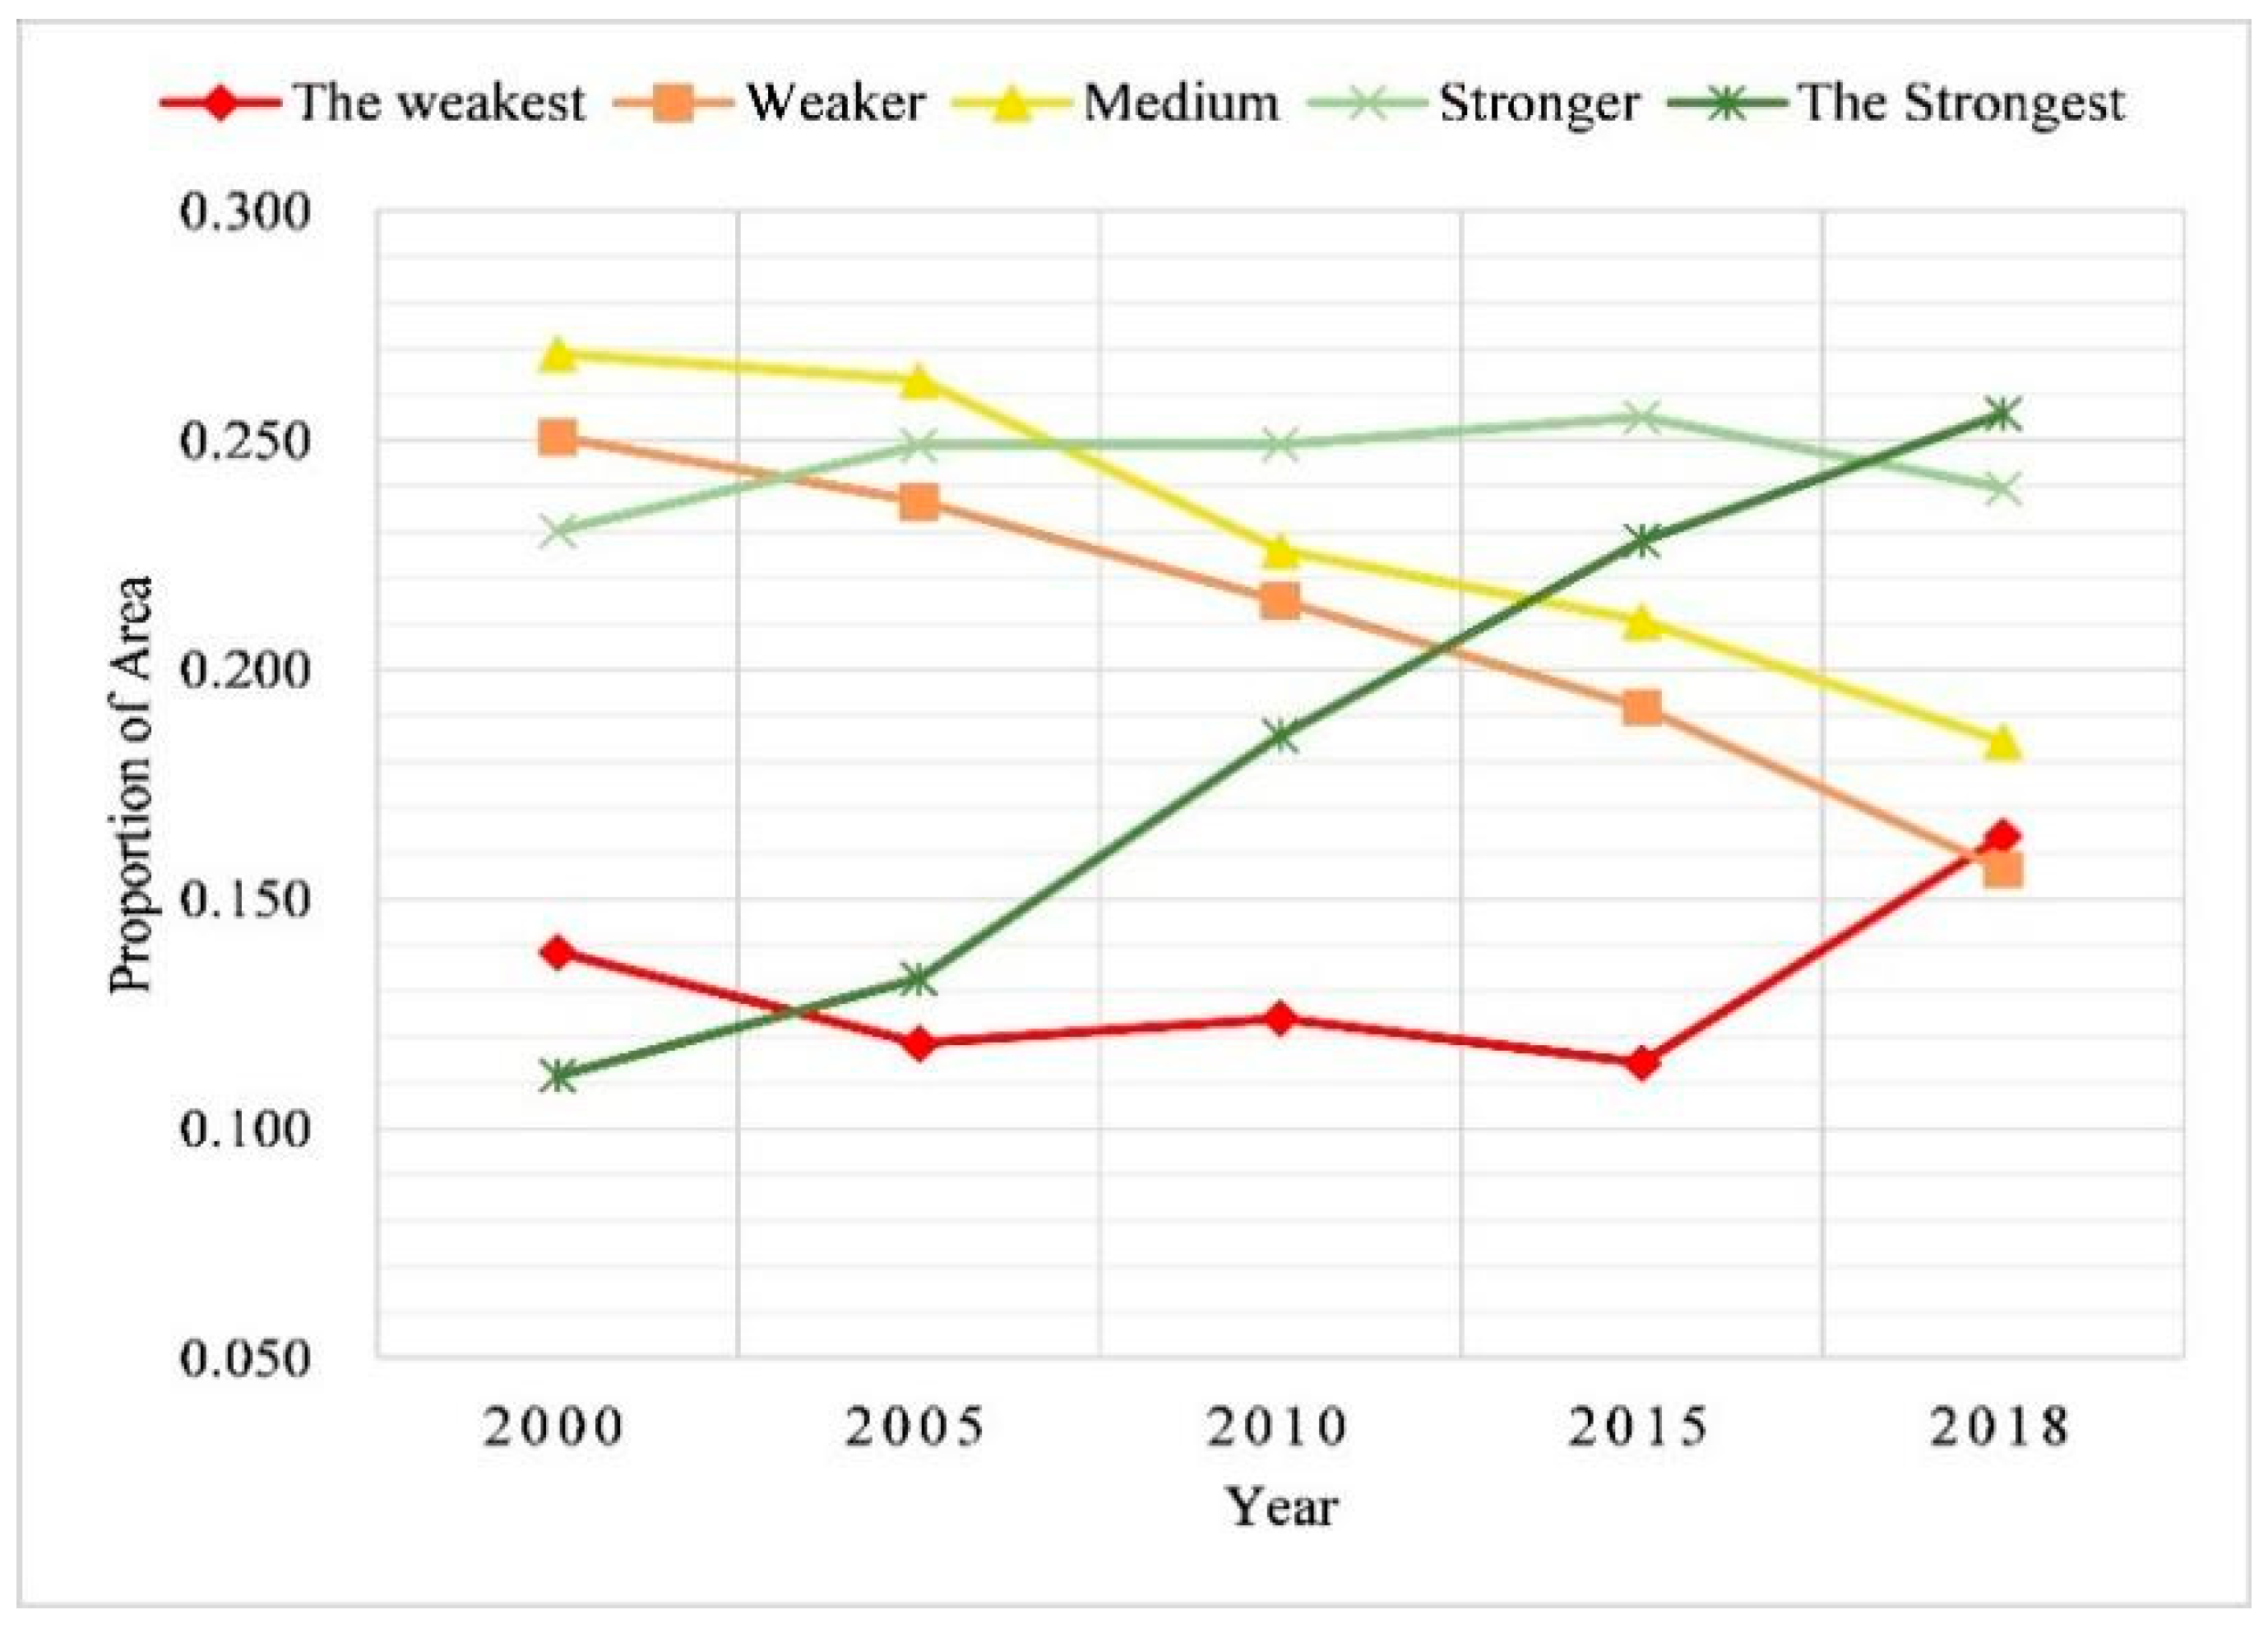
Figure 4 shows the proportions of the study area falling within the different categories of ecological carrying capacity over the different periods.
Overall, the areas of “weaker” and “medium” ecological carrying capacity decreased significantly from 2000 to 2018, whereas there was a significant increase in the area of “the strongest” carrying capacity. However, the area of “the weakest” ecological carrying capacity increased in the later period. Overall, there was a significant increase in the ecological carrying capacity of the study area over the study period, with some localized decreases in carrying capacity.
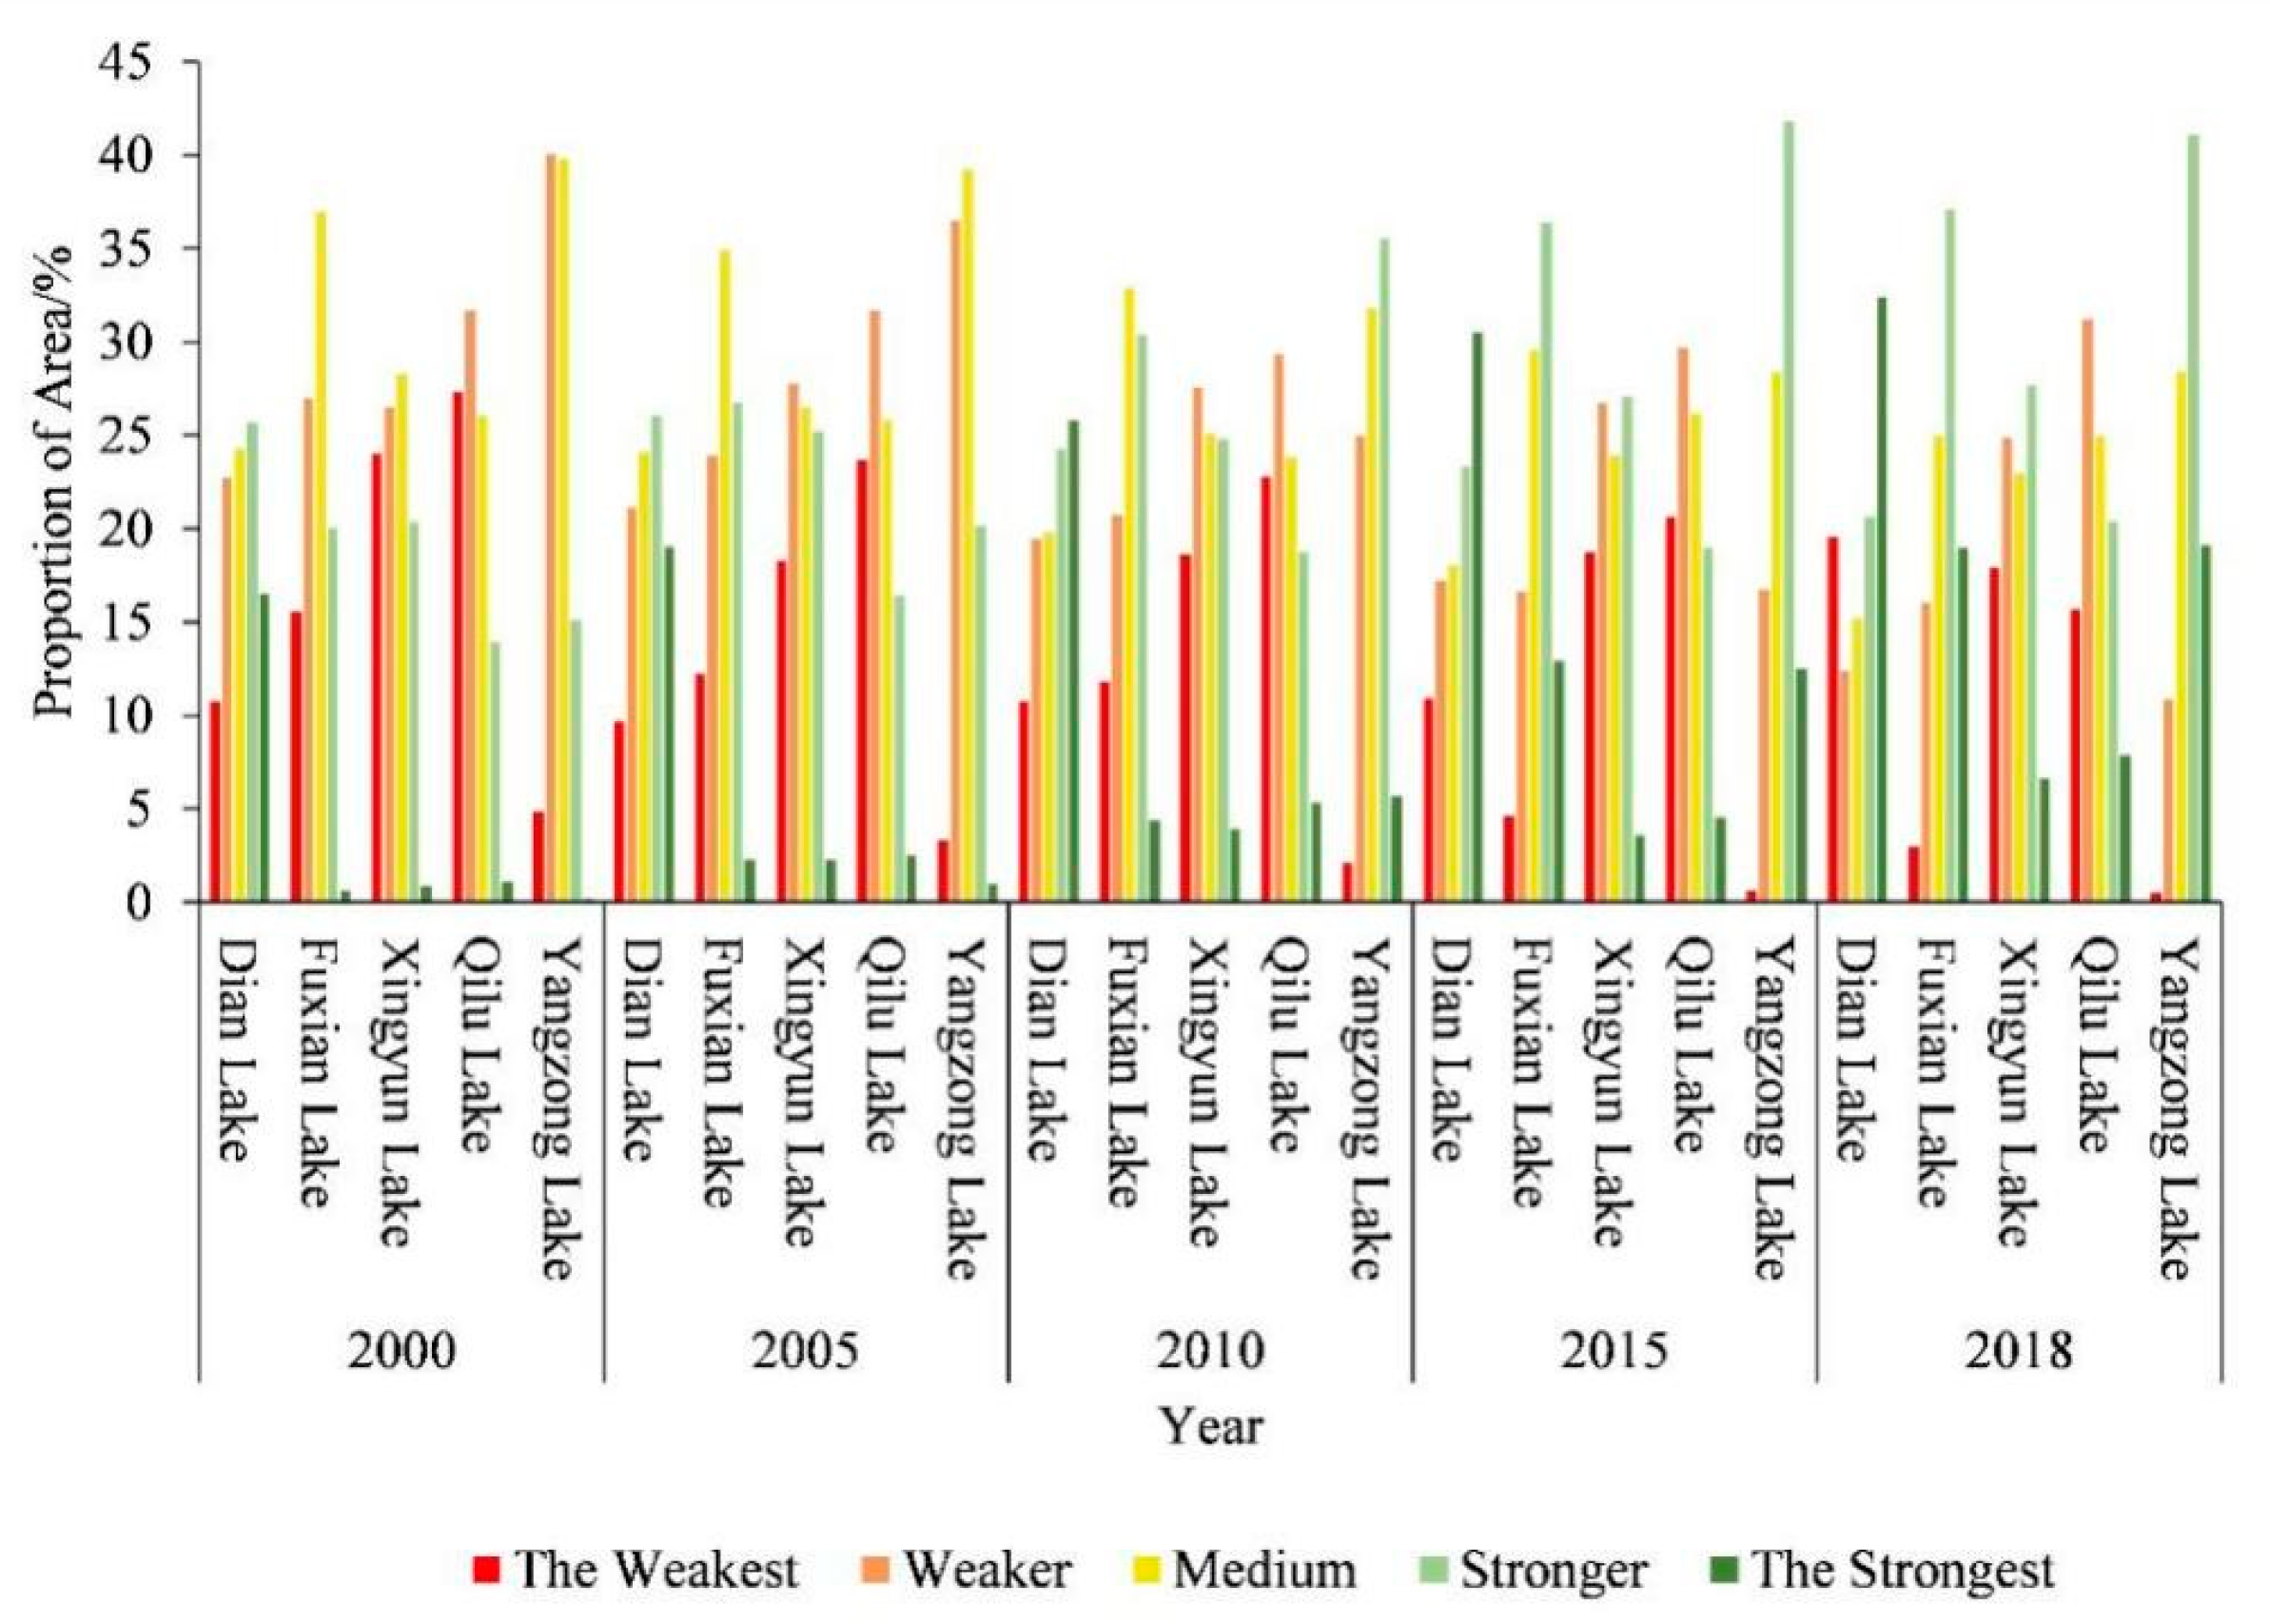
As shown in Figure 5, the present study calculated the proportion of the area falling under each category of ecological carrying capacity for each lake basin for the years 2000, 2005, 2010, 2015, and 2018.
As shown in Figure 5, the Dian Lake basin had a medium to strong ecological carrying capacity in 2000, whereas the Fuxian, Xingyun, and Yangzong Lake basins had medium to weak levels of ecological carrying capacity, with the Qilu Lake basin showing the weakest level. In contrast, the ecological carrying capacities of the Dian, Fuxian, and Yangzong Lake basins were relatively strong in 2018, that of the Xingyun Lake basin was moderate, and that of the Qilu Lake basin was medium to weak. The results showed that the proportions of areas with “strong” ecological carrying capacity in each lake basin continued to increase from 2000 to 2018. The proportions of “weak” ecological carrying capacity in the Fuxian, Xingyun, and Qilu Lake basins continued to decrease, whereas the ecological carrying capacity of the Xingyun Lake basin showed a fluctuating decreasing trend and there was an increasing trend in ecological carrying capacity in the Dian Lake basin. Except for the Dian Lake basin, there were gradual increases in the proportions of areas under the “stronger” category of ecological carrying capacity. In general, a higher proportion of each lake basin fell under the “stronger” category of ecological carrying capacity, and there were significant increases in the proportions of the area showing “the strongest” levels of ecological carrying capacity.

4.1.4. Characteristics of the Intensity of Spatial and Temporal Change in Ecological Carrying Capacity

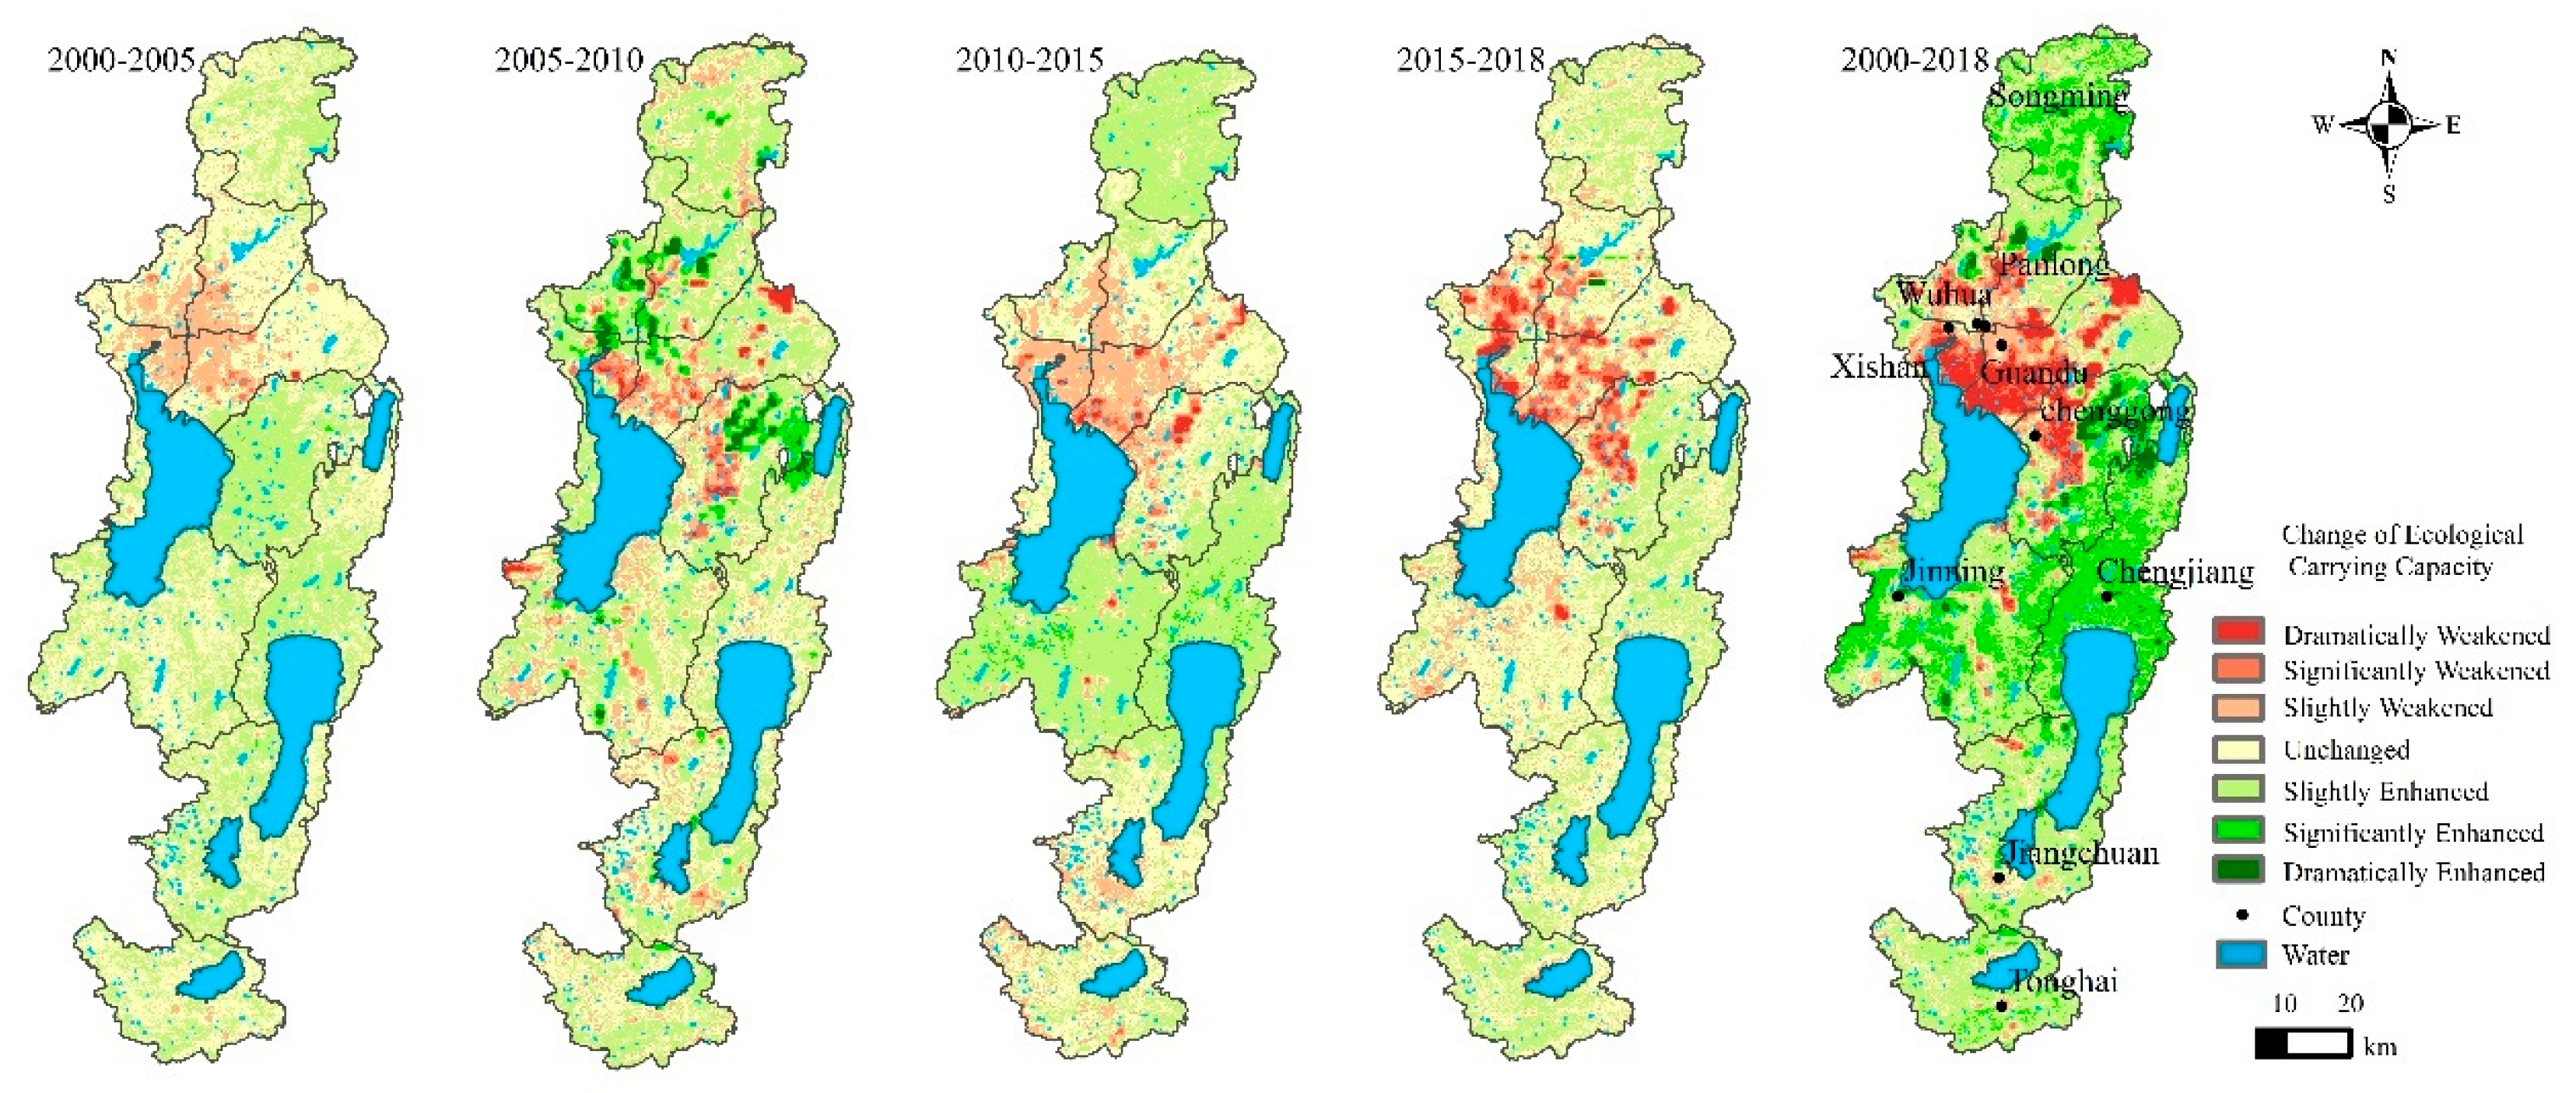
The present study further explored the characteristics of temporal and spatial changes in the ecological carrying capacity of the FLBOCYP by referring to the classification of the degree of changes in the ecological environment in the “Specifications”. As shown in Table 5, the changes to the ecological carrying capacity of the FLBOCYP were divided into seven levels. As shown in Figure 6, the spatial distribution of changes to ecological carrying capacity was visualized using GIS software.
There was less change in the ecological carrying capacity of the FLBOCYP from 2000 to 2005. There was a slight decline in the ecological carrying capacity of the main urban area of Kunming in the northern part of Dian Lake, whereas that of the Chenggong and Chengjiang counties slightly increased, and that of the remaining areas remained basically unchanged or slightly increased. The ecological carrying capacities of most areas remained basically unchanged or slightly increased from 2005 to 2010. The ecological carrying capacity of the lakeside area and northern part of Dian Lake decreased, whereas that of some urban areas of Kunming and the northeast of Chenggong increased significantly. A spatial pattern of minor changes in ecological carrying capacity of enhancing–weakening–enhancing–weakening was evident from north to south from 2010 to 2015, although there were significant declines in ecological carrying capacity in some areas of Guandu and Chenggong. The proportion of areas with weakened ecological carrying capacity increased significantly from 2015 to 2018, with this area including the main urban area of Kunming and the western part of Chenggong. A large area of Jinning showed a slight decline in ecological carrying capacity, whereas the other areas showed little change.
There were significant differences in the degree of change in the ecological carrying capacity of the FLBOCYP from 2000 to 2018. There were significant increases in the ecological carrying capacity of the northern, eastern, and southern parts of the Dian Lake basin, as well as in the Yangzong and Fuxian Lake basins. There was a significant decrease in the ecological carrying capacity of the main urban area of Kunming along the northern coast of Dian Lake. Changes in other areas were relatively small, with most areas showing a slight increase in ecological carrying capacity.
GIS was used to plot the spatial distribution of the degree of change in the ecological carrying capacity in each lake basin, with Table 6 showing the proportion of the area of each lake basin under each category of change in ecological carrying capacity.
As shown in Table 6, the dominant categories of change in the ecological carrying capacity from 2000 to 2018 in terms of the proportion of area were “slightly enhanced” and “no change”. This result indicates that the degrees of increase in ecological carrying capacity changed over time. There were slight increases followed by significant increases in the ecological carrying capacities of the Dian and Yangzong Lake basins from 2000 to 2018. The ecological carrying capacity of the Fuxian Lake basin first increased significantly and then showed a gradual increase. The ecological carrying capacities of the Xingyun and Qilu Lake basins increased slightly and then showed no change.
In summary, the ecological carrying capacities of all lake basins increased during the study period. Among them, that of the Fuxian Lake basin showed the highest increase, followed by the Dian and Yangzong Lake basins, whereas the increases in ecological carrying capacity in the Xingyun and Qilu Lake basins were not significant.

4.2. Spatial Pattern of Ecological Carrying Capacity

4.2.1. Global Spatial Autocorrelation

As shown in Table 7, the present study used ArcGIS software to calculate the global spatial autocorrelation coefficient of ecological carrying capacity and to analyze its spatial aggregation. In Table 7, Moran’s I represents global autocorrelation, whereas the Z-score and p value represent the significance of spatial autocorrelation. A Moran’s I ∈ [−1, 1], p < 0.05, and Z > 1.96 indicate spatial autocorrelation of data. Therefore, the results showed significant spatial autocorrelation.
As shown in Table 7, the Moran’s I values exceeded 0.96 from 2000 to 2018, indicating significant spatial aggregation of the ecological carrying capacity. There was a relatively low inter-year variation in the Moran’s I values, with a stable spatial pattern, fluctuating increasing trend, and enhanced spatial aggregation.

4.2.2. Localized Spatial Autocorrelation

The use of global spatial autocorrelation can emphasize the overall spatial pattern of the ecological carrying capacity. Local spatial autocorrelation can show the spatial pattern and evolution of the ecological carrying capacity within a region. As shown in Figure 7, the present study used GIS software to visualize the spatial distribution of the ecological carrying capacity and to analyze the internal spatial correlation in the ecological carrying capacity.
There were five aggregation states in the local spatial pattern of ecological carrying capacity of the five major lake basins from 2000 to 2018: (1) “High-high” aggregation (HH) in which the ecological carrying capacity of the area itself and that of the surrounding area was relatively high. Under this category, the aggregation was concentrated outside of the basin. There was a decrease in the area of “HH” in the northeast Dian Lake basin and along the north bank of the Dian Lake from 2000 to 2018, whereas the area of “HH” increased significantly in the mountainous areas at the junction of the basins. (2) “Low-low” aggregation (LL) in which the area itself and the surrounding area showed a low ecological carrying capacity. Areas of “LL” were mainly distributed in the plain area around the lake. There were significant reductions in the areas of “LL” in the southern part of the Dian Lake basin and in the Yangzong and Fuxian Lake basins, whereas there was a significant increase in the northern part of the Dian Lake basin. (3) Non-significant aggregation in which the aggregation state was mainly distributed in the transition zone between “HH” and “LL”. (4) “High–low” aggregation (HL) in which the ecological carrying capacity of the area itself was high, whereas that of the surrounding areas was low. (5) “Low–high” aggregation (LH) in which the ecological carrying capacity of the area itself was low, whereas that of the surrounding area was high. Both “HL” and “LH” showed abnormal spatial aggregation states. The results showed that “HH” and “LL” accounted for the largest proportions of the region, followed by non-significant aggregation, whereas the proportions of area occupied by “HL” and “LH” were relatively minor.

4.3. Driving Factors of Spatial Differentiation in Ecological Carrying Capacity

Geo-detectors are a set of statistical methods that detect spatial heterogeneity and reveal the driving forces behind it. The core idea is based on the assumption that if an independent variable has a significant effect on a dependent variable, the spatial distribution of the independent and dependent variables should be similar [51]. Different factors affected the spatial differentiation of the ecological carrying capacity of the FLBOCYP, and in order to explore the strength and weakness of the spatial differentiation influence of each driving factor on the ecological carrying capacity, geo-detectors are selected to achieve it. In the principle of geographic detectors, q is an indicator of spatial heterogeneity, and the value range of q is [0,1], and the larger the q value, the stronger the explanatory power of the influence factor on the spatial differentiation of the results [51]. For example, if the indicator completely controls the distribution of the ecological capacity, Q = 1, if the indicator does not control the distribution of the ecological capacity at all, Q = 0. Therefore, the Q value is used to study the quantitative influence of natural factors and human activity factors on the ecological carrying capacity. According to the principle and method of geo-detectors, a 1 km grid of the study area was created with 3870 grid points. The ecological carrying capacity and index value of each point was extracted for the different years. The extracted ecological carrying capacity was input as the dependent variable Y, whereas each extracted index factor was input as an independent variable X. The geo-detector was then used to determine the degree of interpretation (q value) of each index for the ecological carrying capacity, with the results shown in Table 8.
The value of q generated by the geo-detector is proportional to the degree to which an index explains the spatial variation in ecological carrying capacity. As shown in Table 8, the factor explaining the majority of spatial variation in ecological carrying capacity was ecological elasticity, with a q value > 0.70 over the five periods, followed by biological richness and proportion of woodland (q > 0.60), and human disturbance (q > 0.45). The remaining factors had relatively little influence on the spatial distribution in ecological carrying capacity.
There were also changes in the influence of different indicators on ecological carrying capacity over time from 2000 to 2018. The degrees to which the ecological elasticity, biological richness, proportion of woodland, human disturbance, degree of relief, normalized difference vegetation index, land surface temperature, soil erosion, population density, and average salary of employees explained the spatial distribution of ecological carrying capacity increased over time, whereas that of the proportion of tertiary industry, application qualities of pesticide and fertilizer, and grain yield decreased significantly over time.
Table 9 shows the extracted values of each factor in the interaction detector (only a portion of the data for 2018 is shown).
A comparison of the results of interaction detection (Table 9) with the single factor explanatory power (Table 8) showed that the interactions between each factor had a greater explanatory power for the spatial differentiation in ecological carrying capacity than the single factor itself. After the interaction, the explanatory powers of the per-capita net income of rural residents and ecological elasticity were the highest among all factors across all years at 0.858, 0.845, 0.887, 0.883, and 0.914 for 2000, 2005, 2010, 2015, and 2018, respectively, with their explanatory power showing an increasing trend. The interaction between the per-capita net income of rural residents and ecological elasticity had the greatest influence on the spatial distribution in ecological carrying capacity. Ecological elasticity is an important indicator reflecting the ecological state of a region. The per-capita net income of rural residents reflected the regional economic status and the living standards of residents. The combination of these two factors allowed an improved interpretation of the balance between economic development and ecological protection.

5. Discussion

5.1. Applicability of the Comprehensive Index Evaluation Method

Research on the ecological carrying capacity of the FLBOCYP has strengthened and consolidated methods used to study ecological carrying capacity. Although the combined use of a grid scale and the comprehensive index evaluation method can complicate data acquisition and the spatialization process, the model construction process is relatively simple [52]. In addition, the appropriate evaluation indicators can be selected according to research needs. This approach is suitable for the study of more complicated areas such as a lake basin. The optimal use of the approach is to use the correlation model to identify the correlation between indicators, filter and streamline the indicator system, and reduce the overlap between indicators [27]. This approach can improve efficiency and provides an improved evaluation. We can also add the function of ecological services, environmental management capacity, ecological risk, environmental health and other factors, take further research on ecological carrying capacity potential, ecological safety early warnings, and so on [53].

5.2. Ecological Carrying Capacity and Driving Forces

Among related past studies, Tw A [29] and X Ma [54] used evaluation indicators to study the ecological carrying capacity of the Aral Sea basin and the ecological fragility of the Dian Lake basin. These two studies determined that the carrying capacities of lake basins exceeded those of downstream areas, with the degree of ecological fragility increasing with increasing proximity to the lake area, consistent with the results of the present study. Areas close to lakes tend to be strongly disturbed by human activity, whereas mountainous areas tend to have good vegetation coverage and healthy ecological states. The result of the present study indicating a medium level of ecological carrying capacity in the FLBOCYP is consistent with the conclusions of some previous studies in which a comprehensive index method was used to determine the ecological carrying capacity in the Kunming and Yuxi areas. Among these studies, the remote-sensing ecological index (RSEI) method used by Nong [55] incorporated fewer indicators, whereas the remaining studies focused on indicators of urban resources and the environment, with little emphasis on indicators such as the status quo of ecological functions. The evaluation by Qiu [56] was based on national and municipal statistical data, and although they used detailed indicators, their study showed a certain deviation in accuracy. The overall increasing trend in carrying capacity evident in the results of the current study is consistent with the conclusions of He [57], Liu [58], Chen [59], and Zhu [60]. The implementation of the “Century Green Project” during the “Ninth Five-Year Plan”, the “Natural Forest Protection Project” in 2000, and improvements to urban ecological service functions and environmental management capacity in China have played an important role in improving and restoring the ecology of central Yunnan Province. However, increasing pressure brought by urban development has resulted in a trend of reducing ecological carrying capacity in some areas, indicating the need to strengthen policy implementation in these areas. However, the results of the present study contradict those of certain previous studies on the ecological carrying capacity of Kunming City and the Dian Lake basin using the ecological footprint method. This difference can be attributed to the complexity of the ecosystem and the biophysical nature of the ecological footprint method. The ecological footprint method lacks the ability to evaluate the sustainability of the social economy and does not consider the difference between the multi-functionality and output capacity of the land itself. Therefore, the ecological footprint method is more suitable for assessing the ecological carrying capacity of larger areas at a low accuracy requirement. However, many studies have nevertheless applied the ecological footprint method for the assessment of carrying capacity in smaller administrative regions, which has contributed to uncertainty in their results [61,62]. In contrast, the comprehensive index evaluation method used in the present study considers more comprehensive factors and is more in line with the research needs of areas with more complex structures and functions, such as lake basins.

5.3. Spatial Characteristics of Ecological Carrying Capacity

The results of the present study showed that the ecological carrying capacity of the FLBOCYP has gradually increased since the 21st century, with ecological carrying capacity low and high around the lakes and on the lake peripheries, respectively. This result is consistent with that of Li [63] who applied the normalized difference vegetation index (NDVI) to nine plateau lakes in Yunnan Province. Although changes to the ecological carrying capacity of a region occur through a complex and long-term process with many influencing factors [64], certain dominant forces can be isolated. Since the reform and opening-up of China, the Kunming and Yuxi regions have continuously developed their understanding of protection of the ecological environment and have vigorously promoted the restoration of vegetation, afforestation, treatment of rural sewage, and other measures in the basin [65,66,67] to improve the ecological quality of the basin. The district is also facing pressure on resources, the environment, and ecology resulting from urban expansion and accelerated urbanization [68,69]. The results of the present study indicated that the form of spatial accumulation of ecological carrying capacity in the region is mostly of the “high-high” and “low-low” aggregation types. Therefore, there are interrelations between the carrying capacity of the region itself and that of the surrounding areas, and areas with a high ecological carrying capacity can act to drive improvements to the ecological environments of surrounding areas. Among the spatially distinct drivers of ecological carrying capacity, the effects of interactions between individual factors on ecological carrying capacity exceed those of individual factors. This result further emphasizes the complexity of the ecosystem incorporating natural, economic, and social aspects. Therefore, interactions between different geographical elements have stronger influences on geographical phenomena [70].
Ecological carrying capacity is an important indicator of sustainable development. The results of the present study indicated an increasing trend in the ecological carrying capacity of the FLBOCYP. However, a deeper examination shows continuing increases in the ecological carrying capacities of the mountainous and semi-mountainous areas around the basin and weakening ecological carrying capacities of the plain areas. This phenomenon appears to show an element of unsustainability within development in the area. The plain area in the FLBOCYP is the main area of human development, and the ecology of this area appears to be deteriorating over time. Even though the environment within the periphery of the basin is improving, this area has a weak effect on human life in the plain area. Therefore, despite an overall trend of improving ecological carrying capacity in the FLBOCYP, the future outlook on the ecological environment of this region is not optimistic. There is therefore a need for further focus on reasonable planning and the management of land use in the FLBOCYP, with a particular focus on improving the ecological environment in the plain area. Land planning work in the FLBOCYP is currently underway, and the results of the present study can act as a reference in future land planning and management.

5.4. Suggestions for Improving Ecological Carrying Capacity

According to the results of the geo-detector, among many factors, ecological elasticity, biological richness index, proportion of woodland, and human disturbance have the strongest explanatory power, which provide certain directions for ecological environmental protection decision-making. Considering the ecological elasticity, we should reduce the intensity of exploitation and utilization of natural resources, rationally plan the development layout, gradually restore and improve the landscape diversity, and enhance the ecological elasticity. Considering the biological richness index and the proportion of woodland, measures should be taken to return farmland to forest, close mountains to forest, implement natural forest protection projects, increase the vegetation coverage rate, and pay attention to the whole ecosystem in urban ecological planning, pay attention to urban green space construction, and maintain biodiversity. From the perspective of human disturbance, we should strengthen the supervision of tourism, advocate eco-tourism and smart tourism, strengthen the supervision of industrial and agricultural wastewater treatment and the use of pesticides and fertilizers in the basin, and rationally allocate wetland resources in the lake basin to avoid over-exploitation.

6. Conclusions

The present study used RS and GIS technology and the comprehensive index evaluation method to monitor and evaluate the ecological carrying capacity of the Five Lakes Basin in central Yunnan Province from 2000 to 2018 at a 100 m grid scale. The main conclusions of the present study were: (1) The overall ecological carrying capacity of the FLBOCYP is at a medium level, although there is further scope for improvement, and the distribution of ecological carrying capacity in the basin showed clear spatial heterogeneity. (2) There was an overall trend of increasing ecological carrying capacity in the FLBOCYP from 2000 to 2018, although the average ecological carrying capacity decreased after 2015. Human activities such as rapid urbanization were the main driver of this decline in ecological carrying capacity. (3) Ecological carrying capacity showed significant agglomeration and a gradual increasing trend, with clear interactions between ecosystem factors. Future efforts to improve the ecological carrying capacity of the FLBOCYP should focus on the ecological environment of the plain area, which would contribute to the sustainable development of the entire river basin.
Using GIS and RS combined with comprehensive index evaluation techniques, the spatial visualization of regional ecological carrying capacity was carried out with an accuracy of 100 m × 100 m. Compared with previous studies based on cities, counties, or whole river basins, the spatial distribution and internal change process of regional ecological carrying capacity could be more clearly and intuitively paid attention to, in order to provide more targeted and valuable reference for ecological environmental protection.

Author Contributions

Conceptualization, H.Z., F.C. and J.W.; data curation, H.Z.; formal analysis, H.Z. and F.C.; funding acquisition, J.W.; investigation, H.Z., F.L. and L.N.; methodology, H.Z., Y.J., J.Z. and J.S.; software, H.Z. and F.C.; supervision, J.W.; validation; writing—original draft, H.Z. and F.C.; writing—review and editing, H.Z. and J.W. All authors have read and agreed to the published version of the manuscript.

Funding

This research was funded by the multi-government International Science and Technology Innovation Cooperation Key Project of National Key Research and Development Program of China for the“Environmental monitoring and assessment of land use/land cover change impact on ecological security using geospatial technologies” (grant number 2018YFE0184300); the National Natural Science Foundation of China for “Natural Forests Biomass Estimation at Tree Level in Northwest Yunnan by Combining ULS and TLS Cloud Points Data” (grant number 41961060); and the Program for Innovative Research Team (in Science and Technology) in the University of Yunnan Province (grant number IRTSTYN).

Institutional Review Board Statement

Not applicable.

Informed Consent Statement

Not applicable.

Data Availability Statement

The Landsat data were obtained from the Geospatial Data Cloud platform (www.gscloud.cn/search (accessed on 1 April 2020)).

Acknowledgments

We would like to thank the Key Laboratory of Resources and Environmental Remote Sensing for Universities in Yunnan, and the Center for Geospatial Information Engineering and Technology of Yunnan Province. We also thank the anonymous reviewers and the academic editor for their valuable comments and recommendations.

Conflicts of Interest

The authors declare no conflict of interest.

References

  1. Ye, J.; Xie, Q.Q.; Tan, Y.N. National land spatial pattern distribution method based on ecological carrying capacity. Trans. Chin. Soc. Agric. Eng. 2017, 33, 262–271. [Google Scholar]
  2. Gao, J.X.; Chen, S.B. Optimize the spatial structure based on ecological capacity. Environ. Prot. 2014, 42, 12–18. [Google Scholar]
  3. Park, R.E. Sociology and the social sciences. Am. J. Sociol. 1921, 26, 401–424. [Google Scholar] [CrossRef]
  4. Haden, S.; Palmer, L.J. Reindeer in Alaska. U.S. Dep. Agric. Bull. 1922, 1089, 1–70. [Google Scholar]
  5. Bailey, J.A. Principles of Wildlife Management; Tohn Wiley and Sons, Inc.: New York, NY, USA, 1984. [Google Scholar]
  6. Price, D. Carrying capacity reconsidered. Popul. Environ. 1999, 21, 5–26. [Google Scholar] [CrossRef]
  7. Brush, S. The concept of carrying capacity for systems of shifting cultivation. Am. Anthropol. 1975, 77, 799–811. [Google Scholar] [CrossRef]
  8. Qian, Y.; Tang, L.; Qiu, Q.; Xu, T.; Liao, J. A comparative analysis on assessment of land carrying capacity with ecological footprint analysis and index system method. PLoS ONE 2015, 10, e0130315. [Google Scholar] [CrossRef] [PubMed]
  9. UNESCO; FAO. Carrying Capacity Assessment with a Pilot Study of Kenya: A Resource Accounting Methodology for Sustainable Development; UNESCO: Paris, France; FAO: Rome, Italy, 1985. [Google Scholar]
  10. Tao, Z.P. Ecological Baggage and Ecological Footprint; Economic Science Press: Beijing, China, 2003. [Google Scholar]
  11. Bishop, A.; Fullerton, C. Carry Capacity in Regional Environment Management; Government Printing Office: Washington, DC, USA, 1974.
  12. Arrow, K.; Bolin, B.; Costanza, R.; Dasgupta, P.; Folke, C.; Holling, C.S.; Jansson, B.O.; Levin, S.; Mäler, K.G.; Perrings, C.; et al. Economic growth, carrying capacity, and the environment. Science 1996, 1, 104–110. [Google Scholar]
  13. Rijsberman, M.A.; Ven, F. Different approaches to assessment of design and management of sustainable urban water systems. Environ. Impact Assess. Rev. 2000, 20, 333–345. [Google Scholar] [CrossRef]
  14. Smaal, A.C.; Prins, T.C.; Dankers, N.M.J.A.; Ball, B. Minimum requirements for modelling bivalve carrying capacity. Aquat. Ecol. 1997, 31, 423–428. [Google Scholar] [CrossRef]
  15. Wang, J.J.; Yao, X.H.; Li, J.R.; Chang, H.; Wang, Y.G. Assessment for ecological carrying capacity of Heihe River Basin. Res. Environ. Sci. 2000, 4, 44–48. [Google Scholar]
  16. Lieth, H.; Whittaker, R.H. Primary Productivity of the Biosphere; Springer: New York, NY, USA, 1975. [Google Scholar]
  17. Zhang, X.T.; Tan, Q.L.; Dong, X.F.; Li, Y.; Qin, X.C. Application of MODIS Satellite data in Evaluating Ecological Carry Capacity of central Asia. Remote Sens. Inf. 2018, 33, 55–63. [Google Scholar]
  18. Xu, B.; Pan, J. Estimation of potential ecological carrying capacity in China. Environ. Sci. Pollut. Res. 2020, 27, 18044–18063. [Google Scholar] [CrossRef] [PubMed]
  19. Wu, D.; Wu, C.; Xu, D. Research on the sustainable development capacity based on ecological footprint model in the Northeast of China from 1999–2008. In Proceedings of the 2010 IEEE International Conference on Emergency Management and Management Sciences, Beijing, China, 8–10 August 2010; pp. 148–151. [Google Scholar]
  20. Xiang, X.R.; Pan, T.; Wu, S.H.; Liu, W.D.; Ma, L.; Wang, X.F.; Yin, Y.H.; Li, J. Assessment and prediction of ecological carrying capacity for the Northern Slope Economic Belt of Tianshan Mountains. Geogr. Res. 2016, 35, 875–884. [Google Scholar]
  21. Gong, J.; Liu, D.Q.; Ma, X.C.; Zhang, J.Q. Spatiotemporal change of ecological carrying capacity in Bailong Watershed of Gansu Province. Bull. Soil Water Conserv. 2017, 37, 242–247+352. [Google Scholar]
  22. Ban, X.; Wen, H.; Song, B. Ecological carrying capacit evaluation of Shijiazhuang city based on ecological footprint. In Proceedings of the International Conference on Information Science & Engineering, Hangzhou, China, 4–6 December 2011. [Google Scholar]
  23. Yue, Q.; Wu, X.; Wang, Y. Analysis and evaluation of the ecological carrying capacity of Liaoning Two Urban Agglomerations based on State Space Method. Appl. Mech. Mater. 2013, 295–298, 2564–2568. [Google Scholar] [CrossRef]
  24. Tang, B.; Hu, Y.; Li, H.; Yang, D.; Liu, J. Research on comprehensive carrying capacity of Beijing–Tianjin–Hebei region based on state-space method. Nat. Hazards 2015, 84, 113–128. [Google Scholar] [CrossRef]
  25. Ji, X.P.; Bai, Y.P.; Du, H.B.; Wang, J.B.; Zhou, L. Research on the spatial quantitative evaluation and coupling coordination degree of ecological carrying capacity in Gansu Province. Acta Ecol. Sin. 2017, 37, 5861–5870. [Google Scholar]
  26. Shen, W.; Lu, F.; Qin, Y.; Xie, Z.; Li, Y. Analysis of temporal-spatial patterns and influencing factors of urban ecosystem carrying capacity in urban agglomeration in the middle reaches of the Yangtze River. Acta Ecol. Sin. 2019, 39, 3937–3951. [Google Scholar]
  27. Jin, Y.; Lu, Z.; Tan, F.; Zhang, M.; Zhang, H. Assessment of ecological carrying capacity on the typical resources- based cities: A case study of Tangshan City. Acta Ecol. Sin. 2015, 35, 4852–4859. [Google Scholar]
  28. Wang, Y.; Peng, B.; Wei, G.; Elahi, E. Comprehensive evaluation and spatial difference analysis of regional ecological carrying capacity: A case study of the Yangtze River Urban Agglomeration. Int. J. Environ. Res. Public Health 2019, 16, 3499. [Google Scholar] [CrossRef] [PubMed]
  29. Wu, T.; Sang, S.; Wang, S.; Yang, Y.; Li, M. Remote sensing assessment and spatiotemporal variations analysis of ecological carrying capacity in the Aral Sea Basin. Sci. Total Environ. 2020, 735, 139562. [Google Scholar] [CrossRef] [PubMed]
  30. Jiang, C.H.; Li, G.Y.; Li, H.Q.; Jia, J.S.; Liu, B. Study about the evaluation of ecological carrying capacity in Beijing mountainous valley areas—A Case Study of Puwa Valley Region. Adv. Mater. Res. 2014, 962–965, 2061–2066. [Google Scholar] [CrossRef]
  31. He, L.P.; Chen, J.; Liu, L.P.; Ma, L.Z. Analysis on ecological footprint and ecological carrying capacity in Caohai of Dianchi Lake Catchment. Ecol. Econ. 2009, 4, 347–352+361. [Google Scholar]
  32. Ma, L.Z. Research on Ecological Carrying Capacity of Kunming City. Ph.D. Thesis, Kunming University of Science and Technology, Kunming, China, 2009. [Google Scholar]
  33. Liu, D.J.; Zhang, L.L.; Yin, F.L. Study on ecological capacity of Yuxi City based on ecological footprint. Ecol. Econ. 2012, 4, 344–347. [Google Scholar]
  34. Zhao, C.E.; Ding, W.R. Dynamic Analysis of Ecological Footprint During 2000–2010 of Kunming City. China Popul. Resour. Environ. 2013, 23, 99–102. [Google Scholar]
  35. Liu, B.Q.; Xiong, L.R.; Jiang, M.Y.; Zhang, L. Analysis of ecological carrying capacity and system coupling effect in Dianchi Lake Basin. Resour. Environ. Yangtze Basin 2015, 24, 868–875. [Google Scholar]
  36. Li, S.H.; Zhou, J.S.; Wang, J.L. Analysis of the Spatio-temporal LUCC and driving force in Fuxian Lake watershed from 1974 to 2014. Remote Sens. Nat. Resour. 2017, 29, 132–139. [Google Scholar]
  37. Yi, D. GIS Application of Soil Erosion Estimation and Hydrological Simulation in Xingyun Lake Basin. Ph.D. Thesis, Kunming University of Science and Technology, Kunming, China, 2017. [Google Scholar]
  38. Dong, Q. Studies on land use changes and ecological security assessment of Qilu Lake Basin of Plateau. Ph.D. Thesis, Beijing Forestry University, Beijing, China, 2009. [Google Scholar]
  39. Liu, Y.L.; Zhang, E.L.; Liu, E.F.; Wang, R.; Zhou, Q.C. TOC and black carbon records in sediment of Yangzong, Yunnan Province under the influence of human activities during the past century. J. Lake Sci. 2017, 29, 1018–1028. [Google Scholar]
  40. Xiang, Z.Y.; Zou, X.L.; Chen, J.P. Construction of ecological environment evaluation index system of Ningbo combined with geographical conditions monitoring. Bull. Surv. Mapp. 2018, 98–103. [Google Scholar]
  41. Xu, H.Q. A remote sensing index for assessment of regional ecological changes. China Environ. Sci. 2013, 33, 889–897. [Google Scholar]
  42. Wang, Z.X. Spatio-Temporal Pattern of Ecological Security in Chongqing Based on GIS Grid Model. Ph.D. Thesis, Chongqing Normal University, Chongqing, China, 2019. [Google Scholar]
  43. Nan, Y.; Ji, Z.; Feng, H.; Zhang, C. On Eco-security evaluation in the Tumen River region based on RS&GIS. Acta Ecol. Sin. 2013, 33, 4790–4798. [Google Scholar]
  44. Renard, K.G. Predicting Soil Erosion by Water: A Guide to Conservation Planning with the Revised Universal Soil Loss Equation (RUSLE); United States Department of Agriculture: Washington, DC, USA, 1997.
  45. Wu, Y.P.; Xie, Y.; Zhang, W.B. Comparison of different methods for estimating average annual rainfall erosivity. J. Soil Water Conserv. 2001, 15, 31–34. [Google Scholar]
  46. Ma, L.C.; Wang, J.L.; Li, S.H.; Zhou, J.S.; Jin, B.X. Remote sensing monitoring of soil erosion in Fuxianhu Lake Basin. Res. Soil Water Conserv. 2016, 23, 65–70+76. [Google Scholar]
  47. Niu, W.Y. Theoretical Geography; The Commercial Press: Beijing, China, 1992. [Google Scholar]
  48. Wang, M.T. Decision-making method of deviation and mean square deviation of weight determination in multi-index comprehensive evaluation. China Soft Sci. 1999, 8, 100–101,107. [Google Scholar]
  49. Saaty, T.L. The Analytic Hierarchy Process; McGraw-Hill: New York, NY, USA, 1980. [Google Scholar]
  50. Ma, L.P. Analytic Hierarchy Process; Beijing Statistics Press: Beijing, China, 2000; pp. 38–39. [Google Scholar]
  51. Wang, J.F.; Xu, C.D. Geo-detector: Principle and prospect. Acta Geogr. Sin. 2017, 72, 116–134. [Google Scholar]
  52. Xiang, Y.Y.; Meng, J.J. Research and application advances in ecological carrying capacity. Chin. J. Ecol. 2012, 31, 2958–2965. [Google Scholar]
  53. Pan, J.H.; Dong, L.L. Comprehensive evaluation of ecosystem quality in the Shule River basin, Northwest China from 2001 to 2010. Chin. J. Appl. Ecol. 2016, 27, 2907–2915. [Google Scholar]
  54. Ma, X.; Peng, S.; Lin, C.; Lin, Z.; Zhou, Y. Study on ecological vulnerability of Dianchi Lake Basin based on GIS-Based principal component analysis. IOP Conf. Ser. Mater. Sci. Eng. 2020, 730, 012056. [Google Scholar] [CrossRef]
  55. Nong, L.P.; Wang, J.L. Dynamic monitoring of ecological environment quality in Kunming based on RSEl model. Chin. J. Ecol. 2020, 39, 2042–2050. [Google Scholar]
  56. Qiu, Y. Study on Comprehensive Evaluation and Optimized Path of Resource and Environmental Carrying Capacity in Yunnan Province. Ph.D. Thesis, Yunnan University of Finance and Economics, Kunming, China, 2020. [Google Scholar]
  57. He, S.L.; Wang, J.L.; Jiao, Y.M.; Zhou, J.C.; Nong, L.P.; Zhu, H. Resource and Environmental Carrying Capacity Evaluation Analysis under the Perspective of Territory Development Planning—A Case Study of Kunming City. Chin. J. Agric. Resour. Reg. Plan. 2022, 43, 119–128. [Google Scholar]
  58. Liu, G.; Wang, J.; Li, S.; Li, J.; Duan, P. Dynamic evaluation of ecological vulnerability in a lake watershed based on RS and GIS technology. Pol. J. Environ. Stud. 2018, 28, 1785–1798. [Google Scholar] [CrossRef] [PubMed]
  59. Chen, Y.; Wang, J. Ecological security early-warning in central Yunnan Province, China, based on the gray model. Ecol. Indic. 2020, 111, 106000. [Google Scholar] [CrossRef]
  60. Zhu, H.; Wang, J.L.; Cheng, F.; Deng, H.; Zhang, E.W.; Li, Y.X. Monitoring and evaluation of eco-environmental quality of lake basin regions in Central Yunnan Province, China. Chin. J. Appl. Ecol. 2020, 31, 1289–1297. [Google Scholar]
  61. Qu, X.Q.; Liu, M.; Li, C.L.; Hu, Y.M.; Yin, H.Y.; Qi, L. Review of the research on ecological carrying capacity evaluation methods. J. Meteorol. Environ. 2019, 35, 113–119. [Google Scholar]
  62. Zhao, D.S.; Guo, C.Y.; Zheng, D.; Liu, L.; Wu, S.H. Review of ecological carrying capacity. Acta Ecol. Sin. 2019, 39, 399–410. [Google Scholar]
  63. Li, Y.X.; Li, S.H.; Peng, S.Y. Temporal and spatial evolution of NDVI and its response relation with the climate in the Nine Plateau Lake Basins of Yunnan Province. Res. Soil Water Conserv. 2020, 27, 192–200. [Google Scholar]
  64. Tao, W.C.; Wang, K.L.; Chen, H.S.; Zhang, M.Y. Impact of the project on the ecological carrying capacity of Dongting Lake. Chin. J. Eco-Agric. 2007, 15, 155–160. [Google Scholar]
  65. Zheng, J.P. Research on the construction of ecological civilization in Kunming City. J. Yunnan Prov. Comm. Sch. CPC 2014, 16, 121–123. [Google Scholar]
  66. Gao, Y.Q. Discussion on development status and strategy of forestry in the New District of Central Yunnan. For. Inventory Plan. 2015, 40, 88–91. [Google Scholar]
  67. Lin, X. Yuxi City carried out five major projects to promote the construction of ecological civilization. Yunnan Forestry. 2014, 35, 42–43. [Google Scholar]
  68. Dong, Y.X.; Chen, J.; Li, Y.Q.; He, L.P.; Zhang, X.M. Kunming plan of ecological infrastructure construction. Environ. Sci. Surv. 2008, 27, 20–22. [Google Scholar]
  69. Pu, F.; Tao, Y.H. Research on the construction of ecological civilization in Yuxi City. J. Yunnan Prov. Comm. Sch. CPC 2014, 16, 129–132. [Google Scholar]
  70. Zhang, Y.; Zhang, X.L.; Cai, H.S. Temporal and spatial evolutions and its driving factors of ecological vulnerability in Wan’an county of Jiangxi Province based on Geogdetector. Bull. Soil Water Conserv. 2018, 38, 207–214. [Google Scholar]
Figure 1. Location of FLBOCYP.
Sustainability 15 14442 g001
Figure 2. Average ecological carrying capacities of five lake basins in Yunnan Province, China, from 2000 to 2018.
Sustainability 15 14442 g002
Figure 3. Categories of ecological carrying capacity within Yunnan Province, China, from 2000 to 2018.
Sustainability 15 14442 g003
Figure 4. Proportions of areas of five lake basins in Yunnan Province, China, falling within the different categories of ecological carrying capacity from 2000 to 2018.
Sustainability 15 14442 g004
Figure 5. The proportion of area falling under each category of ecological carrying capacity for each lake basin within Yunnan Province, China, for the years 2000, 2005, 2010, 2015, and 2018.
Sustainability 15 14442 g005
Figure 6. Spatial distribution of changes to ecological carrying capacity in five lake basins in Yunnan Province, China, from 2000 to 2018.
Sustainability 15 14442 g006
Figure 7. Aggregation states of local spatial autocorrelation in the ecological carrying capacity of five lake basins within Yunnan Province, China, from 2000 to 2018.
Sustainability 15 14442 g007
Table 1. Overview of each lake and its basin examined within the current study in Yunnan Province, China.
Lake NameBasin Overview
Dian LakeThe largest freshwater lake in Yunnan Province, with a water area and basin area of 309.5 km2 and 2920 km2, respectively. The basin is the most densely populated area in Kunming, which also has the most intense human activities and the most developed economy.
Fuxian LakeThis is a fault lake and is the second-largest deep-water freshwater lake in China, with an average water depth of 95.2 m and a basin area of 674.69 km2. Agriculture in the basin is dominated by planting crops (grain, flue-cured tobacco, rape, etc.), whereas the main industries are phosphorous chemicals, building materials, food processing, and aquatic products [36].
Xingyun LakeThis lake is in the Jiangchuan District of Yuxi City and is a plateau fault lake with a water area and basin area of 34.71 km2 and 371.70 km2, respectively. The basin hosts intensive agriculture, with the main food crops being rice, corn, and wheat, whereas the main cash crops are flue-cured tobacco, vegetables, and flowers [37].
Qilu LakeThis lake is in Tonghai County of Yuxi City and is a fault lake with a water area and basin area of 36.95 km2 and 354.2 km2, respectively. Agriculture is dominated by production of food crops, cash crops include flue-cured tobacco, and the main industries revolve around pork and vegetable processing [38].
Yangzong LakeThe basin of this lake encompasses the counties of Chengjiang, Chenggong, and Yiliang. The lake is a tectonic faulted lake with a water area and basin area of 31.49 km2 and 252.7 km2, respectively. The main industries in the basin include metallurgy, thermal power, and tourism, whereas agriculture includes grain and flue-cured tobacco [39].
Table 2. Data types used in the present study and their sources.
NumberType of DataSource
1Remote-sensing image data, DEM dataGeospatial Data Cloud (http://www.gscloud.cn/, accessed on 1 April 2020)
2Land-use dataResource and Environment Science and Data Center (http://www.resdc.cn/, accessed on 1 April 2020)
3Meteorological dataKunming, Qujing, Yuxi, Chuxiong, Honghe City Meteorological Bureau
4Socioeconomic statistics“Yunnan Statistical Yearbook”, “Kunming Statistical Yearbook”, “Yuxi Yearbook”, “Statistical Bulletin of National Economy and Social Development” of each city and county
5Population dataWorldPop (https://www.worldpop.org/, accessed on 28 September 2020)
6GDP dataResource and Environment Science and Data Center (http://www.resdc.cn/, accessed on 28 September 2020)
Table 3. Ecological carrying capacity evaluation index system and weight coefficient.
Criterion LayerIndicator LayerThe Mean Square Deviation Decision MethodAnalytic Hierarchy ProcessCombination Weighting Method
Ecological function elasticity
(0.4474)
Normalized difference vegetation index (X1)0.07970.03180.0557
Biological richness index (X2)0.08680.06820.0775
Ecological elasticity (X3)0.14550.06800.1068
Human disturbance (X4)0.10300.07070.0868
Land surface dryness (X5)0.01740.02900.0232
Land surface temperature (X6)0.03570.03310.0344
Soil erosion (X7)0.04500.00370.0244
Shannon diversity index (X8)0.02600.05120.0386
Resource and environmental supply capacity (0.3036)Multi-year average precipitation (X9)0.02120.03570.0285
Sunshine hours (X10)0.00630.04730.0268
Degree of relief (X11)0.01800.03640.0272
Proportion of cultivated land (X12)0.01330.06200.0376
Proportion of woodland (X13)0.01150.07610.0438
Grain yield (X14)0.02460.07960.0521
Application amount of pesticide and fertilizer (X15)0.04190.06430.0531
Output value of agriculture, forestry, animal husbandry and fishery per land (X16)0.02680.04230.0346
Socio-economic coordination
(0.2490)
Economic density (X17)0.06930.02110.0452
Population density (X18)0.09340.00860.0510
Real GDP per capita (X19)0.02750.04180.0346
The proportion of tertiary industry (X20)0.05190.03630.0441
Per capita net income of rural residents (X21)0.03240.05230.0424
Average salary of employees (X22)0.02280.04070.0317
Table 4. Evaluation indicators used in the present study and their spatialization methods.
IndexRaster Calculation MethodSource
X1, X5, X6Band calculation [41]Remote-sensing data
X2, X3, X4Land-use type assignment [42,43]Land-use data
X7RUSLE model [44,45,46]Precipitation and soil data, DEM data
X8Fragstats4.2 landscape index calculationLand-use data
X9, X10GIS spatial interpolation (ordinary kriging)Meteorological data
X11Reference calculation method [47]DEM data
X12, X13Calculation of the area proportions of different land-use types in the grid [42,43]Land-use data
X14, X15Grain production (amount of pesticides and fertilizers)/proportion of cultivated areaStatistical data
X16, X19, X20, X21, X22GIS spatial interpolation (inverse distance weight)Statistical data
X17, X18Convert projection and resamplingproduct data
Table 5. Classification of changes to ecological carrying capacity in Yunnan Province, China.
Threshold Range of Ecological Carrying Capacity ChangeChange Intensity Grade Name
<−0.10Significantly weakened
−0.10~−0.05Obviously weakened
−0.05~−0.01Slightly weakened
−0.01~0.01No change
0.01~0.05Slightly enhanced
0.05~0.10Obviously enhanced
>0.10Significantly enhanced
Table 6. Proportions of area of different lake basins in Yunnan Province, China, falling under different categories of change in the ecological carrying capacity.
PeriodBasin NameSignificant WeakenObvious WeakenSlightly WeakenNo ChangeSlightly EnhanceObvious EnhanceSignificant Enhance
2000–2005Dian Lake0.0420.45010.95951.60536.8530.0910.000
Fuxian Lake0.0000.0000.29338.87660.6250.2060.000
Xingyun Lake0.0000.0000.17945.64754.1250.0490.000
Qilu Lake0.0000.0001.98161.27536.6590.0840.000
Yangzong Lake0.0000.0001.81463.74634.3820.0580.000
2005–2010Dian Lake1.1953.71314.32728.16845.8984.7881.911
Fuxian Lake0.0000.1479.03950.46639.3870.9540.007
Xingyun Lake0.1001.41917.89251.41628.1161.0230.033
Qilu Lake0.0000.04110.08047.45741.4970.9230.003
Yangzong Lake0.0000.0457.71232.37242.40614.7732.692
2010–2015Dian Lake0.7392.12016.79730.90948.4201.0150.000
Fuxian Lake0.0000.0221.14516.86877.6014.3640.000
Xingyun Lake0.0650.56418.10459.59521.6420.0300.000
Qilu Lake0.0050.33717.21255.78126.6220.0430.000
Yangzong Lake0.0130.2751.72016.88981.0260.0770.000
2015–2018Dian Lake2.8086.61817.80649.51422.9580.2010.096
Fuxian Lake0.0000.0002.73848.98348.1920.0870.000
Xingyun Lake0.0000.0006.37056.03237.5680.0300.000
Qilu Lake0.0000.0254.69846.51048.6800.0870.000
Yangzong Lake0.0000.0003.23945.93050.7790.0510.000
2000–2018Dian Lake8.1276.7819.4749.92942.54920.6672.473
Fuxian Lake0.0000.0200.2961.98443.71252.6041.384
Xingyun Lake0.3461.1296.42921.88964.8985.1610.147
Qilu Lake0.0000.2353.14416.23072.3907.9390.063
Yangzong Lake0.0000.0000.1092.10847.97838.05811.746
Table 7. Global autocorrelation coefficient and assessment of the degree of aggregation within the ecological carrying capacity of five lake basins in Yunnan Province, China, from 2000 to 2018.
YearsGlobal Spatial Autocorrelation CoefficientDistribution Status
Moran’s IZ-Scorep
20000.9637841760.2690Gather
20050.9609141761.4720Gather
20100.9635421772.3660Gather
20150.9630921771.620Gather
20180.9674121773.660Gather
Table 8. Degree to which different factors explain the spatial variation in the ecological carrying capacity of five lake basins in Yunnan Province, China, from 2000 to 2018.
IndexCodename20002005201020152018
Normalized difference vegetation indexX10.1140.1310.2390.2860.337
Biological richness indexX20.6860.7280.7730.8210.873
Ecological elasticityX30.7130.7430.7810.8290.880
Human disturbanceX40.4530.5010.5850.6600.735
Land surface drynessX50.0540.0760.1040.0880.092
Land surface temperatureX60.1270.1400.1500.2130.272
Soil erosionX70.0890.1250.1360.2390.220
Shannon diversity indexX80.0030.0040.0040.0020.051
Multi-year average precipitationX90.1270.0460.1240.1310.078
Sunshine hoursX100.1200.0900.0760.0370.139
Degree of reliefX110.3120.3280.3640.4520.492
Proportion of cultivated landX120.3280.2960.3420.2360.178
Proportion of woodlandX130.6790.6940.7360.7620.793
Grain yieldX140.1240.1380.1730.1040.063
Application amount of pesticide and fertilizerX150.1620.1480.1840.1220.064
Output value of agriculture, forestry, animal husbandry, and fishery per landX160.0590.0140.0830.0750.048
Economic densityX170.2350.1950.1080.0990.295
Population densityX180.0730.1020.0930.1220.186
Real GDP per capitaX190.1560.1370.1480.1190.119
The proportion of tertiary industryX200.1930.2010.1460.0920.092
Per capita net income of rural residentsX210.0900.0950.0980.1200.174
Average salary of employeesX220.0870.0670.1230.1450.154
Table 9. The q-value of the interaction detection results in 2018 (partial).
X1X2X3X4X5X6X7X8X9X10
X10.337
X20.8780.873
X30.8850.8880.880
X40.7610.8800.8860.735
X50.4150.8780.8840.7620.092
X60.4120.8810.8870.7730.3000.272
X70.4250.8760.8810.7610.2740.3950.220
X80.4300.8810.8850.7470.1920.3810.3300.051
X90.3810.8810.8870.7490.1780.3350.2960.1720.078
X100.4120.8910.8970.7610.2320.3720.3160.2210.2430.139
Disclaimer/Publisher’s Note: The statements, opinions and data contained in all publications are solely those of the individual author(s) and contributor(s) and not of MDPI and/or the editor(s). MDPI and/or the editor(s) disclaim responsibility for any injury to people or property resulting from any ideas, methods, instructions or products referred to in the content.

